simulation model to investigate flexible workload ...orca.cf.ac.uk/80671/1/simulation model to...
TRANSCRIPT

Dublin Institute of TechnologyARROW@DIT
Conference papers School of Marketing
2009-12-15
Simulation Model to Investigate Flexible WorkloadManagement for Healthcare and ServicescapeEnvironmentMichael ThorwarthDublin Institute of Technology, [email protected]
Paul HarperDublin Institute of Technology, [email protected]
Amr ArishaDublin Institute of Technology, [email protected]
Follow this and additional works at: http://arrow.dit.ie/buschmarcon
Part of the Business Administration, Management, and Operations Commons, and the OtherOperations Research, Systems Engineering and Industrial Engineering Commons
This Conference Paper is brought to you for free and open access by theSchool of Marketing at ARROW@DIT. It has been accepted for inclusionin Conference papers by an authorized administrator of [email protected] more information, please contact [email protected],[email protected].
This work is licensed under a Creative Commons Attribution-Noncommercial-Share Alike 3.0 License
Recommended CitationArisha, A., Thorwarth, M., Harper, P.: Simulation Model to Investigate Flexible Workload Management for Healthcare andServicescape Environment. Winter Simulation Conference, 2009.

Proceedings of the 2009 Winter Simulation Conference M. D. Rossetti, R. R. Hill, B. Johansson, A. Dunkin and R. G. Ingalls, eds.
SIMULATION MODEL TO INVESTIGATE FLEXIBLE WORKLOAD MANAGEMENT FOR HEALTHCARE AND SERVICESCAPE ENVIRONMENT
Michael Thorwarth Amr Arisha
Paul Harper
School of Management School of Mathematics Dublin Institute of Technology Cardiff University
Dublin, D2, Ireland Cardiff, Wales CF24 4AG, U.K.
ABSTRACT
High demand and poor staffing conditions cause avoidable pressure and stress among healthcare personnel which results in burnout symptoms and unplanned absenteeism which are hidden cost drivers. The work environment within an emergency department is commonly arranged in a flexible workload which is highly dynamic and complex for the outside observer. Us-ing detailed simulation modeling within structured modeling methods, a comprehensive model to characterize the nurses’ time utilization in such flexible dynamic workload environment was investigated. The results have been used to derive a ge-neralized analytic expression that describes certain settings that lead to an instable queuing system with serious consequences for the healthcare facility. Thus decision makers are hence equipped with a tool which allows identifying and preventing such conditions that affect service quality level.
1 INTRODUCTION
Simulation is well positioned as an effective mean to evaluate the impact of changes in strategy and/or process on system per-formance through testing “what-if” scenarios either in industrial or servicescape applications (Cochran and Bharti 2006). A growing number of simulation software packages has offered the modellers more simulation capabilities to extend their mod-eling functions and enhance optimization process. Simulation applications tend to focus on manufacturing and production facilities whereas dynamics of servicescapes, such as flexible workload of employees, have got less attention. This flexible workload is usually described as “multitasking” – not to be mistaken with the actual term multitasking which specifies more than one task to be computed at the same time. In this context, flexible workload describes that one worker deals with sev-eral different tasks in a flexible manner within a given timeframe.
An example of flexible workload in the servicescape is emergency departments in hospitals, where nurses deal with sev-eral patients within the department at the same timeframe. During periods of high patient demands, the work environment is stressful and burnout symptoms are likely common to happen. The rate of psychological ill to psychological health varied from 17% to 33% among healthcare workers in the UK (Michie and West 2004). One major concern of healthcare providers is the quality of service delivered; high patient demand causes a workload resulting in high utilization of staff which has a significant negative impact on error rates. It is therefore mandatory for healthcare managers and administrative personnel to identify under what conditions their processes should run in to provide a safe healthy environment. However, this flexible workload environment appears complex and highly dynamic to the observer. Simulation modeling attempts to mimic such work environments, require a logistical overhead that adds this special feature to the initial package of available commercial packages. Very little research has been conducted to investigate the impact of flexible workload on the overall system per-formance. Therefore an investigation within a simulation of an emergency department is undertaken in order to describe the impact of the number of staff to the overall utilization within a process chain that incorporates flexible workload.
The model developed offers insights in the dynamics of a flexible workload process chain and demystifies its complexity for the benefit of an increased transparency and better understanding of the mechanism of flexible workload process chains. This paper aims to demonstrate how simulation can be used in order to find a mathematical description of complex and dy-namic systems that are difficult to capture analytically in an algebraic manner. Hence the mathematical description is pre-sented in an equation that shows how the utilization of a flexible workload behaves in dependence of amount of staff and pa-tient arrival time. In this paper a brief description of the flexible workload process within the emergency department in one
1946978-1-4244-5771-7/09/$26.00 ©2009 IEEE

Thorwarth, Arisha and Harper
of the university hospitals in Dublin, Section 2, is followed by the methodology used with a detailed review of the staffing and absenteeism which elaborates the vicious circle of burnout among nurses. Having defined the objectives and results of the simulation model in Section 3, the development of a flexible workload modeling approach to address the issue is then de-scribed in Section 3. The results and discussions confirming the validity of the model are outlined in Section 4 before the conclusions of a study are presented.
2 BACKGROUND
Flexible workload management can be observed in high demanding working areas such as emergency departments where nurses and care personnel deal with several patients at a time. The benefits of this flexible scheduling strategy are:
• Flexible work allocation • Spontaneous adjustment of work force to demand Flexible workload management is a daily routine and very common in hospital environments, for example when the pa-
tient is getting an x-ray, the nurse or porter is free to handle the next task or patient. At times with a high patient demand, this work arrangement can lead to stressful conditions whilst burnout symptoms are likely to happen. Burnout – a stress symptom – is personally experienced as frustration, sense of failure or insufficient personal and vacation time (Sherman et al., 2006). It is also described as work-related emotional exhaustion, depersonalization, and reduced personal accomplish-ment. Studies looked at the effect and cause of burnout symptoms among healthcare personnel had found a connection be-tween burnout and spontaneous absenteeism(Unruh, Joseph, and Strickland 2007; Hackett, Bycio, and Guion 1989; Felton 1998; Shamian et al. 2003; Diez-Pinol et al. 2008; Linzer et al. 2001). In Canada for example nurses had recorded the high-est absenteeism rate among all employees in 1999 and created an economic loss of more than 16 million nursing hours due to injury and illness (Shamian et al. 2003). Unplanned absenteeism creates additional stress for remaining staff as the workload increases unless a substitution comes up. The substitute usually works for several other units and may not be as experienced to the particular work environment as the replaced staff. The need to maintain such an external staff pool adds further costs to the unit and lowers the quality of service. Investigations among high registered nurses show that high patient load is re-lated to higher restraint use and more patient deaths (Unruh, Joseph, and Strickland 2007). Another study in Australia has linked high patient demand with low healthcare quality indicators. It identifies an increase in patient mortality during ob-served periods of overcrowding within the emergency department (Richardson 2006).
A high mortality indicator is probably the worst imaginable drawback that comes along with unadjusted staffing levels. Other unwanted side effects of unadjusted staffing levels are higher treatment error rates, sick pay due to absenteeism, or even compensation payment due to physical injuries. An increase of absenteeism level implicates further negative effects on staff spirit and encounters higher administrational costs, additional workload, and stress (Honkonen et al. 2006). Thus, this additional stress could lead to further burnouts and probably cause more absenteeism. In order to break this vicious circle it is important to identify the optimum utilization level for staff that allows operating in satisfactory conditions but without con-suming its resources. Managers responsible of arranging the work environment for healthcare personnel have therefore to consider the aforementioned issues and work on improving conditions.
Resource scheduling issues are one of the domains that simulation modeling has excelled in handling due to its flexible approach to examine various strategies. Simulation optimization has been successfully applied in many studies (e.g. Bard and Purnomo 2005; Conteno et al.2003; Kim and Horowitz 2002; Rohleder and Klassen 2002; Wijewickrama and Takakuwa 2005; Yeh and Lin 2007). Those studies focused on the shift arrangement in order to optimize the patient flow or treatment costs or focus on finding the optimum utilization of healthcare units considering patient waiting times. The latter domain is more difficult to investigate as it significantly varies from case to case. For example; a simulation model of an operating room identified that its optimum efficiency can be achieved between 85 to 90 per cent (Tyler, Pasquariello, and Chen 2003). However, this result cannot be generalized and certainly not be transferred to other operating rooms or other units. Emer-gency departments - demand driven units – on the other hand need more work to identify their optimum utilization under all various constraints and limitations.
Simulation modellers have tried to achieve an accurate representation of healthcare units in general and emergency de-partments in particular. Owning the fact that these models of emergency departments tend to be larger and more complex, handling is more difficult than in the conventional factory world view (Hay, Valentin, and Bijlsma 2006). Considering the fact that the complexity of the factory world view should not be underestimated (Arisha and Young 2004), one might under-stand that developing an holistic model of healthcare units requires a lot of effort. In order to offer a decision support model for managers, a generic model to consider flexible workload among nurses is developed and verified. This model explains the effects of overstaffing and understaffing in dependence of the arrival rate. Results identify a range of parameters where this system tends to get instable with the consequence of long waiting times and / or high workload for staff. Instable condi-
1947

Thorwarth, Arisha and Harper
tions are especially undesirable when a high quality of service is intended yet limited due to stressed staff and long waiting lines.
3 METHODOLOGY
A detailed simulation modeling for an emergency department is developed, with an objective to focus on the allocation and utilization of its resources. The emergency department is placed in a university hospital which serves about 50,000 patients annually. Emergency departments in Ireland provide a set of services including primary, secondary, and tertiary care. There-fore the emergency department faces a very high demand. Government funds are not adequate to solve all the issues of the emergency departments, which can be retrieved form the emergency task force report that describes symptoms such as that hospitals are not able to provide the necessary amount of beds which results that emergency patients remain significant peri-ods in the emergency department (Health Service Executive (HSE) 2007). Decision makers therefore strive for solutions that helps to identify their bottlenecks and optimize their patient flow.
During the analysis phase, the nurses complained about their high workload and stress level caused by what they call “multitasking”. Their work can be best described as spontaneous allocation of wherever their work is needed mostly. The emergency department is identified as set of several integrated connected processes with the focus sets on the staff. It also features a high dynamic alternating environment. A model is derived from the description and the observations (see Section 3.1). This alternating of staff between the processes can be best modeled with discrete event simulation approach due to the flexibility and robustness of the approach. However, a logistic overhead is necessary in order to mimic the flexible workload allocation. In order to understand the mechanism of a flexible workload an algebraic expression is found that allows a further insight into the dependencies of over- and understaffing in relation to the patient arrival time. This driven expression is the first step in the optimization process that aims to achieve the equilibrium between staffing and service quality level.
This paper exhibits a comprehensive application of simulation modeling and its role to analyze a complex dynamic envi-ronment. It also describe analytically the relationship between various entities in the uncertain system. This analytical model delivers three benefits: (i) an increased understanding of the system; (ii) it supports an optimization process; and (iii) it pro-vides healthcare decision makers with a formula that can be used to depict the staff utilization and the threshold number of staff.
3.1 Flexible Workload Model
To find a description of the utilization ρ in dependence of the inter-arrival time T and the number of available staff n the fol-lowing model is investigated to consider flexible workload management. The model as illustrated in Figure 1 is one of sev-eral process chains within a large emergency department simulation model. The model presented here is extracted from the detailed emergency department model in order to investigate the mechanisms of a flexible workload environment. The inves-tigated process chain is a one dimensional representation of a series of mi tasks that are sequentially completed by n personnel allocated in the staff pool. The parameter M describes the number of tasks aligned in the process chain. A task can only be completed by the presence of staff. That means that if no staff is available for a certain task, the patient would therefore have to wait for the next nurse to be available. To avoid blocking a staff assignment logic arranges that the furthest processed pa-tient gets the highest priority. Queues between all processes buffers all patient waits.
Figure 1: Simplified model to illustrate flexible workload of nurses.
1948

Thorwarth, Arisha and Harper An example for such a process chain: patients arrive at an arrival rate λ, after having registered and occasionally having
waited in the waiting room, the patient enters the treatment process m with M tasks (Table 1). The first task for the nurse would be to triage the patient; followed by placing the patient in the cubicle or bed and by making certain arrangements. The third task is usually to take samples of the patient as requested by the consultant or the doctor. After that, nurse arranges the requested diagnosis (guiding patient to x-ray, ct, or ultra sound). The fifth task is designated to pay attention to patient’s needs, while diagnosis and results are to come. Finally, nurse has to arrange the patients’ referral.
Table 1: Example for nurses’ tasks in an flexible workload environment.
Task number i Description of the task mi for nurses for patient j
1 Triage patient 2 Place patient in cubicle / bed 3 Take samples (blood, tissue, etc as requested) 4 Arrange diagnosis (x-ray, ultra sound, ct, etc) 5 Pay attention to patient needs 6 Make arrangements for referral
3.2 Simulation Results
Simulation experiments of the above described model deliver the graph displayed in Figure 2. The patient inter-arrival time is set to be Poisson distribution that was drawn from the hospital records. The overall utilization was recorded taking into consideration a warm-up period. The process service times of the tasks are normal distributed.
Figure 2: Simulation results showing overall resulting utilization ρ (n,T) of a flexible workload environment, in dependency of the patient inter-arrival time T and the number of staff available n.
The overall utilization ρ (n,T) is measured in dependence of the available number of staff n and the inter-arrival time T, where the inter-arrival time T is the reciprocal of the arrival rate λ. The Figure 2 displays some trends, like linear areas, a pla-teau and a hyperbola area. In order to analyze these trends the overall utilization is subdivided into its components (utiliza-tion of staff and utilization of activity).
1949

Thorwarth, Arisha and Harper
3.3 Analytical Model
A combination of several dependencies that are influencing the overall utilization was shown in Figure 2. In order to derive a function that is able to describe the flexible workload environment, the result is investigated and interpreted by its compo-nents. The main focus is on the available number of staff at a certain arrival time slot t (Figure 3).
Figure 3: The simulation result (blue line) and the estimated calculated model (black line) for the overall utilization ρ (n) for a specific arrival time t in dependence of the available staff n.
The result of the simulation experiments for a specific inter-arrival time t is illustrated in the blue dotted line. It is obvi-
ous that even though the statistical randomness causes some deviations, a trend is observable. In order to describe the trend, the components of the overall utilization should be considered. The overall utilization ρ (n) is a combination of the utilization of staff ρn (n) and the utilization of the tasks itself ρa (n), here expressed as activity in order to emphasize that it is an excep-tional process which is depended on the participating staff member. Figure 4 illustrates the component for the utilization of the activity ρa (n).
Figure 4: The simulation result (blue line) and the estimated calculated model (black line) for the activity utilization ρa (n), which is a component of the overall utilization ρ (n).
1950

Thorwarth, Arisha and Harper The blue dotted line displays average utilization ρa (n) of the activities. A linear trend is observable for the understaffed
condition where fewer staff (n) is available for tasks (M). In the case of understaffing (n < M), some activities remain idle waiting for staff. Therefore, the utilization ρa (n) is limited to the number of available staff in the understaffed condition. Whereas in an overstaffed condition (n ≥ M), a surplus of staff causes a permanent utilization for the activity which is then only limited to the ratio of the arrival rate λ and the service time µ. These observations can be summarized in the following equation, which calculates the utilization of the activity as:
, for and
( )
, for or
a
n nn M
M Mn
nn M
M
λ
µρ
λ λ
µ µ
≤ ≤
=
> >
(1)
Equation (1) is valid for λ ≤ µ otherwise the utilization would be equal to 1, which indicates an instable condition that
causes longer queues (Law and Kelton 2000). The term n
M
λ
µ≤ limits the utilization to the ratio of arrival time to service
time in case that the staff to process ratio is of larger value. The upper part of the equation (1) addresses the condition of un-derstaffing, whereas the lower part expresses the condition of overstaffing, which depends on the arrival time to service time ratio, where the activities are saturated with staff. Once equation (1) is elaborated in order to consider the inter-arrival time,
λ is substituted by 1
T and the utilization of activity ρa (n) can therefore be written as:
1 , for and
( , )1 1
, for or
a
n nn M
M M Tn T
nn M
T M T
µρ
µ µ
≤ ≤
=
> >
(2)
Utilization of activities ρa (n,T) in dependence of inter-arrival time T and the amount of staff is shown in Figure 5. The
threshold between over- and understaffing can easily be observed.
Figure 5: Graphical representation of equation (2), which illustrates the activity utilization ρa (n,T) in dependence of interar-rival time T and number of available staff n.
1951

Thorwarth, Arisha and Harper The utilization of staff ρs (n) is the other component that is included in the overall utilization of the flexible workload en-
vironment ρ (n) (figure 3). The Figure 6 is directly obtained from the simulation, measuring the utilization of staff being out-side of the resource pool.
Figure 6: The simulation result (blue line) and the estimated calculated model (black line) for the staff utilization ρs (n) for a specific arrival time t in dependence of the available staff n.
The measurement (Figure 6) shows that the utilization of staff is independent of the arrival time λ and of the service time
µ, because the simulation result (blue line) is equivalent to the estimated calculated utilization of staff (black line). It can be seen that in case of understaffing (n < M) the utilization of staff is equals 1. This indicates that the staff is fully occupied with high workload. In the case of staff number is even to the number of tasks (n = M), staff will not be interrupted or alter-nating between tasks. Once the process chain is overstaffed (n ≥ M + 1), the workload is decreased by every additional staff member. This relationship is summarized as a function for the utilization of staff:
1 , for
( ) ( 1), for s
n Mn M
n Mn
ρ≤
= +>
(3)
Equation (3) is valid for all λ as the utilization is directly obtained from simulation model results. Having derived the
mathematical expressions for both components (1) and (2) of the overall utilization ρ (n), displayed in the graph of Figure 3 can be calculated by multiplying the utilization of staff with the utilization of activities:
( ) ( ) * ( )a sn n nρ ρ ρ= (4)
This delivers the black line in Figure 3, that is equivalent to the observed trend, which has initially been presumed. The
equation in (4) can easily be extended to incorporate the inter-arrival time by considering the equations (2) and (3):
( , ) ( , ) * ( , )a sn T n T n Tρ ρ ρ= (5) Calculating the resulting utilization ρ (n, T) according to equation (5) delivers the graph displayed in Figure 7.
1952

Thorwarth, Arisha and Harper
Figure 7: Calculated utilization ρ (n,T) according to the mathematical expression (5) considering the utilization of staff ρs (n ) and activity ρa (n).
Comparing Figure 7 with Figure 2, it is obvious that the differences are ultimately due to the variability caused by ran-dom arrival rates. By assuming constant arrival rate and constant service rate, the utilization plot contains no fuzziness (Fig-ure 7). This can be modified by incorporating the corresponding statistical distributions for the arrival time λ and the service time µ in equations (2 and 3).
3.4 Results Analysis
Although an insignificant variation is shown due to the variance of the patient arrival time and service time, a pattern can be obtained which is hence described in equation (5) with the considerations of its components in equations (2 and 3). Using equation (5), outcomes showed similarity to the initial measurements (Figure 7) where the hyperbola axis are defined by the inter-arrival T and the number of available staff n (Figure 6). The plateau marks the area where ρ (n ,T) = 1 with the inter-arrival time is set T ≤ µ and the number of available staff is less or equal to the number of tasks (n ≤ M). The slope on the left side of the plateau (n < M) marks the area where the system tends to get instable. The two graphs showed that high utiliza-tion conditions are likely to happen when the available staff number n is less or equal the number of tasks M and the arrival time is less than the service time. To avoid this, the service time should either be less than the arrival time or an excess num-ber of staff is required. As service time are rarely manipulable in healthcare, it is important to consider the number of staff-ing as a variable.
4 DISCUSSION
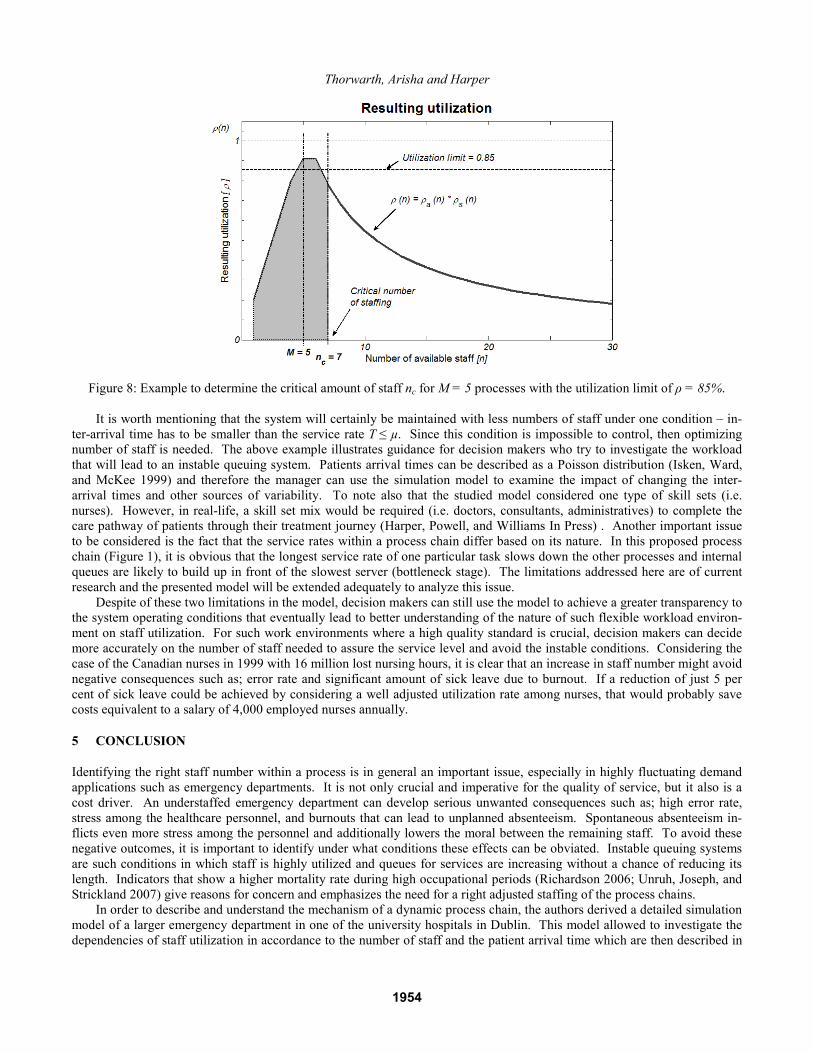
Equation (5) represents the utilization of staff that is working in a flexible workload environment and the area of high utiliza-tion is easy obtained due to the mathematical description (ρ (n,T) = 1) as shown in Figure 7. This formula shows that the system in this critical area tends to get instable and long queues are likely to develop. High utilization is also a reason for an increased error rate which should be prevented especially in critical environments such as healthcare. The following example in Figure 8 shows how to avoid severe staffing conditions: assume the number of tasks within a process chain is M = 5 and inter-arrival time is T = 1.1h. As mentioned earlier and based on real observations; the error rate increases dramatically at an overall utilization level of 85 per cent within our assumed example. Therefore the function should not exceed 85 per cent and that is guaranteed at a staffing level of n ≥ 7. This example shows that the proposed model can be used to determine the op-timum number of staff to achieve the required utilization taking in to account the uncertainty of the arrival rate λ. Decision makers can also use the model to justify the required number of staff in order to obtain quality service along with an accept-able utilization level of their staff.
1953
Thorwarth, Arisha and Harper
Figure 8: Example to determine the critical amount of staff nc for M = 5 processes with the utilization limit of ρ = 85%. It is worth mentioning that the system will certainly be maintained with less numbers of staff under one condition – in-
ter-arrival time has to be smaller than the service rate T ≤ µ. Since this condition is impossible to control, then optimizing number of staff is needed. The above example illustrates guidance for decision makers who try to investigate the workload that will lead to an instable queuing system. Patients arrival times can be described as a Poisson distribution (Isken, Ward, and McKee 1999) and therefore the manager can use the simulation model to examine the impact of changing the inter-arrival times and other sources of variability. To note also that the studied model considered one type of skill sets (i.e. nurses). However, in real-life, a skill set mix would be required (i.e. doctors, consultants, administratives) to complete the care pathway of patients through their treatment journey (Harper, Powell, and Williams In Press) . Another important issue to be considered is the fact that the service rates within a process chain differ based on its nature. In this proposed process chain (Figure 1), it is obvious that the longest service rate of one particular task slows down the other processes and internal queues are likely to build up in front of the slowest server (bottleneck stage). The limitations addressed here are of current research and the presented model will be extended adequately to analyze this issue.
Despite of these two limitations in the model, decision makers can still use the model to achieve a greater transparency to the system operating conditions that eventually lead to better understanding of the nature of such flexible workload environ-ment on staff utilization. For such work environments where a high quality standard is crucial, decision makers can decide more accurately on the number of staff needed to assure the service level and avoid the instable conditions. Considering the case of the Canadian nurses in 1999 with 16 million lost nursing hours, it is clear that an increase in staff number might avoid negative consequences such as; error rate and significant amount of sick leave due to burnout. If a reduction of just 5 per cent of sick leave could be achieved by considering a well adjusted utilization rate among nurses, that would probably save costs equivalent to a salary of 4,000 employed nurses annually.
5 CONCLUSION
Identifying the right staff number within a process is in general an important issue, especially in highly fluctuating demand applications such as emergency departments. It is not only crucial and imperative for the quality of service, but it also is a cost driver. An understaffed emergency department can develop serious unwanted consequences such as; high error rate, stress among the healthcare personnel, and burnouts that can lead to unplanned absenteeism. Spontaneous absenteeism in-flicts even more stress among the personnel and additionally lowers the moral between the remaining staff. To avoid these negative outcomes, it is important to identify under what conditions these effects can be obviated. Instable queuing systems are such conditions in which staff is highly utilized and queues for services are increasing without a chance of reducing its length. Indicators that show a higher mortality rate during high occupational periods (Richardson 2006; Unruh, Joseph, and Strickland 2007) give reasons for concern and emphasizes the need for a right adjusted staffing of the process chains.
In order to describe and understand the mechanism of a dynamic process chain, the authors derived a detailed simulation model of a larger emergency department in one of the university hospitals in Dublin. This model allowed to investigate the dependencies of staff utilization in accordance to the number of staff and the patient arrival time which are then described in
1954

Thorwarth, Arisha and Harper
equation (5) under the consideration of the constraints in equation (2) and (3). These equations emulates the dynamics in such changing work environment by simulating flexible workload management. Results show that two conditions should be avoided; first, the longest service rate within a process chain should not exceed the arrival time ratio. Secondly, staffing has not to be lower or equal to the amount of tasks within a process. If these two conditions to happen, the system will be de-scribed as instable system resulting in long queues and high utilization of staff. A challenge to decision makers will always be; how to develop certain balance to maintain satisfactory service quality and avoid staff over utilization. The model devel-oped aimed to offer a decision support tool to decision makers by providing insights on staff utilization under different work schedules.
During the design of a healthcare unit one should bear in mind that providing healthcare is not producing health. Health-care personnel are obliged to their patients, who have human needs and have no understanding for stop watches while they need some attention. Providing healthcare personnel with such freedom to care for their patients enables a threefold win situation: the patient gets better care and advices, stress among personnel is reduced as well as unexpected absenteeism and its negative consequences can be lowered as costs and lower quality of care. Avoiding stressful working conditions are there-fore a worthwhile investment.
ACKNOWLEDGEMENTS
The authors would like to express their acknowledgements for our partner hospital in Dublin that facilitated and supported this research with invaluable data, insights into the emergency department, and inspiration to conduct the research. Special thanks to Prof. Dr. John Ryan and Dr. Ian Callanan. The data mining and measurements for this study was kindly supported by Mr. Ayman Tobail.
REFERENCES
Arisha, A., and P. Young. 2004. Intelligent simulation-based lot scheduling of photolithography toolsets in a wafer fabrica-tion facility. In Proceedings of the 2004 Conference on Winter Simulation Conference. ed. J. Smith, B. Peters, R. G. In-galls, and M. D. Rossetti, 1935-1942 Vol. 2. Washington, D.C., United States.
Banks, J., J. S. Carson, B. L. Nelson, and D. M. Nicol. 2005. Discrete-Event System Simulation. Fourth Edition. London: Pearson Prentice Hall, Inc.
Bard, J. F., and H. W. Purnomo. 2005. Hospital-wide reactive scheduling of nurses with preference considerations. IIE Transactions 37(7): 589 - 608.
Centeno, M. A., R. Giachetti, R. Linn, and A. M. Ismail. 2003. A simulation-ILP based tool for scheduling ER staff. In Pro-ceedings of the 2003 Conference on Winter Simulation Conference: Driving Innovation. ed. P.J. Chick, D. Sanchez, D. Ferrin, and D.J. Morrice, D.J, 1930-1938. New Orleans, Louisiana, United States.
Cochran, J. K., and A. Bharti. 2006. A multi-stage stochastic methodology for whole hospital bed planning under peak load-ing. International Journal of Industrial and Systems Engineering 1(1/2): 8-36.
Diez-Pinol, M., S. L. Dolan, V. Sierra, and K. Cannings. 2008. Personal and organizational determinants of well-being at work: The case of Swedish physicians. International Journal of Health Care Quality Assurance 21(6): 598-610.
Felton, J. S. 1998. Burnout as a clinical entity--its importance in health care workers. Occupational Medicine 48(4): 237-250. Hackett, R. D., P. Bycio, and R. M. Guion. 1989. Absenteeism among hospital nurses: An idiographic-longitudinal analysis.
Academy of Management Journal 32(2): 424-453. Harper, P. R., N. H. Powell, and J. E. Williams. (In Press). Modelling the size and skill-mix of hospital nursing teams. Jour-
nal of Operational Research Society 13 May 2009 (DOI: 10.1057/jors.2009.43). Hay, A. M., E. C. Valentin, and R. A. Bijlsma. 2006. Modeling emergency care in hospitals: a paradox - the patient should
not drive the process. In Proceedings of the 2006 Conference on Winter Simulation Conference. ed. L. F. Perrone, F. P. Wieland, J. Liu, B. G. Lawson, D. M. Nicol, and R. M. Fujimoto, 439-445. Monterey, California, United States.
Health Service Executive (HSE). 2007. Emergency Department Task Force Report. Available via <http://www.hse.ie/en/Publications/HSEPublicationsNew/AcuteHospitalReportsGuidelines/EDTaskForceReport/#d.en.7030> [accessed June 2, 2007].
Honkonen, T., K. Ahola, M. Pertovaara, E. Isometsä, R. Kalimo, E. Nykyri, A. Aromaa, and J. Lönnqvist. 2006. The associa-tion between burnout and physical illness in the general population--results from the Finnish Health 2000 Study. Journal of Psychosomatic Research 61(1): 59-66.
Isken, M. W., T. J. Ward, and T. C. McKee. 1999. Simulating outpatient obstetrical clinics. In Proceedings of the 1999 Con-ference on Winter Simulation: Simulation---A Bridge to the Future - Volume 2. ed. D. T. Sturrock, G. W. Evans, P. A. Farrington, H. B. Nemhard, 1557-1563 Vol. 2. Phoenix, Arizona, United States.
1955

Thorwarth, Arisha and Harper
Kim, S.-C., and I. Horowitz. 2002. Scheduling hospital services: the efficacy of elective-surgery quotas. Omega 30(5): 335-346.
Law, A. M., and W. D. Kelton. 2000. Simulation Modelling and Analysis, New York: McGraw-Hill Education. Linzer, M., M. R. M. Visser, F. J. Oort, E. M. A. Smets, J. E. McMurray, and H. C. J. M. de Haes. 2001. Predicting and pre-
venting physician burnout: results from the United States and the Netherlands. The American Journal of Medicine 111(2): 170-175.
Michie, S., and M. A. West. 2004. Managing people and performance: an evidence based framework applied to health service organizations. International Journal of Management Reviews 5-6(2): 91-111.
Richardson, D. B. 2006. Increase in patient mortality at 10 days associated with emergency department overcrowding. Medi-cal Journal of Australia 184(5): 213-216.
Rohleder, T. R., and K. J. Klassen. 2002. Rolling Horizon Appointment Scheduling: A Simulation Study. Health Care Man-agement Science 5(3): 201-209.
Shamian, J., L. Brien-Pallas, D. Thomson, C. Alksnis, and M. S. Kerr. 2003. Nurse absenteeism, stress and workplace injury: what are the contributing factors and what can/should be done about it? International Journal of Sociology and Social Policy 23(23): 81-103.
Sherman, A. C., D. Edwards, S. Simonton, and P. Mehta. 2006. Caregiver stress and burnout in an oncology unit. Palliative & Supportive Care 4(1): 65-80.
Tyler, D. C., C. A. Pasquariello, and C.-H. Chen. 2003. Determining Optimum Operating Room Utilization. Anesth Analg 96(4): 1114-1121.
Unruh, L., L. Joseph, and M. Strickland. 2007. Nurse absenteeism and workload: negative effect on restraint use, incident re-ports and mortality. Journal of Advanced Nursing 60(9): 673-681.
Wijewickrama, A., and S. Takakuwa. 2005. Simulation analysis of Appointment Scheduling in an Outpatient Department of Internal Medicine. In Proceedings of the 2005 Conference on Winter Simulation Conference. ed. M. E. Kuhl, N. M. Steiger, F. B. Armstrong, and J. A. Joines, 2264-2273. Orlando, Florida, United States.
Yeh, J.-Y., and W.-S. Lin. 2007. Using simulation technique and genetic algorithm to improve the quality care of a hospital emergency department. Expert Systems with Applications 32(4): 1073-1083.
AUTHOR BIOGRAPHIES
MICHAEL THORWARTH, Dipl. – Ing., is a senior researcher of the 3S Group (Research unit in D.I.T specialized in com-plex systems simulation and optimization) and is currently pursuing a doctorate in Management at the Dublin Institute of Technology, Ireland. He received a Diplom in Engineering in Medical Computing and is specialized in Biomedical Engi-neering and Medical Computing which he studied at the Technical University of Ilmenau, Germany. His research interests focus on the application of discrete event simulation, process management and optimization in healthcare. His e-mail address is <[email protected]>. PAUL HARPER, Ph.D., M.Sc., B.Sc. holds the position of WIMCS (Wales Institute of Mathematics and Computational Studies) Research Chair in Operational Research. His contribution to research in simulation and healthcare modeling has been reflected by major grant income with a variety of funding sources and in 2006 he was awarded the Goodeve Medal from the UK OR Society for his co-authored paper in the Journal of the OR Society (modeling targeted screening strategies for Chlamydia). During the last four years he has been invited to guest edit six special issues for various international journals. In 2008 he was co-chair of OR50, the Golden Anniversary conference of the UK OR Society. He has worked with a number of healthcare organizations on a range of modeling topics. His e-mail address is <[email protected]>. AMR ARISHA, Ph.D. is a Manager of 3S Group (Research unit in D.I.T specialized in complex systems simulation and op-timization) and a lecturer in School of Management in Dublin Institute of Technology. He Joined D.I.T in 2005 having spent five years as a senior researcher in Dublin City University. Intel-Ireland has sponsored his research from 2000 - 2005. He received his Ph.D. in Manufacturing Engineering from Dublin City University. Dr. Arisha has published over 12 journal and international conference articles in the area of manufacturing systems simulation and scheduling. His research interests in-clude analysis and optimization of complex dynamic systems in manufacturing and service industries using stochastic simu-lation modeling, and optimization techniques. His research also includes Supply Chain Management, Operations Excellence, Project Management, Virtual Reality applications in Business Process Analysis, and Optimization for Process Improvement. He is a member in IIE, IMECH, IEI, ESE, ORS, IEEE and ASME. His e-mail address is <[email protected]>.
1956