simulation design of express sorting system example of sf ... · center is improved, flexsim...
TRANSCRIPT
CHEMICAL ENGINEERING TRANSACTIONS
VOL. 51, 2016
A publication of
The Italian Association
of Chemical Engineering Online at www.aidic.it/cet
Guest Editors: Tichun Wang, Hongyang Zhang, Lei Tian Copyright © 2016, AIDIC Servizi S.r.l.,
ISBN 978-88-95608-43-3; ISSN 2283-9216
Simulation Design of Express Sorting System - Example of SF’s Sorting Center
Fubin Pan*, Dan Yu, Mingrong Wang School of Economics and Management, Xiamen University of Technology, No.600 Ligong Road, Jimei District, Xiamen 361024, China [email protected]
Original semi-automatic sorting system of distribution center of SF Express is low in efficiency and high in error rate, cannot meet the rapid growth of SF Company’s business needs, thereby, SF plans to build a fully-automatic sorting system. However, due to large investment and high operation and maintenance cost, the fully-automatic sorting system must be designed carefully. For the purpose of checking feasibility of design program, finding out and solving bottlenecks occurred in the operation process of sorting center so that daily express processing capacity of the sorting center reaches more than 150,000 and sorting efficiency of sorting center is improved, Flexsim simulation software is applied to simulation design of the fully-automatic sorting system. After setting the system targets, designing system model and operation model and analyzing simulation result, it is thus shown that planned fully-automatic sorting system meets the design target and the program is feasible.
1. Introduction
With the rapid development of the Internet and e-commerce, both individual and institutional demands for express delivery services are increasing dramatically. After collecting expresses from consigners, couriers will send them to the nearest distribution center for centralized sorting (Chang, et al 2007). The expresses will be delivered to the destinations according to the location of consignees after sorting, or sent to the next sorting center. Thus it can be seen that express distribution center has played a very important role in the transfer process, integrating the expresses to be delivered to the same region and sending uniformly, which greatly improves the efficiency. So many express companies have set dedicated distribution centers in various regions. However, with more and more handling capacity of expresses, such problems as overstock, mistaken sorting, rough sorting and so on arise frequently. In order to improve the sorting efficiency of distribution center, reduce error rate and overstock rate, the expresses companies are trying to introduce fully-automatic sorting system. For the new logistics system to be introduced, computer simulation may be used to evaluate and identify its feasibility and efficiency (Peng and Wu, 2009). In this study, under the background that SF Express plans to reconstruct its distribution center of more than 8,000 square meters in S City, after field research and data collection, the solutions to such problems as low level of automation and high error sorting rate existing are proposed. Modeling target is established and Flexsim simulation software is used to build model, operate model and analyze data after operation. The design is constantly optimized so that model built can reach the intended target.
2. General steps of logistics system simulation
Logistics system simulation in general has the following steps: (1) System Research System research is the first step in system simulation. The research process includes understanding system structure and system procedures. (2) Determining System Simulation Target
DOI: 10.3303/CET1651077
Please cite this article as: Pan F.B., Yu D., Wang M.R., 2016, Simulation design of express sorting system - example of sf’s sorting center, Chemical Engineering Transactions, 51, 457-462 DOI:10.3303/CET1651077
457
Simulation target must be determined before the system modeled. Because of the different requirements of the system, the targets of the simulation are also different. Due to different simulation targets of system, the models to be built are different (Chen, 2014). (3) Creating a System Model System model is a description of the system, consists of model and model parameters. Model parameters are the findings of finishing on the system research. System model can be in diversified forms, such as flow diagram, written narrative, mathematical expression, chart, etc (GROSSE and GLOCK, 2014). (4) Determining Simulation Algorithm The simulation algorithm is a method of controlling the simulation clock advance and the core of system simulation. Currently, the most commonly used are event scheduling, activity scanning and process interaction. (5) Simulation Modeling Simulation model is the process of system standardization and digitization. Meanwhile, some necessary components need to be increased according to the characteristics of the computer running. The main components of simulation model are initialization module, input module, simulation clock, random number generator, state statistics counter, event table, event handling subroutine and output module, etc. (6) Running the Simulation Model Time to stop simulation needs to be determined when running the simulation model. There are generally two methods to stop: one is to determine the length of simulation time, such as 3600s; the other is to determine the number of simulation event (Moeller, 2011). The method is chosen depending on the specific conditions of simulation system. (7) Simulation Results Output There are two types of simulation output. One is the real-time online output, which is the result of the simulation stage. The other is the output of values of all variables at the end of the simulation. (8) Simulation Results Analysis, Forming Simulation Report Simulation system analysis is to analyze the accuracy and reliability of simulation result utilizing statistical method. Simulation results can be analyzed from two perspectives. One is to view the problem from system optimization, that is, investigate at what accuracy and reliability does the simulation result reflect real system by contrasting simulation target (Zhang and Liu, 2006).
3. Status analysis for SF Express in S city
S City is an important city preferentially developed by SF Express. The distribution center of S City is the largest in H region of this Company, covering an area of more than 8000m2, with the daily sorting amount exceeding 100,000 pieces. At present, the distribution center adopts the combined method of semi-automatic sorting and manual sorting. However, with the increasingly rising business volume, the semi-automatic sorting system cannot satisfy the actual demand of SF Express, because it has low efficiency and high error rate. To better improve the operation efficiency of SF Express distribution center, applying the automatic sorting system is the inevitable choice of SF Express in the future. But the investment of automatic sorting system is too large, and the operating maintenance fee is also very high, therefore, it must be carefully planned. Therefore, it is of significant importance to conduct simulation design for automatic sorting system by simulation software.
4. Modeling target
The created model will be different with different system simulation targets. Therefore, the simulation target must be confirmed before system modeling. The express items processed by the distribution center of S City exceed 100,000 pieces every day. The express items are transported to this distribution center through various ways, which are then transported to the branch of each region or destination by this distribution center (Ma, 2013). The express items of S city distribution center are mainly transported to S City, intra-province, other provinces and outbound regions including Hong Kong, Macao and Taiwan. Both the operating quantity and the operating requirement will be different for express items of different regions. The simulation target targeting at sorting system modeling of above 8000 m2 S city distribution center aims at verifying the feasibility of this designing scheme, finding out and solving the bottleneck of the distribution center in the operational process, making the daily express handling capacity of distribution center reach above 150,000 and improving the sorting efficiency of distribution center.
458
5. Creating a system model and conducting system description and system parameter setting
5.1 System description
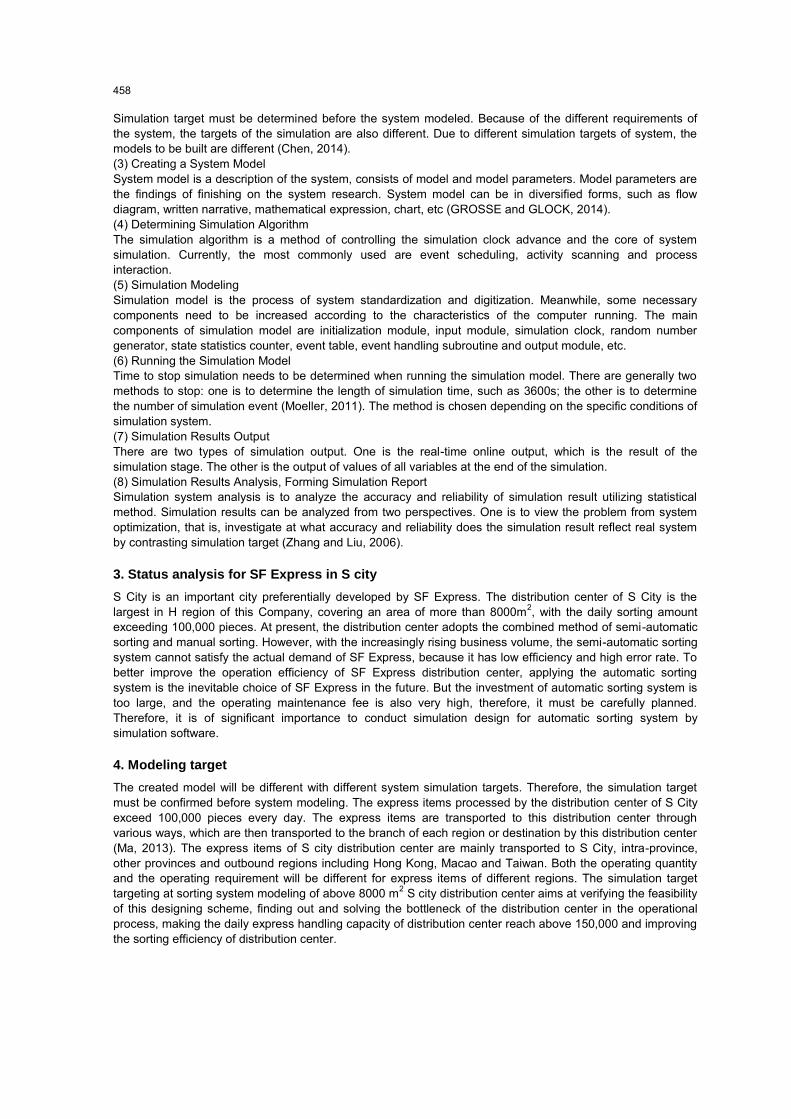
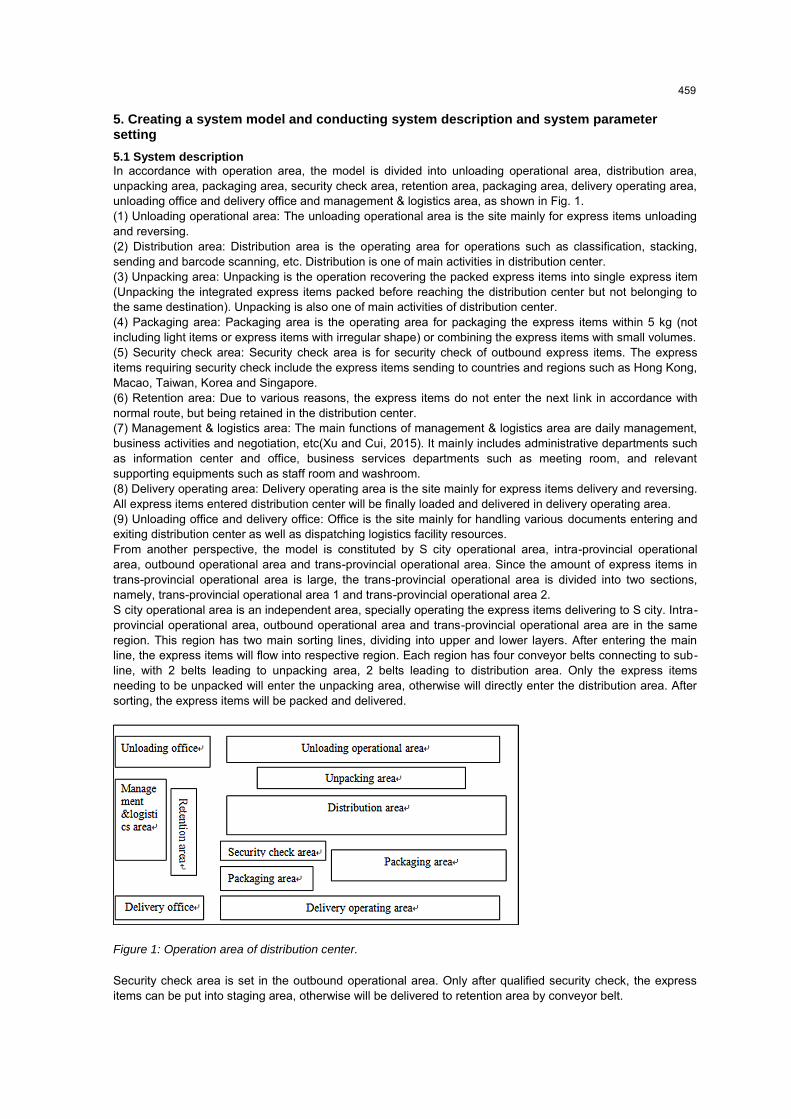
In accordance with operation area, the model is divided into unloading operational area, distribution area, unpacking area, packaging area, security check area, retention area, packaging area, delivery operating area, unloading office and delivery office and management & logistics area, as shown in Fig. 1. (1) Unloading operational area: The unloading operational area is the site mainly for express items unloading and reversing. (2) Distribution area: Distribution area is the operating area for operations such as classification, stacking, sending and barcode scanning, etc. Distribution is one of main activities in distribution center. (3) Unpacking area: Unpacking is the operation recovering the packed express items into single express item (Unpacking the integrated express items packed before reaching the distribution center but not belonging to the same destination). Unpacking is also one of main activities of distribution center. (4) Packaging area: Packaging area is the operating area for packaging the express items within 5 kg (not including light items or express items with irregular shape) or combining the express items with small volumes. (5) Security check area: Security check area is for security check of outbound express items. The express items requiring security check include the express items sending to countries and regions such as Hong Kong, Macao, Taiwan, Korea and Singapore. (6) Retention area: Due to various reasons, the express items do not enter the next link in accordance with normal route, but being retained in the distribution center. (7) Management & logistics area: The main functions of management & logistics area are daily management, business activities and negotiation, etc(Xu and Cui, 2015). It mainly includes administrative departments such as information center and office, business services departments such as meeting room, and relevant supporting equipments such as staff room and washroom. (8) Delivery operating area: Delivery operating area is the site mainly for express items delivery and reversing. All express items entered distribution center will be finally loaded and delivered in delivery operating area. (9) Unloading office and delivery office: Office is the site mainly for handling various documents entering and exiting distribution center as well as dispatching logistics facility resources. From another perspective, the model is constituted by S city operational area, intra-provincial operational area, outbound operational area and trans-provincial operational area. Since the amount of express items in trans-provincial operational area is large, the trans-provincial operational area is divided into two sections, namely, trans-provincial operational area 1 and trans-provincial operational area 2. S city operational area is an independent area, specially operating the express items delivering to S city. Intra-provincial operational area, outbound operational area and trans-provincial operational area are in the same region. This region has two main sorting lines, dividing into upper and lower layers. After entering the main line, the express items will flow into respective region. Each region has four conveyor belts connecting to sub-line, with 2 belts leading to unpacking area, 2 belts leading to distribution area. Only the express items needing to be unpacked will enter the unpacking area, otherwise will directly enter the distribution area. After sorting, the express items will be packed and delivered.
Figure 1: Operation area of distribution center.
Security check area is set in the outbound operational area. Only after qualified security check, the express items can be put into staging area, otherwise will be delivered to retention area by conveyor belt.
459
Fig.2 is the flow block diagram of simulation model for distribution center.
Figure 2: Flow block diagram of simulation model for distribution center.
5.2 System parameter setting Through the above analysis, the Flexsim entities adopted by this model include generator, staging area, processor, resolver, conveyor belt and operator. The next is conducting parameter setting for operation object of S city distribution center system: (1) Since the daily processing amount of express items is 150,000, the parameter setting of generator obeys the uniform distribution function uniform (40, 20); (2) We set 8 colors to distinguish express items of different operational areas, among which, the color of express items in unpacking area is different from that an express item is set as 10s; (3) Since the quantity of express items in S city operational area is large, we use 4 colors to represent the express items entering this region, therefore, the parameter setting of generator is duniform (1,4); (4) The resolver parameter is set according to the field research result. The processing time of resolving (5) Parameter setting of staging area: After the express items enter into distribution area, they are pushed into different conveyor belts by the system according to their specific address, put into cases, packed and sent after accumulating 20 express items. The maximum storage amount of case is 80; (6) Parameter setting of processor: Security check shall be conducted for express items in outbound area. The express items enter into case after qualified security check. The processing time of checking an express item is set as 10s. The unqualified express items after security check will be sent to the retention area by another conveyor belt. The unqualified rate is set as 0.01%; (7) Parameter setting of conveyor belt: The transfer speed of conveyor belt adopts the default speed of 1m/s. Directing entering distribution area, that is, two colors are used to represent the express items of each region, the parameter setting of generator is duniform (1, 8);
6. Simulation result analysis
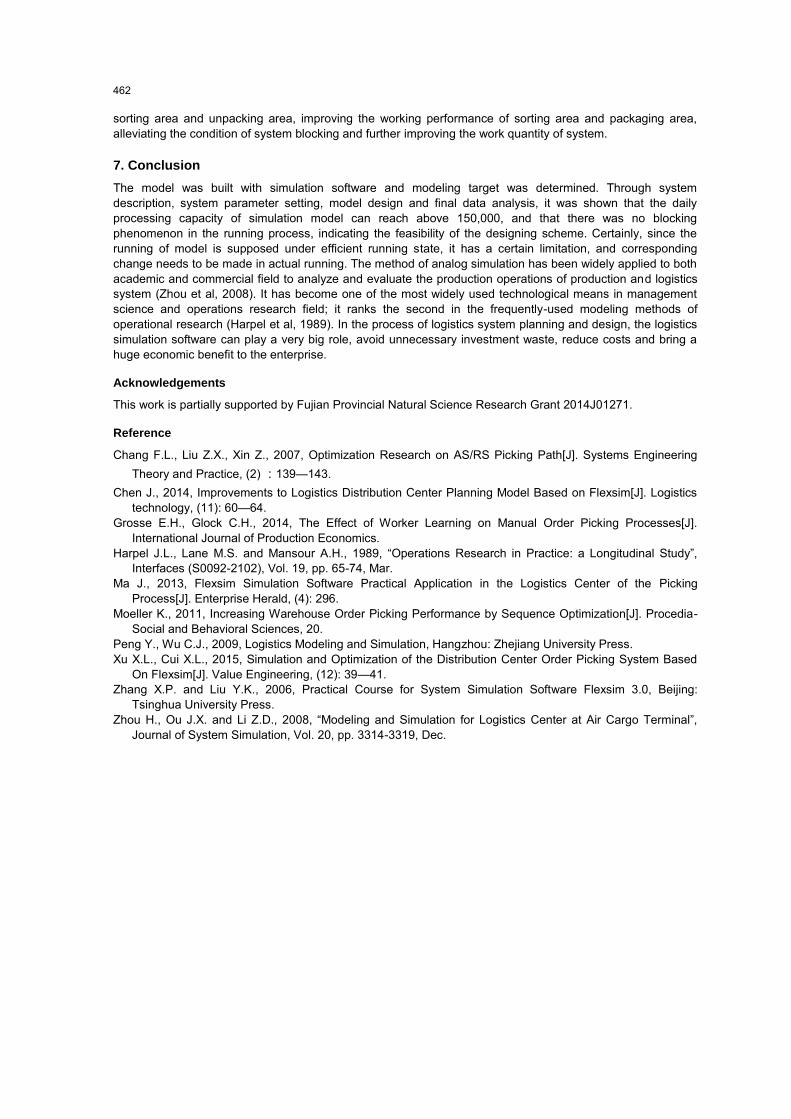
Under the state of efficient operation, the simulation time and actual time is set as 1:1. After running 24h, that is, 86400s, the running condition of distribution center is well. All equipments are in efficient operating state, with no bottleneck appeared. As shown in Table 1, the daily handling capacity of distribution center reaches and even exceeds the predicted 150,000 bills, which indicates that the design reaches modeling target and is feasible. Moreover, different from the sorting of other goods, express items sorting has a very high requirement on speed, therefore, whether the model is smooth or not in running is very important. Through observing the correlation data of maximum average waiting time and minimum average waiting time of all conveyors in Table 2(Data in Table 2 are captured data because the simulation data are too large), we can see that the fluency of system is not affected too much after 24h; there is no big difference between the maximum and minimum average waiting time. The 24h working system and 8h working system are compared to see whether the relation of running results is about 3 times. From Table 2, it can be seen that the result of running 8h and running 24h is basically equal, and there is no simple triple relation. Whether running 8h or 24h, the model is very smooth, indicating that in some processes, with the increase of time, the model does not have changes such as blocking but basically maintains the stable process.
460
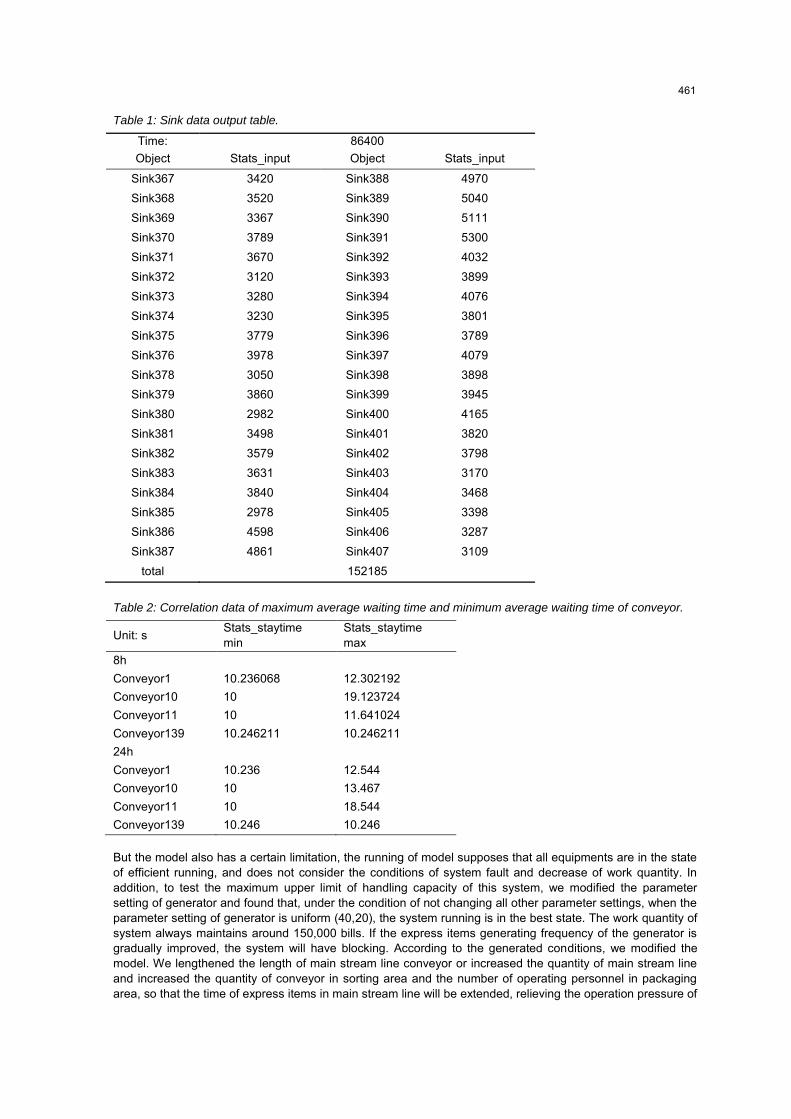
Table 1: Sink data output table.
Time: 86400 Object Stats_input Object Stats_input
Sink367 3420 Sink388 4970 Sink368 3520 Sink389 5040 Sink369 3367 Sink390 5111 Sink370 3789 Sink391 5300 Sink371 3670 Sink392 4032 Sink372 3120 Sink393 3899 Sink373 3280 Sink394 4076 Sink374 3230 Sink395 3801 Sink375 3779 Sink396 3789 Sink376 3978 Sink397 4079 Sink378 3050 Sink398 3898 Sink379 3860 Sink399 3945 Sink380 2982 Sink400 4165 Sink381 3498 Sink401 3820 Sink382 3579 Sink402 3798 Sink383 3631 Sink403 3170 Sink384 3840 Sink404 3468 Sink385 2978 Sink405 3398 Sink386 4598 Sink406 3287 Sink387 4861 Sink407 3109
total 152185
Table 2: Correlation data of maximum average waiting time and minimum average waiting time of conveyor.
Unit: s Stats_staytime min
Stats_staytime max
8h Conveyor1 10.236068 12.302192 Conveyor10 10 19.123724 Conveyor11 10 11.641024 Conveyor139 10.246211 10.246211 24h Conveyor1 10.236 12.544 Conveyor10 10 13.467 Conveyor11 10 18.544 Conveyor139 10.246 10.246 But the model also has a certain limitation, the running of model supposes that all equipments are in the state of efficient running, and does not consider the conditions of system fault and decrease of work quantity. In addition, to test the maximum upper limit of handling capacity of this system, we modified the parameter setting of generator and found that, under the condition of not changing all other parameter settings, when the parameter setting of generator is uniform (40,20), the system running is in the best state. The work quantity of system always maintains around 150,000 bills. If the express items generating frequency of the generator is gradually improved, the system will have blocking. According to the generated conditions, we modified the model. We lengthened the length of main stream line conveyor or increased the quantity of main stream line and increased the quantity of conveyor in sorting area and the number of operating personnel in packaging area, so that the time of express items in main stream line will be extended, relieving the operation pressure of
461
sorting area and unpacking area, improving the working performance of sorting area and packaging area, alleviating the condition of system blocking and further improving the work quantity of system.
7. Conclusion
The model was built with simulation software and modeling target was determined. Through system description, system parameter setting, model design and final data analysis, it was shown that the daily processing capacity of simulation model can reach above 150,000, and that there was no blocking phenomenon in the running process, indicating the feasibility of the designing scheme. Certainly, since the running of model is supposed under efficient running state, it has a certain limitation, and corresponding change needs to be made in actual running. The method of analog simulation has been widely applied to both academic and commercial field to analyze and evaluate the production operations of production and logistics system (Zhou et al, 2008). It has become one of the most widely used technological means in management science and operations research field; it ranks the second in the frequently-used modeling methods of operational research (Harpel et al, 1989). In the process of logistics system planning and design, the logistics simulation software can play a very big role, avoid unnecessary investment waste, reduce costs and bring a huge economic benefit to the enterprise.
Acknowledgements
This work is partially supported by Fujian Provincial Natural Science Research Grant 2014J01271.
Reference
Chang F.L., Liu Z.X., Xin Z., 2007, Optimization Research on AS/RS Picking Path[J]. Systems Engineering Theory and Practice, (2) :139—143.
Chen J., 2014, Improvements to Logistics Distribution Center Planning Model Based on Flexsim[J]. Logistics technology, (11): 60—64.
Grosse E.H., Glock C.H., 2014, The Effect of Worker Learning on Manual Order Picking Processes[J]. International Journal of Production Economics.
Harpel J.L., Lane M.S. and Mansour A.H., 1989, “Operations Research in Practice: a Longitudinal Study”,
Interfaces (S0092-2102), Vol. 19, pp. 65-74, Mar. Ma J., 2013, Flexsim Simulation Software Practical Application in the Logistics Center of the Picking
Process[J]. Enterprise Herald, (4): 296. Moeller K., 2011, Increasing Warehouse Order Picking Performance by Sequence Optimization[J]. Procedia-
Social and Behavioral Sciences, 20. Peng Y., Wu C.J., 2009, Logistics Modeling and Simulation, Hangzhou: Zhejiang University Press. Xu X.L., Cui X.L., 2015, Simulation and Optimization of the Distribution Center Order Picking System Based
On Flexsim[J]. Value Engineering, (12): 39—41. Zhang X.P. and Liu Y.K., 2006, Practical Course for System Simulation Software Flexsim 3.0, Beijing:
Tsinghua University Press. Zhou H., Ou J.X. and Li Z.D., 2008, “Modeling and Simulation for Logistics Center at Air Cargo Terminal”,
Journal of System Simulation, Vol. 20, pp. 3314-3319, Dec.
462