simulation- based design study modeling a wind turbine chris gloss, andrew lincoln, matthew mustard,...
TRANSCRIPT
Simulation-Based Design
Study Modeling a
Wind TurbineChris Gloss, Andrew Lincoln, Matthew Mustard, John Semmens, & Shereef
Shehab
2
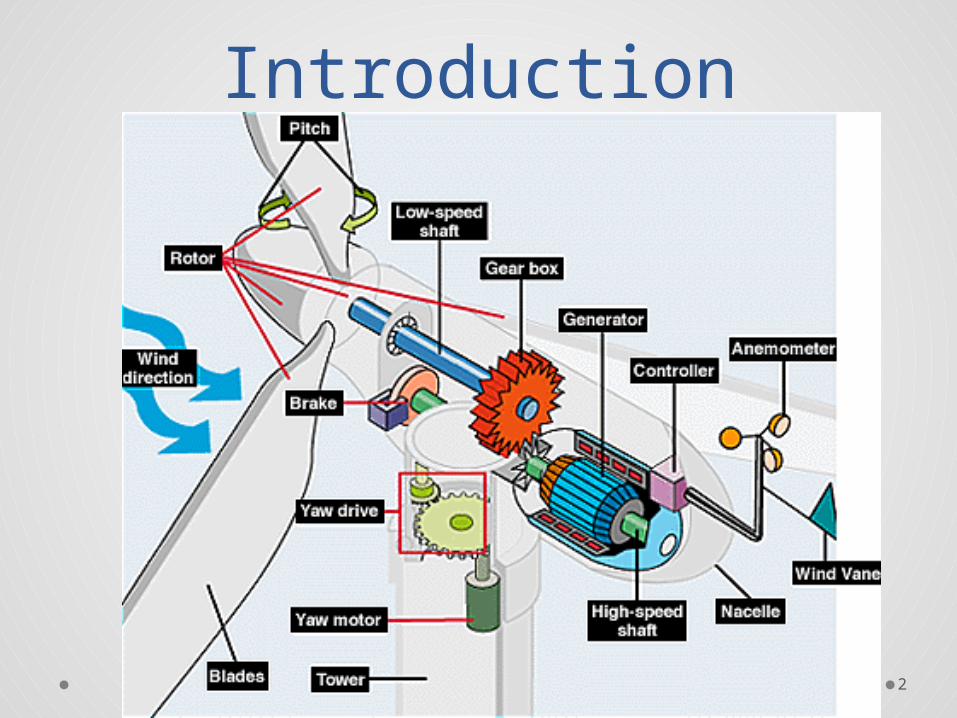
Introduction

Wind Turbine Modeling 3
Scope
• Goalso Develop a fully functional model
of a 1.5 MW wind turbine based on industry standards
o Utilize available wind data for Atlanta’s Airport
o Determine the feasibility of installing a wind turbine in Atlanta
• Design Variableso Rotor Radiuso Tower Height
To develop a model of a wind turbine that will provide its expected utility using the Dymola and Model Center software.
Wind Turbine Modeling 4
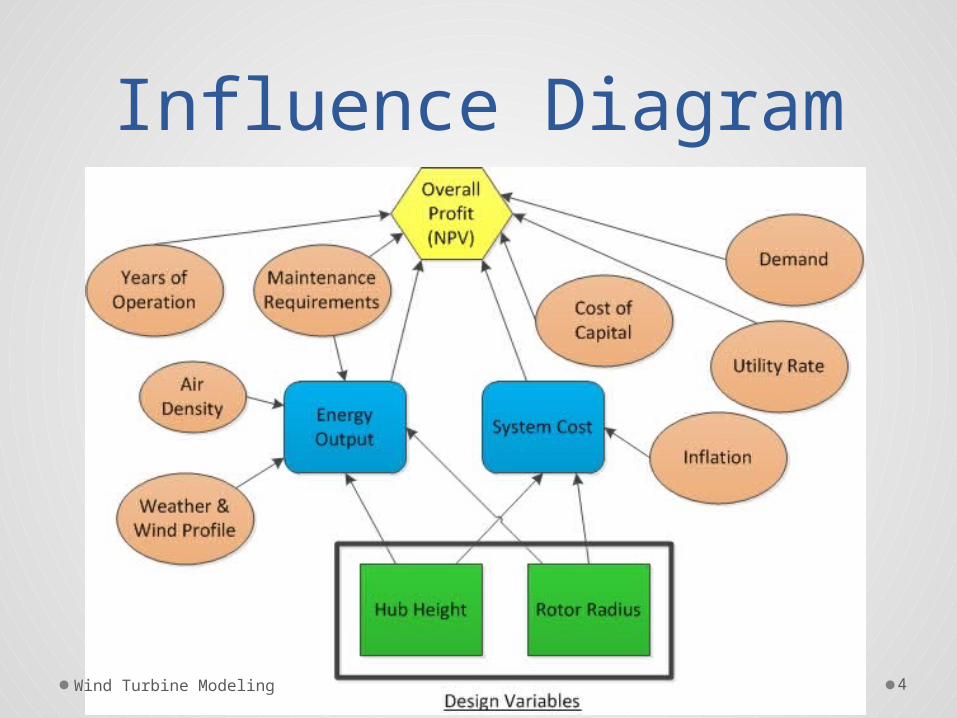
Influence Diagram

Wind Turbine Modeling 5
Blades
• NACA 4412 Airfoil• Triangular planform.• Assumed to be made
of fiberglass and hollow.
• Moment of inertia of the blade about the base was calculated.

Wind Turbine Modeling 6
Dymola Model: Overview

Wind Turbine Modeling 7
Implementation of a PID Controller

Wind Turbine Modeling 8
Role of Uncertainty• The central composite experiment showed which
uncertain variables have the greatest effect.

Wind Turbine Modeling 9
Monte Carlo Analysis
0-0.
08
0.08
-0.1
6
0.16
-0.2
4
0.24
-0.3
2
0.32
-0.4
0
0.40
-0.4
8
0.48
-0.5
6
0.56
-0.6
4
0.64
-0.7
2
0.72
-0.8
0
0.80
-0.8
8
0.88
-0.9
6
0.96
-1.0
4
1.04
-1.1
2
1.12
-1.2
0
1.20
-1.2
8
1.28
-1.3
6
>1.36
0
500
1000
1500
2000
2500
3000
Monte Carlo Results Histogram
Frequency
Cost of Electricity ($/kWh)
Fre
quency

Wind Turbine Modeling 10
Dymola Model: Cost

Wind Turbine Modeling 11
Total Turbine System Cost* $1,770,000.00AEP (kW-h) 3,950,000 Minimum Most Likely MaximumYear Rand# 1.00 Years of Operation 10 20 30Years of Operation 24 Utility Rate $0.01 $0.07 $0.17Cost of Capital Rand# 0.55 Cost of Capital 0.01 0.15 0.2Cost of Capital 0.13 Demand (kW-h) 1,316,667 2,633,333 3,950,000
Year Utility Rand# Utility Rate Demand Rand# Demand Revenue Discounted Cash Flow0 ($1,770,000.00)1 0.55 $0.09 0.87 3,058,387 $269,164.88 $237,293.332 0.66 $0.10 0.39 2,481,096 $246,009.48 $191,199.223 0.99 $0.16 0.70 2,869,197 $473,286.18 $324,283.784 0.29 $0.07 0.78 2,963,799 $194,610.79 $117,553.475 0.33 $0.07 0.51 2,640,777 $182,951.26 $97,425.156 0.64 $0.10 0.34 2,403,537 $234,506.45 $110,092.477 0.55 $0.09 0.99 3,171,980 $279,190.64 $115,550.238 0.98 $0.16 0.52 2,654,834 $422,195.86 $154,046.229 0.85 $0.13 0.92 3,104,736 $390,259.24 $125,532.86
10 0.40 $0.07 0.18 2,111,968 $157,331.60 $44,615.6611 0.05 $0.03 0.37 2,453,465 $80,821.08 $20,205.2012 0.52 $0.09 0.79 2,973,503 $255,100.96 $56,223.4813 0.10 $0.05 0.84 3,027,528 $159,312.26 $30,954.3714 0.55 $0.09 0.32 2,368,422 $208,321.29 $35,684.0015 0.93 $0.14 0.61 2,773,283 $391,709.26 $59,152.2016 0.95 $0.15 0.28 2,295,123 $334,891.83 $44,583.9717 0.55 $0.09 0.91 3,091,594 $272,301.31 $31,958.8418 0.68 $0.10 0.09 1,888,677 $193,291.30 $19,999.5719 0.08 $0.05 0.61 2,774,641 $140,909.47 $12,853.3320 0.34 $0.07 0.45 2,566,567 $178,922.10 $14,388.2121 0.18 $0.06 0.66 2,829,171 $163,737.63 $11,608.0222 0.07 $0.04 0.66 2,830,131 $106,234.38 $6,639.6023 0.12 $0.05 0.87 3,056,485 $163,450.74 $9,005.9824 0.21 $0.06 0.04 1,678,043 $101,118.69 $4,911.82252627282930
Triangular Distributions
NPV Model

Wind Turbine Modeling 12
@Risk – Monte Carlo within Excel
66.5% 33.5%
0.000 +∞
-1.5
0-1
.00
-0.5
00
.00
0.5
01
.00
1.5
02
.00
2.5
03
.00
3.5
0
Values in Millions ($)
0.0
0.1
0.2
0.3
0.4
0.5
0.6
0.7
0.8
0.9
1.0
Val
ue
s x
10
^-6
NPV - Demand / Utility Rate
NPV - Demand / Utility Rate
Minimum -$1,173,934.14Maximum $3,107,918.10Mean -$101,096.28Std Dev $585,569.89Values 5000
@RISK Textbook VersionFor Academic Use Only
60.3% 39.7%
0.000 +∞
-1.5
0-1
.00
-0.5
00
.00
0.5
01
.00
1.5
02
.00
2.5
03
.00
3.5
04
.00
Values in Millions ($)
0.0
0.1
0.2
0.3
0.4
0.5
0.6
0.7
0.8
0.9
1.0
Val
ues
x 1
0^
-6
NPV - Demand / Utility Rate
NPV - Demand / Utility Rate
Minimum -$1,034,270.62Maximum $3,856,616.88Mean $11,442.90Std Dev $597,216.87Values 5000
@RISK Textbook VersionFor Academic Use Only
AEP = 3,950,000 kW-hrLeft: Cost = $1,880,000
Right: Cost = $1,770,000

Wind Turbine Modeling 13
Determination of r
• NPV Maximum = $3,856,616.88• NPV Minimum = ($1,173,934.14)
At what dollar amount are we indifferent between the NPV maximum and minimum?• Chosen value = $200,000 • Using a Matlab script the risk aversion
coefficient is 4.2438x10⁻⁷
NPVeu )102438.4(7
7
11024.4
1

Wind Turbine Modeling 14
Full Factorial Exploration

Wind Turbine Modeling 15
Deterministic Optimization

Wind Turbine Modeling 16
Optimization with Uncertainty
Results
Optimum Rotor Radius
43.65 m
Optimum Hub Height
85 m
Maximum Expected Utility
-$14,205.40
Statistic Expected Utility ($)
Minimum -1,917,290
Maximum 950,206
Mean -14,205.40
Median 53,432.20
Lower 25% -134,740
Upper 25% 265,559
Standard Deviation
521,651
Wind Turbine Modeling 17
Thank You
Does any one have any questions?