simulation analysis of solar powered home lighting system · simulation analysis of solar powered...
TRANSCRIPT
Simulation analysis of Solar Powered Home Lighting System
ASHUTOSH S. WERULKAR1, P.S.KULKARNI2
1Department of Electronics and Telecommunication Engineering, St.Vincent Pallotti College of
Engineering and Technology, Gavsi Manapur, Wardha road, Nagpur,440027,
INDIA.
2Department of Electrical Engineering, Visvesvaraya National Institute of Technology, Nagpur,
INDIA
Abstract:- The aim of this paper is to perform the simulation analysis of Solar Home lighting system. The
Solar home lighting system installed in the department of Electrical Engineering in Visvesvarayya National Institute of Technology, Nagpur is analyzed at different temperatures, solar insolations and time in Nagpur, at latitude 21.100 in India. PSpice 9.1 software is used for analysis. It has been found that solar radiation and temperature have a significant impact on solar characteristics. The charge controller used in the home lighting system does not support maximum power point charging. There is a power loss involved due to non availability of MPP charging of the charge controller.. Maximum power point charging is essential in a Solar Photovoltaic System to have maximum throughput from it. This has been verified with simulation and experimental results. The charge controller needs to be replaced with another high efficiency charge controller to utilize the power availability of the solar panel to the maximum extent.
Key Words:- PSpice 9.1 software, Solar Energy, solar photovoltaic (PV) system, charge controller, MPP
1 Introduction SOLAR PHOTOVOLTAICS (PV) is the only technology that directly converts sunlight to electricity. Attractive advantages of PV technology include a free and abundant fuel supply; little or no pollution or operation/maintenance costs (once installed), and unlimited system life. In developing countries like India, the rural electrification is embryonic and hence the applications of photovoltaic systems are important. It is very difficult to extend the power lines from centralized sources to rural areas. It is also not very economical and so decentralized power sources such as PV system, are a promising solution to this problem. One of the primary concerns in designing a stand-alone PV system is to utilize solar power to the maximum extent till it is available. This is possible by tuning the solar charging system to maximum
power with MPP tracking to reduce battery charging time. To have improvements in any system, it is necessary to do thorough study and analysis of the system.
According to the announcement of the National Action Plan on climate change in June 2008, solar energy technologies are identified in the country as a National mission. This has given birth of Jawaharlal Nehru National Mission (JNNSM) in India.It aims at development and deployment of solar energy technologies in the country to achieve parity with grid power tariff by 2022. The objective of the national solar mission is to establish India as a global leader in solar energy, by creating the policy conditions for its diffusion across the country as quickly as possible. Photovoltaic devices commonly called solar cells or modules, use semiconductor material to directly convert sunlight into electricity. Solar cells
Advances in Environmental Science and Energy Planning
ISBN: 978-1-61804-280-4 261
have no moving parts. Power is produced when sunlight strikes the semiconductor material and creates an electric current. Solar panel generates the power at 12V DC but there are some loads which requires higher/lower voltages to operate so for supplying such loads, DC-DC converters are used and efficiency of the solar photovoltaic system is improved.
[1] cover the basic fundamentals of standalone and grid connected solar photovoltaic systems. The concept of solar photovoltaic systems, theory and applications has been mentioned in them. Modeling of photovoltaic systems using PSpice is mentioned in [2]. Different modeling examples have been explained in it. [3] Covers the solar radiation data for all major cities in India. This data is used for analyzing the solar home lighting system. In [4] the battery charging is implemented with different state of charging of batteries and compared it using MPP charging. It if very important to keep the balance between the battery charging current, MPP current and state of charge. In the analysis, it is studied that if battery charging current exceeds safe charging limit on account of MPP tracking, battery starts overheating. The Techno Economic Optimum Sizing of a standalone Solar Photovoltaic System is suggested by Kolhe [5]. Temperature has large impact on PV power and its efficiency.A large number of relations are suggested by the authors for this[6]. The Solar radiation utilizability concept and monthly average daily PV array efficiency have been used here to estimate the performance of a standalone PV system.A simple fast and reliable technique for charging batteries by solar arrays is proposed in[7].The operating point of a battery is carefully forced near the maximum power point of solar cells under all environmental conditions. Optimal operation of solar arrays is achieved using the voltage based maximum power point tracking(VMPPT) technique and the charger operating point is continuously adjusted by changing the charging current. Design of new solar battery charger technology has been proposed in [8].The existing charge control methods can fail when charging by solar arrays in changing environmental conditions. The reasons for the failure and introduction of new voltage and temperature based charge control techniques with MPPT tracker is proposed here. A case study of solar photovoltaic power system at Sagardeep Island is proposed in [9].A microcontroller based maximum power point
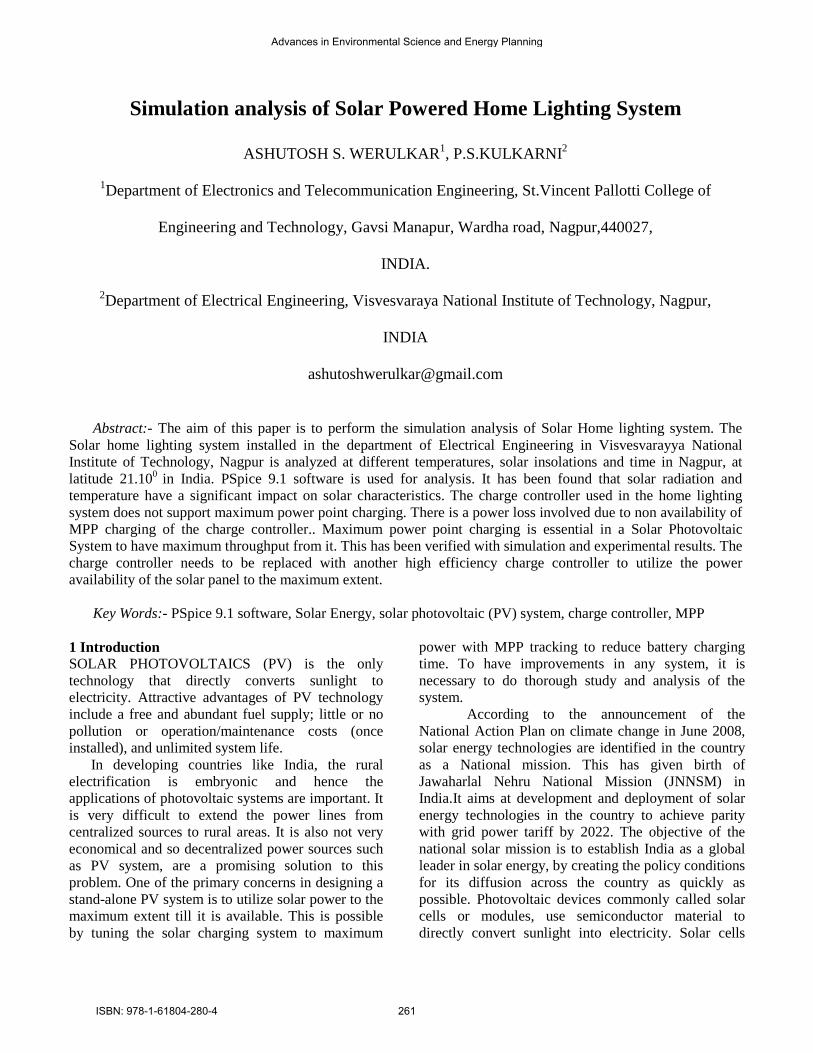
controller is covered in [10].The energy analysis of solar home lighting system is covered in [11]. The main objective of this paper to analyze the solar powered home lighting system, compare the theoretical and practical readings, find areas of improvement and develop improvement projects .PSpice 9.1 is used for simulation purpose. Section 2 covers the basic description of solar home lighting system. Section 3 covers simulation analysis of solar home lighting system with simulation of sun, solar cell, solar module and solar home lighting system. Section 4 covers experimental analysis and discussion. 2 Solar Home Lighting System The home lighting system in VNIT campus is as shown in the Figure1.The specifications are given in appendix 1
Fig.1: Solar Home Lighting System The solar powered home lighting is simulated by taking the various readings at different temperatures and different solar insolations in Nagpur city. Nagpur city is situated at 21.100 N latitude and 79.500East longitude. PSpice 9.1 is used to carry out simulation work. The performance of the solar panel is good provided temperature is less. As the temperature starts increasing, the power delivered by the solar panel reduces. The solar panel of 37Wp is theoretically analyzed for different radiations at constant room temperature of 250.In Nagpur, from room temperature of 250C, the temperature increases upto 450C.Hence the solar panel is also analyzed for a variable temperature from 250C to 450C.The complete solar home lighting system is analyzed using PSpice by taking radiation profile of day time from 27th March 2014 to 29th March
Advances in Environmental Science and Energy Planning
ISBN: 978-1-61804-280-4 262
2014. The simulation readings are supported with some experimental analysis. The paper is divided into following sub categories
• Simulation of standard spectrum of sun • Simulation of solar cell • Simulation of 37Wp solar panel • Simulation analysis of complete system
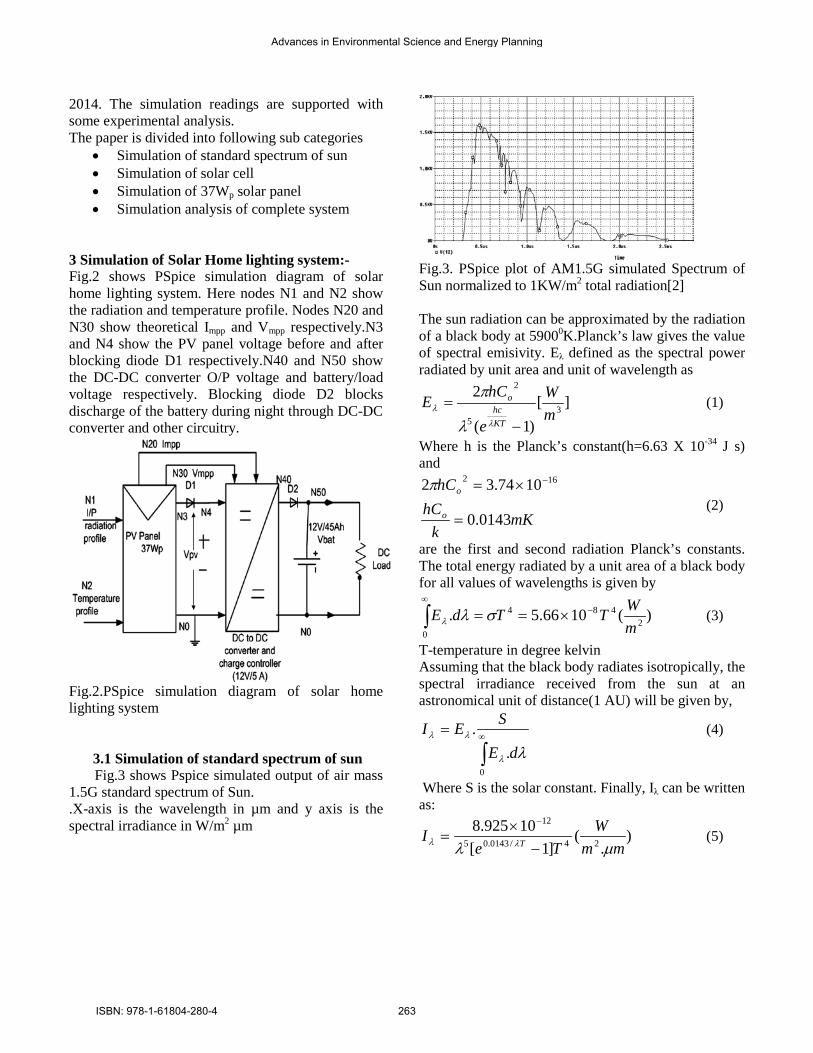
3 Simulation of Solar Home lighting system:- Fig.2 shows PSpice simulation diagram of solar home lighting system. Here nodes N1 and N2 show the radiation and temperature profile. Nodes N20 and N30 show theoretical Impp and Vmpp respectively.N3 and N4 show the PV panel voltage before and after blocking diode D1 respectively.N40 and N50 show the DC-DC converter O/P voltage and battery/load voltage respectively. Blocking diode D2 blocks discharge of the battery during night through DC-DC converter and other circuitry.
Fig.2.PSpice simulation diagram of solar home lighting system
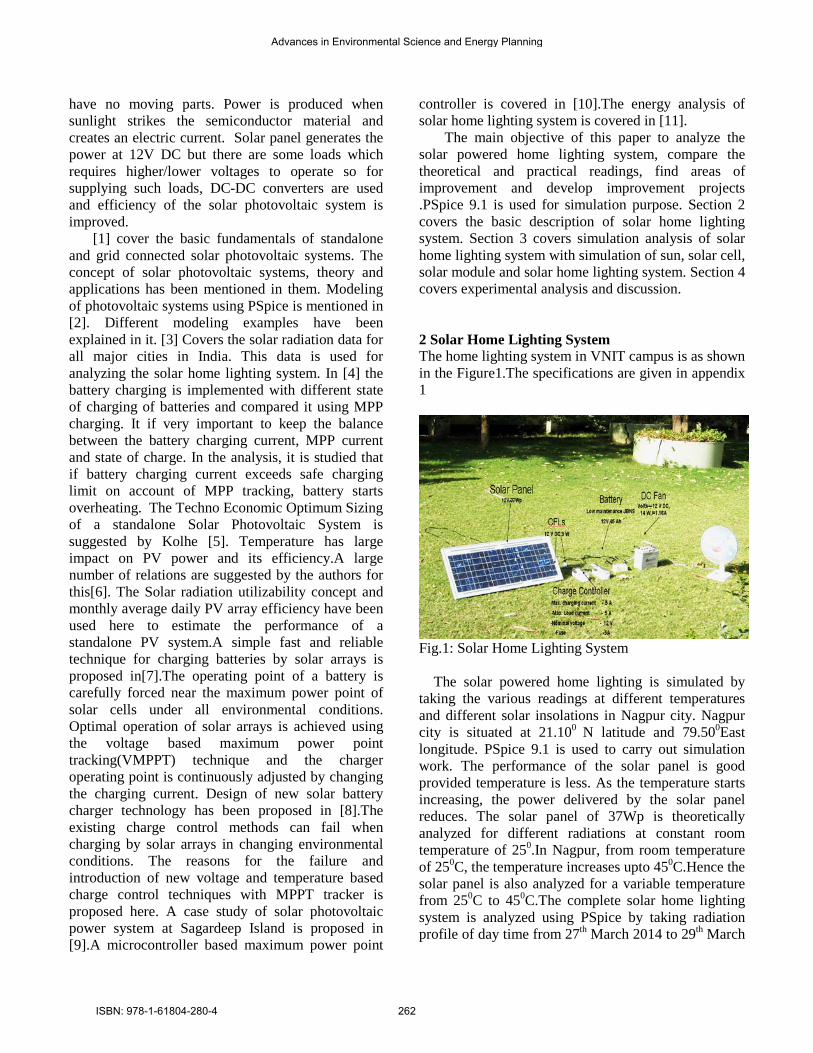
3.1 Simulation of standard spectrum of sun Fig.3 shows Pspice simulated output of air mass 1.5G standard spectrum of Sun. .X-axis is the wavelength in µm and y axis is the spectral irradiance in W/m2 µm
Fig.3. PSpice plot of AM1.5G simulated Spectrum of Sun normalized to 1KW/m2 total radiation[2] The sun radiation can be approximated by the radiation of a black body at 59000K.Planck’s law gives the value of spectral emisivity. Eλ defined as the spectral power radiated by unit area and unit of wavelength as
][)1(
23
5
2
mW
e
hCE
KThc
o
−=
λ
λ
λ
π (1)
Where h is the Planck’s constant(h=6.63 X 10⁻³⁴ J s) and
mKk
hChC
o
o
0143.0
1074.32 162
=
×= −π (2)
are the first and second radiation Planck’s constants. The total energy radiated by a unit area of a black body for all values of wavelengths is given by
)(1066.5. 2484
0 mWTTdE −
∞
×==∫ σλλ (3)
T-temperature in degree kelvin Assuming that the black body radiates isotropically, the spectral irradiance received from the sun at an astronomical unit of distance(1 AU) will be given by,
∫∞=
0
..
λλ
λλ
dE
SEI (4)
Where S is the solar constant. Finally, Iλ can be written as:
).
(]1[
10925.824/0143.05
12
mmW
TeI T µλ λλ −
×=
−
(5)
Advances in Environmental Science and Energy Planning
ISBN: 978-1-61804-280-4 263

3.2 Simulation of solar cell
Fig.4 Equivalent circuit of a Solar Cell[2]. Fig. 4 shows the equivalent circuit of Solar cell. A Solar Cell is a kind of P-N junction semiconductor device which converts light energy into electrical energy. The equivalent circuit of the solar cell is composed of the internal series resistance (Rs), and the shunt resistance (Rsh) of the diode. The output characteristics of the solar cell depend on the irradiance and the operating temperature of the cell. The Solar cell output characteristics of the Solar cell is given by,
shRSI.RV
1)T2VSI.RV
(eo2I1)TnVSI.RV
(eo1IPhII+
−−
−+
−−
−+
−= (6)
where: I- total cell current (A). Iph- Light generated current V- cell voltage (V). I01- diffusion reverse saturation current (A). I02 -recombination reverse saturation current (A). Rs -series resistance (Ώ). Rsh -shunt resistance (Ώ ). VT -Thermal voltage n- Non-ideality factor of main diode Q- elementary charge . k-Boltzmann’s constant.
a)
b) a)I-V characteristics b)P-V characteristics
Fig.5 a) I-V and b) P-V characteristics of solar cell with maximum power point
Fig.5 shows I-V and P-V characteristics of solar cell. As solar radiation is increased, short circuit current and maximum power point is increased. The open circuit voltage is mathematically given by:
)1ln(.0I
IVV SC
Toc += (7)
At the MPP,
)1(0 −−= T
m
VV
phm eIII (8)
)1ln(.T
mTOCm V
VVVV +−= (9)
From equations 7-9, it is clear that temperature has significant impact in deciding the parameters of the solar cell. The maximum power is reduced as temperature increases.
Fig.6. Pspice Simulated Output showing effect of Temperature on I-V characteristics of Solar cell
Advances in Environmental Science and Energy Planning
ISBN: 978-1-61804-280-4 264

Fig 6 shows Pspice simulated I-V characteristics of the solar cell with variation of temperature from 270C to 600C. Value of Voc is also displayed for each case. It is seen that PV current reduces as the temperature increases and there by shifting the maximum power point to the lower side
3.2. Simulation analysis of 37Wp solar panel: The solar home lighting system consists of a solar panel of 37Wp.Hence solar panels is simulated at varying radiation and different parameters like Vmpp, Impp, Pmpp and Voc are generated at constant temperature of 250C.Table 1 shows the above readings in detail. Table 1:-PSpice simulation readings for 37Wp solar panel at varying solar radiation and constant temperature of 250C
a)
b) a)I-V characteristics b)P-V characteristics Fig.7. a) I-V and b) P-V characteristics of 37Wp solar panel at 250C Fig. 7 shows a sample I-V and P-V characteristics of 37Wp Solar panel at varying radiation upto 400W/m2 and at 250C.From the characteristics, it is clear that varying solar radiation has impact of maximum power as shown in table 1. The solar panel is further simulated by increasing solar radiation and also proportionally increasing the temperature from 250C to 450C.In Nagpur the temperature increases up to 450C above room temperature. Table 2 shows the simulated readings of 37Wp solar panel with varying temperature. Table 2:-PSpice simulation output of 37Wp solar panel at variable temperature
The panel parameters are analyzed for showing the impact of increasing temperature. Figure 8 shows the
Advances in Environmental Science and Energy Planning
ISBN: 978-1-61804-280-4 265
graph showing the impact of temperature on Pmpp .From the graph, it is clear that, maximum power point power is reduced with the increase in temperature. The effect of temperature [6] on P-V power is explained in equation 10.
)]50(104102
5001.[. 44 CTT
CC TCGIVP c −×
+×−
−= (10)
Where,VC and IC are the output voltage and current , TC- Cell or module operating temperature in 0K CTC-Temperature coefficient of at cell temperature=1 or 3 for values of TC below or above 500C respectively GT-Solar radiation flux/irradiance on module plane in W/m2 P-PV power
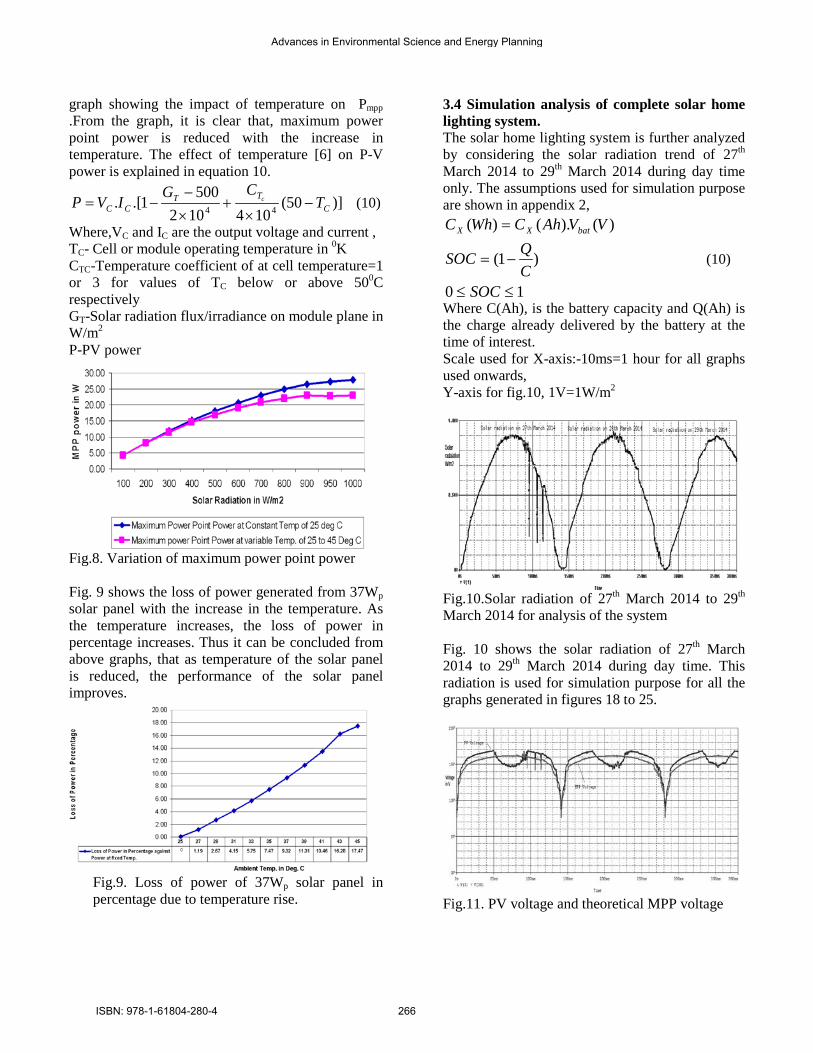
Fig.8. Variation of maximum power point power Fig. 9 shows the loss of power generated from 37Wp solar panel with the increase in the temperature. As the temperature increases, the loss of power in percentage increases. Thus it can be concluded from above graphs, that as temperature of the solar panel is reduced, the performance of the solar panel improves.
Fig.9. Loss of power of 37Wp solar panel in percentage due to temperature rise.
3.4 Simulation analysis of complete solar home lighting system. The solar home lighting system is further analyzed by considering the solar radiation trend of 27th March 2014 to 29th March 2014 during day time only. The assumptions used for simulation purpose are shown in appendix 2,
10
)1(
)().()(
≤≤
−=
=
SOCCQSOC
VVAhCWhC batXX
(10)
Where C(Ah), is the battery capacity and Q(Ah) is the charge already delivered by the battery at the time of interest. Scale used for X-axis:-10ms=1 hour for all graphs used onwards, Y-axis for fig.10, 1V=1W/m2
Fig.10.Solar radiation of 27th March 2014 to 29th March 2014 for analysis of the system Fig. 10 shows the solar radiation of 27th March 2014 to 29th March 2014 during day time. This radiation is used for simulation purpose for all the graphs generated in figures 18 to 25.
Fig.11. PV voltage and theoretical MPP voltage
Advances in Environmental Science and Energy Planning
ISBN: 978-1-61804-280-4 266

Fig. 11 shows the PV voltage and theoretical MPP voltage of 37Wp solar panel. MPP voltage is high as compared to PV voltage when solar radiation is high. Fig. 12 shows DC-DC converter I/P and O/P voltage. The O/P voltage of the DC-DC converter is the charging voltage of the battery and it is always maintained above battery voltage up to 15V irrespective of the PV voltage.
Fig.12.DC-DC converter I/P and O/P voltage. Fig.13 shows the DC-DC converter O/P voltage and battery voltage. Since there is a blocking diode D2 connected between DC-DC converter O/P voltage and battery voltage, there is a difference of 0.7V to 1 V between these two voltages.
Fig. 13.DC-DC converter O/P voltage and Battery voltage
Fig.14.Actual PV current and theoretical MPP current Fig. 14 shows the graph of actual PV current and theoretical MPP current. Theoretical MPP current is always greater than PV current. This graph is generated to make the comparison of PV power and MPP power and understand the performance of PV system.
Fig.15.PV current, battery current and load current Fig. 15 shows the trends of PV current, battery current and load current on March 27th 2014 to March 29, 2014. It is seen that load current is almost constant throughout this time and especially for the portion when battery voltage is constant. When battery voltage reduces, the load current also reduces. It is seen that PV current is always above +Ve direction of X-axis. The load current is also positive as it is always consumed by the load. The battery current goes in –Ve direction of X-axis in the morning hours when solar radiation is less. During this time, the battery is in discharge mode and load current requirement is fulfilled by the battery current as PV current is not sufficient due to less solar radiation. Since battery is loaded during this period, the voltage of the battery is reduced and hence there is slight deep in the load
Advances in Environmental Science and Energy Planning
ISBN: 978-1-61804-280-4 267

current during this period. This is shown by the deep in the battery voltage in fig.13.
Fig.16.Theoretical MPP power, actual power generated by PV panel, power consumed by load and power absorbed/generated by the battery. Fig. 16 shows theoretical MPP power, actual power generated by PV panel, power consumed by load and power absorbed/generated by the battery. The back up power required by the load will be fulfilled by the battery and hence battery absorbs power during charging and generates power during discharging. Battery works in discharging mode when solar radiation is not sufficient to maintain the power continuously required by the load.
Fig.17.Theoretical energy with MPP operation and actual energy without MPP operation for PV panel Fig.17 shows theoretical energy with MPP operation and actual energy without MPP operation for PV panel. From figure, it is clear that actual energy less than theoretical MPP energy of the PV panel.Fig.18 shows the state of charge of the battery and it is reaching to a level 1 through out the simulation time. This is because, the energy required by the load is getting fulfilled by the PV panel
Scale used on Y-axis, 0.1V=10%, On X- axis 10ms=1 hour
Fig.18. State of charge of the battery 4. Experimental results and discussion:-
Table 3 shows the readings of the measurements carried out during status of battery charging using solar panel on home lighting system on March 30, 2014.The time duration used for taking the readings were from 11:45Hrs to 12:45Hrs. Using these readings, the graphs were plotted to note the performance of the system with varying solar radiation. Fig. 19 shows the solar radiation used for experimental analysis. Figures 20 and 21 show battery charging current and battery charging power during the experimental analysis. It is seen that maximum battery power has reached only upto 12W. For a 37Wp Solar panel, battery charging power is less than 50% of the capacity of solar panel. This proves that solar panel is not utilized to its maximum extent and maximum power point charging is not available in the existing charge controller.
Advances in Environmental Science and Energy Planning
ISBN: 978-1-61804-280-4 268
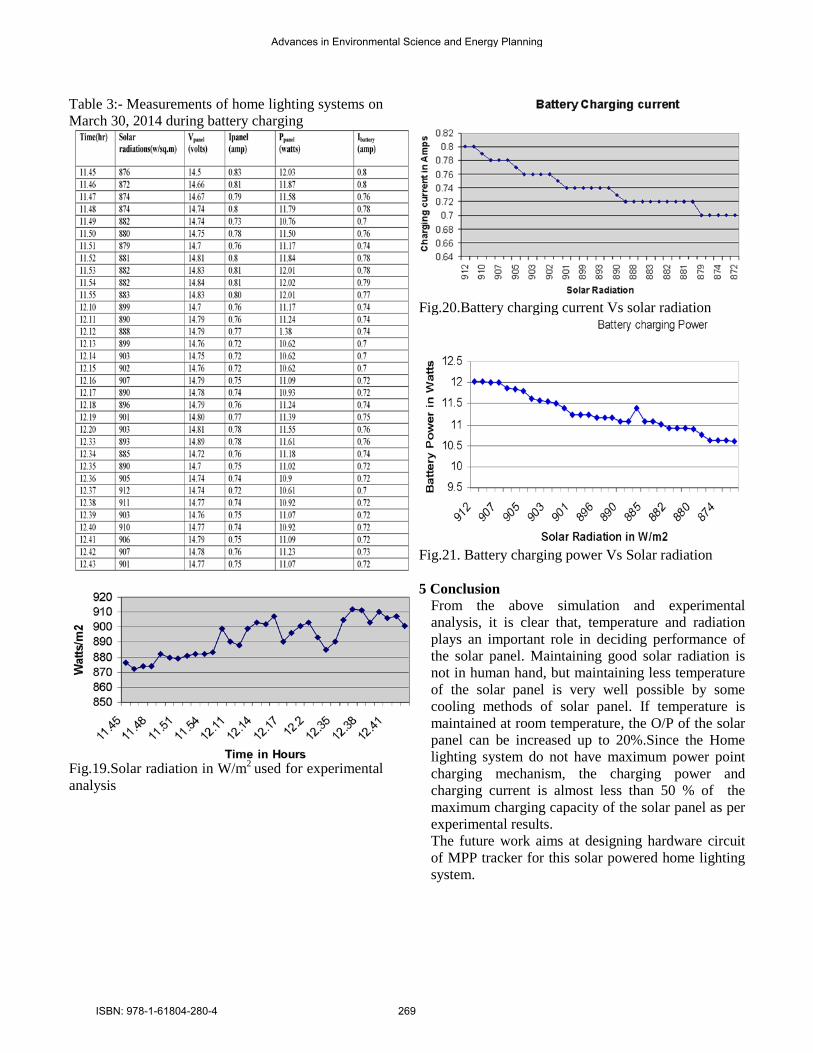
Table 3:- Measurements of home lighting systems on March 30, 2014 during battery charging
Fig.19.Solar radiation in W/m2 used for experimental analysis
Fig.20.Battery charging current Vs solar radiation
Fig.21. Battery charging power Vs Solar radiation 5 Conclusion
From the above simulation and experimental analysis, it is clear that, temperature and radiation plays an important role in deciding performance of the solar panel. Maintaining good solar radiation is not in human hand, but maintaining less temperature of the solar panel is very well possible by some cooling methods of solar panel. If temperature is maintained at room temperature, the O/P of the solar panel can be increased up to 20%.Since the Home lighting system do not have maximum power point charging mechanism, the charging power and charging current is almost less than 50 % of the maximum charging capacity of the solar panel as per experimental results. The future work aims at designing hardware circuit of MPP tracker for this solar powered home lighting system.
Advances in Environmental Science and Energy Planning
ISBN: 978-1-61804-280-4 269

Acknowledgements The authors are grateful to the authorities of VNIT, Nagpur and St. Vincent Pallotti College of Engg. and Technology, Nagpur for providing facilities to carry out the research work. Appendix 1. The specification of Solar home lighting system
1. Solar Photovoltaic Panel 12V, 37Wp, Nominal electrical output @ 250 C and STC condition, Pmax = 37 Watts; Vmp = 16.4 Volts; Voc = 21.0 V; Imp = 2.4Amps; Isc=2.6Amp Weight of the panel = 5.180KG Length of panel = 97.10cm Breadth of the Panel = 43.2cm
Thickness of the panel=3.7cm 2. Battery:-Low maintenance 12V,45 Ah 3. Solar PV Charge Controller:- Max. charging current - 5 A,Max. Load current - 5 A
Nominal voltage - 12 V, Fuse - 5A 4. DC Fan: - Volts – 12 V DC, 14 W, I=1.16A 5. Compact Florescent Lamps,Volts – 12 V DC, 9 W, 2 No.s, I=0.75A 2. Simulation parameter used for simulation of solar home lighting system
DC-DC converter:-with an efficiency of 97% and an output voltage of 15V Battery voltage=12V, battery capacity=45Ah, Charge/discharge efficiency:-0.91, auto discharge rate D=1x 10⁻⁹ h-1 and initial state of charge SOC=0.9 DC load: total power demanded by the load, Pload= 17.40W,Rload=8.27Ώ Two blocking diodes:d1 and d2
References: [1]Masters G., Stanford University” Renewable and Efficient Electric power System”. John Wiley and Sons Ltd., 3rd Edition, 2004. [2] Castaner L. and Silvestre S., “Modeling of Photovoltaic Systems using PSpice”.J. Willey & Sons, Ltd., 2002. [3] Mani Anna. “Hand book of Solar Radiation data for India” 1980, Allied Publishers Pvt. Limited.New Delhi, India. [4] Karami N., Moubayed Nazih and Outbib Rachid “Analysis and implementation of an adaptive PV
based battery floating charger” Solar Energy Vol. 86 pp 2383–2396, 2012 [5] Kolhe M.“Techno-Economic Optimum sizing of a stand-alone solar photovoltaic system”; IEEE transactions on energy conversion, Vol.4 No.2, pp 511-519,June 2009,. [6] Skoplaki E., Palyvos J.A. “On the temperature dependence of photovoltaic module electrical performance: A review of efficiency/power correlations”, Solar Energy, Vol.83 pp 614–624, 2009 [7] Masoum M.A., Badejani S., and Fuchs E.F.. ”Microprocessor Controlled new class of optimal battery chargers for photovoltaic applications”. IEEE Transactions on Energy Conversion, Vol.19. No.3, , pp. 599-606, September 2004 [8] Boico F. and Lehman B., and Shujaee Khalil “Solar Battery Chargers for NiMH Batteries” IEEE transactions on Power Electronics, Vol.22 No.5, pp. 1600-1609, September 2007 [9] Moharil R. M. and Kulkarni P. S., “A case study of Solar Photovoltaic Power System at Sagardeep Island, India”, International Journal Renewable and Sustainable Energy Reviews, Vol. 13, , pp. 673-681, 2009 [10] Koutroulis Eftichios, Kalaitzakis Kostas, “Development of a Microcontroller-Based Photovoltaic Maximum Power Point Tracking Control System” IEEE transactions on Power Electronics, Vol.16 No.1, pp 46-54, January 2001 [11] Werulkar A.S., Kulkarni P. S. “Energy Analysis of Solar Home Lighting System With Microcontroller-Based Charge Controller” Journal of Solar Energy Engineering, Transactions of ASME, Vol. 136 / 031010-1 to 031010-9, August 2014
Advances in Environmental Science and Energy Planning
ISBN: 978-1-61804-280-4 270