simulating and visualizing sidewalk accessibility for...
TRANSCRIPT

Full Terms & Conditions of access and use can be found athttp://www.tandfonline.com/action/journalInformation?journalCode=tica20
Download by: [University Of Pittsburgh] Date: 15 June 2016, At: 12:12
International Journal of Cartography
ISSN: 2372-9333 (Print) 2372-9341 (Online) Journal homepage: http://www.tandfonline.com/loi/tica20
Simulating and visualizing sidewalk accessibilityfor wayfinding of people with disabilities
Mohammadamin Tajgardoon & Hassan A. Karimi
To cite this article: Mohammadamin Tajgardoon & Hassan A. Karimi (2015) Simulating andvisualizing sidewalk accessibility for wayfinding of people with disabilities, International Journalof Cartography, 1:1, 79-93, DOI: 10.1080/23729333.2015.1055646
To link to this article: http://dx.doi.org/10.1080/23729333.2015.1055646
Published online: 08 Jul 2015.
Submit your article to this journal
Article views: 499
View related articles
View Crossmark data

Simulating and visualizing sidewalk accessibility forwayfinding of people with disabilitiesMohammadamin Tajgardoona and Hassan A. Karimib
aIntelligent Systems Program, University of Pittsburgh, 5113 Sennott Square, 210 South Bouquet Street,Pittsburgh, PA 15260, USA; bGeoinformatics Laboratory, School of Information Sciences, University ofPittsburgh, 135 N. Bellefield Avenue, Pittsburgh, PA 15213, USA
ABSTRACTThere are generally different and less wayfinding options forpedestrians than those for drivers. This makes developing modelsand tools that assist pedestrians in finding routes morechallenging. The problem is even further exacerbated whenspecific routing requirements of people with disabilities areconsidered. While currently much research is focused ondeveloping solutions for wayfinding of pedestrians, very fewaddress the specific requirements of individuals with disabilitiesand none is focused on evaluation of the accessibility of builtenvironments. In this paper, we propose a new approach inevaluating the accessibility of built environments for wayfindingof individuals with disabilities. The proposed approach involvessimulation and visualization of the accessibility of sidewalksegments allowing urban planners, and other designers andengineers, to gain an understanding of how accessible builtenvironments are and allowing individuals with disabilities toassess the accessibility of built environments with respect to theirmobility needs. Simulations were conducted using a sidewalknetwork database which contains accessibility attributes based onthe standards recommended by the Americans with DisabilitiesAct. To demonstrate the benefits of the proposed approach, arepresentative model was used to simulate scenarios for thewayfinding requirements at both community and individual levels.The results of the simulations are visualized in heat-maps.
ARTICLE HISTORYReceived 21 April 2015Accepted 24 May 2015
KEYWORDSAccessibility of sidewalks;pedestrian wayfinding;wheelchair user wayfinding;blind or visually impairedwayfinding
Introduction
Planning how to get around on foot is an integral part of everyday life. While, nowadays,drivers can generally rely on vehicle navigation systems for their travel needs, pedestrianshave far more complex requirements to fulfill (May, Ross, Bayer, & Tarkiainen, 2003; Millonig& Schechtner, 2007). The shortest path is not always optimal for an individual’s purposes aspeople often prefer themost convenient, the safest or themost scenic path (Karimi, Jiang, &Zhu, 2013). Wayfinding, a process of determining and following a path or route between anorigin and destination (Golledge & Reginald, 1999), becomes even more challenging forpeople with disabilities. For people with physical disabilities, even a short trip can be a
© 2015 International Cartographic Association
CONTACT Hassan A. Karimi [email protected]
INTERNATIONAL JOURNAL OF CARTOGRAPHY, 2015VOL. 1, NO. 1, 79–93http://dx.doi.org/10.1080/23729333.2015.1055646
Dow
nloa
ded
by [
Uni
vers
ity O
f Pi
ttsbu
rgh]
at 1
2:12
15
June
201
6
daunting task and perhaps impossible to perform. People with physical disabilities encoun-ter more barriers on sidewalks than others. For example, commuting in a crowded environ-ment could be challenging for an individual who is blind or a wheelchair user. Obstaclessuch as stairs, no ramps or steep ramps, poor segment surface, no curb cuts or blockedcurb cuts,make the sidewalks uncomfortable or even inaccessible to peoplewith disabilities(Rimmer, Riley,Wang, Rauworth, & Jurkowski, 2004). In 1990, theUSgovernment recognizeda need to define built environments to allow equal access to all people and passed theAmericans with Disabilities Act (ADA). One main goal of the ADA is to provide peoplewith disabilities access to buildings, access to public transportation and the opportunityto attend schools. Routing solutions that consider the accessibility of the built environmentwould help people with disabilities travel around more comfortably, have access to morepublic facilities and adopt more socially active life styles (Heath & Fentem, 1996).
In this paper, we present a new methodology for evaluating the accessibility of side-walks for wayfinding of people with disabilities. The proposed methodology is performedthrough simulation and visualization. For demonstration purposes, we use a weightedlinear model, which takes into account different characteristics of a sidewalk segment,for the simulation of accessibility. These characteristics, as the linear model parameters,were investigated by Kasemsuppakorn and Karimi (2008) and include segment slope,number of steps, segment distance, number of crosswalks, different traffic zones,surface type and condition, segment width and number of landmarks. The idea behindany model, such as the one used in this work, is to provide individuals with appropriatetravel paths on a sidewalk network. To better understand the wayfinding issues and chal-lenges with respect to accessibility of the built environment, the requirements of twogroups of people with disabilities, wheelchair users and individuals who are blind or visu-ally impaired (B/VI), were simulated. The sidewalk network of the University of Pittsburgh’smain campus was used in the simulations and the results are presented through heat-maps which show the degree of comfort by each group on each sidewalk segment. Thegenerated heat-maps also show that there are differences in paths desired by individualsin each group and in paths desired by both groups (we call each group a community).
The main research question that this paper aims to address is as follows: How can theaccessibility of the built environment be evaluated for wayfinding by peoplewith disabilities?The contribution of the paper is the evaluation of the built environment (sidewalk networks)through simulationand visualizationofwayfindingofpedestrianswithdisabilities. Visualizingthe results of simulations throughheat-mapsbenefitsurbanplanners andpeoplewithdisabil-ities. Urban planners can evaluate the accessibility of the built environment and find theaccessibility gaps, and people with disabilities can choose accessible routes that meet theirneeds and preferences. The structure of the paper is as follows. Background to wayfindingapproaches and tools for people with disabilities is discussed in the ‘Background’ section. Arepresentative model is described in the ‘Model’ section. The ‘Simulation’ section explainshow the simulation is conducted. Simulation results are discussed in the ‘SimulationResults’ section. Finally, we will discuss summary and future work in the last section.
Background
There is a void in the literature about simulation and visualization of the accessibility ofsidewalk segments specifically for wayfinding of people with disabilities. Our simulation
80 M. TAJGARDOON AND H.A. KARIMI
Dow
nloa
ded
by [
Uni
vers
ity O
f Pi
ttsbu
rgh]
at 1
2:12
15
June
201
6

and visualization approach is unique and will provide insights into new ways to evaluatethe accessibility of urban areas. However, considering that people with disabilities are themajor beneficiaries of the proposed simulation and visualization approach, in this section,selected existing wayfinding systems and services designed specifically for wheelchairusers and people who are B/VI are discussed.
U-Access (Sobek & Miller, 2006) is a routing tool that provides pedestrians with theshortest feasible route with respect to one of the three different ability levels, namelyperipatetic (unaided mobility), aided mobility (mobility with the help of a cane, walkeror crutches) and wheelchair users. U-Access is also an analytical tool that can help ident-ify obstacles in built environments and evaluate routing discrepancies among ped-estrians with different physical abilities. Beale, Field, Briggs, Picton, and Matthews(2006) introduced a web-based navigation service with a user-friendly interface that con-siders impedances to accessibility for wheelchair users. It employs several criteria such asbarriers, slope and challenging surfaces in addition to distance for wayfinding. Holone,Misund, and Holmstedt (2007) proposed a mobile route planning system, Ourway,based on user feedback. This pedestrian navigation tool provides special features forpeople with mobility impairments and the collaboration between users is in the formof shared experiences. Volker and Weber (2008) developed a system for collaborativemultimodal annotation of geographical data and personalized routing of mobilityimpaired pedestrians. The system allows pedestrians to cooperate in collecting infor-mation about points of interest, environmental features such as slopes, locations ofobstacles and images, as well as providing convenience and safety ratings. These datacan then be shared among different groups anonymously. The system considers individ-ual preferences and temporal relations of annotated data, in addition to the collectedinformation by users, to calculate personalized multi-criteria routes for pedestrianswith special needs including motor impaired, elderly people and people who are B/VI.Neis and Zielstra (2014) developed an algorithm for generating a sidewalk network forpeople with disabilities. They used the freely available data from the OpenStreetMap(OSM) project (Benner & Karimi, 2013) to obtain the required parameters for navigationof people with disabilities. The parameters included sidewalk width, slope, surface,smoothness, curb, lighting, tactile paving and steps. The resulting sidewalk networkwas overlaid on the OSM base map.
Karimi, Zhang, and Benner (2013) developed personalized accessibility map (PAM), aninteractive map featuring accessibility data and specific functions suitable for people withspecial needs to assist them with their wayfinding needs and preferences. The benefits ofPAM to people with disabilities, especially wheelchair users, were demonstrated through aprototype PAM for the University of Pittsburgh’s main campus (PAM-Pitt). Users of PAM-Pitt can locate accessible entrances of campus buildings, find the shortest pathsbetween campus buildings and request accessible paths between campus buildingsbased on their requirements and preferences. An accessible path for a wheelchair useris an example of the services offered by the PAM. The sidewalk network database inPAM-Pitt was manually collected by using various techniques and tools and taking intoaccount the specific parameters of the ADA standards (Kasemsuppakorn & Karimi,2008). The sidewalk network database in the PAM includes attributes such as sidewalkslope, surface condition, length, steps, width and traffic. To compute accessible pathsfor wheelchair users in the PAM, a fuzzy logic model developed by Kasemsuppakorn
INTERNATIONAL JOURNAL OF CARTOGRAPHY 81
Dow
nloa
ded
by [
Uni
vers
ity O
f Pi
ttsbu
rgh]
at 1
2:12
15
June
201
6

and Karimi (2009) is used. Kasemsuppakorn, Karimi, Ding, and Ojeda (2014) developed analgorithm, based on this model, and evaluated it by subjects (wheelchair users) within theUniversity of Pittsburgh’s main campus. The results of the evaluation indicate that wheel-chair users may not be able to take the shortest path and prefer an accessible, and com-fortable, path instead even if their travel distance and time are increased.
Wayfinding by individuals who are B/VI has been studied in some research projects.Petrie et al. (1996) presented a travel aid for the blind and elderly, built on geographicinformation systems and global positioning system (GPS) technologies. It consists of twocomponents: the MOBIC Pre-journey System to assist users in planning journeys and theMOBIC Outdoor System to execute these plans by providing users with orientation andnavigation assistance during journeys. The MOBIC travel aid is complementary toprimary mobility aids such as the long cane or guide dog. The SmartVision project (Fer-nandes, du Buf, et al., 2011) presented a prototype addressing three main applications:(1) local navigation for centering on footpaths and obstacle avoidance, in the immediatesurroundings, but just beyond the reach of the white cane; (2) global navigation forfinding one’s way and (3) object/obstacle recognition, not only on the shelves in apantry or supermarket, but also outdoor such as bus stops, taxi stands, ATM machinesand telephone booths. The Nav4B (Fernandes, Faria, Paredes, & Barroso, 2011) projectaims to create a small, cheap and portable application as an extension of the work per-formed in the SmartVision project. The new prototype is built with the same modularstructure as in SmartVision. Kammoun, Dramas, Oriolaand, and Jouffrais (2010) pre-sented a method for finding optimal routes between pairs of origin and destinationpoints for the individual who is blind, and used the proposed method in an assistivedevice for the blind, called NAVIG (Navigation Assisted by Artificial Vision and GlobalNavigation Satellite System). In their work, four main classes of objects includingpoints of interest, landmarks, walking areas and visual points were annotated in thedatabase. In order to calculate the cost of a link between two nodes in the graph,user profit and system profit, along with parameters such as sidewalk (presence andwidth), the presence of pedestrian crossing and length of a section were considered.User profit of a graph link depends on the presence of points of interest and landmarks,and system profit depends on the presence of visual points. The optimal route is com-puted by using Dijkstra’s algorithm. A simulation and a prototype were designed to testthe performance of the proposed algorithm.
There are also some products designed to assist people with B/VI. Trekker Breeze andSense Nav are two examples of these products. The Trekker Breeze handheld talking GPS1
can be controlled by one hand. It verbally announces names of streets, intersections andlandmarks as the person walks and prevents the individuals who are B/VI from getting lostor missing a stop when traveling by bus. Sense Navigation (Sense Nav2) uses map datatogether with a GPS receiver and gives information based on the map data to the individ-ual who is blind by means of voice and braille notes. Trekker and Sense Nav both use mapdata designed for car navigation.
It is clear from these selected projects that there is a void in the literature about eval-uating the accessibility of the built environment through simulation and visualization ofwayfinding of people with disabilities. In this work, we present a simulation methodologyto evaluate the accessibility of the built environment. The methodology, which includes
82 M. TAJGARDOON AND H.A. KARIMI
Dow
nloa
ded
by [
Uni
vers
ity O
f Pi
ttsbu
rgh]
at 1
2:12
15
June
201
6
sidewalk data and routing models shows how the accessibility of sidewalks is simulatedand visualized using any, existing or new, valid routing models.
Model
In this section, a representative model, to describe the methodology for simulating andvisualizing the accessibility of the built environment, is presented. The model parametersare relevant sidewalk characteristics that are required by individuals who are wheelchairusers or B/VI. It must be noted that while the use of a model in the methodology isneeded for simulating wayfinding scenarios, finding a suitable model is a separateresearch and beyond the scope of this paper.
Wayfinding parameters
People with disabilities require specific requirements for traveling on sidewalks (Heath &Fentem, 1996; Karimi, Dias, Pearlman, & Zimmerman, 2014; Rimmer et al., 2004). Depend-ing on the type of disability, they may need or prefer other requirements beside distanceor trip duration. For example, wheelchair users may want to avoid sidewalks with steps ormay prefer less steep walkways in case of manual wheelchairs, or an individual who is B/VImay want walkways with minimum crosswalks to avoid street crossings. Considering theserequirements, different parameters for evaluating sidewalk segments can be involved inorder to determine the degree of comfort for wheelchair users and individuals who areB/VI. One important parameter is sidewalk slope. According to the ADA standards andthe U.S. Department of Justice,3 sidewalk slope should not be greater than the 1:20maximum. Another parameter is step, representing the number of sudden elevation ona sidewalk segment, as an impeding factor for wheelchair users. Furthermore, walkwaysurface condition also matters to pedestrians with wheelchairs. For example, a sidewalksurface with cracks makes it difficult for a wheelchair user to travel. Kasemsuppakornand Karimi (2009) proposed Equation (1) to calculate the surface condition score.
SidewalkConditionScore = (3× UnevenSurfaceScore) + (2× CracksScore)+ (ManholeScore). (1)
This score is a combination of uneven surfaces, cracks and manholes on sidewalk seg-ments. Equation (1) is one possible model for measuring sidewalk surface condition whichshows the important parameters, how they are combined and how they could beweighted. Surface type, which is most often concrete, asphalt, brick, cobblestone, grassor gravel, is assigned a score between 1, for concrete, to 6, for gravel (Kasemsuppakorn& Karimi, 2009). The surface type score is combined with surface condition score toform the ‘sidewalk surface’ parameter. Width of sidewalk is another parameter for whichthe ADA standard recommendation is a minimum of 91.44 centimeters. Crosswalk is a par-ameter which mostly concerns individuals who are B/VI. Sidewalk traffic is also importantbecause a crowded sidewalk slows down the movement of all pedestrians, in particularthose who are B/VI and use wheelchairs. Number of landmarks along a route is anotherparameter, as usually landmarks assist people in finding their way, especially in unfamiliarenvironments.
INTERNATIONAL JOURNAL OF CARTOGRAPHY 83
Dow
nloa
ded
by [
Uni
vers
ity O
f Pi
ttsbu
rgh]
at 1
2:12
15
June
201
6

Weighted linear model
Based on the sidewalk parameters discussed above, in this section, we present Equation (2)as a representative model for simulation. In this linear model, all parameters are weightedand averaged as one impedance score for each sidewalk segment. A segment impedancescore determines its degree of comfort grouped into ‘comfortable’, ‘semi-comfortable’,‘uncomfortable’, and ‘impassable’. W1–W8 are the weights for the eight parameters inthe equation. Each weight is assigned a discrete value between 1 and 6. Note that thisrange is only for experimentation in this work and a proper range may be determinedthrough a focus group study or other approaches. The higher weight assigned to a par-ameter indicates a lower degree of comfort by the user for that parameter. For example,assigning a value of 6 to W1 in Equation (2) indicates that slope causes a high level of dif-ficulty. With eight parameters and six possible values for each parameter, there are 68 poss-ible combinations of weight assignments. This means that a segment can be assigned 68
different impedance scores, where its degree of comfort may be different from one score toanother. These variations allow different users to evaluate the sidewalk network differently,depending on the combination of weights they choose for the relevant parameters.
SegmentImpedanceScore=W1× slopeMax(slope)+W2× steps
Max(steps)
+W3× lengthMax(length)+W4× crosswalk
Max(crosswalk)+W5× trafficMax(traffic)
+W6× surfacetype+surfaceconditionMax(surfacetype+surfacecondition)
+W7× 1− widthMax(width)
( )+W8× 1− landmark
Max(landmark)( )
.
(2)
In order to normalize the parameters of a sidewalk segment, the value of each parameteris divided by the maximum value possible for that parameter. For example, if the highestvalue of slope is 20 degrees in the sidewalk network under experiment, 20 is themaximum value of slope in the equation, although the maximum possible value for slopeis 90 degrees. For calculating the surface parameter, we used the sum of surface typevalue and surface condition value of a segment. Surface type values ranges from 1, mostconvenient, to 6, least convenient. Surface condition value is zero in the absence ofcracks, manholes and uneven surfaces, and increases as the condition of sidewalk surfacedegrades. For width and landmark parameters, instead of the normalized values, we con-sidered 1 minus normalized value. The reason is that, unlike other parameters, highervalues for width and number of landmarks make a sidewalk segment more comfortable.
It is important that the models expressed in Equations (1) and (2) be robust in unclearand uncertain situations. The sensitivity of these models can be analyzed for various arbi-trary and uncertain values for each parameter and for each weight. Such a sensitivityanalysis will make the model suitable for a variety of purposes and applications. Forexample, urban planners can analyze the degree of comfort of a sidewalk segment for agroup of individuals with special needs. Another example is that individuals can analyzevarious segment impedance scores to find those that best suit their needs and
84 M. TAJGARDOON AND H.A. KARIMI
Dow
nloa
ded
by [
Uni
vers
ity O
f Pi
ttsbu
rgh]
at 1
2:12
15
June
201
6

preferences. In both examples, a range of uncertain values for the parameters and weightsneed to be considered. An interactive decision support system based on appropriatemodels, such as those in Equations (1) and (2), could be equipped with a highly interactivevisualization tool to visualize the results of testing the robustness of the models(Andrienko & Andrienko, 2003).
Simulation
We developed a simulation environment to simulate various wayfinding scenarios. Thesimulation environment was written in Matlab programming language and run on anIntel Core i5 desktop computer. The simulation results were visualized as heat-mapsover the sidewalk network of the University of Pittsburgh’s main campus using GoogleMaps Javascript API.4
Sidewalk network database
We used the sidewalk network of the University of Pittsburgh’s main campus for simu-lations. Kasemsuppakorn and Karimi (2008) constructed this sidewalk network throughfield survey. We also conducted another field survey for this work to find the number oflandmarks and crosswalks in the campus sidewalk network. Segment attributes includeslope, number of steps, length, number of crosswalks, sidewalk traffic, surface type,surface condition, width and number of landmarks. According to the ADA standards,step is a sudden elevation above 1.27 cm in sidewalk surface. A sidewalk network canbe classified into three zones based on traffic amount: main zone, secondary zone and ter-tiary zone. Traffic amount may be identified by 1, 2 or 3 which means no traffic, light trafficand heavy traffic, respectively. The highest traffic occurs in the main zone and the lowesttraffic in the tertiary zone. Kasemsuppakorn and Karimi (2008) reported, based on the fieldsurvey, that 71.4% of sidewalk surface types on the University of Pittsburgh’s main campusare concrete and 23.8% are asphalt. The sidewalk network database contains 904 seg-ments with a total length of 38.468 kilometers.
Simulation for wheelchair users
We simulated different wayfinding scenarios for wheelchair users by specifying differentweights for the sidewalk parameters in Equation (2). All eight weights and all six values foreach parameter were used in the simulation. This provided a total of 68 weights. For simulat-ing a scenario in which a specific sidewalk parameter is a challenge for wheelchair users,higher weights are assigned to that parameter. For example, a weight of value 6 for theslope parameter indicates that the segment slope is a challenge for the user. In anotherexample, a sidewalk segment is marked as impassable by considering its width to be lessthan 91.44 centimeters (according to theADA standards) or including a step in that segment.
Simulation for individuals who are B/VI
For individuals who are B/VI, we simulated various wayfinding scenarios by specifyingdifferent weights for the sidewalk parameters in Equation (2). A total of 68 impedance
INTERNATIONAL JOURNAL OF CARTOGRAPHY 85
Dow
nloa
ded
by [
Uni
vers
ity O
f Pi
ttsbu
rgh]
at 1
2:12
15
June
201
6
scores for each segment were simulated. For simulation of wayfinding scenarios, we onlyconsidered those scores that are generated by specific parameters with certain weights.For example, to simulate a scenario in which a user wants to avoid crosswalks, we con-sidered a high weight for the crosswalk parameter. Unlike simulations for wheelchairusers, we did not impose any special restrictions on parameters for simulations forpeople with B/VI. As wheelchair users and individuals who are B/VI have different wayfind-ing needs, the simulation results are dissimilar for the two groups, indicating a differentlevel of comfort, due to varying range of values, for each parameter.
Simulation results
Community heat-maps
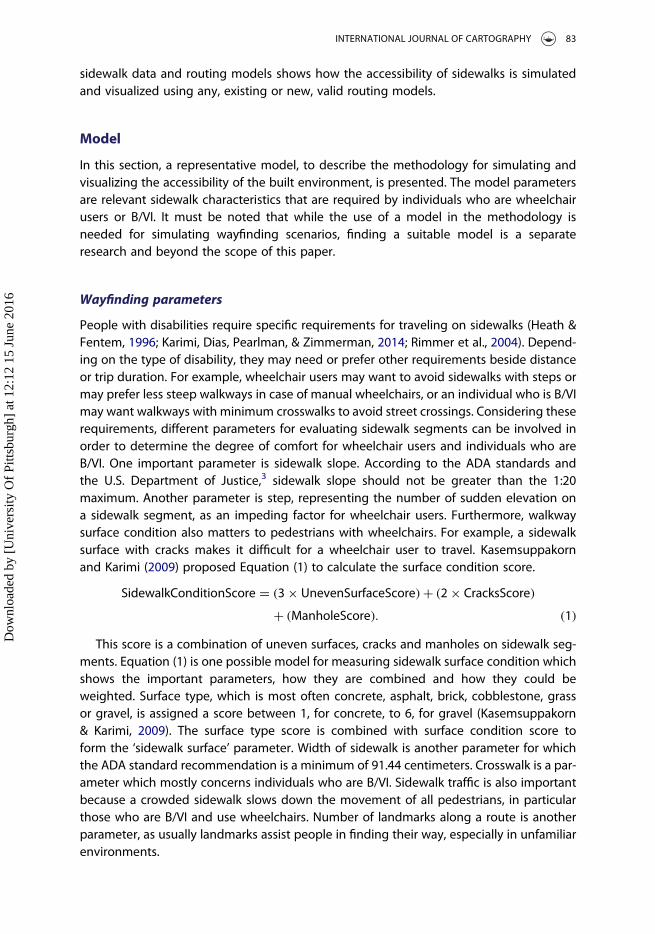
As mentioned in the ‘Simulation for Wheelchair Users’ section, sidewalk segment impe-dance scores are classified into four categories: comfortable, semi-comfortable, uncomfor-table and impassable. Segments with lower impedance scores fall into the comfortablecategory and those with higher scores into the uncomfortable category. Segments withsteps or width of less than 91.44 centimeters are categorized as impassable for wheelchairusers. Heat-maps showing comfortable segments in green, semi-comfortable in yellow,uncomfortable in red and impassable in black were generated. Such heat-maps, as a visu-alization tool, assist in realizing sidewalk accessibility and usability; the result of each simu-lation was visualized through a heat-map. Figure 1 shows a heat-map for wheelchair users.A segment color is determined based on the average of its weights in all 68 possible pre-ferences that a wheelchair user can assign to the parameters. As shown in Figure 1, in thissidewalk network, some segments are marked as impassable (in black) due to the exist-ence of steps or unfit width.
Figure 1. Heat-map for wheelchair users.
86 M. TAJGARDOON AND H.A. KARIMI
Dow
nloa
ded
by [
Uni
vers
ity O
f Pi
ttsbu
rgh]
at 1
2:12
15
June
201
6

Applying the constraints for step and width parameters results in a different heat-map.These constraints may cause assignment of a segment to a different category for individ-uals who are B/VI. Considering the differences between the needs and preferences ofwheelchair users and individuals who are B/VI, the heat-map for wheelchair users is differ-ent than the heat-map for individuals who are B/VI.
A community heat-map for individuals who are B/VI is shown in Figure 2. A segmentcolor is determined based on the average of its weights in all 68 possible preferencesthat a user may assign to the parameters. In the heat-map, segments marked as comfor-table are in green, semi-comfortable in yellow and those with higher impedance scores arein red.
A visual inspection of both community heat-maps reveals that comfortable segmentsfor both communities (wheelchair users and individuals who are B/VI) are concentratedin the center of the University campus, whereas uncomfortable segments are mostlylocated in the outskirts of the network. Also, as it is visually clear, there are areas ofthe network with different colors in the two community heat-maps. Figure 3 showsthe differences between the two community heat-maps. As seen in this figure, the com-munity heat-map for individuals who are B/VI contains more comfortable segments thanthe one for wheelchair users. The same thing can be observed for semi-comfortable seg-ments. The community heat-map for wheelchair users has more uncomfortable seg-ments compared to the heat-map for the B/VI community. There is no impassablesegment for individuals who are B/VI in this network. While the model and the parameterweight values are for experimentation, it is clear from these simulations that the pro-posed methodology can help assess the accessibility of the built environment visually,through heat-maps.
Figure 2. Heat-map for individuals who are B/VI.
INTERNATIONAL JOURNAL OF CARTOGRAPHY 87
Dow
nloa
ded
by [
Uni
vers
ity O
f Pi
ttsbu
rgh]
at 1
2:12
15
June
201
6

Personalized heat-maps
We simulated two personalized scenarios for each user group. For each scenario, weassumed that only two parameters are important from the user’s point of view. Notethat the selection of appropriate parameters is not focused on in this work as thepurpose of these simulations is demonstrating how the simulation methodology worksand not validating the model or predicting user’s behavior. In the first scenario for wheel-chair users, users’ preferences for slope and traffic were indicated with weights of 5 or 6,among the 6 possible values, otherwise they were assigned weights of 1 or 2. There are 28
possible weights for segments in this scenario. Figure 4 shows the heat-map based on theaverage of impedance scores. In the second scenario, users’ preferences for sidewalksurface and width were indicated by weights 5 or 6, otherwise they were assignedweights of 1 or 2. Figure 5 shows the heat-map of the second scenario.
Figure 3. Differences between two community heat-maps.
Figure 4. Heat-map for wheelchair users, first scenario.
88 M. TAJGARDOON AND H.A. KARIMI
Dow
nloa
ded
by [
Uni
vers
ity O
f Pi
ttsbu
rgh]
at 1
2:12
15
June
201
6

Figure 6 shows the differences between the two personalized heat-maps for wheelchairusers (Figures 4 and 5). As seen in Figure 6, the first scenario has fewer comfortable seg-ments, more semi-comfortable segments and more uncomfortable segments than thesecond scenario for wheelchair users. Both scenarios have an equal number of impassiblesegments.
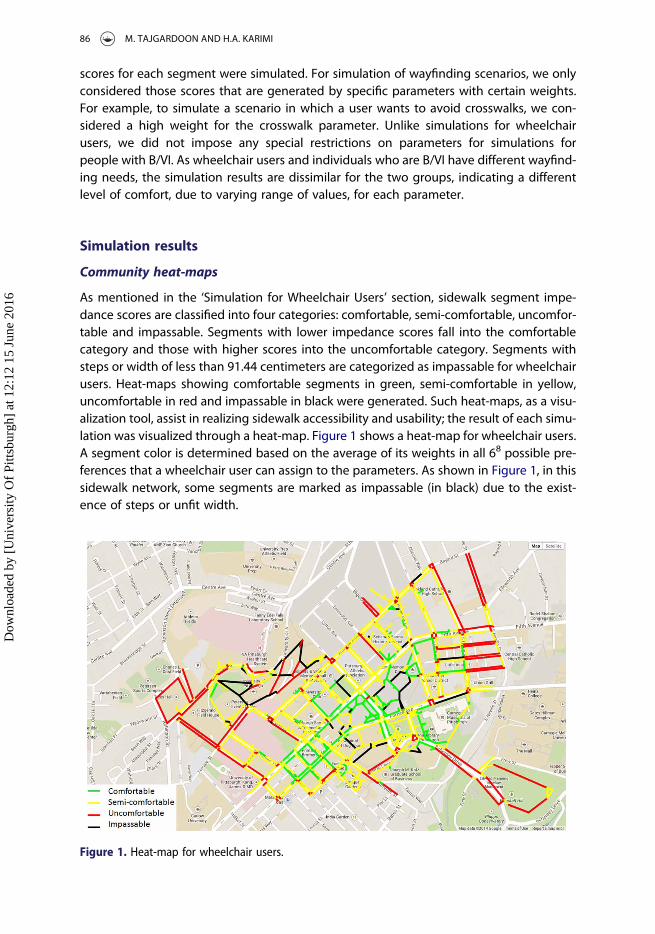
We also simulated two personalized scenarios for individuals who are B/VI. In the firstscenario, users’ preferences for slope and crosswalk were indicated with weights of 5 or6, among the 6 possible values, otherwise they were assigned weights 1 or 2. There are28 possible weights for segments in this scenario. The heat-map based on the averageof impedance scores is shown in Figure 7. In the second scenario, users’ preferences orlength and traffic were indicated with weights 5 or 6, otherwise they were assignedweights of 1 or 2. The heat-map of the second scenario is shown in Figure 8.
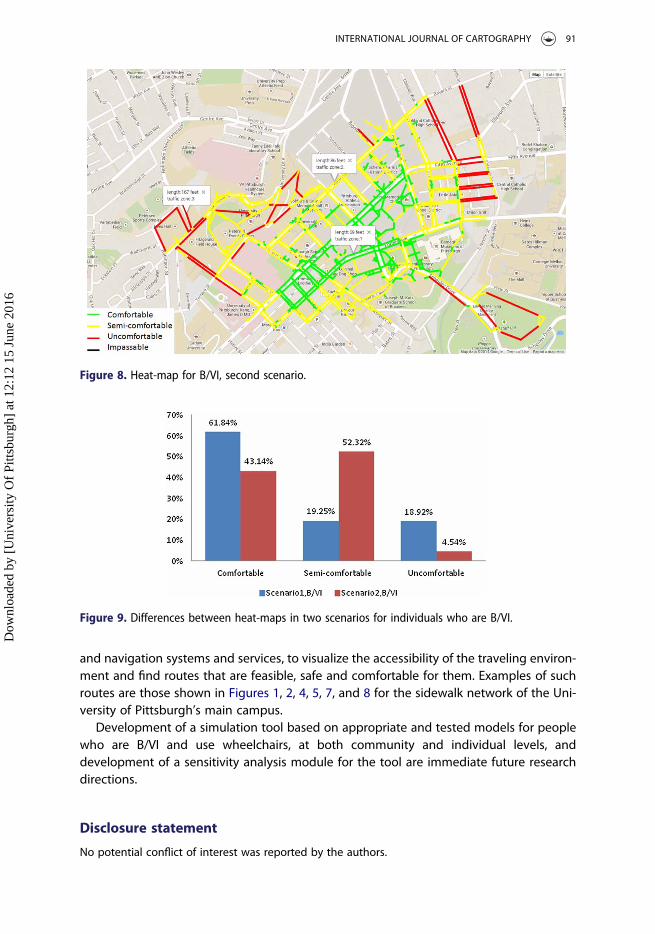
Figure 9 shows the differences between the two personalized heat-maps for individualswho are B/VI (Figures 7 and 8). As seen in Figure 9, the first scenario has more comfortablesegments, fewer semi-comfortable segments and more uncomfortable segments than thesecond scenario. Note that none of them has impassable segments.
Summary and future work
Accessibility of sidewalks for wayfinding of people with disabilities, in particular individualswho use wheelchairs and are B/VI, were simulated and visualized through heat-maps. Thissimulation and visualization approach can be used by urban planners to evaluate theaccessibility of the built environment and find the accessibility gaps and by people withdisabilities to find routes that are accessible to meet their needs and preferences,among others. In order to demonstrate how the proposed simulation methodologyworks and how the simulation results can be used, we employed a linear model and a
Figure 5. Heat-map for wheelchair users, second scenario.
INTERNATIONAL JOURNAL OF CARTOGRAPHY 89
Dow
nloa
ded
by [
Uni
vers
ity O
f Pi
ttsbu
rgh]
at 1
2:12
15
June
201
6

number of sidewalk segment characteristics as the model parameters. While any modelthat reflects human behaviors needs to be validated, primarily through subject testing,to assess its suitability, we did not validate this linear model since our main contributionin this work is to present a new methodology for evaluating the accessibility of sidewalksusing any validated, existing or new, models.
A simulation tool based on the proposed methodology, to simulate and visualize theaccessibility of the built environment, in particular sidewalk segments, needs to bebuilt. This simulation tool will include a sensitivity analysis module and should be ableto be integrated into existing and new software for planners and end users. Forexample, by integrating the tool with existing urban planning systems, urban plannerscan evaluate the accessibility of the built environment and find the accessibility gaps.An example application that benefits end users, in particular people with disabilities, isthat they will be able to use the simulation tool, integrated with existing wayfinding
Figure 6. Differences between heat-maps in two scenarios for wheelchair users.
Figure 7. Heat-map for B/VI, first scenario.
90 M. TAJGARDOON AND H.A. KARIMI
Dow
nloa
ded
by [
Uni
vers
ity O
f Pi
ttsbu
rgh]
at 1
2:12
15
June
201
6
and navigation systems and services, to visualize the accessibility of the traveling environ-ment and find routes that are feasible, safe and comfortable for them. Examples of suchroutes are those shown in Figures 1, 2, 4, 5, 7, and 8 for the sidewalk network of the Uni-versity of Pittsburgh’s main campus.
Development of a simulation tool based on appropriate and tested models for peoplewho are B/VI and use wheelchairs, at both community and individual levels, anddevelopment of a sensitivity analysis module for the tool are immediate future researchdirections.
Disclosure statement
No potential conflict of interest was reported by the authors.
Figure 8. Heat-map for B/VI, second scenario.
Figure 9. Differences between heat-maps in two scenarios for individuals who are B/VI.
INTERNATIONAL JOURNAL OF CARTOGRAPHY 91
Dow
nloa
ded
by [
Uni
vers
ity O
f Pi
ttsbu
rgh]
at 1
2:12
15
June
201
6
Notes
1. http://www.humanware.ca.2. http://www.senderogroup.com.3. http://www.ada.gov/2010ADAstandards_index.htm.4. https://developers.google.com/maps/documentation/javascript/tutorial.
Notes on contributors
Mohammadamin Tajgardoon is a graduate student at Intelligent Systems Program of the Univer-sity of Pittsburgh. He is interested in research related to machine learning and computer modelingand simulation.
Hassan A. Karimi is a professor and director of the Geoinformatics Laboratory in the School of Infor-mation Sciences at the University of Pittsburgh. His research is focused on Big Data, grid/distributed/parallel computing, navigation, location-based services, location-aware social networking, geospatialinformation systems, mobile computing, computational geometry and spatial databases.
References
Andrienko, N., & Andrienko, G. (2003). Informed spatial decisions through coordinated views.Information Visualization, 2(4), 270–285.
Beale, L., Field, K., Briggs, D., Picton, P., & Matthews, H. (2006). Mapping for wheelchair users: Routenavigation in urban spaces. The Cartographic Journal, 43(1), 68–81.
Benner, G. J., & Karimi, H. A. (2013). Geo-crowdsourcing. In H. A. Karimi (Ed.), Advanced location-basedtechnologies and services (pp. 145–165). Boca Raton, FL: CRC Press.
Fernandes, H., du Buf, J., Rodrigues, J. M. F., Barroso, J., Paredes, H., Farrajota, M., & José, J. (2011a). TheSmartVision navigation prototype for blind users. Journal of Digital Content Technology and ItsApplications, 5, 351–361.
Fernandes, H., Faria, J., Paredes, H., & Barroso, J. (2011b). An integrated system for blind day-to-day lifeautonomy. The proceedings of the 13th international ACM SIGACCESS conference on computersand accessibility, ACM, New York, NY, USA, pp. 225–226.
Golledge, R. G. (1999). Human wayfinding and cognitive maps. In R. G. Golledge (Ed.), Wayfindingbehavior: Cognitive mapping and other spatial processes (pp. 5–45). Baltimore, MD: The JohnsHopkins University Press.
Heath, G. W., & Fentem, P. H. (1996). Physical activity among persons with disabilities – a public healthperspective. Exercise and Sport Sciences Reviews, 2, 195–234.
Holone, H., Misund, G., & Holmstedt, H. (2007). Users are doing it for themselves: Pedestrian navigationwith user generated content. Next generation mobile applications, services and technologies(NGMAST’07), Cardiff, Wales, pp. 91–99.
Kammoun, S., Dramas, F., Oriolaand, B., & Jouffrais, C. (2010). Route selection algorithm for blind ped-estrian. Control Automation and Systems (ICCAS), 2010 international conference, Gyeonggi-do,South Korea, pp. 2223–2228.
Karimi, H. A., Dias, M. B., Pearlman, J., & Zimmerman, G. (2014). Wayfinding and navigation for peoplewith disabilities using social navigation networks. Transactions on Collaborative Computing, vol. 1,no. 2, p. e5.
Karimi, H. A., Jiang, M., & Zhu, R. (2013). Pedestrian navigation services: Challenges and currenttrends. Geomatica, 67(4), 259–271.
Karimi, H. A., Zhang, L., & Benner, J. G. (2013). Personalized accessibility maps (PAMs) for communitieswith special needs. In S. H. L. Liang, X. Wang, C. Claramunt (Eds.), Web and wireless geographicalinformation systems (pp. 199–213). Berlin: Springer.
Kasemsuppakorn, P., & Karimi, H. A. (2008, May 13–15). Data requirements and spatial database forpersonalized wheelchair navigation. 2nd International convention on rehabilitation engineering& assistive technology, Bangkok.
92 M. TAJGARDOON AND H.A. KARIMI
Dow
nloa
ded
by [
Uni
vers
ity O
f Pi
ttsbu
rgh]
at 1
2:12
15
June
201
6

Kasemsuppakorn, P., & Karimi, H. A. (2009). Personalised routing for wheelchair navigation. Journal ofLocation Based Services, 3(1), 24–54.
Kasemsuppakorn, P., Karimi, H. A., Ding, D., & Ojeda, M. A. (2014). Understanding route choices forwheelchair navigation. Disability and Rehabilitation: Assistive Technology, Vol. 10, No. 3, pp. 198–210.
May, A., Ross, T., Bayer, S., & Tarkiainen, M. (2003). Pedestrian navigation aids: Information require-ments and design implications. Personal and Ubiquitous Computing, 7(6), 331–338.
Millonig, A., & Schechtner, K. (2007). Decision loads and route qualities for pedestrians – key require-ments for the design of pedestrian navigation services. In Pedestrian and evacuation dynamics (pp.109–118), Berlin: Springer.
Neis, P., & Zielstra, D. (2014). Generation of a tailored routing network for disabled people based oncollaboratively collected geodata. Applied Geography, 47, 70–77.
Petrie, H., Johnson, V., Strothotte, T., Raab, A., Fritz, S., & Michel, R. (1996). MOBIC: Designing a travelaid for blind and elderly people. Journal of Navigation, 49, 45–52.
Rimmer, J. H., Riley, B., Wang, E., Rauworth, A., & Jurkowski, J. (2004). Physical activity participationamong persons with disabilities: Barriers and facilitators. American Journal of PreventiveMedicine, 26(5), 419–425.
Sobek, A. D., & Miller, H. J. (2006). U-Access: A web-based system for routing pedestrians of differingabilities. Journal of Geographical Systems, 8(3), 269–287.
Volker, T., & Weber, G. (2008). RouteChecker: Personalized multicriteria routing for mobility impairedpedestrians. In The 10th international ACM SIGACCESS conference on computers and accessibility(pp. 185–192). Halifax, NS: ACM.
INTERNATIONAL JOURNAL OF CARTOGRAPHY 93
Dow
nloa
ded
by [
Uni
vers
ity O
f Pi
ttsbu
rgh]
at 1
2:12
15
June
201
6