simple and secure data encryption via molecular weight
TRANSCRIPT

1
Simple and secure data encryption via molecular weight distribution fingerprints
Jeroen Hendrik Vrijsen,[a]† Maarten Rubens,[a][b]† Tanja Junkers[a][b]*
[a] Hasselt University, Martelarenlaan 42, 3500 Hasselt (Belgium)
[b] Polymer Reaction Design Group, School of Chemistry, Monash University, 19 Rainforest Walk,
Building 23, Clayton, Vic 3800 (Australia)
† These authors contributed equally to the work
* E-mail: [email protected]
Abstract: A method for encryption and safe transmission of data in the shape of molecular weight distributions (MWD) is presented. Relatively simple individual distributions serve as the key to encode information by mixing those in known amounts to an overlapped MWD. Increasing molecular weights are used to denote the position of these individual sub-distributions, and the relative amount per sub-distribution is used to store data. The concept is demonstrated by a series of messages, whereby two-letter codes can be transmitted per overall MWD. In a final step, the encryption safety is demonstrated. Due to the inherent differences in SEC calibrations, samples sent from Australia to Belgium could only be deconvoluted when the recipient of the message was in possession of the physical sub-distributions, which then act as encryption key.
Electronic Supplementary Material (ESI) for Polymer Chemistry.This journal is © The Royal Society of Chemistry 2020

2
Table of Contents
A. Experimental Procedures
A.1 Materials 3
A.2 Poly(styrene) polymerization 3
B. Measurements and Analysis
B.1 Size Exclusion Chromatography (SEC) 4
B.2 Encryption Principle 4
B.3 Decryption Principle 5
C. Supplementary Results
C.1 Theoretical Validation of the Decryption method 6
C.2 Polymerization via Thermal RAFT 7
C.3 Results of Deconvolution
C.3.1 “PRD!” 9
C3.2 “”TURING” 10
C3.3 “STAUDINGER” 11
C3.4 “WORLD!” at Monash University in Melbourne Australia 13
C3.5 WORLD!” at Hasselt University in Diepenbeek Belgium 14
D. References 15
E. Author Contributions 15

3
A. Experimental Procedures
A.1 Materials
Styrene (S) (Acros, 99%) was deinhibited over a column of activated basic alumina, prior to use. 1,1’-azobis(isobutyronitrile) (AIBN) (Sigma-Aldrich, 98%) was recrystallized twice from methanol prior to use. The RAFT agent, 2-(dodecylthiocarbonothioylthio)propionic acid (DoPAT)) was synthesized according to a literature procedure.[1] Toluene (Chem-Supply) was used as received. A.2 Poly(styrene) polymerization
Figure S1. Detailed schematic description of the styrene polymerization by thermal RAFT.
In a typical polymerization, styrene monomer (4M, eq. degree of polymerization) is weighted in a septum closed 25 mL round bottom flask together with the right equivalent of RAFT agent (DoPAT, 1 eq.) and thermal initiator AIBN (0.1 eq). Afterward, the solvent, toluene is added to obtain 15 mL as the final volume. Next, the solution is flushed with argon (Ar) stream for 15 minutes to remove all residual oxygen. Finally, the flask is transferred to a 100 °C oil bath for 6 hours. Afterward, pure poly(styrene) polymer is obtained by precipitation in ice-cold methanol.
Table 1. Styrene RAFT polymerization at 100 °C for 6 hours in batch.
Target degree of polymerization
[styrene] / [DoPAT]
V(styrene) / mL
m(DoPAT) / mg
m(DoPAT) / mg
V(toluene) / mL
40 100 6.875 210.4 14.7 8.126
60 208 6.875 101.1 7.1 8.126
100 520 6.875 40.5 2.8 8.126
150 950 6.875 22.1 1.5 8.126
225
1714 6.875 12.3 0.86 8.126
O
OHS
S
SC12H25
DoPATStyrene (S)
HO
O
S S
S
C12H25n
Poly(styrene) (PS)
+
Batch reactor100 °C, 6h
conc. (S) 4M,Vol. 15 mL

4
B. Measurement and analysis
B.1 Size Exclusion Chromatography (SEC)
Analysis of the molar mass (distributions) of the oligomer samples at Monash University in Melbourne Australia was performed on a PSS SECcurity2 GPC system operated by PSS WinGPC software, equipped with an SDV 5.0 μm guard column (50 x 8 mm), followed by three SDV analytical 5.0 μm columns with varying porosity (1000 Å, 100000 Å, and 1000000 Å) (50 x 8 mm) coupled to a differential refractive index (RI) detector and viscosity detector DVD1260 using THF as the eluent at 40°C with a flow rate of 1 mL·min-1 delivered by an isocratic pump. The SEC system was calibrated using linear narrow polystyrene standards ranging from 474 – 7.5 x 10⁶ g·mol-1. For analysis of the molar mass distributions at Hasselt University in Diepenbeek Belgium a Tosoh EcoSEC HLC-8320GPC was employed consisting out of an autosampler, PSS guard column SDV (50× 7.5 mm) and three PSS SDV analytical linear XL columns (5 μm, 300 × 7.5 mm) and a differential refractive index detector (Tosoh EcoSEC RI). The column temperature was maintained at a steady 40°C and a flow rate of 1 mL∙min-1 of high-performance liquid chromatography (HPLC) grade tetrahydrofuran (THF) was used as eluent with toluene as flow marker. Calibration was performed using linear narrow polystyrene (PS) standards from PSS Laboratories in the range of 470-7.5 × 10⁶ g∙mol-1.
B.2 Encryption Principle
Variations of polymer mass relative to a standard in a mixture of polymers with varying number average degree of polymerization (DPn) are used to code information in the current work. Six mass levels were chosen and a combination of two mass levels (two polymers) translates into one letter as demonstrated in figure S2A. A combination of level 3 and level 4 translates for the letter “P” while level 3 and 6 are used to code the letter “R”. These mass levels are defined relative to a polymer standard that is arbitrarily set at 100% as a reference as shown in figure S2B. For example level 1 is related to a mass fraction of 45% relative to a standard (e.g. 5mg of polymer used as standard mixed with 2.25 mg of polymer used to code a mass level), level 2 is set at 75% (5 mg of standard mixed with 3.75mg of polymer to code a mass level). Every level is distinguished by an acceptable concentration range of 30%. To code two letters in one molecular weight distribution, we need five polymers – one polymer used as standard and two times two polymers to define a letter each. In figure S2C the theoretical mass increment targets are demonstrated. In practical terms, 100% (5.0 mg) of the first polymer is used as the standard. Next, the second polymer is mixed as 105 % (level 3, range 90 – 120%, 5.25 mg), the third polymer as 135% (level 4, range 120 – 150%, 6.75 mg), the fourth polymer as 105% (level 3, range 90-120%, 5.25mg) and the fifth as 195% (level 6, range 180%-210%, 9.75 mg). Figure S2D shows the theoretical mixture of these polymers.
Figure S2. Detailed schematic description of the coding principle. (A) Coding table used to translate 6 relative mass increments of two polymer sub-distributions (hence two levels) into one letter. (B) Definition of 6 mass levels connected to increments of polymer distributions relative to a standard distribution. (C) The theoretical mixture of 5 polymers to form the letters “P” and “R”. (D) Theoretical MWD distribution after mixing DP40, DP60, DP100, DP 150 and DP225 in the ratio defined in (C).

5
B.3 Decryption Principle
Figure S3. Flowchart demonstrating the deconvolution principle with the custom made python script.
A refractive index detector (as used in the current work) is a concentration sensitive detector often used in SEC. The concentration of a certain (polymer)material is directly proportional to peak integration. When the refractive index increment (dn/dc) of the material is also known one can even calculate the concentration of the material in the measured solution. For this reason, we are also able to deconvolute a complex SEC trace back to its original sub-distributions and derive their relative quantities within the mixture. To achieve this a custom python script was developed which is available free of charge as part of the electronic supporting information. For the deconvolution, a number distribution overlay of the individual composing traces with the mixture trace is loaded into the program. The individual composing traces are randomly fitted against 5 Gaussians per trace using the “Lmfit” package for Python using the Nelder-Mead fitting method. By using 5 gaussian fits we can compensate for SEC effects or unusual shape of the composing trace. These fits of the sub-distributions are then used to fit the code trace with a similar fitting method by only allowing the amplitude of the separate composing traces to be varied. With these best fits, the ratios of all contributing traces are calculated (by integration). This ratio is used as an initial guess which is used to further finetune the ratios within allowed boundaries using the experimental contributing SEC traces instead of the fits. This step increases the accuracy of the deconvolution since any additional SEC inaccuracy is included in the deconvolution. For each possible combination, the root means square error (RMSE) is calculated between the experimental code trace and the calculated combination. The variation with the lowest RMSE (usually between 0.5 and 2%) is used to derive the coded information by again calculating the ratio of each peak integration with the integration of the standard peak (the first peak). From these ratios, the mass level of each contributing distribution is determined using table S2B. Next, these levels are to decode the letters present in the mixture.

6
C. Supplementary Results
C.1 Theoretical validation of the decryption method
Table S1. Validation of mixing strategy with a DP10 spacing. Comparing simulated MWD distribution with equal mass fraction and the deconvoluted calculated mass fractions using the Gaussian fit method and the experimental method.
Polymer[a] Simulated Mass fraction
Initial guess Finetuned result
DP 40 100% 100% 100%
DP 50 99.98% 72.31% 90%
DP 60 99.94% 140.01% 120%
DP 70 99.9% 31.37% 65%
DP 80 99.92% 143.33% 130%
DP 90 99.89 76.87% 85%
Table S2. Validation of mixing strategy with a DP15 spacing. Comparing simulated MWD distribution with equal mass fraction and the deconvoluted calculated mass fractions using the Gaussian fit method and the experimental method.
Polymer[a] Simulated Mass fraction
Initial guess Mass fraction
Finetuned result Mass fraction
DP 40 100% 100% 100%
DP 55 99.97% 91.53% 100%
DP 70 99.9% 107.46% 100%
DP 85 99.85% 83.42% 100%
DP 100 99.85% 108.68% 100%
DP 115 99.85% 93.10% 100%
Table S3 Validation of mixing strategy with a DP20 spacing. Comparing simulated MWD distribution with equal mass fraction and the deconvoluted calculated mass fractions using the Gaussian fit method and the experimental method.
Polymer[a] Simulated Mass fraction
Initial guess Mass fraction
Finetuned result Mass fraction
DP 40 100% 100% 100%
DP 60 99.94% 97.92% 100%
DP 80 99.92% 100.29% 100%
DP 100 99.85% 97.27% 100%
DP 120 99.84% 100.24% 100%
DP 140 99.78% 98.58% 100%

7
C.2 Polymerization via Thermal RAFT
Table S4. Experimental details of the poly(styrene) RAFT polymerization
polymer[a] Mn, SEC[a]
(g∙mol-1) Đ
DP 40 3300 1.13
DP 60 5100 1.16
DP 100 9900 1.15
DP150 16700 1.18
DP 225 22900 1.19
[a] calibrated against narrow polystyrene standards
Figure S4. Overlay of all sub-contribution traces used for constructing the code mixture.
8
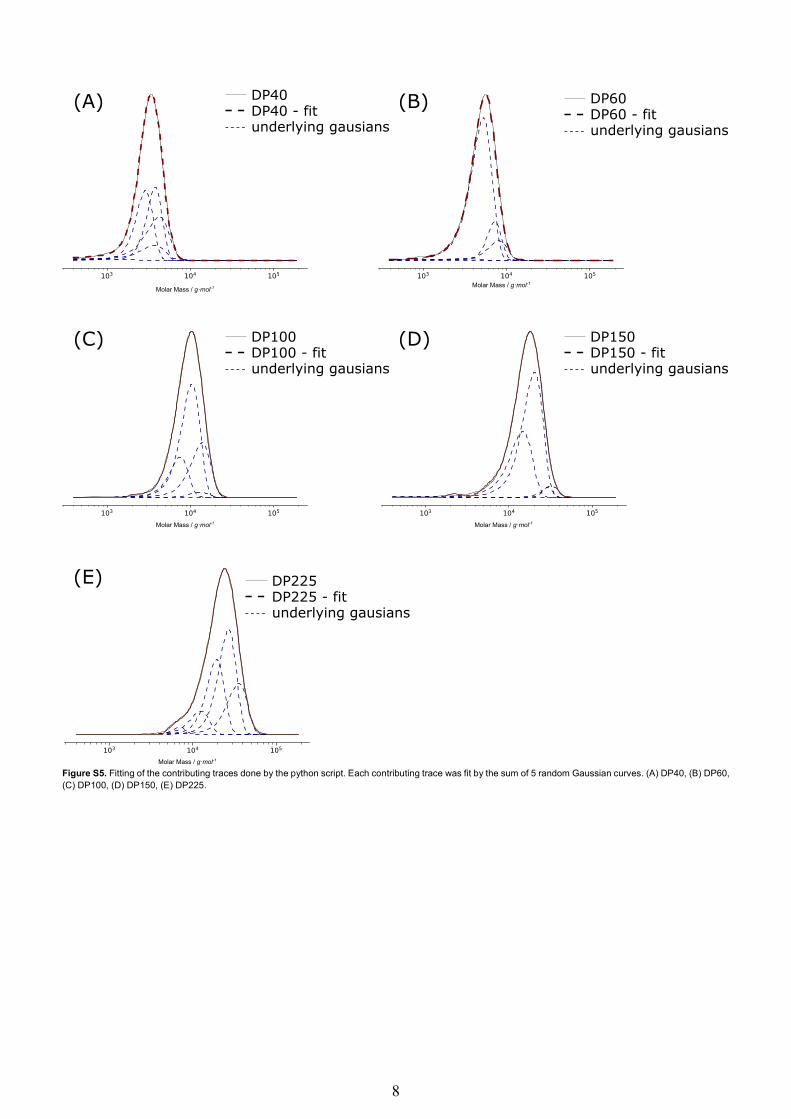
Figure S5. Fitting of the contributing traces done by the python script. Each contributing trace was fit by the sum of 5 random Gaussian curves. (A) DP40, (B) DP60, (C) DP100, (D) DP150, (E) DP225.

9
C.3 Results of Deconvolution
C.3.1 “PRD!”
Figures S6 Overall distributions and deconvolution of the sub-distributions resulting in the letter sequence ‘PRD!’ following the coding concept in Figure S2

10
C.3.2 “TURING”
Figures S7 Overall distributions and deconvolution of the sub-distributions resulting in the letter sequence ‘TURING’ following the coding concept in Figure S2

11
C.3.3 “STAUDINGER”
Figures S8 Overall distributions and deconvolution of the sub-distributions resulting in the letter sequence ‘STAUDINGER’ following the coding concept in Figure S2

12
C3.4 “WORLD!” at Monash University in Melbourne Australia
Figures S9 Overall distributions and deconvolution of the sub-distributions resulting in the letter sequence ‘WORLD!’ measured in Monash University Melbourne Australia following the coding concept in Figure S2

13
C.3.5 “WORLD!” at Hasselt University in Diepenbeek Belgium
Figures S10 Overall distributions and deconvolution of the sub-distributions resulting in the letter sequence ‘WORLD!’ measured in Hasselt University Diepenbeek Belgium following the coding concept in Figure S2

14
D. References
[1] C. J. Ferguson, R. J. Hughes , D. Nguyen, B. T. T. Pham, R. G. Gilbert , A. K. Serelis, C.H. Such and B.S. Hawkett, Macromolecules 2005, 38, 2191- 2204.
E. Author Contributions
M.R. and J.H.V. contributed equally to the full extent of this work, ranging from the experimental setups, data acquisition, and interpretation, analysis as well as validation, to the writing of the manuscript. T.J. was involved in the discussions, responsible for funding acquisition and project administration.