simca - int-res.com · marine ecology - progress series ... investigate diets of juvenile atlantic...
TRANSCRIPT
Vol. 26: 145-156, 1985 MARINE ECOLOGY - PROGRESS SERIES
Mar. Ecol. Prog. Ser. Published October 7
SIMCA pattern recognition classification of five infauna taxonomic groups using non-polar
compounds analysed by high resolution gas chromatography
Center for Industrial Research (SI), Forskningsveien 1, P.B. 350, Blindern, 0314 Oslo, Norway Dept. of Marine Biology, University of Oslo. Blindern. 0314 Oslo, Norway
ABSTRACT: Five infauna groups at 3 taxonomic levels - nematodes, polychaetes, oligochaetes, ostracods, copepods - were selected for an investigation on the feeding habits of juvenile (Stage IV) lobsters. As part of this study a method was developed to identify these 5 infauna groups by their natural composition of non-polar compounds using a simple derivatization/extraction step, High Resolution Gas Chromatography (HRGC) with Flame Ionisation Detection (FID), and pattern recogni- tion by the method of Soft Independent Modelling of Class Analogy (SIMCA). The peak pattern of 20 naturally occurring compounds found in all samples were compared by principal component analysis using SIMCA. The 20 peaks and the 5 infauna groups were identified and classified. The method allows for comparison of samples of infauna groups from their HRGC patterns; it was used to correct a sample of questionable origin and to identify particular fatty acids with relevance to the classification of the 5 infauna groups. Interpretation of variable loading plots of separate sample classes are suggested and future possibilities of chemometric applications in marine biological and environmental studies are suggested.
INTRODUCTION
Lipids have been suggested as the best group of compounds to use when chemotaxonomically classify- ing bacteria (Shaw 1974). Lipid compounds fulfil 3 basic criteria for chemotaxonomic use. They are: abun- dant in all organisms; readily analysed by available simple methods; present in a large number of different forms (Shaw 1974). The largest group of lipid com- pounds are the fatty acids. The simple fatty acids and non-polar organic compounds, i.e. saturated and unsaturated, straight chain and branched, fatty acids and hydrocarbonaceous material, are present in biological systems in great variety and amount. Despite this, fatty acids have previously been used to investigate diets of juvenile Atlantic menhaden Bre- voortia tyrannus (Jeffries 1975), and to characterize benthic microbial community structures (Bobbie & White 1980). This work has depended on identifying lipid compounds specific to a group of species and often involves separation and identification of small
amounts of particular lipid components. Jeffries (1979) used simple fatty acid compounds and correspondence analysis to investigate seasonal changes in marine communities. Recently, multivariate pattern recogni- tion has become a method in widespread use for solv- ing problems where more than 2 variables (parame- ters) must be accounted for simultaneously (Wold et al. 1983a, Smith et al. 1985). Multivariate analysis by the method of SIMCA (Soft Independent Modelling of Class Analogy) (Wold et al. 1984), using naturally occurring compounds present in organisms, has been used to show differences between pollution-influenced and clean blue-mussels (Grahl-Nielsen et al. 1983). The technique of multivariate pattern recognition by SIMCA in chemical data which describe natural marine biological systems has been used by the laboratory at Fladevigen Biological Station in a mul- tivariate chemotaxonomic classification of l d old eggs of cod Gadus morhua (L.) and haddock Melano- grammus aeglefinus ( L . ) (Knutsen et al. in press).
As part of an investigation into the feeding habits of
O Inter-Research/Printed in F. R. Germany
146 Mar. Ecol. Prog. Ser. 26: 145-156, 1985
juvenile (Stage IV) lobsters Homarus gammarus, 5 infaunal groups suspected of being potential prey were selected and the fatty acids chemically derivatized to methyl esters (Knutsen & Vogt 1985). The non-polar fraction, extracted with hexane from the acidic methanol used as derivatizing reagent, was analysed by High Resolution Gas Chromatography (HRGC) using Flame Ionisation Detection (FID). The intention was to develop a simple identification method for infauna which could supplement the visible identifica- tion by microscopy of stomach contents, and which was chemically simple and rapid to perform. The results on feeding patterns of juvenile lobsters will be presented separately (Knutsen & Vogt 1985).
The present paper discusses some aspects of chemi- cal analysis coupled with pattern recognition by the method of SIMCA in the field of marine biology/ecol- ogy using results from the classification of 5 infauna groups.
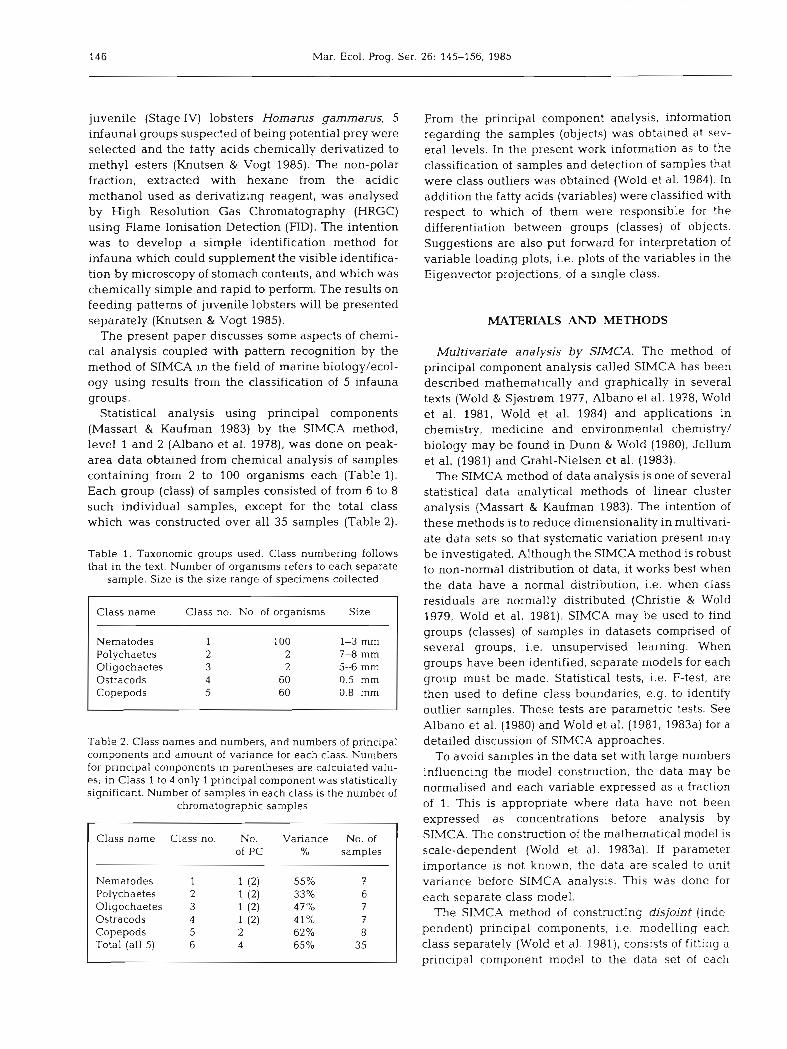
Statistical analysis using principal components (Massart & Kaufman 1983) by the SIMCA method, level 1 and 2 (Albano et al. 1978), was done on peak- area data obtained from chemical analysis of samples containing from 2 to 100 organisms each (Table 1). Each group (class) of samples consisted of from 6 to 8 such individual samples, except for the total class which was constructed over all 35 samples (Table 2).
Table 1. Taxonomic groups used. Class numbering follows that in the text. Number of organisms refers to each separate
sample. Size is the size range of specimens collected
Class name Class no. No. of organisms Size
Nematodes 1 100 1-3 mm Polychaetes 2 2 7-8 mm Oligochaetes 3 2 5-6 mm Ostracods 4 60 0.5 mm Copepods 5 60 0.8 mm
Table 2. Class names and numbers, and numbers of principal components and amount of variance for each class. Numbers for principal components in parentheses are calculated valu- es; in Class 1 to 4 only 1 principal component was statistically significant. Number of samples in each class is the number of
chromatographic samples
Class name Class no. No. Variance No. of of PC % samples
Nematodes 1 1 (2) 55% 7 Polychaetes 2 1 (2) 33% 6 Oligochaetes 3 1 (2) 47% 7 Ostracods 4 1 (2) 4 1 % 7 Copepods 5 2 62% 8 Total (all 5) 6 4 65 % 35
From the principal component analysis, information regarding the samples (objects) was obtained at sev- eral levels. In the present work information as to the classification of samples and detection of samples that were class outliers was obtained (Wold et al. 1984). In addition the fatty acids (variables) were classified with respect to which of them were responsible for the differentiation between groups (classes) of objects. Suggestions are also put forward for interpretation of variable loading plots, i.e. plots of the variables in the Eigenvector projections, of a single class.
MATERIALS AND METHODS
Multivariate analysis by SIMCA. The method of principal component analysis called SIMCA has been described mathematically and graphically in several texts (Wold & Sj~s t ram 1977, Albano et al. 1978, Wold et al. 1981, Wold et al. 1984) and applications in chemistry, medicine and environmental chemistry/ biology may be found in Dunn & Wold (1980), Jellum et al. (1981) and Grahl-Nielsen et al. (1983).
The SIMCA method of data analysis is one of several statistical data analytical methods of linear cluster analysis (Massart & Kaufman 1983). The intention of these methods is to reduce dimensionality in multivari- ate data sets so that systematic variation present may be investigated. Although the SIMCA method is robust to non-normal distribution of data, it works best when the data have a normal distribution, i.e. when class residuals are normally distributed (Christie & Wold 1979, Wold et al. 1981). SIMCA may be used to find groups (classes) of samples in datasets comprised of several groups, i.e. unsupervised learning. When groups have been identified, separate models for each group must be made. Statistical tests, i.e. F-test, are then used to define class boundaries, e.g. to identify outlier samples. These tests are parametric tests. See Albano et al. (1980) and Wold et al. (1981, 1983a) for a detailed discussion of SIMCA approaches.
To avoid samples in the data set with large numbers influencing the model construction, the data may be normalised and each variable expressed as a fraction of 1. This is appropriate where data have not been expressed as concentrations before analysis by SIMCA. The construction of the mathematical model is scale-dependent (Wold et al. 1983a). If parameter importance is not known, the data are scaled to unit variance before SIMCA analysis. This was done for each separate class model.
The SIMCA method of constructing disjoint (inde- pendent) principal components, i.e. modelling each class separately (Wold et al. 1981), consists of fitting a principal component model to the data set of each

Vogt & Knutsen: SIMCA pattern recognition of taxonomic groups 147
Class number: 1 Class name: Nematodes Class RSD (p = 0.05): 0.8952 Class SRD (p = 0.01): 1.0101
Object Name Number RSD PC1 PC2
NEMl 1 0.2993 -0.74 -0.86 NEM2 2 0.4496 - 1.67 -2.87 NEM3 3 0.4962 0.40 -0.79 NEM4 4 1.0759 -0.31 -1.23 NEM5 5 0.6527 0.14 0.09 NEM6 6 0.6922 0.26 -0.66 NEM7 7 0.7178 0.48 0.02
Class number: 2 Class name: Polychaetes Class RSD (p = 0.05): 1 .l 122 Class RSD (p = 0.01): 1.2677
POLl 15 1.1485 -0.27 1.63 POL2 16 0.7161 0.76 2.84 POL3 17 0.4348 -0.22 3.53 POL4 18 0.3143 0.57 5.17 POL5 19 0.821 1 0.19 2.4 1 POL6 20 1.1035 -0.11 2.79
Class number: 3 Class name: Oligochaetes Class RSD (p = 0 05): 0.9823 Class RSD (p = 0.01): 1.1042
OLl l 21 0.7915 -4.05 0.79 OL12 22 0.7449 -4.66 1.08 OL13 23 0.6473 -3.66 -0.56 OL14 24 0.5290 -3.69 - 0.39 OL15 25 0.8428 -3.78 1.83 OL16 26 0.6982 -2.80 1.42 OL17 27 0.7570 -3.40 1.81
Class number: 4 Class name: Ostracods Class RSD: (p = 0.05): 1.0420 Class RSD: (p = 0.01): 1.1720
OSTl 50 0.8661 -0.35 -2.17 OST2 51 0.2851 -1.14 - 3.24 OST3 52 0.6032 -0.52 -2.65 OST4 53 0.5439 -0.79 -2.72 OST5 54 1.0676 -1.00 -2.28 OST6 55 1.0968 -1.04 -2.74 OST? 56 0.5242 -0.09 -1.92
Class number: 5 Class name: Copepods Class RSD (p = 0.05): 0.8295 Class RSD (p = 0.01): 0.9293
COP1 57 0.6876 3.83 -0.04 COP2 58 0.6839 3.88 0.19 COP3 59 0.3843 3.75 0.36 COP4 60 0.9649 4.24 - 0.33 COP5 61 0.6398 3.83 0.38 COP6 62 0.3824 4.21 -0.76 COP7 63 0.4989 3.77 0.06 COP8 64 0.4389 3.98 0.03
different class (group) of samples when the classes Table 3 . The 5 separate polished class models. The residual
have been identified. The number of principal compo- standard deviation for appropriate degrees of freedom and
nents to be used for a specific class model may be confidence intervals are tabulated. The principal component
determined either statistically or from evaluation of the data apriori by setting a limit on how much of the variance in the data it is necessary to describe. An alternative approach is to evaluate the information in the object score and variable loading plots of principal components, and from this determine which principal components contain information relevant to the prob- lem in question (K. Esbensen pers. comm.). There are, however, situations where the number of principal components must be balanced against the number of objects/variables, i.e. if too few objects/variables are present or too many principal components are con- structed there will not be any dimension reduction.
The number of principal components which are termed statistically significant is determined by cross validation (Wold 1978). The intention of cross valida- tion is to determine if the last principal component describes more systematic information in the data. The number of statistically significant principal compo- nents that are found from cross validation often con- tains information on the number of different chemical or biological systems (e.g. classes/variable groups) present in the problem being analysed (Wold et al. 1983a). It was decided to use cross validation to deter- mine the number of statistically significant principal components, but for visual evaluation of plots of the individual classes it is necessary to calculate at least 2 principal components.
The models constructed seldom describe all the var- iance present in a data set. The left-over (residual, 'unexplained') variance of a class model is caused partly from 'noise' in the data set and partly from the model restrictions (Wold et al. 1983a). The residual variance may be used to define boundaries (hyper- spheres, envelopes) (Wold et al. 1983a) of different significance levels around the class model. Object residual standard deviation (RSD, see Table 3) is the residual, i.e. left-over ('unexplained'), standard devia- tion for an object when comparing it to a class model. This number may be compared to class residual stan- dard deviation using an approximate F-test with appropriate levels of confidence (class RSD, p = 0.05 and p = 0.01). Objects with residual standard devia- tion above the critical value (class RSD in Table 3) may be considered as outliers (Wold & Sjerstram 1977), i.e. detected as samples not belonging to a group (Wold et al. 1984). If objects are found not to belong to their assigned classes and are at the same time found to fit to another class, then they should either be included in the other class or at least deleted from the assigned class. The amount of variance described by the number of calculated statistically significant principal compo-
values (PC1 & PC2) are those which must be used to position objects in Fig. 2

148 Mar. Ecol. Prog. Ser. 26: 145-156, 1985
nents tells how much of the total variance in the actual class has been incorporated into the model con- structed. This is a measure of how well the model describes the class and is also used in calculating the modelling power (intra-class description) and dis- criminating power (inter-class discrimination) for the variables. Class distance between groups of samples is a measure, in the multivariate space, of how far sepa- rated classes of samples are. In the SIMCA method a class distance between groups of objects above 3.0 is regarded as significant to identify 2 groups of samples as different classes (Wold et aI. 1981). The same nu- merical value applies to the discrimination power (class discrimination) significance of variables. For the modelling power significance of variables, a value above 0.3 is considered necessary (Wold et al. 1981). When comparing 2 classes a combination of low dis- crimination and modelling power may qualify for the deletion of this variable. Construction of new (polished) class models must be done if either an object is deleted or if over 30 % of the variables used to describe the class have been deleted (Wold & Sjestrem 1977).
The principal components constructed may be used either to plot the objects analysed (object score plots) or to plot the variables analysed (variable loading plots). In the last case the variable loading values along the principal components (Eigenvectors) (Wold et al. 1984) are used as coordinates. The variable load- ing plots contain information on the covariance between variables used to construct the principal com- ponent model.
Collection of species. The sediment from which the organisms were sampled was collected in Fledevigen, a small unpolluted bay on the southern coast of Nor- way close to the Biological Station Fledevigen. The
sediment was collected by scraping the upper 2 to 3 cm of sand in the bay and transfering this to a bucket. In the laboratory the sediment was allowed to deteriorate (Fenschel pers. comm.). To concentrate the motile organisms in the upper layer the sediment was allowed to stand with water having 2 to 3C0 higher tempera- ture. Motile organisms present in the sediment then migrate and concentrate in the upper part of the sand. After 24 h the upper layer of sediment, now concen- trated in organisms, was transfered to small cups and the organisms collected by pipetting volumes of sus- pended material onto a millipore membrane filter. From the membrane filters the organisms were then sorted and transfered to test tubes by using a 25X stereo microscope and tweezers. The organisms were not identified to species level, but only according to taxa (named group divisions) (see Table 1). Because of the size differences between the groups, a preliminary investigation was carried out to find the necessary number of organisms to collect for chemical analysis to be possible. These preliminary samples have been included in the classes of samples. Table 1 shows the number of organisms collected for each object (sam- ple), the size range of the organisms collected, and the class (group of samples) numbering as referred to later in the text. Table 2 gives the number of objects in each class.
Chemical method. The chemical analytical method has been adopted from Jantzen (1976), simplified and modified to suit the purpose. The collected samples of whole animals in each test tube were subject to depolymerisation and methyl esterification (derivati- zation) in 1.5 m1 anhydrous 2N HCl in methanol at 90 to 100 "C for 12 h. This procedure depolymerises tissue and methyl esterifies both free and bound fatty acids (Christie 1983). The derivatized sample mixtures were
Table 4. HRGC-MS and confirmed Fame (Supelco 5436) standard identification of peaks. Peak numbering coincides with the final 20 peaks selected, those 2 peaks deleted are marked with + The peaks identified as fatty acid methyl esters (Fame) without giving a structure have been so on the occurence of m/e 74 and m/e 87 in mass spectrometry. Branching points and unsaturated points are only tentatively positioned. Compounds Identified as alkene/alcohol and propylate are only suggestions based on
mass spectral data. B: branched structure; MW: molecular weight
Peak no. Compound Peak no. Compound
+ C - l5:O (B) MW:256 10 C - 1 8 : l MW:296 + C - 15:O (B) MW:256 11 C-18:O MW:298 1 C - 15 :0 (B) MW:256 12 (Propylat, mle : 71 & 75) 2 C - 15:O MW:256 13 C - 1 9 : l MW:310 3 C - l 6 : 1 11) MV.268 14 Not identified 4 Not identified 15 C - 2 0 . 1 MW:324 5 C - 16:O MW:270 16 C - 2 0 . 0 MW:326 6 C - 1 7 : l MW:282 17 (Alkene/alcohol) 7 C - 17:O (B) MW:284 18 (Alkenelalcohol) 8 C - 1 7 : l MW.282 19 FAME 9 C - 18:2 MW:294 20 C - 2 1 . 0 MW:340

Vogt & Knutsen: SIMCA pattern recognition of taxonomic groups 149
Fig. 1. Gas chromatograms of the extracted material from the 5 classes analysed by SIMCA. (A) nematodes, (B) polychaetes, (C) oligo- chaetes, (D) ostracods, (E) copepods. The peaks marked in (E) are those selected for SIMCA analysis. Conditions for analysis were splittless injection (250°C, 30 S). Camer gas flow 1.8 m1 min-I (150°C) of nitrogen. Make-up gas 31.5 m1 min-l. Detection by FID at 300°C (H2 and air). Attenuation was 8. Temperature program is
given below

150 Mar Ecol. Prog. Ser.
then cooled to room temperature and extracted twice with 1 m1 volumes of HPLC grade hexane (Rathburn Chemicals, Scotland). Care was taken not to include any of the methanolic HC1 with the extract. The 1.5 to 2.0 m1 extract was evaporated to 40 p1 using a constant stream of pure nitrogen at 35 "C. From this 2.3 ~1 were injected into a 25 mm, 0.33 mm i.d., SE-54 (0.17 pm phase thickness) fused silica capillary column by using an HP 7670A autoinjector mounted on an HP 5880 Gas Chromatograph. Integration was done by the elec- tronic integrator coupled to the GC-FID and peak areas used. Injection was by splittless injection on a splitt/ splittless injector (Jennings 1981). The chromatog- raphic conditions and the temperature program are given in Fig. 1. Blank samples consisting of 2N HC1 only in anhydrous methanol were treated by the entire procedure and analysed together with the infauna samples. Apart from the preliminary samples analysed to obtain an idea of the number of organisms to collect in each separate sample of nematodes, ostracods and copepods, the samples were not randomised with respect to class during analysis.
High Resolution Gas Chromatography-Mass Spec- trometry (HRGC-MS) was done on a HP-5985A quad- ropole instrument by 70 eV electron impact. The iden- tification of compounds was based in part on prelimi- nary identification by using retention times and com- paring these with a Fatty Acid Methyl Ester (FAME) standard (Supelco 5436). Subsequent analysis by HRGC-MS using the National Bureau of Standards (NBS) 8 peak library and manual interpretation of mass-specters gave the identifications listed in Table 4.
RESULTS
Chemical
Between 2 and 100 organisms were collected for each sample. The derivatization mixture was found to give a clear solution of all samples except for ostracods and copepods, where the shell was to some degree resistant to this acidic treatment. The 1 : 1.5 extraction from acidic methanol with hexane was found to give good extraction of esterified fatty acids and other non- polar organic compounds. No quantitative measure- ments of extraction efficiency were made. Blank sam- ples showed only few minor peaks, 0.1 to 0.5 area %, present at retention times coinciding with some of the major peaks, except for the first 2 variables where contamination in blank samples did exceed 10 %. Fig. 1 shows the 5 chromatograms from the selected groups; peaks selected for SIMCA analysis are marked on the chromatogram for copepods (Fig. 1 E). There was an ample amount of organic material present in
each sample. The peaks selected for SIMCA analysis have been identified using HRGC-mass spectrometry. Table 4 gives the peak numbers and the identifications found by using a Fatty Acid Methyl Ester (FAME) (Supelco 5436) standard and an HP 5985A HRGC-MS and the library search option available on this. From the preliminary sampling and analysis, the number of organisms to collect in each separate sample was determined (Table 1).
Twenty-two peak areas for selected peaks found in all 35 chromatograms of the 35 samples analysed were used for multivariate analysis.
Multivariate and biological
The data from the chemical analyses were ordered by samples in a matrix where the samples were described by 22 peaks found in all 35 samples. The data are raw data in that they are not given as concen- trations.
The 35 samples may be divided into 5 classes of taxonomic groups as described in Table 1. From the preliminary data matrix, 2 variables were deleted because they had retention times which coincided with peaks found to have high concentrations in some of the blank runs (Var. No. 1 & 2). From this set of data, consisting of 35 samples (objects) and 20 parameters (variables), a principal component model for the total class data set and one for each of the 5 separate classes was constructed. Table 2 lists the number of principal components, the amount of variance described for each separate class, and number of samples in the 5 classes together with the total class. The amount of variance described as systematic varies between 33 % and 62 % for the single classes. This was to some degree expected. The different objects (samples) may be sam- ples consisting of different species. The number of principal components that are statistically significant in the total class is 4. These 4 significant, i.e. cross validated, principal components describe 65 % of the variance in the total class. If the number of statistically significant principal components is compared to Fig. 2 A, where the objects are plotted in Principal Components 1 and 2, it is seen that there are 4 visually different groups of objects present. This shows that the principal component model constructed for a number of statistically significant principal components, deter- mined by cross validation, does in fact describe a feature present in the data matrix. Two groups of objects are separated only poorly in the plot (Fig. 2 A). The same feature is present for the variable loading plot (Fig. 2 B).
From the total class model the classification of one of the objects preliminarily assigned to the polychaete

Vogt & Knutsen: SIMCA pattern recognition of taxonomic groups 151
Fig. 2. (A) Principal component plot of total class (Class 6) of all 5 object groups collected. Objects are marked with numbers. MF: 2 or more objects positioned on top of each other. Class boundaries illustrate classes and must not be taken as confidence intervals. (B) Plot of variable loading values in Eigenvectors 1 and 2. Group boundaries illustrate only and do not indicate mathematical boundaries. (C) Plot of variable loadings for Class5 (copepods) in Eigenvectors 1 and 2. Group boundaries only illustrate groups as described in text. Only those variables with visible grouping have been
drawn

152 Mar Ecol. Prog. Ser. 26: 1 4 5 1 5 6 , 1985
class was also suspected to be wrong. SIMCA analysis of the disjoint, i.e. separate, classes showed that 1 polychaete sample chromatogram had been mis- placed, and was in fact a copepod sample chromato- gram. This is also a point to be made. Of the objects analysed by SIMCA, one of each of Classes l (nematodes), 4 (ostracods) and 5 (copepods) are from the preliminary sampling. The chemical analysis must, therefore, be considered highly reproducible in the context described here. Table 3 lists the class residual standard deviation at 2 levels of confidence for each separate class and the object residual standard devia- tion together with the principal component scores used in Fig. 2. The residual standard deviation of each sam- ple may b e compared to the confidence intervals for its class using the appropriate levels of confidence (RSD- max., p = 0.05 & p = 0.01). From Table 3 it is seen that Object 4 (NEM 4) in Class l (nematodes) and Ob- ject 60 (COP 4) in Class 5 (copepods) may be consi- dered as outliers of their assigned classes. We have chosen to retain these samples within the assigned classes as they did not fit any other class, had only slightly larger residual standard deviation (RSD) than the critical value (Class RSD, p = 0.01) (Table 3), did not influence the visual class boundaries (Fig. 2), and because the number of samples in each separate class were relatively low already (Wold et al. 1981). Apart from these samples it was found from the principal component analysis of the total class (Class 6) that Samples 2 & 3 (NEM 2 & NEM 3) and Objects 8 & 11 (POL 1 & POL 4) fell outside the total class with p = 0.01, i.e. 99 % confidence interval. These samples have not been deleted. The total class is not homogeneous and the outliers only show that the
model for the total class does not describe all the information in the class even though the number of components is significant. The 4 samples are also clearly members of their own classes (Table 3). Table 5 shows the class distances between the 5 classes. All the values are well above 3.0, showing that there is suffi- cient difference between the natural non-polar chemi- cal compound patterns in all classes to differentiate samples consisting only of these 5 taxonomic groups. Fig. 2 A shows that for 3 of the classes a visual inspec- tion is enough to classify the objects. For the classes of ostracods and nematodes the class distance, although 22.2, is not so easily seen in the 'window' of Principal Components 1 and 2 which we have selected.
Fig. 2 B shows the variable loading plot from the SIMCA analysis of the total data matrix, in the axis of Principal Components (Eigenvectors) 1 and 2, and classifies variables into 4 (5) groups. Comparing vari- able group positions in Fig. 2 B with the classes of objects in Fig. 2 A it is seen that variables are sepa- rated into groups similar to the classes. These variable groups have been tabulated in Table 6. Fig. 2 C shows a similar variable loading plot for the copepod class where the number of statistically significant principal components was 2. Three groups of variables have been plotted, the rest are left out to simplify the plot and interpretation, but have been included in calcula- tion of principal components.
DISCUSSION
Chemical analysis of fatty acids by total derivatiza- tion using 2N HC1 in anhydrous methanol has previ-
Table 5. Class distances between groups of samples (classes) calculated using the class distance method available in the SIMCA program
Class Nema- Poly- Oligo- Ostra- todes chaetes chaetes cods
Cope- pods
Nematodes (1) 1 7.6 12.4 21.6 22.2 Polychaetes (2) 7.6 1 7.4 14 .6 43.2 Oligochaetes (3) 12.4 7.4 1 42.2 50.8 Ostracods (4) 21.6 14.6 24.2 l 13.7 Cope pods (5) 22.2 43.2 50.8 13.7 1
Table 6. Variable numbers tabulated according to the class they describe best. For compound identification compare with Table 1
Class 1 Class 2 Class 3 Class 4 Class 5 Nematodes Polychaetes Ol~gochaetes Ostracods Copepods
11 14 1 6 1 6 4 13 5 15 17 2 8 9 7 18 20 3 10 12 19

Vogt & Knutsen: SIMCA pattern recognition of taxonomic groups 153
ously been used with success on fish eggs (Knutsen et al. unpubl.). The method is simple, rapid and selective for non-polar compounds and fatty acids. In addition, the one-step procedure of derivatization and extraction in test tubes requires little handling and therefore almost entirely excludes contamination possibilities. Quantitative analysis of extraction efficiency indicates that there is some difference in extraction of fatty acids from the methanolic mixture (Grahl-Nielsen pers. comm.). This is considered not to influence the results reported here as the SIMCA method relies on the description of relative composition, and the extraction efficiencies are expected to be the same for a given fatty acid in all samples. The data used were not corrected for amount of initial sample. To avoid the first principal component describing only a quantita- tive variation (Wold et al. 1983a), it was decided to normalise the data by summing to 1 over each sample in the data set and then representing the variables as fractions. This approach, although applied extensively, has been criticized by several workers (Johansson 1984) as it has the effect of 'closing' the data set. Closure gives erratic negative correlation between large and small variables. Several, more or less effec- tive, methods have been described for minimizing the problem of closure (Johansson et al. 1984, Grahl- Nielsen pers. comm.), but there seems to be no agree- ment on a uniform method. It was tried analysing the data without normalising, but this led to the models obtained describing the different classes less well than when the data had been normalised.
The principal component analysis of the 5 sample classes together and as separate classes shows that it is possible to distinguish visually and chemically between the taxonomic groups by using non-specific non-polar and fatty acid compounds analysed by a simple chemical method. This agrees with previous work by Bobbie & White (1980) and Findlay & White (1983), where specific indicator fatty-acids were used to characterize benthic microbial societies, and by Boon et al. (1978) and Federle et al. (1983), who used specific fatty acids as marker molecules in sedimentary environments.
The amount of variance in the total class described as statistically significant, using 4 principal compo- nents, is only 65 %. This implies that 35 % of the variance in the total class is non-systematic. This may again be the result of the samples in the 5 'subclasses' consisting of different species.
Principal component analysis uses the variance/ covariance matrix relation (Massart & Kaufman 1983) and the variables grouped together in the variable loading plot (Fig. 2 B, C) are highly correlated. These groups of variables are likely to be a result of chemical CO-occurrence of variables in different sample classes
(Massart & Kaufman 1983 p. 9, Wold et al. 1984). Fig. 2 B, and the interpretation suggested in the results and in Table 6, indicate that to separate the 5 classes it would only have been necessary to use 5 variables. This applies, however, only to the model of the total class, and considering that there were 5 individual 'sub-classes' present and that the intention was to develop a method of classifying and identifying sam- ples in an even more complex sample type (lobster stomachs), it was decided not to delete any variables. We suggest that grouping of this type may in future studies be used to select variables of interest for distin- guishing between classes of animals, or for investiga- tion of sample composition (Wold et al. 1983). This may be considered a supplement to chemical identification of special fatty acids of taxonomic interest by other methods such as those of Bobbie & White (1980).
The number of statistically significant principal components in the individual classes (Class 1 to 4) being 1, and Class 5 (copepods) being 2 (Table 2), suggests that there are most likely small analytical variations or possibly non-resolved subclasses present within each separate taxon grouping as we have defined them here. The copepod class (Class 5) was found to have 2 statistically significant principal com- ponents. This class has therefore been selected to examplify variable plot interpretation of a single class. Fig. 2 C, the variable loading plot for the copepod class, where only those variables which have a visible grouping pattern have been plotted, suggests 3 groups of variables to show covariance in this class. The group consisting of Variables 2, 3, 5, 6, 7 and 10 are fatty acids with chain lengths from C15 to C18. The group consisting of Variables 9, 17 and 18 is a mixed group consisting of 1 unsaturated fatty acid (C-18 : 2) and 2 compounds tentatively identified as alkene/alcohol. We suggest from this variable covariance and the chemical identification in Table 4 that the groups of variables have chemical compositional information. The variable loading plot used in this way for 1 class is suggested to contain information on the natural group- ing or predominant CO-occurrence of the fatty acids grouped together in glycerides and membrane struc- tures. The indicated negative correlation between these 2 groups of variables (containing Variables 2, 3, 5, 6 ,7 and 10, and Variables 9, 17 and 18, respectively), visualised by their positioning on each side of Princi- pal Component 2 (Esbensen pers. comm.), suggests that there might be 2 different biochemical processes each responsible for the grouping of these fatty acids in the copepods. The problem of closure leading to erratic negative correlation between large and small vari- ables (Johansson et al. 1984) demands cautious interpretation of variable loading plots of normalised data. The group comprising Variables 1, 15, 19 and 20
154 Mar. Ecol. Prog. Ser. 26: 145-156, 1985
is positioned intermediate between the 2 other groups. The composition of this group suggests that there is some process which correlates the short chain branched C-15 : 0 fatty acid to the longer chain C-20 : 1 and C-21 : 0 fatty acid. The simple chemical method applied does not allow conclusions at this level, but does indicate the potential of SIMCA pattern recogni- tion for metabolic studies.
Multivariate analysis in marine ecology
Ecological science is multivariate and interdiscipli- nary. The identification and classification of environ- mental conditions and knowledge of the effect these have on organism groups is often necessary. Using multiscience approaches, e.g. chemical and biological methods, in combination with multivariate statistical analysis techniques might allow both slmple and rapid identification of the influence of environmental condi- tions (geographical variations) on the natural composi- tion/metabolism of organisms. Previous work has shown that specific groups of the eukaryotic commun- ity in sediments may be assayed by measuring specific fatty acids (Findlay & White 1983). We have recently used non-polar compounds and fatty acids to classify cod Gadus morhua and haddock Melanogrammus aeg- lefinus eggs from Day 1 and Day 8 after fertilization (Knutsen et al. unpubl.).
In marine ecology the effect of pollution from differ- ent sources on organisms and organism societies is a major problem. Recent work has shown that low level chronic pollution influences the natural fatty acid pat- tern of blue mussels (Grahl-Nielsen et al. 1983) and cod Gadus morhua (Grahl-Nielsen pers, comm.). The pattern of paraffinic hydrocarbons in blue mussels col- lected from different areas at different seasons has been analysed by using pattern recognition tech- niques, and the influences of oil pollution and seasonal changes have been shown by Kwan & Clark (1981). Application of SIMCA, level 3 and 4, PLS (partial least squares, 'multivariate calibration') (Wold et al. 1983a, b), in dose-response investigations should allow for investigating synergistic effects of different pollutants on the chemical response of organisms. The recent increased use of multivariate analysis in biological sciences (Reddin & Burfitt 1983, Shearer 1983, Meng & Stocker 1984, McGurk 1985) and work at our laboratories (Biological Station at Fladevigen and Center for Industrial Research) have shown that natural biological systems may be studied with success using pattern recognition at several levels (Albano et al. 1978) on both physical, biological and chemical parameters.
This also opens the way to closer cooperation
between sciences. The interdisciplinary nature of ecological investigations suggests that general mul- tivariate methods of data treatment capable of hand- ling together data from different sciences, e.g. biologi- cal and chemical parameters, in describing complex systems should come to more use. We are currently applying the SIMCA method to several areas in marine ecologyhiology. Fish egg quality has importance both in aquaculture rearing and in determining the viability of fish eggs collected in the field. The complexity of this determination, involving chemical composition analysis and biological measurements, has led us to experiment with multivariate pattern recognition.
To investigate if there might be stationary organ- isms, apart from and more tolerant towards pollution than mussels, which may be used as indicator organ- isms for pollution tracing and/or pollution source iden- tification in the marine environment, we are presently working to Identify the trace element and organic compound accumulation pattern and the natural fatty acid pattern of several species using the pattern recog- nition method described.
CONCLUSION
We suggest that it should be possible to obtain ade- quate amounts of organic material from as little as ' / 3 to ' /S the number of organisms collected.
The present results show that use of simple and rapid chemical methods gives information on the classifica- tion of infauna groups when multivariate pattern rec- ognition is used on the non-specific natural chemical position. The method applied contains information at several levels both with respect to marine biology, pattern recognition by SIMCA, and in chemistry. Groups of infauna may be 'mapped' chemically. The possible occurrence of several species in samples does not influence the classification of broad taxon groups as used here. It is likely tha t refined pattern recogni- tion may be applied in mapping chemotaxonomically subspecies groups. Variable loading plots of the total class give information on which variables are respons- ible for the differentiation between groups. The possi- bility that variable loading plots of separate classes contain groups of variables (compounds) grouped according to biochemical and metabolic occurrence suggests that this method might be useful as a method for identifying chemotaxonomically specific com- pounds and of obtaining information on changes occurring in metabolism during different situations of environmental stress.
Acknowledgements. We thank Dir. P. T Hognestad at Fladevigen Biological Statlon (SBSF) for use of facilities

Vogt & Knutsen: SIMCA pattern recognition of taxonomic groups 155
there; Stein Tveite (SBSF) and Otto Grahl-Nielsen at the Dept. of Chemistry, University of Bergen, for help during discussions; Anne-Lise Halvorsen (SBSF) for drawings and assistance with analysis; Olav Kvalheim for allowing the use of the SIMCA program on the NORD 100 at the Dept. of Chemistry, University of Bergen; Dr. Rudolf Schmid, Dept. of Chemistry, University of Trondheim, for allowing time for analysis of the selected peaks on the HRGC-MS at the Insti- tute. Dr. Kim Esbensen, Norwegian Computing Center, Oslo gave valuable help during discussions on the SIMCA method. Finally we thank 2 referees for pertinent comments and sug- gestions.
LITERATURE CITED
Albano, C., Dunn, W. J. , Edlund, U,, Johansson, E., Norden, B., Sjastrem, M,, Wold, S. (1978). Four levels of pattern recognition. Anal. Chim. Acta. Comput. tech. Optim. 103: 429443
Albano, Chr., Blomquist, G., Dunn 111, W. J. , Edlund, U., Eliasson, B., Johansson, E., Norden, B., Sjastram, M., Saderstram, B., Wold, S. (1980). Characterisation and clas- sification based on multivariate data analysis. In: Var- mavuori, A. (ed.) 27th. Int. Conf. of Pure and Applied Chemistry (IUPAC). Pergamon Press. Oxford, New York
Bobbie, R. J., White, D. C. (1980). Characterization of benthic microbial community structure by high resolution gas chromatography of fatty acid methyl esters. Appl. environ. Microbiol. 39: 1212-1222
Boon, J. J., Liefkens, W., Rijstra, W. I. C., Baas, M., De Leeuw, J. W. (1978). Fatty acids of Desulfovibrio desulfuricans as marker molecules in sedimentary environments. In: Krumbein, W. E. (ed.) Environmental biogeochemistry and geomicrobiology, Vol. 1. Ann Arbor Science, Michi- gan, p. 355-372
Christie, 0. H. J., Wold, S. (1979). The influence of skewed measurement distributions commonly found in geo- chemistry. Anal. lett. 12 (A9): 979-993
Christie, W. W. (1983). Lipid analysis (2nd ed.). Pergamon Press, Oxford, p. 52-53
Dunn, W. J., Wold, S. (1980). Relationships between chemical structure and biological activity modelled by SIMCA pat- tern recognition. Bioorg. Chem. 9: 505-523
Federle, T W., Livingston, R. J.. Meeler, D. A., White, D. C. (1983). Modifications of estuarine sedimentary microbiota by exclusion of epibenthic predators. J. exp. mar. Biol. Eco~. 73: 81-94
Findlay, R. H., White, D. C. (1983). The effects of feeding by the sand dollar Metilla quinquiesperforata (Leske) on the benthic microbial community. J. exp. mar. Biol. Ecol. 72: 25-4 1
Grahl-Nielsen, O., Kvalheim, O., Dygard, K. (1983). SIMCA multivariable data analysis of blue-mussel components in environmental pollution studies. Anal. Chim. Acta. 150: 145-152
Jantzen, J . (1976). Gas chromatography of bacterial whole cell methanolysates. A chemotaxonomic study with spe- cial reference to Neissaeriaceae. D. phil. thesis, Univ. of Oslo, Norway
Jeffries, H. P. (1975). Diets of juvenile Atlantic menhaden (Brevoortia tyrannus) in three estuarine habitats as deter- mined from fatty acid composition of gut contents. J. Fish. Res. Bd Can. 32 (5): 587-592
Jeffries, H. P. (1979). Biochemical correlates of seasonal change in marine communities. Am. Nat. 113 (5): 643-658
Jellum, E., Bjamson, I., Nesbakken, R., Johansson, E., Wold,
S. (1981). Classif~cation of human cancer cells by means of capillary gas chromatography and pattern recognition analysis. J. Chromat. 217: 231-237
Jennings, W. G. (1981). Applications of glass capillary chromatography. Chromatographic science series, Vol. 15. Marcel Dekker, Inc., New York, p. 49-55
Johansson, E. (1984). Information in chromatographic data. Collection of articles in D. phil. thesis, UmeA Univ., Sweden
Johansson. E., Wold. S., Sjsdin, K. (1984). Minimizing effect of closure on analytical data. Anal. Chem. 56: 1685-1688
Knutsen, H., Vogt, N. B. (1985). An approach to identifying feeding patterns of juvenile lobster using chemical analy- sis and pattern recognition by the method of SIMCA. Parts I & 11. J . exp. mar. Biol. Ecol. 89: 109-119, 121-134
Knutsen, H., Vogt, N. B., Moksness, E. (In press). Distinguish- ing between 1 day old cod (Cadus rnorhua) and haddock (Melanograrnrnus aeglefinus) eggs by Gas Chromatogra- phy and SIMCA pattern recognition. J. Fish. Res. Bd Can.
Kwan, P. W., Clark, R. C. Jr. (1981). Assessment of oil con- tamination in the marine environment by pattern recogni- tion analysis of paraffinic hydrocarbon content of mussels. Anal. Chim. Acta 133: 151-168
Massart, D. L., Kaufman, L. (1983). The interpretation of analytical chemical data by the use of cluster analysis. Chemical analysis. Vol. 65. John Wiley & Sons, New York
McGurk, M. D. (1985). Multivariate analysis of morphometry and dry weight of Pacific herring larvae. Mar. Biol. 86: 1-11
Meng. H. J.. Stocker, M. (1984). An evaluation of morphomet- rics and meristics for stock separation of Pacific herring (Clupea harengus pallasi). Can. J . Fish. Aquat. Sci. 41: 414422
Reddin, D. G., Burfitt, R. F, (1983). An update: the use of scale characters and multivariate analysis to discriminate between Atlantic salmon (Salrno salar L.) of North Ameri- can and European origin caught at West Greenland. Coun. Meet. int. Coun. Explor. Sea, Anadromous and Catadrom- ous Fish Committee. C.M.-ICES/M: 11
Shaw, N. (1974). Lipid composition as a guide to the classifi- cation of bacteria. Adv. appl. Microbiol. 17: 63-105
Shearer, W. M. (1983). The use of scale characteristics and multivariate analysis to distinguish between stocks of fish. Coun. Meet. int. Coun. Explor. Sea. Anadromous and Catadromous Committee. C.M.-ICESIM: 21
Smith 111, A. B., Belcher, A. M,, Epple, G., Jurs, P. C.. Lavine, B. (1985). Computerised pattern recognition: a new technique for the analysis of chemical communication. Science 228: 175-177
Wold, S. (1978). Cross validatory estimation of the number of components in factor and principal component models. Technometrics 20: 397-406
Wold, S., Sjsstram, M. (1977). SIMCA, a method for analysing chemical data in terms of similarity and analogy. In: Kowalski, B. R. (ed.) Chemometrics, theory and applica- tion. Am. Chem. Soc. Symp. Ser. no. 52
Wold, S., Albano, Chr., Blomquist, G., Coomans, D., Dunn 111. W. J . , Edlund, U., Eliasson, B., Hellberg, S., Johansson. E., Norden, B., Sjastrem, M., Saderstrem, B., Wold, H. (1981). Pattern recognition by means of disjoint principal compo- nent models (SIMCA). In: Hsskuldson, A., e t al. (ed.) Proc. Symp. Anv. Stat. NEUCC, RECAU and RECKU, Copenha- gen, Jan 1980, p. 475-487
Wold, S., Albano, C., Dunn 111, W. J., Edlund, U,, Esbensen, K., Geladi. P.. Hellberg. S., Johansson, E., Lindbergh, W., Sjsstram, M. (1983a). Multivariate data analysis in chemistry. In: Kowalski, B. R. (ed.) Proc. NATO adv. study

156 Mar. Ecol. Prog. Ser. 26: 145-156, 1985
institute on Chemometrics, Cosenza, Italy. Reidel Publ. Wold, S.. Albano, Chr., Dunn 111, W. J.. Esbensen, K., Hell- Co., Dordrecht, Holland, p. 17-97 berg, S., Johansson, E., Sjestrem, M. (1984). Multivariate
Wold, S., Sjastram, M,, Lndbergh, W., Persson, J.-A., Mar- analytical chemical data evaluation using SIMCA and tens, H. (1983b). A multivariate calibration problem in MACUP. In: Punger, E., Veress, G . E. (ed.) Modern trends analytical chemistry solved by partial least squares mod- in analytical chemistry. Akademiai Kiado, Budapest, p. els in latent variables. Anal. Chim. Acta 150: p. 61-70 157-188
This paper was submitted to the editor; it was accepted for printing on July 15, 1985