silvopasture establishment and economics: modeling the
TRANSCRIPT

Silvopasture Establishment and Economics: Modeling the Cost of Wildlife Browse Damage
to Stand Establishment and Cattle Introduction on Redstone Arsenal
by
Micah Josiah Moore
A thesis submitted to the Graduate Faculty of
Auburn University
in partial fulfillment of the
requirements for the Degree of
Master of Science
Auburn, Alabama
December 8, 2012
Keywords: Alabama, economics, replacement cost approach, silvopasture, wildlife damage
Copyright 2012 by Micah Josiah Moore
Approved by
Rebecca J. Barlow, Chair, Associate Professor of Forestry
James B. Armstrong, Co-chair, Professor of Wildlife Sciences
Charles D. Monks, Professor of Agronomy
ii
Abstract
This thesis examines three distinct but related aspects of wildlife browse damage to
southern yellow pine establishment and growth in a silvopasture: the characteristics and extent of
wildlife browse damage to 1-year old loblolly seedlings, seedling mortality and growth rate over
the second growing season, and estimates of potential economic trade-offs among tree and
livestock values for introducing cattle after the third growing season. Study sites were located at
Redstone Arsenal in north-central Alabama. The individual heights and damage conditions of
loblolly seedlings were measured across the second growing season during five bi-monthly data
collection periods that began in March of 2011 and ended in November of 2011. Results suggest
a significant association between wildlife browse damage to terminal buds on 1-year old
seedlings and the 18 inch average height reduction observed for 2-year old seedlings when
compared to undamaged loblolly in the same silvopasture. Seedling growth and economic
models suggest average seedling at the end of the third growing season, combined with initial
seedling mortality, may warrant the decision to postpone cattle introduction due to the potential
loss in tree value and the alternative of hay-lease revenue. This research provides information
and decision tools to assist Redstone Arsenal’s resource managers and Alabama’s landowners in
assessing ecological and economic interactions between silvopasture components. This
information is important for a range of stakeholders during the planning and budgeting of a
silvopasture whether expanding a current operation, transitioning from traditional agriculture, or
obtaining a capital investment to begin an operation.

iii
Acknowledgments
I thank the United States Army personnel at Redstone Arsenal for providing the study
area and logistical support. I extend a special thanks to my committee and many others who so
graciously expended energy/mass through various levels of resistance over great distances of
space/time (force/work done) to assist in the completion of this research: Becky Barlow, James
Armstrong, Charles Monks, Kevin Guthrie, Brent Williams, Holly Jantz, Patti Staudenmaier,
Charlesa Paris, Lee Paris, Nathan Paris, Kyle Paris, John Kush, John Gilbert, David Laband,
Emily Stutzman, Iva B. Moore, Grover C. Moore II, and Grover C. Moore III. I am forever
grateful. An investment in knowledge truly pays the best interest.

iv
Table of Contents
Abstract ......................................................................................................................................... ii
Acknowledgments........................................................................................................................ iii
List of Tables ............................................................................................................................... vi
List of Figures ............................................................................................................................ viii
Chapter 1: Introduction ............................................................................................................... 1
Chapter 2: Literature Review .................................................................................................... 14
2.1. Agroforestry: Increasing Demands ...................................................................... 14
2.2. Silvopasture: An Agroforestry Practice ............................................................... 15
2.3. Financial Benefits of Tree, Forage, and Livestock Interaction .............................. 19
2.4. Financial and Economic Considerations for Silvopasture Establishment ............. 20
2.5. Silvopasture Economics: Components, Metrics, and Values .............................. 22
2.6. Wildlife Browse Damage: A Potential Cost to Pine Silvopasture Establishment . 33
2.7. Economics of wildlife damage: A Gap in Agroforestry Literature ....................... 38
Chapter 3: Silvopasture Establishment and Economics: The Cost of Wildlife Browse Damage at
Redstone Arsenal ...................................................................................................... 42
3.1. Introduction ........................................................................................................... 42
3.2. Methods ................................................................................................................. 47
3.2.1 Overview of Study Area ............................................................................ 47
3.2.2. Silvopasture Study Sites ............................................................................. 48
3.2.3. Study Approach and Techniques ............................................................. 50

v
3.2.4. Design Implementation and Biological Data Collection ......................... 51
3.2.5. Financial Data Collection .......................................................................... 57
3.2.6. Analysis of Biological Data ....................................................................... 58
3.2.7. Replacement Cost Approach, Discounting, and Net Present Value ........ 61
3.3. Results .................................................................................................................... 67
3.3.1. General Linear Model and PTAEDA 3 Seedling Height projections ........ 75
3.3.2. Replacement Cost Approach and General Discounting ........................... 84
3.3.3. Net Present Value of Management Options ............................................. 87
3.4. Discussion .............................................................................................................. 89
3.4.1. Biological Interactions ............................................................................. 90
3.4.2. Economics of Management Options ........................................................ 93
3.5. Management Implications ...................................................................................... 94
Literature Cited ......................................................................................................................... 98
Appendix 1. Location of Redstone Arsenal in Madison County, Alabama ............................ 105
Appendix 2. List of Common Plant Species on Redstone Arsenal........................................... 106
Appendix 3. Location of Study Sites on Redstone Arsenal ...................................................... 107

vi
List of Tables
Table 3.1. Description of biological data that were collected from four 1-year old loblolly pine
silvopasture sites on Redstone Arsenal in Madison County, Alabama, between
February of 2011 and concluded in November of 2011 ........................................... 57
Table 3.2. Revenue and cost data collected in 2011 for assessment of silvopasture timber, forage,
and cattle components in four loblolly pine silvopastures on Redstone Arsenal in
Alabama.. ................................................................................................................... 58
Table 3.3. Categorical description of how the average height of four loblolly pine
seedling/damage groups in 2011 will have an additional year of growth simulated,
using PTAEDA 3 loblolly growth software, resulting in four corresponding height
estimates for those groups in December of 2012. ..................................................... 61
Table 3.4. Basis for interest rates used in the replacement cost approach to assign a monetary
value to the pre-merchantable timber component of silvopastures on Redstone
Arsenal in Alabama. The interest rates of 3%, 6%, and 9% represented the rates of
return associated with what the money (establishment cost) could have been
reasonably expected to earn if it had been invested in one of the alternatives.. ...... 64
Table 3.5. Initial seedling height data by mortality category (alive; not-alive) for all silvopasture
sites on Redstone Arsenal in February of 2011 ........................................................ 68
Table 3.6. Initial seedling height data by mortality and wildlife browse damage categories for all
silvopasture sites on Redstone Arsenal in February of 2011. ................................... 68
Table 3.7. Ending seedling height data by mortality category (alive; not-alive) for all silvopasture
sites on Redstone Arsenal in 2011). .......................................................................... 70
Table 3.8. Study site, mortality category, frequency, and percent of observations within each
silvopasture study site on Redstone Arsenal in 2011. ............................................... 72
Table 3.9. Summary of data for seedlings that were still alive at the conclusion of data collection
in November of 2011 by wildlife browse damage category, number of seedlings,
ending mean seedling height, and standard deviation of seedling heights across all
silvopasture sites on Redstone Arsenal. .................................................................... 75
Table 3.10. General linear model statistical output of between-subjects interaction between
independent variables (field and damage category) on the dependent variable (mean

vii
seedling height).. ..................................................................................................... 76
Table 3.11. Estimated marginal means from the linear model – effect of independent variable
(field) on dependent variable (mean seedling height).. ........................................... 77
Table 3.12. Results of the pair-wise comparisons between wildlife browse damage category
levels and mean seedling heights across all silvopasture sites on Redstone Arsenal in
2011......................................................................................................................... 78
Table 3.13. PTAEDA 3 projected loblolly average seedling height in December of 2012 for all
four wildlife browse damage category level in comparison to the recommended
minimum heights for cattle introduction to pine silvopastures on Redstone Arsenal
in Alabama .............................................................................................................. 80
Table 3.14. 2011 seedling replacement cost per acre of 17% because of 2-year old seedling
mortality across all silvopasture sites on Redstone Arsenal. ................................... 82
Table 3.15. 2012 replacement cost value per acre for 3-year old loblolly seedlings across all
silvopasture sites on Redstone Arsenal .................................................................... 84
Table 3.16. 2013 nominal values ($/acre) of individual cattle and hay components discounted to
2012 values ($/acre) for all silvopasture sites on Redstone Arsenal.1 .................... 85
Table 3.17. Potential loss of seedling value based on the 2012 replacement cost value for
seedlings and the PTAEDA 3 projections for seedlings “at-risk” for cattle
introduction to silvopastures at Redstone Arsenal in 2012 ...................................... 85
Table 3.18. Net present value per acre (NPV/acre) of 2012 benefits/acre minus the 2012
costs/acre of management decisions regarding the introduction of cattle and potential
trade-offs between the value of the tree component for all silvopasture sites on
Redstone Arsenal. ................................................................................................... 86
Table 3.19. Net present value per acre (NPV/acre) of management decisions regarding the
potential trade-offs between the value of the tree and livestock components for all
silvopasture sites on Redstone Arsenal in Alabama. ............................................... 88

viii
List of Figures
Figure 2.1. Rate of return (ROR) comparison for an investment in pine based silvopasture,
traditional pine-plantation, and pasture/cattle-grazing operation . .......................... 15
Figure 2.2. Example of a paddock system used for rotational livestock grazing in a
silvopasture adapted from Hamilton (2008) ............................................................. 15
Figure 2.3. Year, activity, costs and revenues associated with silvopasture management which
should be identified and evaluated by those considering the establishment of a
silvopasture system .................................................................................................. 21
Figure 2.4. Time value of money: Initial investment of $100.00 that earns a 5% interest that is
compounded annually. ............................................................................................ 27
Figure 3.1. Number (N = 618) and distribution of seedling observations by mortality category for
all silvopasture sites (AGL1; AGL2; AGL3; AGL4) on Redstone Arsenal in
February of 2011. ..................................................................................................... 69
Figure 3.2. Number (N = 618) and distribution of seedling observations by mortality category for
all silvopasture sites (AGL1; AGL2; AGL3; AGL4) on Redstone Arsenal in
November of 2011 ................................................................................................. 70
Figure 3.3. Total number and distribution of seedlings in mortality category “not-alive” by
wildlife browse damage category levels for all silvopasture sites on Redstone
Arsenal in November of 2011 ................................................................................. 70
Figure 3.4. Proportion of observations within seedling mortality category “not-alive” by wildlife
browse damage category levels for all silvopasture sites on Redstone Arsenal in
November of 2011 ................................................................................................... 79
Figure 3.5. Mean seedling (N = 424) height by wildlife browse damage category for all
silvopasture sites on Redstone Arsenal in November of 2011 .............................. 69
Figure 3.6. Results of the analysis between wildlife browse damage levels and mean seedling
height in average stand height across each wildlife browse damage category levels
across all silvopasture sites on Redstone Arsenal ................................................... 81
Figure 3.7. Proportional representation of establishment cost value per acre ($/acre) for all
silvopasture sites on Redstone Arsenal in 2011. ....................................................... 83

1
CHAPTER 1
INTRODUCTION
According to estimates made by the Massachusetts Institute for Technology (MIT) Joint
Program on the Science and Policy of Global Change, the global human population will
approach 9 billion people by the year 2050, approximately doubling the 2010 levels of global
food and energy consumption (Reilly and Paltsev 2007; Prinn and Reilly 2012). Furthermore,
technological advances in electronics and paper recycling, changing land-use patterns and
increasing environmental degradation have made it more difficult for traditional agricultural and
forestry practices to supply these growing demands while remaining economically and
ecologically viable (USDA National Agroforestry Center 2008; USDA-ERS 2010; World
Agroforestry Center 2010). In Alabama for example, the United States Department of
Agriculture’s Economic Research Service (USDA-ERS) estimates that from 1978 to 2009, the
number of small farms in Alabama declined by approximately 25% (Workman 2003; USDA-
ERS 2010). Furthermore, between the years 1978 and 2009, it is estimated that the number of
farm operators under the age of 34 decreased by 40% while operators over 70 years of age
increased by 20% during that same period (USDA-ERS 2010).
As of 2010, 92% of Alabama’s farms were less than 500 acres in size, with 60% being
less than 100 acres (USDA-ERS 2010). Similarly, approximately 65% of Alabama’s forestland
was comprised of privately owned, non-industrial properties that were less than 500 acres in total

2
area (USDA-ERS 2010). Combined, agricultural and forest products industries accounted for
approximately 25% of all jobs in Alabama (USDA-ERS 2010). However, the annual rate of
unemployment these industries from 2008 to 2011 was 6.1%, 11.9%, 10.8%, and 10.1%
respectively (USDA-ERS 2012). As a result, individuals and organizations throughout the state
were searching for new opportunities and methods with which to generate additional and
diversified income from their lands (Workman 2003; Nowak and Walton 2005; USDA-ERS
2012).
Concurrently, more than 30 years of research suggest that the agroforestry techniques of
alley-cropping, forest farming, riparian buffers, silvopasture, and wind-breaks have the potential
to generate additional income and improve environmental sustainability by systematically
integrating the production of crops and trees on the same parcel of land (Clason 1995; Grado et
al. 2001; Husak and Grado 2002; USDA National Agroforestry Center 2008; Hamilton 2008;
USDA National Agroforestry Center 2010; World Agroforestry Center 2010). As part of an
overall land management strategy, agroforestry practices have the ability to generate annual and
periodic revenues beyond that of traditional land management practices (Clason 1995; Husak and
Grado 2002). In addition to improved financial performance, agroforestry practices can produce
ecological benefits such as the improvement of wildlife habitat, reduction of soil erosion, and
increased bio-diversity (Sharrow et al. 2009; Frey et al. 2010). The potential for increased
economic and ecological benefits have attracted the attention of various individual and
organizational stakeholders including the U.S. Secretary of Agriculture, who in June of 2011
announced that efforts were underway to implement a nation-wide agroforestry extension
community (Sorrow 2011; USDA 2011).

3
Furthermore, agroforestry had attracted interest from the United States Army at the
Redstone Arsenal (RSA) instillation in Madison County, Alabama. The total land area occupied
by RSA is approximately 38,100 acres (59.53 mi²) and is positioned on the southwest side of
Huntsville, Alabama. RSA is home to the Marshall Space Flight Center and U.S. Missile
Defense Command. It is comprised of diverse landscapes that range from upland pine forest and
bottomland hardwood swamps to stands of planted pine and open pasture land. The Arsenal’s
management plan is focused on a sustainable, ecosystem approach but historically does include
practices which are used to generate financial returns for the installation.
According to resource managers at Redstone, approximately 2,000 acres of pastureland
are under cattle grazing contracts with private individuals, with another 1,500 acres being
suitable for cattle grazing. Due to a variety of economic pressures, RSA managers have been
searching for innovative and sustainable techniques that can increase and diversify revenue
streams yet enhance ecological sustainability. As a result of these pressures, in December of
2009 a limited area of land was set aside for the purpose of testing the practice of silvopasture in
order to assess the feasibility of expanding its use.
Of the five agroforestry practices, silvopasture has become the most common in the
southeastern United States (Sharrow 2001; Workman 2003; Hamilton 2008). Silvopasture
integrates the production of timber, forage and livestock on the same land-unit (Stainback and
Alavalapati 2004; Hamilton 2008; Oswald et al. 2008; Sharrow et al. 2009). Silvopasture is used
to produce high-value timber products, such as saw-timber and veneer-logs, while generating
short-term cash flow from the sale of livestock and other products such as hay and pine-straw
(Stainback and Alavalapati 2004; Alavalapati and Mercer 2005; Hamilton 2008). This
integration of components is designed to optimize the production of multiple components in

4
contrast to “maximizing” the production of any single component (Stainback and Alavalapati
2004; Hamilton 2008; Bambo et al. 2009).
In the southeastern U.S., yellow-pines such as loblolly (Pinus taeda), slash (Pinus
elliottii), and longleaf (Pinus palustris) may be used as the timber component of a silvopasture
system and can be established on existing pasture land by planting single, double, or triple row
trees while leaving wide, unplanted corridors between them (Lewis 1984; Clason 1995; Kush et
al. 2004; Hamilton 2008; Sharrow et al. 2009). Pine silvopasture may also be established by
thinning existing stands of timber in such a manner as to mimic the row and corridor
configurations as described for planting trees in open pasture (Sharrow and Fletcher 2003;
Hamilton 2008). Thinning trees to these conditions is required to reduce canopy cover for
adequate sunlight to reach the forest floor which allows for the production of forage (Hamilton
2008; Nowak et al. 2009). Each of the tree arrangements has relative advantages and
disadvantages, but they must be balanced with considerations for producing adequate forage
(Hamilton 2008).
The forage component of a silvopasture can include various mixtures of warm- and/or
cool- season legumes and grasses to be used as hay or food for livestock (Hamilton 2008; Garret
2009; Nowak et al. 2009). The establishment and production of forage in silvopasture is similar
to that of traditional pasture management but is different in that the selected forage species
should be more shade tolerant. Suitable cool season legumes include various species of clover
(Trifolium spp.) and vetch (Vicia spp.) while grasses including rye-grass (Lolium spp.) or native
species such as little bluestem (Schizachyrium scoparium) and eastern gammagrass (Tripsacum
dactaloides) are viable choices for the warm-season (Hamilton 2008). Likewise, the livestock
component may be selected from a range grazing animals including domestic cattle (Bos taurus),

5
domestic goats (Capra hircus), or domestic sheep (Ovis aries) (Hamilton 2008; Garret 2009).
However, landowners are cautioned by the USDA - National Agroforestry Center (USDA-NAC)
to be aware of the fact that livestock can damage young seedlings by browsing, trampling, and
rubbing them during the first 3 to 4 years from establishment and thus recommend that
landowners delay livestock introduction during that time (Hamilton 2008; Brauer et al. 2009).
According to the recommendation in Hamilton (2008), the approximate time range of 3
to 4 years are required for southern yellow pine to reach the height range of 5 to 6 feet where
seedlings are large enough to withstand interaction with livestock (Hamilton 2008). The first 3
to 4 years of silvopasture system establishment represents an important and financially sensitive
time period for many landowners because they postponing livestock from a young silvopasture
means that stakeholders must forgo vital cash-flows from livestock operations (Kinicki and
Williams 2006; Godsey 2007; Plunkett et al. 2007; Godsey et al. 2009). Accordingly, studies
have addressed these concerns and have suggested that landowners may offset forgone livestock
revenue by producing hay or row-crops in the silvopasture’s wide alleyways while waiting on the
trees to mature (Husak and Grado 2002; Hamilton 2008).
Once livestock are introduced, use of an internal fencing system and rotational grazing
strategy are vital to maintaining a sufficient supply of high-quality forage, especially when
silvopastures are implemented on relatively small tracts of land (Lewis et al.1984; Fike et al.
2004; Hamilton 2008). Therefore it is recommended that the total silvopasture acreage be
divided or sectioned into approximately equal size paddocks, forage growth should be closely
monitored, and livestock rotated systematically through each paddock thereby avoiding over-
grazing in any single paddock-unit (Lewis et al. 1984; Hamilton 2008; Brauer et al. 2009). The
ideal outcome of the rotational grazing strategy is that the livestock are rotated in such a manner

6
that the forage within each paddock is allowed sufficient time to recover before one rotational
cycle is completed, thus allowing the landowner to produce a sustainable loop of forage
production (Lewis et al. 1984; Hamilton 2008).
As trees continue to mature over time they provide shade for livestock, which research
suggests can improve livestock profitability (Lewis et al. 1984; Garret et al. 2004; Hamilton
2008; Godsey et al. 2009). Tree shade can benefit livestock mainly by providing a temperature
buffer for both the animals and their forage (Lewis et al. 1984; Garret et al. 2004; Hamilton
2008). By buffering animals and forage from heat, thermo-equilibrium in the animals is more
easily regulated, and forage transpiration rates are reduced thereby reducing loss of water and
nutrient content (Lewis et al. 1984; Garret et al. 2004; Hamilton 2008). As a result, trees can
reduce livestock production costs associated with water and supplemental feed for the animals
and fertilization requirements for their forage (Lewis et al. 1984; Hamilton 2008).
Understanding the establishment and importance of the timber component is imperative
because economic research suggests that as trees in a silvopasture mature they can produce
financial benefits not only from timber sales and reduced production costs for livestock but from
the ecological and wildlife benefits as well (Husak and Grado 2002; Fike et al. 2004; Rollins et
al. 2004; Lemus 2009). These studies suggest that as the trees in a silvopasture mature, they
produce additional financial benefits from annual tax incentives, payments from cost-share
programs such as the Conservation Reserve Program (CRP) and Wildlife Habitat Incentive
Program (WHIP), and annual income from the potential to incorporate hunting leases (Husak and
Grado 2002; Gurevitch et al. 2006; Godsey 2007; Lemus 2009). In many cases, the practice of
silvopasture can improve wildlife habitat and attract species such as wild-turkey (Meliagris
gallapavo), white-tailed deer (Odocoileus virginianus), and rabbits (Sylvilagus spp.) by

7
increasing the availability, diversity, and quality of seasonal resources (Grado et al. 2001; Nowak
et al. 2008; Robinson 2005; USDA-NRCS 2009).
Although both stakeholders and wildlife can benefit from silvopastures, the ability of a
pine silvopasture to attract wildlife also creates the potential for wildlife-related damages to the
tree component, which ultimately could reduce the system’s financial performance (Dickson
2001; Conover 2002; Sharrow and Fletcher 2003). According to Sharrow (2001) and Sharrow
and Fletcher (2003), although silvopasture managers may harvest hay for the first 3 to 4 years
while waiting to introduce livestock, that approach does not avoid threats posed by wild
populations of deer and rabbits. However, little has been written about this potential threat
(Sharrow and Fletcher 2003). Moreover, the lack of information regarding deer damage in
silvopasture may be linked to the relatively recent increase in deer populations. After having
been drastically reduced in numbers during the 19th
and early 20th
centuries, deer populations
have now rebounded across the southeast and have exponentially increased over the past 30
years; the same time-span during which much of the research on silvopasture establishment and
management has been conducted (Dickson 2001; Conover 2002; Hamilton 2008).
With regards to traditional forestry and agricultural practices, deer are known to cause
severe damage to orchards, nurseries, ornamental trees, and shrubs (Semans and Helon 2008). In
the United States for example, wildlife professionals estimate that the annual cost of deer
damage to timber and agricultural productivity is approximately $750 and $500 million dollars
respectively (Waller and Alverson 1997; Conover 2002; Seamans and Helon 2008). Therefore,
the potential impact of large deer populations may deserve consideration by those considering
the establishment of a silvopasture in those areas.

8
The state of Alabama, for example, has a large deer population that is estimated to
contain more than 1.8 million animals (Cook and Gray 2003; USDA-APHIS 2010). The state’s
large deer population is of significant interest not just because they can cause damage but
because, similar to cattle, they are relatively long-lived, ruminants that have been known to cause
localized plant extinctions, especially when populations are close or above the carrying capacity
of the habitat (Miller and Marchinton 1995; Waller and Alverson 1997; Dickson 2001; Conover
2002). According to Campbell (1976), when deer populations approach carrying capacity of the
land they can become “nutritionally stressed”, and when that happens, they begin browsing a
wider range of plants and damage to young southern pines can be severe.
Likewise, rabbits (Sylvilagus spp.) may be able to impact the timber component of a
silvopasture, but like with deer, there is limited quantitative data pertaining to the extent and
effects of rabbit damage to southern pine (Hunt 1968; Shelton and Cain 2002). Rabbits, unlike
deer, are short-lived herbivores, with populations experiencing an annual mortality rate of 80%
to 90% (Dickson 2001). Annual rabbit populations fluctuate widely due both to climate effects
on food items like grasses and forbs, and also because rabbits are prey for a wide range of
animals including coyotes (Canis latrans), gray fox (Urocyon cinereoargenteus), and great
horned owls (Bubo virginianus). Although data are limited, a few studies, involving the
management of traditional loblolly pine-plantations in the southeastern United States, have
observed that browse damage by rabbits can reduce the annual growth of loblolly seedlings by
up to 40% when compared to undamaged seedlings (Hunt 1968; Wakeley 1970; Shelton and
Cain 2002).
Additionally, these studies agree that damage to the terminal bud and main stem of
southern pine can reduce or halt seedling growth during the first 4 to 5 years after planting (Hunt

9
1968; Wakeley 1970; Campbell 1976; Shelton and Cain 2002). Reduced or halted pine seedling
growth during the first 4 to 5 years is directly relative to silvopasture because regardless of
damage to seedlings the landowner is not generating cash flow from livestock sales while they
must wait 3 to 4 years until seedlings reach 5 to 6 feet in height (Pearson 1984; Sharrow and
Fletcher 2003; Hamilton 2008; Brauer et al. 2009; Godsey et al. 2009). Taking note of this
general recommendation may also be important because there can be conflicting
recommendations regarding when cattle (livestock) should be introduced to southern pine
silvopastures.
Grado et al. (2001) conducted a well-known economic analysis of hypothetical
silvopasture in Mississippi to which cattle were introduced two years after loblolly pine were
established. In contrast to the recommended minimum tree height of 5 to 6 feet in Hamilton
(2008), Grado et al. (2001) stated that cattle were demonstrated to have had no impact on
loblolly pine after seedlings reached 18 inches in height. Furthermore, unlike both Hamilton
(2008) and Grado et al. (2001), Pearson (1984) discussed considerations for silvopasture
management and suggested that cattle grazing should not commence until pine seedlings have
reached a minimum height range of 7 to 10 feet based on experience gained from grazing cattle
in naturally regenerated southern pine stands. Please note that although an older study, Pearson
(1984) specifically referenced 7 to 10 feet for southern pine when grazing “cattle”, in contrast
Grado et al. (2001) specifically referenced 18 inches for southern pine when grazing “cattle”, and
Hamilton (2008) referenced 5 to 6 feet for southern pine when grazing “livestock” in general.
What is clear is that the literature regarding silvopasture establishment and management
supports the concept that 1) all “livestock” species which are compatible for silvopasture
management can damage young pine seedlings if grazing is begun too soon, 2) southern yellow

10
pine must reach some minimum height ranging from 18 inches to 10 feet in order to reduce the
probability that livestock could severely damage the terminal bud and main stem of young trees
through browsing, rubbing, and trampling, and 3) all grazing by all livestock species should be
postponed for 2 to 4 years to avoid a relative loss of trees and the expected benefits produced by
this major system component (Lewis et al. 1984; Pearson et al. 1984; Clason 1995; Grado et al.
2001; Husak and Grado 2002; Garret et al. 2004; Godsey 2007; Hamilton 2008). Furthermore,
although never before studied in a southern pine silvopasture, the literature regarding wildlife
biology and damage management has established that deer and rabbit browse damage can reduce
the growth of southern yellow pine for up to 4 to 5 years after establishment. Concurrently, it
suggests there is a gap in the literature on pine-based silvopasture management in the
southeastern U.S.
From this it follows that browse damage by rabbits and deer has the potential to reduce
pine seedling growth during a critical financial period of silvopasture establishment and thereby
alter the timing critical cash-flows or reduce tree asset value. The former and latter impacts
could be the result of two scenarios. First, wildlife browse damage could impact silvopasture
establishment by if the damage reduced tree growth such that the landowner postponed livestock
(and livestock revenue) for an additional year to avoid further tree damage caused by livestock.
Second, because cash-flow is important to young business ventures, the landowner who cannot
afford to postpone livestock for a year longer than was originally planned, introduces livestock
which then cause critical damage to a significant portion of young trees because they are too
small. Although hay or row-row crops may be harvested from alleyways to supplement
livestock revenue during the first 3 to 4 years, there exists an additional level of uncertainty

11
regarding the impact of wildlife damage, livestock damage, or the combination of wildlife and
livestock damage to the quality and financial benefits of the tree component.
The ability of the timber component to establish and grow is important. It is important
because once trees are tall enough, landowners may introduce livestock. However, tree
establishment and growth is important because trees in a silvopasture will produce shade for
livestock (reduced heat stress and production costs), habitat for wildlife (cost-share programs;
hunting leases), and eventually merchantable timber. However, because the aforementioned
benefits are some of the key drivers of silvopasture success, the potential financial impact of
wildlife browse damage to silvopasture systems is uncertain. It is therefore desirable to have
trees establish, survive and grow unhindered in a silvopasture so that there is less risk of damage
caused by livestock introduction.
Additionally, reducing tree damage caused by wildlife and livestock are important so that
stakeholders have the opportunity to realize more of the benefits that the trees in a silvopasture
can produce. Silvopastures can provide numerous market and non-market benefits however, like
other agricultural and timber management practices, productive resources including land, labor
and capital are limited, thus trade-offs are certain (Godsey et al. 2009; Zhang and Pearse 2011).
The process of evaluating the total costs and benefits of any land management practice is
difficult and never precise, but proper planning, budgeting, and valuation are essential to provide
guidelines for ranking management decisions (Godsey 2007; Godsey et al. 2009; Zhang and
Pearse 2011). Therefore it is important to understand how wildlife browse damage may
influence tree establishment and livestock introduction to a silvopasture system.
As previously mentioned, in December of 2009, the United States Army at Redstone
Arsenal (RSA) implemented a limited area of loblolly pine silvopasture and is assessing the

12
feasibility of expanding its use. In December of 2010, after an assessment of the 1 year-old
loblolly pine seedlings, RSA personnel reported the existence of wildlife browse damage.
According to RSA managers, once seedlings have reached sufficient size, cattle grazing leases
(similar to those which they currently use on open pastureland) may be incorporated in order to
further assess timber and livestock component performance. This makes this Redstone Arsenal
an ideal location for research to examine the impact of wildlife browse damage on the growth of
loblolly pine seedlings in a silvopasture system. For example, this research could generate
valuable information for managers at Redstone Arsenal in their commitment to sustainable
resource management.
This thesis examines three distinct but related aspects of wildlife browse damage to
southern yellow pine establishment and growth in a silvopasture: 1) the characteristics and extent
of wildlife browse damage to 1-year old loblolly seedlings, 2) seedling mortality and growth
over the 2nd
year, and 3) estimates of potential economic trade-offs among tree and livestock
values for introducing cattle in the 3rd
year. This research can provide valuable information
needed to help fill the existing knowledge gap regarding pine silvopasture establishment in
Alabama and needs of future research. Moreover, this research can provide information and
decision tools to assist Alabama’s forest and farm owners in assessing relationships among
silvopasture components and influences on the timing of cash-flows (Godsey 2007; ACES
2011). This would be important for a range of stakeholders, whether he or she is considering the
expansion of current operations, the transition from traditional agriculture and forestry to
silvopasture, or to an individual and/or cooperative seeking a loan in order establish an operation
(Godsey 2007; Hamilton 2008; Godsey et al. 2009).
13
1. Chapter 2 presents an overview of the existing literature on silvopasture establishment,
wildlife damage management, financial metrics, and economic considerations for
silvopasture management. This chapter explores and explains the interconnectedness of
these biological and economic issues, and establishes the biological foundation and
economic framework on which the components of this study can be evaluated.
2. Chapter 3 examines four silvopastures located on Redstone Arsenal. This chapter
addresses the primary research question: can wildlife browse damage to seedlings in a
pine based silvopasture impact the timber component and value in such a way as to cause
the delay of livestock introduction thereby impacting critical management decisions?
This chapter begins by briefly introducing the topic of research interest and describes the
physiographic characteristics of the study area as well as on-site descriptions of the
silvopasture area on Redstone Arsenal. This chapter also describes the methods and
criteria used for assessing and analyzing the biological and economic characteristics of
seedling damage. Results are presented and discussed.
3. Chapter 3 also discusses the benefits, implications and limitations of this research for
silvopasture management. This chapter explains how the results of this research can be
utilized by Redstone Arsenal, small-scale farmers and landowners, and other stakeholder
objectives. The limits of this study and its results are presented and this chapter concludes
by describing the need for additional research issues related to the economics of wildlife,
animal and other organism damage in pine based silvopastures.

14
CHAPTER 2
LITERATURE REVIEW
According to the United States Department of Agriculture (USDA 2011), agroforestry
has garnered increased attention among various U.S. government organizations for its potential
role in helping to meet increasing global demands on both farm and forest lands (Sorrow 2011).
In addition, the MIT Center for Energy and Environmental Policy Research, by the year 2050
global demand for food and energy will be approximately double the amounts consumed in 2010
(Nowak and Walton 2005; Reilly and Paltsev 2007; Prinn and Reilly 2012; Susaeta et al. 2012).
Together, research suggests that the increased demand for food and energy will require
organizations, producers and consumers to adapt and utilize multi-functional agricultural and
forest systems on a scale as never before seen (Reilly and Paltsev 2007; Prinn and Reilly 2012;
Susaeta et al. 2012).
2.1. Agroforestry: Supplying Demand
Conversely, many believe that the multi-functional agroforestry practices of alley-
cropping, forest-farming, riparian buffers, silvopasture, and wind-breaks have the potential to
significantly increase farm and forest land-use efficiency (Clason 1995; Hamilton 2008; Sharrow
et al. 2009). In contrast to many traditional management techniques, agroforestry practices
improve efficiency by systematically producing multiple goods and services on the same land-

15
unit (Hamilton 2008; Godsey et al. 2009; World Agroforestry Center 2010). The use of
agroforestry techniques has increased in the last 30 years, and as a result many public and private
organizations are investigating the potential of agroforestry systems in the U.S. South (Sharrow
2001; Susaeta et al. 2012).
2.2. Silvopasture: an Agroforestry Practice
Of the five agroforestry practices, silvopasture has become the most common practice in
the southeastern United States (Sharrow 2001; Hamilton 2008). Silvopasture integrates
livestock, forage production and forestry on the same land-unit (Hamilton 2008; Oswald et al.
2008; Sharrow et al. 2009). Silvopasture is used to produce high-value timber products, such as
saw-timber and veneer-logs, while generating short-term cash-flows from the sale of livestock
and other products such as hay and pine-straw (Hamilton 2008). Figure 2.1 illustrates the results
of a financial analysis conducted by Grado et al. (2001) in which a pine based silvopasture
produces a higher rate of return (ROR) on investment than does a traditional pine-plantation or
pasture cattle grazing operation (Hamilton 2008).
Figure 2.1. Rate of return (ROR) comparison for an investment in pine based
silvopasture, traditional pine-plantation, and pasture/cattle-grazing operation.
6.1%
8.8%
13.4%
0
5
10
15
Coastal pasture Pine plantation Silvopasture
Ra
te o
f R
etu
rn (
%)
Management Options
Rate of Return by Management Option

16
In the southeastern U.S., yellow-pines such as loblolly, and slash, and longleaf may be
used as the timber component of a silvopasture system (Kush et al. 2004; Hamilton 2008;
Oswald et al. 2008). Pine silvopastures can be established on afforested tracts or by thinning
existing timber stands (Hamilton 2008). Typically, silvopasture have been established on
afforested tracts, such as existing pasture land, by planting single or double rows of trees while
leaving wide, unplanted corridors between them (Hamilton 2008; Sharrow et al. 2009). Leaving
wide corridors or alleyways between tree rows means that a silvopasture utilizes a lower initial
stocking that can range from approximately 200 - 400 trees per acre in contrast to approximately
500 - 800 trees per acre in a traditional pine plantation (Shelton and Cain 2002; Brauer et al.
2009).
Using the double-row silvopasture arrangement as an example, 350-450 seedlings may be
planted in a 6’x6’x35’, a 6’x8’x40’, or 8’x8’x40’ spacing arrangement (Hamilton 2008; Long
2003). A double-row silvopasture with a 6’x8’x40’ spacing arrangement means that seedlings
along the length of a single row are separated by six feet (6’), eight feet (8’) separates rows and
unplanted corridors of forty feet (40’) in width separate each double-row set of trees (Hamilton
2008). Figure 2.1 comes from Hamilton (2008) and shows an example of how the spacing
between individual trees, tree rows, and alleyways may be altered to work within the
landowner’s objectives for timber and forage production and environmental benefits such as
wildlife habitat (Grado et al. 2001; Hamilton 2008).
Pine silvopasture may also be established by thinning existing stands of timber in such a
manner as to mimic the row and corridor configurations as described for planting trees in open
pasture (Sharrow and Fletcher 2003; Hamilton 2008). Thinning trees to these conditions is

17
required to reduce canopy cover in order allow adequate sunlight to reach the forest floor to
stimulate forage production as well as provide the landowner with some initial revenue
(Hamilton 2008; Nowak et al. 2009). Each of the silvopasture tree arrangements will have
relative advantages and disadvantages based on factors such as landowner objectives, site
characteristics, tree stocking and tree arrangement but considerations for timber production must
be balanced with those for forage and livestock production (Hamilton 2008; Garret 2009; Garret
et al. 2009; Klopfenstein 2010).
The forage component of a silvopasture can include various mixtures of warm- and/or
cool- season legumes and grasses to be used as hay or food for livestock (Hamilton 2008). The
establishment and production of forage in silvopasture is similar to that of traditional pasture
management according to Hamilton (2008), but is different in that the selected forage species
should be more shade tolerant. According to Hamilton (2008), suitable forage legumes include
various species of clover (Trifolium spp.) and vetch (Vicia spp.) while grasses may include rye-
grass (Lolium spp.) or native species such as little bluestem (Schizachyrium scoparium) and
eastern gammagrass (Tripsacum dactaloides).
Likewise, the livestock component may be selected from a range grazing animals
including domestic cattle (Bos taurus), domestic goats (Capra hircus), or domestic sheep (Ovis
aries) (Garret 2009; Sharrow et al.2009). Please note that livestock can damage young seedlings
by browsing, trampling, and rubbing them during the first 3 - 4 years from establishment (Lewis
et al. 1984; Hamilton 2008). Accordingly, the United States Department of Agriculture’s
National Agroforestry Center (USDA-NAC) recommends that when landowners establish a pine
silvopasture on non-forested tracts, livestock grazing should be delayed for approximately 3 - 4
years (Hamilton 2008). According to this recommendation, 3-4 years are required for species of

18
southern yellow pine to reach 5 to 6 feet in height and thus avoid being damaged by livestock
(Hamilton 2008). Once livestock are introduced, use of a rotational grazing strategy is vital to
maintaining a sufficient supply of high-quality forage, especially when silvopastures are
implemented on relatively small tracts of land (Lewis et al. 1984; Hamilton 2008).
Therefore it is recommended that the total silvopasture acreage be divided or sectioned
into approximately equal size paddocks (Lewis et al. 1984; Hamilton 2008). Combined with the
close monitoring of forage performance, livestock are systematically rotated through each
paddock so that livestock spend a limited amount of time in each paddock thereby reducing the
probability that the forage will be over-grazed in any single paddock-unit (Hamilton 2008). The
ideal outcome of the rotational grazing strategy is that the livestock are rotated in such a manner
that the forage within each paddock is allowed sufficient time to recover before one rotation-
cycle is completed, thus allowing the landowner to produce a sustainable loop of forage
production (Lewis et al. 1984; Hamilton 2008). Figure 2.2 shows a schematic of how a paddock
system might look for a silvopasture that is established on a property with irregular borders
(Hamilton 2008).
1 2 5 6
12 3 4 7
11
10
9 8
Figure 2.2. Example of a paddock system used for rotational livestock
grazing in a silvopasture adapted from (Hamilton 2008)

19
2.3. Financial Benefits of Tree, Forage, and Livestock Interaction
Research suggests that silvopasture systems can incorporate southern yellow pine and
livestock to produce an attractive land-use alternative relative to producing these components
individually (Grado et al. 2001; Husak and Grado 2002). After trees have reached sufficient size
and rotational grazing has commenced, research suggests overall profitability of a silvopasture
may be increased because each component can improve the overall physical performance of the
other components (Cutter et al. 1999; Garret et al. 2004; Hamilton 2008). For example, livestock
grazing under timber can improve timber growth and reduce management costs by helping to
control understory vegetation which can compete with trees for soil water and nutrients. In
addition, livestock can recycle and return nutrients used by understory vegetation to the soil
through their manure inputs (Lewis et al. 1984; Garret et al. 2004; Hamilton 2008).
Concurrently, trees can benefit livestock by providing shade which acts as a temperature
buffer for the animals and their forage (Lewis et al. 1984; Garret et al. 2004; Hamilton 2008).
By buffering animals and forage from heat and wind, livestock benefit via reduced heat stress
and reduced water loss from their forage (Garret et al. 2004; Hamilton 2008). As a result, trees
can reduce livestock production costs associated with water and supplemental feed (Garret et al.
2004; Hamilton 2008). It is important to remember however that livestock can damage young
seedlings and it is recommended to postpone livestock for 3 to 4 years until seedlings reach 5 to
6 feet in height (Hamilton 2008). Because silvopastures are stocked at 200 - 400 trees per acre,
there is increased importance on early tree survival when compared to traditional plantations due
to this lower stocking level (Garret et al. 2004; Hamilton 2008; Brauer et al. 2009).

20
2.4. Financial and Economic Considerations for Silvopasture Establishment
There are both initial and long-term considerations for establishing a silvopasture which
include personal objectives, markets, benefits and costs (Hamilton 2008; Godsey et. al. 2009).
The primary purpose of a silvopasture is the production of a high-quality timber component to
generate long-term revenue while producing livestock in the short-term. However personal
objectives should guide what species are utilized for components and how intensively the system
is managed. Based on those decisions, markets should be evaluated relative to the range of
products the landowner has chosen to produce (Grewal and Levy 2008; Hamilton 2008).
Analyzing a local market basically involves the evaluation of strengths, weaknesses,
opportunities, and threats (competition/regulation/changing consumer demands), and then
positioning the silvopasture operation to target the market segment that presents the greatest
opportunity (Grewal and Levy 2008).
After identifying the opportunities and purpose, other short-term considerations must be
given to establishment costs such as site preparation, seedlings, labor, and fencing while also
considering long-term effects of things such as the most advantageous tax value classification of
system, livestock and fence maintenance, watering structures for livestock, and
labor/management costs (Godsey 2007; Hamilton 2008). Figure 2.3 shows a limited example of
the table provided in Husak and Grado (2002) which shows the U.S. dollar costs and revenues
associated with each silvopasture management activity in the year that it occurs.

21
Year Activity Cost ($/acre) Revenue ($/acre)
0 Establishment 74.00
1 to 30 Fence establishment/maint. 114.76
2 to 30 Animal maintenance 5.00
4 to 30 Steer/heifer sales 217.34
4 to 30 Hunting lease 6.89
15 Thinning 212.00
25 Thinning 565.15
30 Timber harvest 2,653.59
Figure 2.3. Shows the year, activity, costs and revenues associated with silvopasture
management which should be identified and evaluated by those considering the establishment of
a silvopasture system (Monetary Benefits of a Silvopasture System in the Southeastern United
States adapted from Grado et al. 2001; Husak and Grado 2002).
Finally, a financial and economic analysis should be conducted to evaluate the relative
profitability of the silvopasture and economically evaluated in comparison to any alternative
land-use operations under consideration by the stakeholder (Husak and Grado 2002; Godsey
2007; Godsey et al. 2009). To be clear, financial concepts and metrics provide the basis for
many of the analytic tools that economists use, thus conducting a financial analysis of each
agroforestry component is generally needed so that economic analytics can evaluate and rank the
attractiveness of financial alternatives (Graham and Dodd 1934; Varian 2006; Godsey 2007;
Brooks 2008; Fleuriet 2008; Warren et al. 2008; Godsey et al. 2009; Ittelson 2009). Economics
can and does incorporate the principles of finance and accounting in studying how individuals,
businesses, and societies allocate finite resources among alternative productive uses for those
resources (Graham and Dodd 1934; Graham and Spencer 1937; Graham 1949; Mansfield 1997;
Godsey 2007; Plunkett et al. 2007; Brooks 2008; McConnel and Brue 2008; Godsey et al. 2009).
Agroforestry operations allocate finite resources therefore basic financial and economic

22
questions also apply to agroforestry production systems such as, what combination of goods can
be produced and what ratio is more efficient (Graham and Dodd 1934; Nicholson 2002; Ekelund
et al. 2006; Varian 2006; Godesey et al. 2009; Zhang and Pearse 2011)?
2.5. Silvopasture Economics: Components, Metrics, and Values
As previously mentioned silvopasture produces a combination of timber, forage, and
livestock on the same land-unit, but please note, that the ratio (and profitability) of these three
goods can differ among individual silvopastures due to site conditions or the species to be used
as components (Godsey et al. 2009). However, the ratios of trees, forage, and cattle that can be
produced are flexible but also finite; for example, there is an upper limit for tree and/or cattle
stocking before forage production would be impossible. Thus financial and economic analyses
can help identify and choose silvopasture component combinations and ratios by the
identification of values and the trade-offs associated with the range of production choices.
According to Godsey et al. (2009), the five most common economic tools used to evaluate
agroforestry operations are net present value (NPV), annual equivalent value or equivalent
annual income (AEV or EAI), benefit/cost ratio (BCR), internal rate of return (IRR), and land
expectation value (LEV). Similarly, the three most commonly used metrics in financial analysis
of traditional forestry projects are NPV, BCR, and IRR (Zhang and Pearse 2011).
Net present value (NPV) is commonly used to evaluate an investment’s financial viability
and is calculated by subtracting the present value of total costs from the present value of total
revenues (Varian 2006; Godsey et al. 2009; Zhang and Pearse 2011). Benefit/cost ratio (BCR)
is calculated by present value of total revenues by the present value of total costs and is used to
indicate the ratio of dollar benefit generated per each dollar cost. The internal rate of return

23
(IRR) is a discount rate at which the NPV of an investment equals zero (Godesey et al. 2009).
Land expectation value (LEV) is used to estimate land value based on the NPV of all expected
future revenues generated by a particular land-use (Husak and Grado 2002; Godsey et al. 2009;
Zhang and Pearse 2011). The LEV metric, also known as the Faustmann-formula, has been used
in traditional forest management primarily to calculate land value based on its ability to
continuously produce timber (Godsey et al. 2009; Zhang and Pearse 2011). However, the LEV
metric can be used with both tree and agricultural production (Godsey et al. 2009).
Individual financial metrics and economic methods have advantages under various
circumstances, thus the circumstances of each potential investment should be thoroughly
considered and assumptions should be defined (Graham 1952; Godsey et al. 2009; Zhang and
Pearse 2011). For example, Husak and Grado (2002) is well-known economic analysis of the
monetary and wildlife benefits produced by the incorporation of forestry and agricultural data
into a hypothetical silvopasture in the southeastern U.S. to demonstrate that the adoption of
silvopasture is both economically and biologically feasible. Using LEV, AEV, and ROR, not
only did Husak and Grado (2002) determine that a silvopasture utilizing loblolly pine and cattle
(cow-calve operation) was feasible but was more financially attractive when compared and
contrasted to the individual production of soybeans, rice, cattle, and pine plantation. Finally,
their analysis suggested that in addition to having more attractive cash-flows, silvopastures
incorporating hunting leases could, on average, yield 3.1% - 30.6% more value per acre over
silvopastures which did not incorporate them (Husak and Grado 2002).
According to Godsey et al. (2009), the five economic tools most commonly used in
agroforestry are net present value (NPV), annual equivalent value or equivalent annual income
(AEV or EAI), benefit/cost ratio (BCR), internal rate of return (IRR), and land expectation value

24
(LEV). Because agroforestry is the combination of two or more farm enterprises, these metrics
are designed and used with the purpose of evaluating the individual and collective values
associated with the operation’s revenues, assets, fixed costs, variable cash and non-cash costs,
and owner’s equity that are associated with each enterprise such as timber and livestock
production, land values, annual fence maintenance, equipment, inflation and taxes, but each
metric has an appropriate use in evaluating and ranking multiple projects in order of their
financial attractiveness (Warrant et al. 2008; Zhang and Pearse 2011).
It is possible however for a timberland or silvopasture owner to experience situations in
which those metrics are inaccurate or incapable of incorporating certain values. Economic
modeling of free cash-flow (FCF), discounted free cash (DCF), and net present value (NPV) are
important tools that can be used by economists in many situations where liquidity, earning
power, and business assets need to be valued in order to evaluate trade-offs among alternative
options (Varian 2006; Brooks 2008; Ittleson 2009; Zhang and Pearse 2011). However, NPV
along with LEV, EAI/AEV, and ROR (which are derived from the NPV calculation) can be
intrinsically limited by certain situations depending on many factors including the level of
accuracy needed, available data, capabilities of the model, and the variance among individual
objectives, circumstances, and regions (Brooks 2008; Houdet et al. 2009; Zhang and Pearse
2011). There is a gap in the agroforestry literature regarding the valuation of pre-merchantable
pine stands in silvopasture systems, and this gap could conceivably lead to the overvaluation or
undervaluation of the tree component if the farmer or landowner finds it undesirable or
impractical to collect such extensive data and conduct such robust economic modeling (Ward et
al. 2004; Brooks 2008; Houdet et al. 2009; Zhang and Pearse 2011).

25
In the case of valuing the pre-merchantable timber alone without the land value, and
when determining future timber market demands, prices and cash flows has been deemed
implausible or undesirable, forest economists have used the replacement cost approach (Zhang
and Pearse 2011). The replacement cost approach (or just cost approach) involves using the
nominal price or cost of tree establishment to determine and substitute (its time value) for the
cost of replacing the pre-merchantable timber held for investment or that is considered an asset
where value appreciates along with biological growth (Zhang and Pearse 2011). This calculation
is carried out by compounding the per acre cost of establishing a stand (which might include
seedlings, labor, herbicide treatment etc.) forward for the amount of time (number of years) since
establishment, at a specified interest rate, to its present value (Zhang and Pearse 2011).
Although the replacement cost value would not be able to replace a 3-year old loblolly
stand in a day (or even two years), the replacement cost value is used to represent the rise in
monetary cost of replanting the stand due to annual inflations but also the opportunity cost of
what the cash expense for tree establishment could have earned had it been put to work
elsewhere, such as in a savings account, certificate of deposit, government or corporate bond, or
stock equity (Zhang and Pearse 2011). The replacement cost of pre-merchantable timber is
calculated in the same manner as would be the compound interest on a savings account at a
commercial bank (Zhang and Pearse 2011). The replacement cost calculation follows the form
Vn =V0 (1+i)ⁿ where Vn is the present value of the investment, V0 is the establishment cost in the
year of establishment, (1+i) is the interest rate, and n = number of years or periods since
establishment. For example, a landowner wants to know the present value of replacing a 3-year
old southern pine timber tract that is on a 25 year rotation. The establishment cost was
$100.00/acre to establish, and the desired interest rate (expected rate of return) is 5%. The

26
replacement cost would be calculated as follows: 1) Vn = 100 (1 + .05)³; 2) Vn = 100 (1.1576); 3)
Vn = $115.76/acre.
Because the purpose of most landowners, who establish timber as an investment, is to
realize income from the future sales of timber, the present value (replacement cost) of the pre-
merchantable timber is understood to represent the future value of cash income generated by
future timber sales, but according to Zhang and Pearse (2011) the replacement cost approach has
an intrinsic link with NPV and future cash flows. However, at minimum, the replacement cost
will reflect and represent the opportunity cost associated with what the cash, that is invested in
timber establishment, could have earned if it had been put to the next best alternative such as
$100.00 cash in a savings account, bonds, or common stocks earning the same interest rate
(Godsey et al. 2009; Zhang and Pearse 2011). Timberland investments have been a historically
attractive way to diversify an investment portfolio and as a method for hedging the value of cash
against inflation (Zhang and Pearse 2011). According to the National Council of Real Estate
Investment Fiduciary (U.S. Trust 2010), from 1991 to 2009 southeastern timberlands provided
investors with a higher average annual return (10.3% total; approximately 5.5% for timber and
4.8% for the underlying land) and lower volatility or price risk (6.6%) than did assets of the 500
organizations listed in the S&P 500.
The replacement cost approach can therefore be used as a method for assigning a
contingent value estimate to pre-merchantable that is expect to produce timber as it matures over
the rotation period (Zhang and Pearse 2011). Moreover, the value of pre-merchantable timber
can be valued more accurately by the replacement cost approach than by discounted cash flows
(DCF/NPV) the younger the pre-merchantable stand is therefore the replacement cost approach
is most commonly used for accounting and tax purposes until the trees reach a marketable size
27
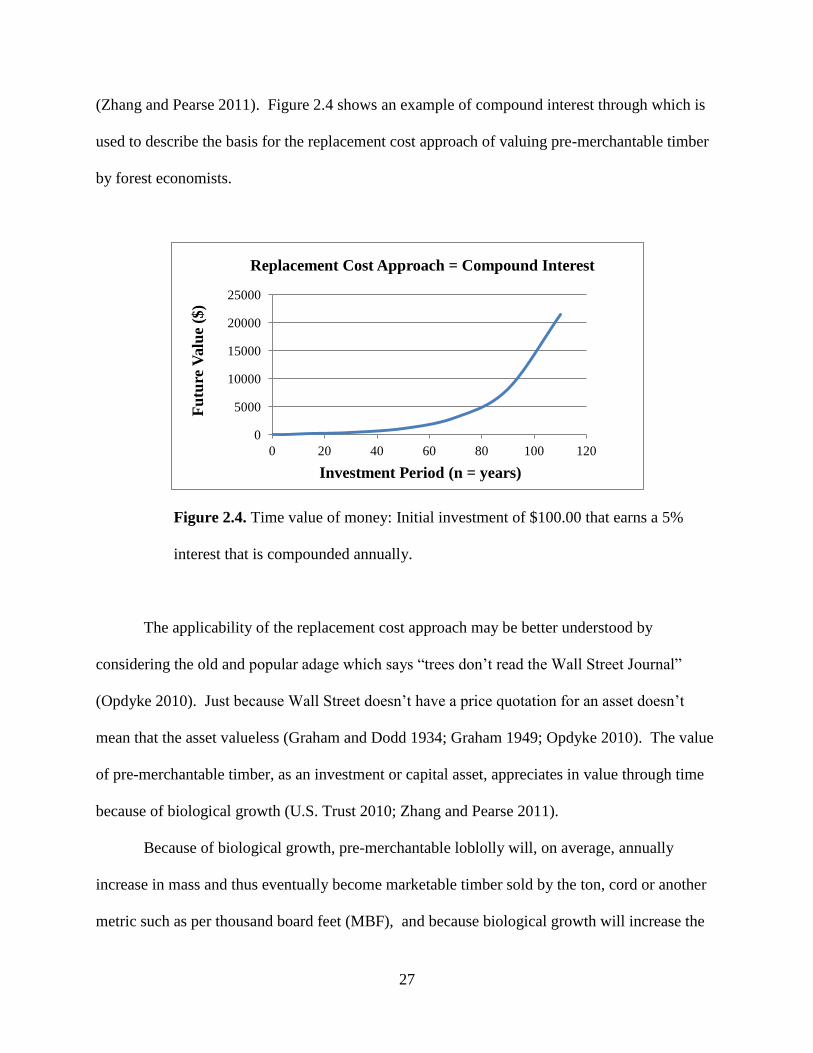
(Zhang and Pearse 2011). Figure 2.4 shows an example of compound interest through which is
used to describe the basis for the replacement cost approach of valuing pre-merchantable timber
by forest economists.
Figure 2.4. Time value of money: Initial investment of $100.00 that earns a 5%
interest that is compounded annually.
The applicability of the replacement cost approach may be better understood by
considering the old and popular adage which says “trees don’t read the Wall Street Journal”
(Opdyke 2010). Just because Wall Street doesn’t have a price quotation for an asset doesn’t
mean that the asset valueless (Graham and Dodd 1934; Graham 1949; Opdyke 2010). The value
of pre-merchantable timber, as an investment or capital asset, appreciates in value through time
because of biological growth (U.S. Trust 2010; Zhang and Pearse 2011).
Because of biological growth, pre-merchantable loblolly will, on average, annually
increase in mass and thus eventually become marketable timber sold by the ton, cord or another
metric such as per thousand board feet (MBF), and because biological growth will increase the
0
5000
10000
15000
20000
25000
0 20 40 60 80 100 120
Fu
ture
Valu
e ($
)
Investment Period (n = years)
Replacement Cost Approach = Compound Interest

28
price basis, metric or unit by which timber is sold at market, biological growth, in general, equals
greater mass/length/density that, when multiplied by price, can be sold at a higher market value
relatively speaking (U.S. Trust 2010; Zhang and Pearse 2011). The rate of biological growth is
thus very similar to compound interest rates, and the replacement cost approach is based on the
general trend that the rate of biological growth of southern pines steadily increases and
eventually a marketable value (Zhang and Pearse 2011).
However, as noted by Zhang and Pearse (2011), the stand establishment cost is
intrinsically linked through biological growth to future timber values. Because of this link, the
replacement cost approach is not completely separate from the methods of discounting future
revenues such as NPV or IRR however each method will produce a different value for the same
timber stand, thus the stands age will, in part, determine what method of valuation is appropriate.
Because the term value is relative, the interest rates and methods for assigning value should be
relative to the site specifics, circumstance, and objectives of the landowner/investor (Godesy et
al. 2009; Zhang and Pearse 2011). Thus, if a major objective involves high-quality timber
component, some landowners may want to understand how and why the replacement cost
approach (compounding the establishment cost) and NPV (discounting future timber revenue)
are intrinsically linked, and how to value pre-merchantable using both valuation methods and
how they are reconciled. According to Zhang and Pearse (2011), the link between stand
establishment cost and discounted future timber revenue can be shown by calculation of the
internal rate of return (IRR).
In order to do so, an example of the basic discounting process used for NPV calculations
of future timber revenue is required (Zhang and Pearse 2011). Basic discounting requires an
estimate of the revenue at final harvest, the number of years in the rotation, the current age of the

29
timber stand, and the discount rate (rate of return) desired or expected by the stakeholder. The
revenue produced at final harvest is then discounted, at the specified rate, for the time difference
(years) between final harvest and the current age of the stand. After data are obtained,
discounting calculations follow the general form V0 = Vn/(1 + i)n
where V0 = the present value of
the timber revenue in the current year, Vn = the expected future value of the timber revenue in
year n, (1 + i) = the discount rate, n = the number of years in the rotation to be discounted. The
result of the calculation will be the present value (V0) of the timber’s expected future value.
For example, using the numbers provided in the example calculating the replacement cost
approach, a 3 year-old southern pine timber tract has an expected rotation length of 25 years,
when it will yield 50 tons/acre of saw-timber and earn a 5% rate of return on the investment.
According to timber price listing service, the average pine saw-timber price was $24.00/ton in
the 1st quarter of 2012, therefore by multiplying 50 tons/acre by $24.00/ton, it is expected that
the timber will produce $1,200.00/acre. Following the general equation V0 = Vn/(1 + i)n the
discounting process for this example is as follows: 1) V0 = $1200/(1.05)22
; 2) V0 = $1200/2.925;
3) V0 = $410.22.
As can be seen from comparing this example to that of the replacement cost approach,
although the same timber stand data was used in the replacement cost approach and discounted
future timber revenue, two different values ($116/acre and $410/acre) were given for the same
stand, same age of 3-years, using the same interest/discount rate of 5%. To reconcile the
difference between values, the internal rate of return (IRR) is calculated using data from each
method. For IRR calculations, the required data are the stand establishment cost, revenue at final
harvest, and the total rotation years. Calculation of the IRR follows the form (IRR) = [(Vn/V0) -
1/25] – 1 where Vn = the expected future value of timber revenue and V0 = the establishment cost.

30
Using the $1,200.00/acre revenue at final harvest, $100/acre stand establishment cost, and the 25
year rotation is calculated as follows: 1) IRR = [($1200/$100) -1/25
]; 2) IRR = 1.1045 – 1; 3) IRR
= 10.45%.
The IRR of 10.45% represents both the interest rate at which $100.00 is compounded to
reach a value of $1,200.00 in 25 years {1,200 = 100 x (1 + 0.1045)25
}, and it is also the discount
rate that used to determine what $1,200.00 to be received 25 years in the future would be worth
today {$100 = $1200/(1.1045)25
}. This process is the reconciliation of the income approach and
replacement cost approach. The IRR (%) can then be substituted in either compounding or
discounting procedures as the interest or discount rate and will produce the same result at any
stand age (Zhang and Pearse 2011).
However, the problem with IRR is that it partially relies upon the timber quantity and
value at harvest, similar to most timber value calculations using NPV, LEV, and AEV. Although
historical southern pine timber has averaged 5.5% return on investment there is no guarantee that
it will do so in the future because biological growth, mortality rates, demands, markets, and
prices can change (U.S. Trust 2010; Zhang and Pearse 2011). In that case, the replacement cost
approach can use an interest rate of 3% because it is accepted to represent the average annual
rate of inflation although inflation rates fluctuate (Zhang and Pearse 2011). A 3% interest rate is
generally accepted because long-term financial investments, such as timberland and silvopasture,
are typically deemed unattractive if they do not generate at least a 3% rate of return which on
average will protect the investor’s monetary value from being eroded by inflation (Graham 1949;
Godsey et al. 2009; U.S. Trust 2010; Zhang and Pearse 2011).
In cases that involve valuing the young pine stands, the financial metrics used by
standard economic methods for valuing that timber may not be most appropriate. This is because

31
those economic metrics are all based and reliant on financial metrics for all future timber
volumes, market prices, and cash-flows. Although the production of high-quality timber is part
of a silvopasture’s purpose, economic methods which value pre-merchantable timber based on
forecasting and discounting all of the timber revenue expected many years in the future can lead
to overvaluation of the asset (Zhang and Pearse 2011). In contrast, the replacement cost
approach can undervalue timber, but it is a financial metric that is intrinsically linked to future
timber revenue and can also be used to represent the opportunity costs of alternate investing
activities both in the present and near future and thus provides a more accurate estimate the
younger the timber stand is (Zhang and Pearse 2011).
Furthermore, the tree component is also intended to improve cattle profit margins and
potentially generate financial benefits from tax incentives, cost-share programs, and hunting
leases. Therefore, use of the replacement cost approach and a minimum interest rate of 3%
(conservative interest rate) provides a reasonable financial metric for the value of pre-
merchantable timber. Moreover, the relative financial value produced by compounding the stand
establishment cost can be calculated quickly when the establishment cost is known. Combined
with the discounted revenues the landowner expects over two or three years of cattle or hay
production, the timber, cattle and hay values can be plugged into economic metrics such as NPV,
and may more accurately reflect silvopasture component values and potential trade-offs which
may be necessary in some short-term management situations. In any case, value is a relative
term and in many cases it is not synonymous as price therefore the methods, interest rates and
resulting valuation should be relative to the investor’s situation and objectives (Graham and
Dodd 1934; Varian 2006; Godsey et al. 2009; Zhang and Pearse 2011).

32
The analytical tools of finance and economics can provide valuable insights to biological
sciences as well pertinent information regarding the performance of silvopasture components as
a collective unit or in comparisons to operations which may produce timber, forage, or livestock
individually (Graham 1952; Godsey et al. 2009; Zhang and Pearse 2011). However, the
additional benefits that stem from the ability of a silvopasture to enhance environmental services
should not be ignored (Grado et al. 2001; Alavalapati and Mercer 2005). In addition to the well
known Husak and Grado (2002) analysis of silvopasture, other research suggests that additional
financial benefits from wildlife and the broader environment based ecological attributes of
silvopasture including the ability to improve wildlife habitat, reduce soil erosion, and improve
water quality (Godsey 2007; Hamilton 2008; Godsey et al. 2009; Sharrow et al. 2009). As the
trees in a silvopasture mature, they alter the structural, vertical and horizontal composition of
other habitat components that can lead to increased biodiversity, which in turn can be translated
into additional financial benefits from annual tax incentives, payments from cost-share programs
such as the Conservation Reserve Program (CRP) and Wildlife Habitat Incentive Program
(WHIP), and annual hunting leases (Husak and Grado 2002; Rollins et al. 2004; Godsey 2007;
Bambo et al. 2009).
In most cases, the practice of silvopasture improves wildlife habitat and attracts species
such as wild-turkey (Meliagris gallapavo), white-tailed deer (Odocoileus virginianus), and
rabbits (Sylvilagus spp.) by increasing the availability, diversity and quality of seasonal resources
(Leopold 1933; Grado et al. 2001; Sharrow 2001; Robinson 2005; Nowak et al. 2008; Sharrow et
al. 2009). However, the ability of a pine silvopasture system to alter the structure of habitat
components and attract wildlife also creates the potential for wildlife related damages
(Schuhmann and Schwabe 2000; Conover 2002; Rollins et al. 2004). The ability of a

33
silvopasture to attract wildlife creates the potential for damages to the timber component of a
young silvopasture that in turn could affect the timing of livestock introduction, which ultimately
could reduce a silvopastures financial performance and future management.
2.6. Wildlife Browse Damage: A Potential Cost to Pine Silvopasture Establishment
Regarding traditional forestry and agricultural practices, deer are known to cause severe
damage to orchards, nurseries, ornamental trees, and shrubs (Waller and Alverson 1997; Yates et
al. 1997; Conover 2002; Barras et. al. 2005; Semans and Helon 2008). In the United States for
example, wildlife professionals estimate that the annual cost of deer damage to timber and
agricultural productivity is approximately $750 and $500 million dollars respectively (Waller
and Alverson 1997; Conover 2002; Seamans and Helon 2008). Likewise, rabbits may be able to
impact the financial performance of a silvopasture, but unlike deer, there is limited quantitative
data pertaining to the economic impact of rabbit damage (Shelton and Cain 2002).
No silvopasture research has studied the effect of deer and rabbit browse damage on the
southern yellow pine silvopastures. Even traditional forestry research reports little data on this
subject, but with regards to deer, professionals at the USDA Forest Service state that if excess
deer are not harvested through hunting, they will soon deplete preferred food items and can turn
to browsing young pine trees (Campbell 1976; Yates et al. 1997). With regards to preferred food
items, deer utilize a variety of plant species throughout the year depending on the energetic and
nutritional requirements of deer’s life-cycle events including body growth and maintenance,
antler development, gestation (pregnancy) and lactation (Miller and Marchinton 1995; Dickson
2001).

34
In Alabama, it is common for deer to browse herbaceous plants such as wild
grape/muscadine (Vitis rotundifolia), Japanese honeysuckle (Lonicera japonica), common
persimmon (Dyospyros virginiana), blackberry/dewberry (Rubus spp.), green-briar (Smilax spp.),
sparkleberry/blueberry (Vaccinium spp.), and American beautyberry (Phytolacca americana)
(Dickson 2001; Cook and Gray 2003). These items are “preferred” by deer because they have
high nutritional quality and are easy for deer to digest (Dickson 2001; Cook and Gray 2003). If
these preferred species are limited, deer can turn to browsing young southern pines. As a result,
deer can inflict severe damage to young pines that limit or eliminate height growth for the first
five to six years (Campbell 1976; Waller and Alverson 1997; Yates et al. 1997; Brockway and
Lewis 2003).
Rabbits may be able to impact the timber component of a silvopasture, but like with deer,
there is limited quantitative data pertaining to the extent and effects of rabbit damage to southern
pine (Shelton and Cain 2002). Rabbits, unlike deer, are short-lived herbivores, with populations
experiencing an annual mortality rate of 80% to 90% (Dickson 2001). On an annual basis, rabbit
populations fluctuate widely due both to climate effects on food items like grasses and forbs, and
also because rabbits are prey for a wide range of animals (Dickson 2001). Although data is
limited, a few studies involving traditional loblolly pine-plantations have observed that rabbit
browse damage can reduce the annual growth of loblolly seedlings.
Visually identifying and differentiating between deer and rabbit browse damage is
determined by examining the edges of each seedling’s terminal buds and lateral stems (Conover
2002; Barras et al. 2005). Deer lack upper incisors, meaning that they must tear vegetation or
woody browse, such as green-briar or an oak sapling (Quercus spp.), resulting in a rough or
jagged appearance and is most often accompanied by plant fibers hanging from the perimeter of
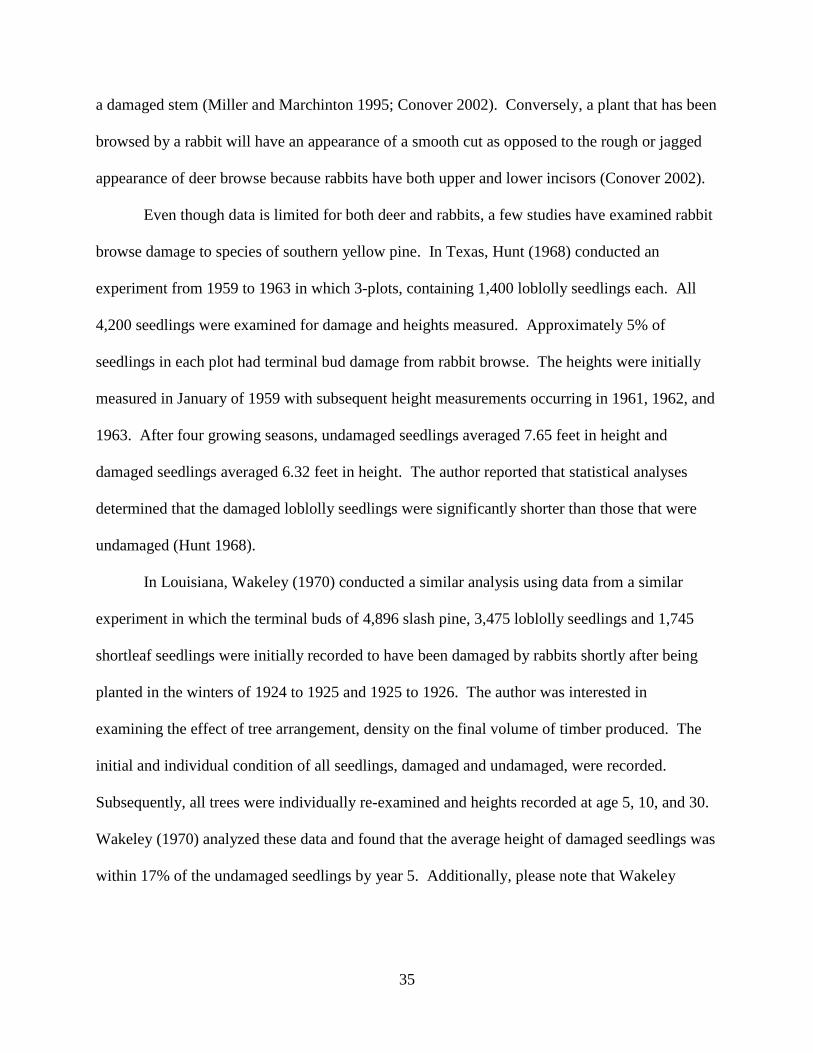
35
a damaged stem (Miller and Marchinton 1995; Conover 2002). Conversely, a plant that has been
browsed by a rabbit will have an appearance of a smooth cut as opposed to the rough or jagged
appearance of deer browse because rabbits have both upper and lower incisors (Conover 2002).
Even though data is limited for both deer and rabbits, a few studies have examined rabbit
browse damage to species of southern yellow pine. In Texas, Hunt (1968) conducted an
experiment from 1959 to 1963 in which 3-plots, containing 1,400 loblolly seedlings each. All
4,200 seedlings were examined for damage and heights measured. Approximately 5% of
seedlings in each plot had terminal bud damage from rabbit browse. The heights were initially
measured in January of 1959 with subsequent height measurements occurring in 1961, 1962, and
1963. After four growing seasons, undamaged seedlings averaged 7.65 feet in height and
damaged seedlings averaged 6.32 feet in height. The author reported that statistical analyses
determined that the damaged loblolly seedlings were significantly shorter than those that were
undamaged (Hunt 1968).
In Louisiana, Wakeley (1970) conducted a similar analysis using data from a similar
experiment in which the terminal buds of 4,896 slash pine, 3,475 loblolly seedlings and 1,745
shortleaf seedlings were initially recorded to have been damaged by rabbits shortly after being
planted in the winters of 1924 to 1925 and 1925 to 1926. The author was interested in
examining the effect of tree arrangement, density on the final volume of timber produced. The
initial and individual condition of all seedlings, damaged and undamaged, were recorded.
Subsequently, all trees were individually re-examined and heights recorded at age 5, 10, and 30.
Wakeley (1970) analyzed these data and found that the average height of damaged seedlings was
within 17% of the undamaged seedlings by year 5. Additionally, please note that Wakeley

36
(1970), unlike Hunt (1968), did not record seedling heights until year-5 and does not state what
the heights were or whether or not that 17% difference was significant.
More recently in Arkansas, Shelton and Cain (2002) conducted a controlled study to
investigate recovery of 1-year old loblolly pine seedlings from simulated rabbit browse damage.
The authors were interested examining the effect that the extent and seasonality of browse
damage have on the rate of recovery of naturally regenerating loblolly pine, probability of
multiple stems, and probability of damage from tip moth (Rhyacionia frustrana). The study was
conducted on forest lands owned by the University of Arkansas at Monticello. Loblolly
seedlings were extracted from an area beneath mature loblolly trees and re-planted at the study
site in prepared seedbeds.
Shelton and Cain (2002) randomly assigned seedlings to one of five damage treatments
and two season treatments being winter and spring. The five damage treatments were defined at
the point of clipping: one-half the distance between the root collar and cotyledons and to retain
25, 50, 75, and 100% of the height from the cotyledons to the terminal bud’s winter position. For
winter, the 100% treatment represented an unclipped control. Non-linear regression was used to
predict the second year height, probability of multiple stems, and probability of tip moth damage.
Their study observed 100% mortality for seedlings that were clipped below the cotyledon but an
average of 0.3% mortality in the other four treatments where seedlings were clipped above
cotyledons or were not clipped at all. Their results showed the height of severely damaged
seedlings (25% of height remaining) to have 2nd
year heights reduced by 40% in comparison to
the remaining treatments (Shelton and Cain 2002).
The results of those studies were far from conclusive but they do agree rabbit browse
damage can have an adverse impact on mean seedling height in the first 4 to 5 years from

37
planting (Hunt 1968; Wakeley 1970; Shelton and Cain 2002). Although a silvopasture manager
may supplement the livestock revenue while trees mature by harvesting hay or row crops from
the wide alleyways, the potential impact of deer and rabbit browse damage on the growth of
southern yellow pine during the first 3 to 4 years may prove important to landowners and the
financial performance of a silvopasture system.
For years, many considered cattle grazing and forestry to be mutually exclusive,
however, a little more than 30 years ago the science of silvopasture began to suggest that
livestock need be excluded only for the first few years, and then each will benefit the other by
working together (Clason 1995; Cutter et al. 1999). Silvopastures are commonly stocked at 200
to 400 stems per acre which may be less than half the tree stocking in a pine plantation (500 to
800 trees/acre or more), but economic studies suggest that the trees in a silvopasture mature they
can produce a diversity of financial benefits before being sold as merchantable timber including
improved livestock performance at lower costs due to the benefit of tree shade in reducing heat
stress and animal maintenance costs, and the annual revenue from hunting leases (Garret et al.
2004; Hamilton 2008; Godsey et al. 2009). However, the lower stocking and delay of livestock
make it desirable for the greatest number of trees to establish and grow.
As previously stated, many factors can have an effect on southern pine growth and
mortality, whether or not the trees are part of a plantation, silvopasture, or naturally regenerated
stand (Bendfeldt et al. 2001; Brauer et al. 2009; Sharrow et al. 2009). Although foresters have
studied the effects which factors such as soil chemistry, nutrient competition, diseases like
fusiform rust, and pests such as southern pine beetle (Dendroctonus frontalis) can have on pine
growth and mortality, data are limited regarding their effect on southern pine in a silvopasture
system stocked at 200 to 400 trees per acre (Shelton and Cain 2002). The assumption follows

38
then that because previous research has found silvopasture systems to be a viable method for
producing high-quality timber, the overall effects many natural factors have the growth and
mortality of southern yellow pine must have been within acceptable limits relative to the 200 to
400 trees per acre. Were it not so, economic research and analyses could not have concluded that
silvopasture is financially viable method for producing high-quality southern yellow pine timber.
Furthermore, for southern yellow pines in a silvopasture system, the livestock component
has become a potentially limiting factor in addition to those already known. Similarly, the effect
of damages and mortality to young pines in a silvopasture caused by livestock is not well
understood, but because of the same economic research, it is implied that the damage levels must
have been manageable as with the natural limiting factors. However, the results of previous
research on pine silvopastures also implies that the combination damages due to natural and
livestock factors can be both biologically and economically destructive thus scientists and
professional managers in Hamilton (2008) recommend the exclusion of livestock during the first
3 to 4 years.
2.7. Economics of Wildlife Damage: A Gap in Agroforestry Literature
The literature provides few examples for incorporating wildlife damage in standard
timber valuation methods and less on valuing damage to the timber component of agroforestry
systems. In Ward et al. (2004), the authors state that although limited published data existed
with regards to quantifying the economics of deer damage in forestry, most of the prior research
suggested that the benefits and effectiveness of using tree guards, shelters, or fencing to protect
seedlings in anticipation of deer damage were arguable and may not be cost effective. The
authors were concerned with the restricted nature of economic models concerning their potential
39
undervaluation of the impacts which mammals can have on forestry in Europe and North
America (Ward et al. 2004).
In order to improve forest economic models, their purpose was to quantify the financial
costs and benefits of roe deer (Capreolus capreolus) browsing damage on seedlings in British
forestry, stating that excessive densities of ungulates including white-tailed deer have been
shown to negatively impact plant diversity as well as the economics of agriculture and forestry
(Ward et al. 2004). The authors assessed the cost of roe deer damage to Sitka spruce (Picea
sitchensis) by analyzing the net present value (NPV) per hectare within a cost-benefit framework
by modeling different tree damage scenarios that translated into lower financial performance of
the forestry practice due to lower timber yield/hectare (Ward et al. 2004). The results of the
study concluded that the primary financial impact of roe deer damage was caused not by lower
timber yield or wood quality but rather by increased management costs of an extended tree
establishment phase due to browse damage on the terminal buds (leaders) of spruce seedlings
(Ward et al. 2004).
However, examples from traditional agricultural and forestry practices most often use net
present value of future cash-flows for timber, and acknowledge the need for more short-term
financial data because of the difficulty that comes with accurately identifying costs, future timber
prices, discount rates, and NPV estimates when both short- and long-term data are lacking. For
example, similar to Ward et al. (2004), Godsey and Dwyer (2008) model the NPV of deer
damage in a black walnut (Juglans nigra) plantation in Missouri, U.S.A. The plantation was
surveyed for signs of mechanical damage caused by deer rubbing young trees, 5 to 10 years old,
with their antlers thereby causing damage to the trees cambium. Subjective judgments were used
to estimate four categories of damage impacts and potential value loss of veneer quality logs

40
(Godsey and Dwyer 2008). Future timber yields and prices were estimated for stands with and
without damage. Those future values were then discounted back to present values and summed
to arrive at the net present (NPV) of systems with and without damage across 6 successive
discount rates in order to present range of relative values. The value loss or difference between
NPV no damage and NPV with damage, were taken to represent the landowners willingness-to-
pay (WTP) for protection of young trees. Willingness-to-Pay in this case is reflected on by shift
of the supply curve towards the origin thereby changing amount of consumer surplus (Ekelund et
al. 2006; Godsey and Dwyer 2008). Due to the deer damage, the lowered supply of black walnut
timber comes at a higher production price. This higher price results with less market consumers
who are willing or able to pay the increased price thus the landowner must reduce price;
therefore the cost of deer damage becomes a sunk cost which the producer cannot recover
(Godsey and Dwyer 2008). Similar to Ward et al. (2004), the study concludes by highlighting
the sensitivity of accurately valuing the costs of wildlife damage based on uncertain future wood
volumes, quality, market prices, and discount rates and state that future research is needed on the
potential impact of deer damage to timber values.
Limited research exists regarding the proper financial data collection and economic
models for wildlife damages in traditional forestry systems and it appears that a similar limitation
exists regarding the timber component of a silvopasture system. However, if humans are to
continue benefiting from agroforestry, the costs of wildlife damage must be understood so that
they can be better managed (Schuhmann and Schwabe 2000; Conover 2002; Ward et al. 2004).
The field of wildlife damage management is defined as increasing the positive values of wildlife
by decreasing the negative values, which is strikingly similar to the pure economic principle of
profit maximization by cost minimization (Conover 2002; Varian 2006). The field of wildlife

41
damage management itself is now evolving more from management towards what’s considered a
true science (Conover 2002). The concept of wildlife damage is necessarily relative to humans,
for without humans, human-wildlife conflict does not exist (Conover 2002).
Wildlife damage management is an interdisciplinary science of relativity which requires
the application of many disciplines (Conover 2002). Human population growth is projected to
continue increasing at an exponential rate well into the 21st century, doubling the 2010 levels of
food, fiber and energy consumption by 2050 (Nowak et al. 2005; Udawatta and Godsey 2010;
Prinn and Reilly 2012). According to research, humans will be required to adopt and adapt
multi-functional land-use systems on a scale that has never before been seen (USDA 2011). The
rise of agroforestry systems has occurred in little more than 30 years, and if it does continue, the
implementation of agroforestry systems will indeed alter landscapes; thus the science of wildlife
damage relativity suggests human-wildlife conflict cannot be escaped (Conover 2002; Udawatta
and Godsey 2010). The efficiency of a silvopasture system may therefore be questioned under
sustained damages from local wildlife populations, a subject that increasingly must be
understood (Hunt 1968; Campbell 1976; Pearson 1984; Miller and Marchinton 1995; Waller and
Alverson 1997; Conover 2002; Husak and Grado 2002; Shelton and Cain 2002; Shwiff 2004;
Godsey and Dwyer 2008; Hamilton 2008; Sharrow et al. 2009; USDA National Agroforestry
Center 2010; World Agroforestry Center 2010; Zhang and Pearse 2011).

42
CHAPTER 3
SILVOPASTURE ESTABLISHMENT AND ECONOMICS: THE COST OF WILDLIFE
BROWSE DAMAGE AT REDSTONE ARSENAL
3.1. INTRODUCTION
According to the MIT Center for Energy and Environmental Policy Research, by the year
2050 global demand for food and energy will be approximately double the amounts consumed in
2010 (Reilly and Paltsev 2007; Prinn and Reilly 2012). The estimates produced by MIT suggest
that the increased demand for food and energy dictates that organizations, producers and
consumers will have to adapt and utilize multi-functional agricultural and forest systems as never
before (Udawatta and Godsey 2010; Prinn and Reilly 2012; Susaeta et al. 2012). Conversely,
many believe that the multi-functional agroforestry practices of alley-cropping, forest-farming,
riparian buffers, silvopasture, and wind-breaks have the potential to significantly increase farm
and forest land-use efficiency (Clason 1995; Husak and Grado 2002; Workman 2003). In
contrast to many traditional management techniques, agroforestry practices improve efficiency
by systematically producing multiple goods and services on the same land-unit (Husak and
Grado 2002; Hamilton 2008; World Agroforestry Center 2010).
The use of agroforestry techniques has increased in the last 30 years, with silvopasture
becoming the most common practice in the southeastern United States (Sharrow 2001; Husak
and Grado 2002; Sharrow and Fletcher 2003; Hamilton 2008). Many public and private
organizations are investigating the potential costs and benefits of expanding its use across the

43
U.S. South (Sorrow 2011; Susaeta et al. 2012). For example, as a result of economic pressure
and its commitment to sustainable ecosystem management, in December of 2009 the United
States Army at Redstone Arsenal (RSA) implemented a limited area of loblolly pine silvopasture
to assess the feasibility of expanding its use on up to 1,500 acres of open pasture. Silvopastures
are designed to systematically integrate timber, forage, and livestock production on the same
land-unit (Stainback and Alavalapati 2004; Hamilton 2008; Hill 2008; Oswald et al. 2008;
Sharrow et al. 2009). Silvopasture is used to produce high-value timber products, such as saw-
timber and veneer-logs, while generating short-term cash-flows from the sale of livestock and
other products such as hay and pine-straw (Long 2003; Hamilton 2008).
In the southeastern U.S., yellow-pines such as loblolly (Pinus taeda), and slash (Pinus
elliottii), and longleaf (Pinus palustris) may be used as the timber component of a silvopasture
system (Kush et al. 2004; Hamilton 2008). Pine silvopastures can be established on existing
pasture land by planting single, double, or triple rows of trees while leaving wide, unplanted
corridors between them (Lewis et al. 1984; Clason 1995; Hamilton 2008; Sharrow et al. 2009).
The forage component of a silvopasture can include various mixtures of warm- and/or cool-
season legumes and grasses to be used as hay or food for livestock (Hamilton 2008). The
establishment and production of forage in silvopasture is similar to that of traditional pasture
management but is different in that the selected forage species should be more shade tolerant.
Suitable legumes include various species of clover (Trifolium spp.) and vetch (Vicia spp.) while
grasses may include rye-grass (Lolium spp.) or native species such as little bluestem
(Schizachyrium scoparium) and eastern gammagrass (Tripsacum dactaloides) (Hamilton 2008).
Likewise, the livestock component may be selected from a range of grazing animals
including domestic cattle (Bos taurus), domestic goats (Capra hircus), or domestic sheep (Ovis

44
aries) (Garret et al. 2004; Hamilton 2008). Proper timing of livestock introduction is important
as livestock can damage young seedlings by browsing, trampling, and rubbing them during the
first 3 to 4 years from establishment (Hamilton 2008; Brauer et al. 2009). Accordingly, the
United States Department of Agriculture’s National Agroforestry Center (USDA-NAC)
recommends that when landowners establish a pine silvopasture on non-forested tracts, livestock
grazing should be delayed for approximately 3 to 4 years (Hamilton 2008). During this time,
many southern yellow pine trees reach 5 to 6 feet in height and thus avoid being damaged by
livestock (Hamilton 2008).
Through time, trees can benefit livestock mainly by providing shade which acts as a
temperature buffer for the animals and their forage (Garret et al. 2004). By buffering animals
and forage from heat, livestock benefit via reduced heat induced physiological stress and forage
by reduced water and nutrient loss (Lewis et al. 1984; Garret et al. 2004; Hamilton 2008). As a
result, trees can reduce livestock production costs associated with water and supplemental feed
(Lewis et al. 1984; Hamilton 2008).
However, the postponement of livestock for 3 to 4 years can be prohibitive and is an
important consideration for those establishing a silvopasture with one of the main reasons being
that participating farmers and landowners must forgo the income and cash flow from livestock
sales, both of which are important for small businesses and thereby will be for a recently
undertaken agroforestry enterprise (Godsey 2007; Godsey et al. 2009). Accordingly, studies
have addressed these concerns and suggest that landowners may supplement the livestock
revenue during the first 3 to 4 years by harvesting hay or row-crops from the wide alleyways
between the tree rows (Husak and Grado 2002; Hamilton 2008).

45
Protection of the timber component during the early years is imperative, not only for the
future financial benefit of timber income and enhance livestock performance but because as the
trees mature they can produce benefits by enhancing wildlife habitat as well as the broader
environment (Husak and Grado 2002; Fike et al. 2004; Rollins et al. 2004; Lemus 2009). These
studies suggest that as the trees in a silvopasture mature they produce additional financial
benefits from annual tax incentives, payments from cost-share programs such as the
Conservation Reserve Program (CRP) and Wildlife Habitat Incentive Program (WHIP), and
hunting leases (Husak and Grado 2002; Godsey 2007).
In most cases, the practice of silvopasture improves wildlife habitat and attracts species
such as wild-turkey (Meliagris gallapavo), white-tailed deer (Odocoileus virginianus), and
rabbits (Sylvilagus spp.), benefitting both the landowner and nature (Hodge et al. 1999; Grado et
al. 2001; Robinson 2005; Nowak et al. 2008; Sharrow et al. 2009). However, the ability of a
pine silvopasture system to attract wildlife also creates the potential for wildlife related damages
to the timber component in a young silvopasture that in turn could affect the timing of livestock
introduction. The result of such a scenario could clearly reduce the financial performance of a
silvopasture, but this potential is not well understood.
As for the example of Redstone Arsenal, after an assessment of the 1-year old loblolly
pine seedlings in December of 2010, RSA personnel reported the existence of wildlife browse
damage on young seedlings. The presence of damage generated concern among RSA managers
about the impact to timber growth and value with respect to livestock because they intended to
incorporate cattle grazing leases (similar to those which they currently use on open pastureland)
after the seedlings reached sufficient size. Due to the need for cattle grazing revenue, they were
interested in understanding the potential impact that wildlife and cattle damage may have on the

46
value of loblolly pine. This made Redstone Arsenal an ideal location for research to examine the
impact of wildlife browse damage on the growth and value of tree and livestock components in a
pine based silvopasture system in Alabama. Valuing and accounting for the monetary benefits of
animal damage is not straightforward when damage is caused to a single agricultural crop, hence
it should not prove to be less difficult when estimating value for wildlife damage to the
multiple-use systems such as silvopasture. In many cases however stakeholders ask that these
damages be monetized in order for them to evaluate benefits and costs associated with alternative
management decisions.
The objectives of this study were to 1) Evaluate the silvopastures on Redstone Arsenal
for wildlife browse damage to the loblolly pine component and determine the biological
relationships with seedling mortality and growth but also with the timing of domestic cattle
introduction, 2) Monetize the biological impacts of multiple management scenarios relative to
the stated purpose and recommendations for tree and livestock components in a silvopasture
system as outlined by Pearson (1984) and Hamilton (2008) and others and, 3) once values for
multiple scenarios had been monetized, incorporate scenarios into a net present value (NPV)
framework so that alternative decisions could be ranked, compared, and contrasted by relative
values. In the case of Redstone Arsenal, wildlife damage must be monetized as a cost so that
potential trade-offs between relative timber and cattle grazing lease values may be evaluated by
RSA managers relative to timber and cattle grazing-lease values and decide whether or not to
postpone cattle introduction or to introduce under the uncertainty of potential loss in timber value
(Godsey 2007; Brauer et al. 2009; Godsey et al. 2009).

47
3.2. METHODS
3.2.1. Overview of study area
Redstone Arsenal is located in Madison County, Alabama and is home to the United
States Army Aviation and Missile Command; see appendix 1 for a state map with the location of
Madison County and Redstone Arsenal. The Arsenal is 38,100 acres (59.53 mi²) in size and
positioned near the south-west city limits of Huntsville, Alabama. The Arsenal is home to the
Marshall Space Flight Center and U.S. Missile Defense Command.
According to the U.S. Census Bureau (2010), the Huntsville Metropolitan Statistical area
has a population of approximately 417,593 people, making it the fourth largest city in the state.
Huntsville is geographically located in the Tennessee River Valley and is associated with the
Highland Rim and Cumberland Plateau physiographic regions and has a humid subtropical
climate and average annual precipitation of 57.5 inches. From 1981-2010, the normal high and
low temperatures range from 89.6°F in July to 32.0°F in January (NOAA 2011). In Madison
County, Alabama the underlying rock is predominately limestone, sandstone, and some acid
shale. According to the United States Department of Agriculture’s Natural Resource
Conservation Service (USDA-NRCS1993), the primary soil type in Madison County is Decatur
silty clay loam (DeB2).
Redstone Arsenal is in the Central Hardwood Forest region which includes Oak-Pine and
Oak Hickory forest types (Bailey 1980; Dickson 2001; Gurevitch et al. 2006). Upland forests
were comprised of a mixed variety of coniferous and broadleaf deciduous species, with
bottomlands being primarily hardwood; see appendix 2 for a list of common woody and non-
woody plant species. The total land area encompassed by RSA incorporates a portion of

48
Wheeler National Wildlife Refuge with common wildlife inhabitants including white-tailed deer,
wild turkey, and cottontail rabbits.
The diversity of flora provides quality habitat and aesthetics which promote a range
recreational opportunities for private citizens and allow sportsman to harvest game (primarily
deer on RSA) with the purchase of a special permit. The deer population density, according to
RSA postseason 2009 and preseason 2010 population surveys (conducted by RSA wildlife
biologists), averaged 30.12 deer per square mile. The average sex ratio was 38 males per 100
females, and the 2010 preseason recruitment rate of 74 fawns per 100 adult does.
A portion of RSA lands are reserved for agricultural use by private contractors. By
partnering with private citizens including local farmers, RSA receives much needed revenue that
is generated from agricultural crop and livestock grazing lease fees. In 2011, RSA foresters
reported approximately 2,000 acres of pastureland were under cattle grazing leases and an
additional 1,500 acres of unused but suitable pastures which they intended to lease. However, a
portion of the unused 1,500 acres was being utilized to assess the viability of silvopasture
systems for the possibility of producing high-quality timber and enhanced grazing leases on the
same land-unit.
3.2.2. Study sites within the larger study area
Within Redstone Arsenal’s silvopasture evaluation units, this study examined four
loblolly pine silvopastures that were established by RSA foresters in December of 2009.
Loblolly seedlings were stocked at 350 trees per acre, on a 6’x 8’x 40’ double-row spacing
arrangement oriented in an east-west direction. The natural vegetation which grew in all
silvopasture alleyways was maintained by RSA personnel through semi-annual mowing.

49
Each of the four silvopastures was assigned an ascending field identification number
which corresponded with descending field area: AGL1 (5.83 acres); AGL2 (4.80 acres); AGL3
(4.17 acres); AGL4 (2.86 acres). For example, Agroforestry Loblolly #1 and was abbreviated as
AGL1. All silvopasture sites were previously used by RSA for non-military grazing-leases.
Public access is to RSA is restricted, but within RSA, study sites AGL2 and AGL3 were located
inside an area of further access restriction. Accessing AGL2 and AGL3 for data collection was
contingent upon being granted further clearance by the Arsenal. Security clearance could not be
granted more than three days in advance, was subject to the military’s discretion; see appendix 3
for a map of the study area and location of study sites.
Study site AGL1 was located on Redstone Road and was bordered to the North by
perimeter fencing; to the East was a 2-year old shortleaf pine (Pinus echinata) silvopasture
planting; to the South was a 2-year old loblolly pine plantation; to the West was mature
bottomland hardwoods. Study site AGL2 was located on Anderson Road and was bordered to
the North by a 2-year old shortleaf pine silvopasture planting; to the East was a row of woody-
shrubs and a strip of mature loblolly pine which ran parallel to both the AGL2 eastern perimeter
and to an internal road which ran in a North-South orientation; to the South was a row of woody-
shrubs and mature mixed pine/hardwood forest; to the West was a 2-year old loblolly pine
plantation.
Study site AGL3 was located on Andersen Road and was bordered to the North by a 2-
year old shortleaf pine silvopasture planting; to the East was hedge-row and strip of mature
loblolly pine which ran parallel to both the AGL3 eastern perimeter and to an internal road which
ran in a North-South orientation; to the South was a row of woody-shrubs and mature mixed
pine/hardwood forest; to the West was a 2-year old loblolly pine plantation. Study site AGL4

50
was located on Macalpine Road and was bordered to the North by a 2-year old shortleaf pine
silvopasture planting; to the East was perimeter fencing; to the South was a small wildlife food
plot where soybeans were planted during the summer months; to the West was a row of woody-
shrubs and mature mixed pine/hardwood forest.
3.2.3. Study approach and techniques
This study was designed to collect a 10% representative sample of seedlings in each
silvopasture, using the systematically-randomized line-transect method. Due to the lack of data
on this topic, the study combined techniques from the sciences of forestry, wildlife biology, and
wildlife damage economics. The purpose of combining these techniques was to systematically
collect a representative of average seedling height, prior to cattle introduction according to, yet
incorporate an element of simple random design to assess the seasonality and spatial
characteristics of asymmetric wildlife movements and foraging behavior (Pearson 1984; Shelton
and Cain 2002; Hamilton 2008). These methods were combined in a way so that data could be
evaluated both biologically and economically, similar to the methods used by both Shelton and
Cain (2002) and Godsey and Dwyer (2008). Other observational data resulting from this study
design were collected to provide descriptive include: soil samples, field perimeter and plant
structure characteristics, observations of other animal and non-animal loblolly seedling damages.
This study was conducted according to four main tasks:
Task 1. Assess four silvopastures on Redstone Arsenal, collecting data that included
loblolly seedling mortality, seedling heights and growth, wildlife browse damage severity
and seasonality, and other observational field data to assist with habitat and study site
descriptions.

51
Task 2. Obtain 2009 and 2013 financial data from the appropriate personnel at Redstone
Arsenal that included revenue, cost, and time variables associated with the production of
trees, cattle, and hay.
Task 3. Using IBM SPSS Statistics19 (IBM 2012), conduct analysis of variance to
identify relationships between the dependent variable (seedling height in December of
2011) and independent variables (study site and wildlife browse damage category).
Task 4. Using PTAEDA 3 software (Burkhart et al. 2003), field and wildlife browse
damage data, and average seedling height in December of 2011, simulate one year of
additional seedling growth to estimate an average height range for seedlings in December
of 2012, when seedlings are 3-years old. Compare the 2012 seedling height projections
to the minimum heights recommended for livestock introduction in southern pine
silvopastures (Pearson 1984; Hamilton 2008).
Task 5. Based both on the proportion of seedlings that were projected not to satisfy the
2012 height requirements and the financial data which were collected by this study, use
the replacement cost approach and general discounting methods to calculate the 2012
financial values of three production options involving tree, cattle, hay, components. Use
net present value (NPV) framework to analyze the change in NPV per acre ($/acre) that is
associated with each management option and identify the proportion of value change that
is associated with wildlife browse damage to young trees.
3.2.4. Task 1 - Design implementation and biological data collection
For Task 1, there were a total of five data collection periods. The first data collection
period coincided with the study implementation. The implementation phase occurred over seven
non-consecutive days in late February and early March of 2011 (prior to the start of growing

52
season) due to military exercise security restrictions surrounding study sites AGL2 and AGL3.
Thereafter, the second, third, fourth and fifth (final) data collection period occurred in May, July,
September, and November of 2011 respectively.
Design implementation began by first establishing a sampling grid, comprised of line-
transects and seedling plots, in each of the four silvopasture study sites; all line-transects were
oriented in a north-south direction that traversed the double-rows in a perpendicular direction
relative to the east-west orientation of loblolly seedling rows. Within each grid, the south-east
corner of planted loblolly seedlings was randomly assigned to serve as the starting point for
systematically laying out the sampling grid. Beginning at the south-east corner, using a (Keson
NR10100) 100 foot measuring tape, a distance of 33feet was measured while pacing due-west
along the southern perimeter of loblolly seedlings. The point, representing a distance of 33feet,
was marked with a bamboo stake; this point served as the south end-point of the first line-
transect.
While standing at the south end-point of the first line-transect, a compass was used to
determine the azimuth of due-north and identify a fixed focal point. After traversing the length
of the first line-transect, a bamboo stake was placed on perimeter of the northern most seedling
row; the two stakes served as the end-points which delineated the first line-transect. Beginning
from the northern end-point of the first line-transect, a distance of 66feet was measured while
pacing due-west along the northern perimeter of loblolly seedlings. The point, representing
66feet, was marked with a bamboo stake; this point served as the north end-point of the second
line-transect.
From the north end-point of the second line-transect, a compass was used to determine
the azimuth of due-south and identify a fixed focal point. After traversing the length of the

53
second line-transect, a bamboo stake was placed on the perimeter of the southernmost seedling
row; the two stakes served as the end-points which delineated the second line-transect. Each
succeeding line-transect was separated by a distance of 66feet and the process of delineating
line-transects proceeded in precisely the same manner, moving from east to west, until reaching
line-transects could no longer be separated by 66 feet when approaching the western perimeter of
the silvopasture.
Second, after delineating all line-transects, loblolly seedling plots were identified for
measurement and visual assessments. For the purpose of this study, a “seedling plot” or just
“plot” consisted of two seedlings. There was one “seedling plot” per double-row set of
seedlings, and the number of seedling plots per line-transect was directly determined by the
number of double-row sets of seedlings which were traversed by that line-transect. For example,
if one line-transect traversed twelve double-row sets of seedlings, then twelve plots (24
seedlings) were identified for evaluation.
Third, each plot was identified by a combination of unique field-plot number and GPS
coordinates, for example, the first plot in silvopasture AGL1 was identified by the field-plot
number “AGL1-001.” Moving north along the line-transect, the second plot was AGL1-002.
The third plot was AGL1-003. All GPS coordinates which were collected using a TDS Nomad
system with SOLO Forest GIS mapping software. Plot locations were collected and joined with
digital maps provided by the Arsenal’s GIS specialist. Resulting maps were projected to North
American Datum 1983 (NAD 83), Universal Transverse Mercator Zone 16 (UTM 16).
Because of the double-row silvopasture design, to reduce sampling bias (after having
randomly selected the southeast corner of each silvopasture to serve as the starting point of the
first line-transect), each plot location alternated between the north and south row of seedlings.

54
As a result, the distance between plots along each transect alternated between 56’ feet and 40feet
respectively. The difference in spacing is due to the width of 8feet between individual seedling
rows, the alley width of 40 feet between each set of double rows, and the plot alternation. This
linear method of plot identification was precisely repeated in each of the silvopasture study sites.
Fourth, after identifying all seedling plots, the two loblolly seedlings in field-plot location
were identified individually as “treatment” and “control” seedlings. For example, AGL1-001
“treatment” seedling and AGL1-001 “control” seedling. Finally, the seedling located on the
east-side of each plot was randomly selected and designated as the “treatment.” Thus, the
seedling located on the west-side of each plot as the “control”. For example, “AGL1-001
treatment” was the seedling located on the east side of the first plot, located on the southernmost
row at the south end-point of the first line-transect, approximately 33 feet from southeast corner
the first silvopasture study site (AGL1). This method of field, plot, and seedling identification
was replicated precisely the same way for all seedling plots.
3.2.4. Task 1 (continued). Biological data collection
After design implementation was completed and all seedling plots were identified, data
collection began. First, seedlings were assigned a yes or no response to an initial
characterization as being alive or not alive, and were visually assessed for browse damage.
“Alive” designations were defined as seedlings which were still rooted, with foliage showing
signs of photosynthetic capability. “Not alive” designations were defined either as seedlings
with or without foliage but showing no visible signs of photosynthetic capability or those
seedlings which were not still rooted. If a seedling was missing from a plot where the

55
management forester indicated that one had been planted or where a seedling had been observed
and recorded in the previous data collection period then it was recorded as “missing”.
Second, seedling heights were measured twice, once during the initial data collection and
once during the final data collection. Seedling height data were categorized as “beginning
seedling heights” and “ending seedling heights respectively.” The height of all seedlings was
measured to the nearest inch. Seedling height was measured as the vertical distance from
ground-line to the apical meristem (terminal bud). Ending height measurements were not
recorded for seedlings with the mortality classification as “not alive.” Thus ending heights were
recorded only for seedlings with mortality status “alive.”
Third, all seedlings, whether alive or dead, were assigned a “yes” or “no” response to a
characterization as having been browsed or damaged. Any seedlings that had been browsed
were assigned the following responses in accordance with the literature to indicate browse
damage from deer (DR) or rabbits (RB) (Curtis and Sullivan 2001; Dickson 2001; Conover
2002). Browse damage that could not be clearly identified as either that of a deer or rabbit was
categorized as deer and rabbit (DR/RB). Following methods similar to Shelton and Cain (2002)
regarding the severity of damage, the location of browse damage on loblolly seedlings was
categorized as either “Lat” for lateral stem damage, “Term” for terminal bud damage or
“Term/Lat” for terminal bud and lateral stem damage. All other damage forms were categorized
as Other (OT). Other forms of non-browse damage included pine tip moth (Rhyacionia
frustrana), Fusiform rust (Cronartium quorum f. sp. fusiforme), soil excavations by animals such
as the nine-banded armadillo (Dasypus novemcinctus), and mechanical damage from farm
equipment.

56
Fourth, after all initial data were recorded, seedlings designated as “treatments” were
enclosed within Rigid Seedling Protector Tubes (measuring 48 inches in height and 6 inches in
diameter) which were then secured to a bamboo stake (measuring 60 inches in length and 1 inch
diameter) with a zip-tie. Rigid Seedling Protector Tubes were photodegradable and fashioned as
perforated mesh so that seedlings received full sun-light and to reduce the possibility of a
microclimate around the seedlings. Treatment seedlings were protected and control seedlings
were unprotected in an attempt to detect potential relationships between the growth rates of
undamaged loblolly seedlings and the following variables: severity of damage, seasonality of
damage, repetitious or multiple damages, and differing wildlife species.
Fifth, soil samples were collected from 20 random locations in each of the four study
sites. Beginning at the southeast corner of each site, samples were collected from random
locations by walking across each field in an alternating angular (zig-zag) pattern (Brady and
Weil 2002). Using a stainless steel hand trowel and bucket, vertical slices of the top 2 to 3
inches of soil were collected at each sampling location (Brady and Weil 2002). The hand trowel
and bucket were cleaned before sampling began in each field to reduce possible contamination.
All soil samples were analyzed by the Auburn University Soil Testing Laboratory located in the
ALFA Agricultural Services and Research Building on the Auburn University campus.
The study design resulted in the seedling and wildlife browse damage data being
collected from a total of 309 plots across four sites (AGL1=102 plots; AGL2 = 84 plots; AGL3 =
73 plots; AGL4 = 50 plots). The total number of seedlings examined was N = 618 (309 plots x 2
seedlings/plot = 618 seedlings). Table 3.1 provides a summary of the biological data that were
collected from four loblolly pine silvopasture sites on Redstone Arsenal in Madison County,

57
which began in February of 2011 and concluded in November of 2011 at which time seedlings
were 2-years old.
Table 3.1. Description of biological data that were collected between February of 2011 and
November of 2011 from four loblolly pine silvopasture sites on Redstone Arsenal in Madison
County, Alabama.
Study
site
(Field)
Seedling
Mortality
Category
Wildlife
Browse
Damage
Category
Mean Initial
Seedling Height
Measurements in
February of 2011
Mean Ending Seedling
Height Measurements
in November of 2011
Other
Data
AGL1
AGL2
AGL3
AGL4
*Alive
Not-
Alive
No damage
(category-1 =
least severe)
Lateral Stem
Damage
(category-2 =
mild severity)
Terminal Bud
Damage
(category-3 =
medium
severity)
Terminal Bud
& Lateral
Stem Damage
(category-4 =
high severity)
Height measurement
of all seedlings
(inches) recorded
during the first data
collection period in
February of 2011
Height measurement
of all seedlings
(inches) recorded
during the final data
collection period in
November of 2011-
(*Note: ending heights
were measured for
“Alive” seedlings
only)
Other
damage
soil
samples
descripti
ve data
for
surround
ing
habitat
3.2.5. Task 2 - Financial data collection
Cost and revenue data were also collected during the fall of 2011. The RSA managing
forester reported the establishment cost of $107/acre, in December of 2009, for 350 stems/acre
double-row loblolly pine silvopasture; the establishment cost included the price of seedlings,
site-prep, labor and one release-spray. The expected annual revenue from private contractors
(lessees) for cattle-grazing leases was reported to be $20/acre, with leases beginning in 2013.

58
Fencing materials were reported to be in place and that lessees are obligated for annual fence
maintenance costs. Hay production in silvopasture alleyways was reported as management
alternative to cattle leases. The expected annual quantities, revenue, and costs generated by “in-
house” hay production, were reported to be 6 hay-bales/acre (3 hay-bales/acre/twice per year),
$25/bale. The reported cost of hay production was $15/bale harvesting cost, with production
beginning in 2013. Table 3.2 lists nominal values for cost and revenue data that were collected
in 2011 for the assessment of silvopasture tree, forage (hay), and livestock (cattle) components of
four loblolly pine silvopastures on Redstone Arsenal in Alabama.
Table 3.2. Revenue and cost data collected in 2011 for assessment of tree, forage (hay), and
livestock (cattle) components of four loblolly pine silvopastures on Redstone Arsenal in
Alabama.
Year Activity Cost ($/acre) Revenue ($/acre)
2009 Stand establishment $107/acre ---
2013 - 2015 Fence est/maint --- ---
2013 - 2015 Animal maintenance --- ---
2013 - 2015 Cattle grazing lease --- $20/acre
2013 - 2015 *Hay production $90/acre $150/acre
* Indicates that producing hay and grazing cattle on the same acreage are considered to mutually
exclusive uses. RSA personnel indicated that the decision for cattle introduction will made in
December of 2012
3.2.6. Task 3 - Analysis of biological data
The statistical packages IBM SPSS Statistics (IBM 2012) was used to analyze biological
data that were summarized in table 3.1 which included study site, seedling mortality category,
wildlife browse damage category, and mean ending seedling height. First, following methods
similar to Shelton and Cain (2002), analyses were conducted using a one-way analysis of
variance (ANOVA) to examine statistical relationships between seedling mortality category

59
(dependent variable) and wildlife browse damage category (independent variable). Second, the
entire data set was split by seedling mortality category (“alive”; “not-alive”) because ending
height measurements were only recorded for the seedlings which were alive during the final data
collection period in November of 2011. Third, for seedlings that were alive, analyses used the
general linear model (GLM) procedure in the SPSS statistical package to conduct analysis of
variance (ANOVA) between mean ending seedling height (dependent variable) and the
independent variables (field; wildlife browse damage category).
The first independent variable was “Field” which had four levels: AGL1; AGL2; AGL3;
AGL4. The second independent variable was “wildlife browse damage category” which had
four levels (category-1 = no browse damage; category-2 = lateral stem browse damage; category-
3= terminal bud browse damage; category-4 = terminal bud and lateral stem damage). The four
levels of wildlife browse damage were based on methods used by Shelton and Cain (2002) and
Godsey and Dwyer (2008) respectively, in order to categorize the severity of rabbit browse
damage to loblolly pine seedlings and to categorize the severity of deer rubbing damage to black-
walnut trees.
Fourth, following methods similar to Shelton and Cain (2002), PTAEDA 3 software
(Burkhart et al. 2003) and the November-2011 mean ending seedling height for each of the four
levels of wildlife browse damage category, were used to project one additional year of seedling
growth to represent the average seedling height of each level one-year later in 2012. The
PTAEDA 3 software program provides users with a growth and financial evaluation model for
analyzing intensively managed loblolly pine plantations (Burkhart et al. 2003). PTAEDA 3 was
developed using region-wide growth data from loblolly pine trees growing in un-thinned site-

60
prepared plantations; trees are grown annually as a function of their size, the site quality, site
preparation treatments and the competition from neighbors (Burkhart et al. 2003).
To accomplish this simulation, the 2011 - mean ending seedling height for the four levels
of wildlife browse damage category were individually entered in to PTAEDA 3 as the
“beginning mean seedling height” for the 2012-growing season. Other input variables were
stand age (2-years) and trees per acre of 908. This was chosen to represent the approximate,
equivalent stocking of a 6’x8’x40’ double-row silvopasture at 350 trees per acre and to mimic
competition factors (Grado et al. 2001; Husak and Grado 2002). The site-index was input as 65,
which was obtained from the forester at Redstone Arsenal who manages the silvopastures. The
resulting 2012 height estimations were then compared against the seedling height
recommendations in Pearson (1984) and Hamilton (2008) for cattle introduction into the
southern pine silvopastures (5, 6, or 7 feet). Table 3.3 provides a categorical summary of the
process for how the average seedling height for each of the four levels of wildlife browse
damage category recorded for December of 2011 will be projected to grow for one year,
resulting in four corresponding average seedling heights in December of 2012 that are compared
to the heights 5, 6, and 7 feet which are the recommended minimum heights for cattle
introduction.

61
Table 3.3. Categorical description of how average seedling height data in four loblolly pine
seedling/damage groups in 2011, growth simulation methods, and PTAEDA 3 loblolly growth
software were used and resulted in four corresponding height estimates for those groups in
December of 2012.
Seedling
Mortality
Category
Observed Mean Height of
Loblolly Seedlings by
Wildlife Browse Damage
Category (Levels) in
December of 2011
Projected Mean Height of
Loblolly Seedlings by
Wildlife Browse Damage
Category (Levels) in
December of 2012 when
Cattle are Introduced
Recommended
Minimum Seedling
Heights for Cattle
Introduction into
Silvopastures (Pearson
1984; Hamilton 2008)
Alive Observed mean height of
seedlings with no damage
(category-1) in December
of 2011
Mean height of damage
category-1 seedlings in
December of 2012 when
Cattle are Introduced
Recommended
minimum seedling
heights are 5, 6, or 7
feet
Alive Observed mean height of
seedlings with lateral stem
damage only (category-2)
in December of 2011
Mean height of damage
category-2 seedlings in
December of 2012 when
Cattle are Introduced
Recommended
minimum seedling
heights are 5, 6, or 7
feet
Alive Observed mean height of
seedlings with terminal bud
damage only (category-3)
in December of 2011
Mean height of damage
category-3 seedlings in
December of 2012 when
Cattle are Introduced
Recommended
minimum seedling
heights are 5, 6, or 7
feet
Alive Observed mean height of
seedlings with both
terminal bud & lateral stem
damage (category-4)
Mean height of damage
category-4 seedlings in
December of 2012 when
Cattle are Introduced
Recommended
minimum seedling
heights are 5, 6, or 7
feet
3.2.7. Task 4 – Replacement cost approach, discounting, and net present value
First, the loblolly seedling establishment cost ($/acre) for silvopastures on Redstone
Arsenal (RSA), which is summarized in table 3.2, was manually incorporated into the
replacement cost approach following methods outlined by Zhang and Pearse (2011). All
replacement cost calculations of seedling value per acre ($/acre) followed equation 1 (Zhang and
Pearse 2011). Equation 1. Vn =V0 (1+i)ⁿ (eq. 1) where:
Vn = the present value of the investment

62
V0 = the establishment cost at year 0
(1+i) = the interest rate of return
n = number of years or periods since establishment
Because value is relative to the stakeholder, the nominal interest rates of 3%, 6%, and 9% were
selected for use in all financial calculations in order to yield a relative range of values that reflect
a diverse, yet reasonable range of expectations concerning the value per acre ($/acre) of the pre-
merchantable tree component of the silvopastures on Redstone Arsenal (RSA). The interest rates
(3%, 6%, and 9%) were based on similar rates of interest that are earned by alternative
investment opportunities such as corporate bonds, common stock equity, annuities, or another
land management practice (Grado et al. 2001; Husak and Grado 2002; Godsey 2007; Fleuriet
2008; Zhang and Pearse 2011). The alternative investment opportunities represent the
“opportunity costs” with regards to the time-value of the money that RSA invested in the tree
component of silvopastures via the seedling establishment cost, and the corresponding rate of
return associated with what the money (establishment cost) could have been reasonably expected
to earn if it had been invested in one of the alternatives (Ward et al. 2004; Zhang and Pearse
2011).
Please note that these interest rates are considered pre-tax returns both to provide a
broader range of applicability and due to unknown tax structures regarding the U.S. Army and
the private contractors who may or may not graze cattle on RSA silvopastures (Husak and Grado
2002; Godsey 2007; Godsey et al. 2009; U.S. Trust 2010; Zhang and Pearse 2011). However,
the benefits and rate of return that could be expected from producing a high-quality timber
component in a silvopasture system, based on the silvopasture literature, were also considered to
be reasonable expectations (Husak and Grado 2002; Godsey et al. 2009; U.S. Trust 2010; Zhang

63
and Pearse 2011). These values included: future timber revenues; premium cattle-grazing leases
due to reduced cattle production costs that result from tree shade; hunting leases or permit fees;
reduction of soil erosion, improved water quality, and increased bio-diversity; or combinations of
the previous expectations such as future timber revenue, premium cattle-grazing leases, and
increased bio-diversity (Grado et al. 2001; Husak and Grado 2002; Godsey 2007; Godsey et al.
2009; U.S. Trust 2010; Zhang and Pearse 2011).
Interest rates were chosen to represent rates of return that are similar to the following
investment objectives: 3% interest rate = average nominal rate of return from a 30-year U.S.
Government bond, could be conservatively expected for future timber value, and is also the
nominal rate needed to preserve the real or par value of money from being eroded by annual
inflation; 6% interest rate = 1991- 2009 average nominal rate of return on pine saw-timber or
the 10-year average rate of return on the S&P 500 (2002 – 2012); 9% interest rate = the 20-
year average rate of return on the S&P 500 (1987 – 2007) or a composite rate of return reflecting
expectations concerning the total rate of return generated by a high-quality timber component in
a complete silvopasture system over the length of a 25-year rotation including revenue from
future pine-saw timber revenues plus future premium cattle grazing leases due to tree shade
reducing cattle production costs plus revenue from improved hunting permit fees, cost-share
programs, and tax incentives (Graham 1949; Grado et al. 2001; Husak and Grado 2002; Ward et
al. 2004; Hamilton 2008; Godesey et al. 2009; Zhang and Pearse 2011). Table 3.4 summarizes
the selection of interest rates of 3%, 6%, and 9% based on conservative opportunity costs or
expectations concerning the financial benefits of a silvopasture tree component (Grado et al.
2001; Husak and Grado 2002; Godsey 2007; Godsey et al. 2009; Zhang and Pearse 2011).

64
Table 3.4. Basis for interest rates used in the replacement cost approach to assign a monetary
value to the pre-merchantable timber component of silvopastures on Redstone Arsenal in
Alabama. The interest rates of 3%, 6%, and 9% were used to reflect the opportunity costs of the
financial capital that was invested in seedling establishment (the rates of return return associated
with what the money could have been reasonably expected to earn if it had been invested in one
of the alternative investments), the expected rates of return associated with the production of
timber in a silvopasture system.
Interest
Rate (%)
Opportunity Cost of Money Invested
(seedling establishment cost) in the
Timber Component of a Silvopasture
Expected Returns on Timber
Component of Silvopasture
(3%) 30-year U.S. Government Bond earning
annual interest of 3%
Expectation for modest return on timber
and reduced cattle production costs
(6%) 10-year average rate of return on the
S&P 500 (2002 – 2012)
1991- 2009 average rate of return on
pine saw-timber
(9%) < 20-year average rate of return
(12.7%)on the S&P 500 (1987 – 2007)
Composite rate of return on a high-
quality timber, benefits for cattle,
hunting leases, and tax incentives
First, using each of the interest rates separately, the 2009 seedling establishment cost was
translated into the following forms using the replacement cost approach. 1) Seedling value per
acre in 2011 was calculated using by compounding the establishment cost for two years (2009 –
2011) using equation 1, in order to represent the seedling value per acre ($/acre) in 2011. 2) The
2011 seedling mortality per acre was used to reflect the 2011 seedling value ($/acre) that was lost
due to seedling mortality. The product of multiplying the 2011 replacement value ($/acre) by the
percentage of seedling mortality per acre resulted in the cost ($/acre replacement value loss) of
seedling mortality.
This cost of seedling mortality was used to reflect either the 2011 cost of replanting the
seedlings, the opportunity cost of that money invested elsewhere or the forgone benefits that may
have been expected from the trees in silvopasture as they mature. For example, if the seedling
mortality is expressed as a ratio of the initial stocking which was 350 trees per acre, then the

65
following holds true where: 35 seedlings per acre are recorded as “not-alive” for the year ending
December 31, 2011; 35 trees per acre/350 tree stocking = 10% loss of trees per acre = 10% loss
of 2011 replacement value per acre. In this case, the 2011 seedling mortality per acre (“not-
alive”) is paralleled precisely the 2011 cost per acre due to tree mortality (loss in replacement
value per acre). This cost was then considered an irretrievable cost or “sunk-cost” and was not
used in the net present value calculations; not because the mortality cost was unimportant but
rather because, in 2012, RSA could not manage for the loss which had already occurred. In
2012, the decision to introduce cattle was based on the value trade-offs between tree, cattle, and
forage components which had not yet occurred and could still be managed.
3) For the evaluation of seedling value in 2012 at the time of cattle introduction, the 2009
establishment cost per acre was compounded for three years (2009 – 2012) using equation 1, to
represent the 2012 replacement value per acre ($/acre) for seedlings at 3-years of age. 4) The
percentage of 2012 seedling replacement value per acre that was considered to be at-risk for
cattle introduction in 2012 was directly proportional the percentage of seedlings per acre below
the minimum recommended heights for cattle introduction based on the PTAEADA 3 growth
simulations for 2012 in comparison the minimum heights recommended for safe cattle
introduction (Pearson 1984; Hamilton 2008). This study uncovered no data related to expected
seedling mortality rates due to cattle introduction, therefore it was unknown if all of the “at-risk”
seedlings would be lost. As a result, five different cattle damage scenarios were examined
regarding loss of seedling replacement value per acre ($/acre) within the larger management
option to “introduce cattle” where: a) no at-risk seedlings were lost; b) one-quarter of at-risk
seedlings were lost; c) one-half of the at-risk seedlings were lost; d) three-quarters of the at-risk
seedlings were lost; e) all at-risk seedlings were lost.

66
Second, following the 2012 value (V0) per acre ($/acre) for the revenue and costs
associated with 2013 cattle leases and hay production were calculated by discounting their 2013
value (Vn) for one year using 3%, 6%, and 9% as discount rates (Zhang and Pearse 2011).
Because costs and revenues associated with timber, forage, and cattle components occurred at
different times, they had to be transformed into the same time-value (2012) in order to compare
potential value trade-offs at between system components at the time cattle are introduced
(Schwiff 2004; Zhang and Pearse 2011). Single-year discounting calculations for grazing lease
and hay production followed the general form equation 2. Discounting revenue and costs for
more than one year of cattle grazing leases and hay production followed equation 3.
Equation 2. V0 = Vn/(1 + i)n (eq. 2) where:
V0 = present value/acre in year 0
Vn = the future value in year n
(1+i) = the discount rate
n = number of years in the period
Equation 3. V0 = a[(1+i)n – 1]/i(1+i)
n (eq. 3) where:
V0 = the present value of annual livestock revenue/acre.
a = the annual revenue/acre.
(1+i) = the discount rate.
n = the number of years in the period.
Third, after having calculated all of the 2012 values/acre ($/acre) associated with the
silvopasture components and potential trade-offs under consideration, the 2012 present values
per acre (PV/acre) were incorporated into the net present value (NPV) framework. The NPV

67
framework was used to identify the net present value per acre (NPV/acre), and any subsequent
changes of NPV/acre, in order to rank and compare the benefits and costs ($/acre) associated
with three management options. The three management options examined were: 1) postpone
cattle with no hay production; 2) introduce cattle (no hay production) given the different cattle
damage scenarios within this option; 3) postpone cattle, produce hay, and allow “at-risk”
seedlings to grow an additional year before cattle introduction is reconsidered. Along with all
other relevant considerations, estimating the NPV/acre allowed for the relative examination of
trade-offs between timber, forage and cattle values that were associated with management
alternatives and available data. All net present value calculations followed equation 4 (Godsey
et al. 2009; Zhang and Pearse 2011). Equation 4. NPV = PVR - PVC (eq. 4) where:
NPV = the net present value in 2012.
PVR = the present value of revenues in 2012
PVC = the present value of costs in 2012
3.3. RESULTS
Following the study design, the number and distribution of initial seedling observations
by mortality category (alive; not-alive; missing) across all silvopasture sites in February of 2011
were alive = 442 (71%), not-alive = 90 (15%), and missing = 86 (14%). Table 3.5 and Table 3.6
list the initial seedling height data by mortality categories (alive; not-alive) and wildlife browse
damage categories respectively for alive and not-alive and report their respective initial mean
height measurements, standard deviation, and height range from minimum recorded height to the
maximum recorded height. Figure 3.1 shows the distribution of seedling observations by
68
mortality category and across the four silvopasture sites on Redstone Arsenal in November of
2011.
After initial seedling heights recorded in February of 2011, repeated browse damage
events were observed on less than 1% of all control seedlings during the second data collection
period in May of 2011, and there were no repeated damage observations during the third, fourth,
or final data collection periods (July-2011; September-2011; November-2011). It appears then
that more than 99% of the wildlife browse damage to seedlings occurred within the first year
from planting (2009 – 2010), prior to the first data collection period in February of 2011.
Table 3.5. Initial seedling height data by mortality category (alive; not-alive) for all silvopasture
sites on Redstone Arsenal in February of 2011.
Mortality
Category
Number of
Seedlings
Mean Seedling
Height (inches)
Standard
Deviation
(inches)
Minimum
Height
(inches)
Maximum
Height (inches)
Alive 442 16.06 3.57 5 31
Not-Alive 90 10.61 3.56 3 19
Table 3.6. Initial seedling height data by mortality and wildlife browse damage categories for all
silvopasture sites on Redstone Arsenal in February of 2011.
Mortality
Category
Wildlife Browse Damage Category
(Levels 1 – 4)
Number of
Seedlings
Mean Seedling
Height (inches)
Standard
Deviation
(inches)
Alive 1 = No damage 101 18.27 3.60
2 = Lateral stem damage 159 17.57 2.37
3 = Terminal bud damage 71 14.29 2.05
4 = Terminal bud and lateral stem
damage
111 13.03 3.09
Not-
Alive 1 = No damage 5 10.79 4.67
2 = Lateral stem damage 2 15.16 1.95
3 = Terminal bud damage 19 12.45 2.42
4 = Terminal bud and lateral stem
damage
64 9.91 3.55

69
Figure 3.1. Number (N = 618) and distribution of seedling observations by mortality
category for all silvopasture sites (AGL1; AGL2; AGL3; AGL4) on Redstone
Arsenal in February of 2011
By the conclusion of data collection in November of 2011, 18 of the original 442
seedlings which were categorized as alive lost all visual indication of photosynthesis and were
re-categorized as not-alive. The number and distribution of ending seedling observations by
mortality category in November of 2011 were alive = 424 (69%), not-alive = 108 (17%), and
missing = 86 (14%), respectively. Table 3.7 lists the ending seedling observations by mortality
categories alive and not-alive and report their respective initial mean height measurements,
standard deviation, and height range from minimum recorded height to the maximum recorded
height. The total number, mean ending height, and standard deviation of seedlings classified as
“alive” were: N = 424; X = 39.99in.; s.d. = 11.51in. Figure 3.2 shows the distribution of
442
90 86
0
50
100
150
200
250
300
350
400
450
500
Alive Not - Alive Missing
Nu
mb
er o
f S
eed
lin
gs
Mortality Category in February 2011

70
seedling observations by mortality category and across the four silvopasture sites on Redstone
Arsenal in November of 2011.
Table 3.7. Ending seedling height data by mortality category (alive; not-alive) for all
silvopasture sites on Redstone Arsenal in 2011
Mortality
Category
Number of
Seedlings
Mean Seedling
Height (inches)
Standard
Deviation
(inches)
Minimum
Height
(inches)
Maximum
Height
(inches)
Alive 424 39.99 11.507 9 89
Not-Alive 108 --- --- --- ---
Figure 3.2. Number (N = 618) and distribution of seedling observations by mortality
category for all silvopasture sites (AGL1; AGL2; AGL3; AGL4) on Redstone
Arsenal in November of 2011
424
108 86
0
50
100
150
200
250
300
350
400
450
Alive Not - Alive Missing
Nu
mb
er o
f S
eed
lin
gs
Mortality Category in November 2011

71
The observations for seedling mortality category within each silvopasture site on
Redstone Arsenal in 2011 are listed in Table 3.8 and were as follows: AGL1 (5.83 acres); AGL2
(4.80 acres); AGL3 (4.17 acres); AGL4 (2.86 acres). Figure 3.3 and Figure 3.4 show the
distribution and proportion of seedling observations within mortality category “not-alive” by
wildlife browse damage category levels for all silvopasture sites on Redstone Arsenal in
November of 2011. The percent seedling mortality by damage category was as follows:
category-1 (N = 10; 9.26%); category-2 (N = 6; 5.56%); (N = 21; 19.44%); (N = 71; 65.74%).
Interactions between variables for wildlife browse damage category, missing seedlings, and not-
alive seedlings were not analyzed for the purpose of seedling height at the time of cattle
introduction due to many influences and potentially confounding variables which included other
forms of animal damage and competition from vegetation that surrounded the pine seedlings.
For the purpose of the economic analyses, seedlings were considered to be definitively “not-
alive” only if they showed no visible signs of photosynthesis during the final data collection
period in November of 2011, even if they were recorded as not-alive during all five collection
periods because they can re-sprout foliage (Hunt 1968; Shelton and Cain 2002).

72
Table 3.8. Study site, mortality category, frequency, and percent of observations within each
silvopasture study site on Redstone Arsenal in 2011.
Study Site Seedling
Mortality Category
Number of
Seedlings
Percentage of Seedling Mortality
Observations Within Study Sites - (%)
AGL1 (5.83
acres)
Alive 164 80.0%
Not Alive 18 9.0%
Missing 22 11.0%
Total 204 100.0%
AGL2 (4.80
acres)
Alive 108 64.0%
Not Alive 38 23.0%
Missing 22 13.0%
Total 168 100.0%
AGL3 (4.17
acres)
Alive 102 70.0%
Not Alive 27 18.0%
Missing 17 12.0%
Total 146 100.0%
AGL4 (2.86
acres)
Alive 50 50.0%
Not Alive 25 25.0%
Missing 25 25.0%
Total 100 100.0%

73
Figure 3.3. Total number and distribution of seedlings in mortality category “not-alive”
by wildlife browse damage category levels for all silvopasture sites on Redstone
Arsenal in November of 2011
10 6
21
71
0
10
20
30
40
50
60
70
80
1 2 3 4
Nu
mb
er o
f S
eed
lin
gs
Widlife Browse Damage Category Levels (1 = No damage; 2 =
Lateral stem damage only; 3 = Terminal bud damage; 4 = Terminal
bud and lateral stem damage)
74
Figure 3.4. Proportion of observations within seedling mortality category “not-alive”
by wildlife browse damage category levels for all silvopasture sites on Redstone
Arsenal in November of 2011
Due to the small individual acreages of study sites, the soil analysis results (resulting soil
pH values for each study site were: AGL1 = 6.3; AGL2 = 6.3; AGL3 = 6.0; AGL4 = 6.7),
similarity of surrounding habitat, and other variable associated with location of the overall study
area, statistical analyses did not include field specific data. As a result, this study could neither
measure the height of seedlings prior to the initial damage nor differentiate the timing of
individual seedling damage during the 13-months between establishment in December of 2009
and February of 2011. Furthermore, the time interval between seedling establishment and the
first data collection period resulted in difficulties for the accurate identification and distinction
between browse damage caused by either a deer or rabbit as well as determining whether or not a
particular seedling had been repeatedly browsed during the 1st growing-season.
9%
6%
19%
66%
WBD level 1 = No damage
WBD level 2 = Lateral stem
WBD level 3 = Terminal bud
WBD level 4 = Terminal bud
and Lateral stem

75
Therefore all browse damage was collectively categorized as “wildlife browse damage.”
The total number and percentage of observations, ending mean seedling height, and standard
deviation of mean heights for seedlings in mortality category “alive” in all silvopasture sites on
Redstone Arsenal in November of 2011 are listed by wildlife browse damage category in Table
3.9 and were as follows: wildlife browse damage category-1 (N = 96; 22.64%; = 47.5in.; s.d. =
10.96in.); wildlife browse damage category-2 (N =155; 36.56%; = 45.8in.; s.d. = 7.61in.);
category-3 (N = 69; 16.27%; = 31.8in.; s.d.= 6.3in.); category-4 (N = 104; 24.53%; =
29.8in.;s.d. = 8.02).
Table 3.9. Summary of data for seedlings that were still alive at the conclusion of data collection
in November of 2011 by wildlife browse damage category, number of seedlings, ending mean
seedling height, and standard deviation of seedling heights across all silvopasture sites on
Redstone Arsenal.
Browse Damage
Category Levels
Number of
Seedlings “Alive”
Mean Ending
Seedling Height
(Inches)
Standard
Deviation (inches)
Category-1 (No
Damage) 96 47.54 10.96
Category-2 (Lateral
Stem) 155 45.84 7.61
Category-3 (Terminal
Bud) 69 31.75 6.31
Category-4 (Terminal
bud & Lateral stem) 104 29.77 8.02
3.3.1. General linear model and PTAEDA 3 seedling height productions
Using the findings above, general linear models were used to analyze independent
variables (field and wildlife browse damage category) for potential relationships with the
dependent variable (mean ending stand height). The statistical output, listed in Table 3.10,

76
indicated a significant interaction (F = 3.78) between independent variables (field * wildlife
browse damage category) at the 0.01 alpha-level (P < 0.01).
Table 3.10. General linear model statistical output of between-subjects interaction between
independent variables (field and damage category) on the dependent variable (mean seedling
height)
Model Degrees-of-freedom Mean square F- value P-value aCorrected model 15 1919.35 28.77 0.000
Field 3 113.16 1.70 0.167
Damage category 3 6748.78 101.164 0.000
Field * Damage
Category 9 250.05 3.748 0.000
aR² = 0.514; Adjusted R² = 0.496
The data were split by the wildlife browse damage variable and a pair-wise comparison
of field sublevel variables (AGL1; AGL2; AGL3; AGL4) and mean ending seedling height
revealed an interaction between study site variable AGL1 and wildlife browse damage variables
where the average height of seedlings in wildlife browse damage category-2 (46.17 inches) was
statistically taller (P = 0.011) than the average height of undamaged seedlings in category-1
(39.90 inches). However, the output revealed no interaction between independent variables in
field AGL2, AGL3, and AGL4. Table 3.11 provides the mean ending height of seedlings by
field and by wildlife browse damage category levels for all silvopasture sites on Redstone
Arsenal.

77
Table 3.11. General liner model estimated marginal means and confidence intervals of the main
effect interaction between independent variables (field * browse damage category) on dependent
variable (mean seedling height) for all silvopasture sites on Redstone Arsenal.
95% Confidence Interval
Field
Wildlife Browse
Damage
Category (levels:
1 - 4)
Mean
Seedling
Height
(inches)
Std. error Lower bound Upper bound
AGL1 (5.83
acres)
1 = No damage 39.895 2.109 35.749 44.041
2 = Lateral stem 46.175 0.925 44.357 47.993
3 = Terminal bud 32.087 2.583 27.009 37.164
4 = Terminal bud
and lateral stem
31.948 1.046 29.892 34.004
AGL2 (4.80
acres)
1 = No damage 47.732 1.155 45.462 50.003
2 = Lateral stem 44.816 2.358 40.181 49.451
3 = Terminal bud 30.874 1.467 27.990 33.758
4 = Terminal bud
and lateral stem
24.252 2.109 20.106 28.398
AGL3 (4.17
acres)
1 = No damage 50.287 1.741 46.864 53.710
2 = Lateral stem 45.098 1.291 42.559 47.637
3 = Terminal bud 30.874 1.826 29.402 36.583
4 = Terminal bud
and lateral stem
24.252 1.826 26.213 33.393
AGL4 (2.86
acres)
1 = No damage 50.287 2.723 47.187 57.891
2 = Lateral stem 45.098 1.634 43.277 49.700
3 = Terminal bud 32.993 2.888 25.917 37.270
4 = Terminal bud
and lateral stem 29.803 2.888 17.728 29.082
Although the model indicated an interaction between AGL1 and wildlife browse
damage category, as shown in Table 3.11 the mean heights of seedlings in wildlife browse
damage category-1 for study sites AGL2, AGL3 and AGL4 were statistically taller than that of
seedlings in wildlife browse damage category-2. Table 3.12 and Figure 3.5 show the results
comparisons between wildlife browse damage category levels and mean seedling height for all
silvopasture sites on Redstone Arsenal.

78
Table – 3.12. Estimated marginal means from the linear model – effect of independent variable
(field) on dependent variable (mean seedling height).
95% Confidence Interval
Independent Variable
(Field)
Mean Seedling
Height (inches) Std. error Lower bound Upper bound
AGL1 37.526 0.904 35.749 39.303
AGL2 36.919 0.918 35.113 38.724
AGL3 39.545 0.843 37.888 41.202
AGL4 38.506 1.293 35.964 41.049
Independent Variable
(Wildlife browse
damage category)
Mean Seedling
Height (inches) Std. error Lower bound Upper bound
1 = No damage 47.613 1.007 45.634 49.593
2 = Lateral stem 45.644 0.820 44.033 47.256
3 = Terminal bud 31.887 1.132 29.662 34.112
4 = Terminal bud and
lateral stem
27.352 1.037 25.313 29.391
As shown in table 3.12, in the marginal means estimated by the general linear model is
contrasted to those for wildlife browse damage category, and when the data were split by field
variables the statistical interaction between independent variables offered a different point of
reference for interaction between field and browse damage variables. Table 3.13 provides the
output of the general linear model that showing the statistics for main effects between the two
independent variables (field and wildlife browse damage category) when the data were split by
field variable. A pair-wise comparison between wildlife browse damage category levels and
average stand height revealed that undamaged seedlings (wildlife browse damage category-1)
and seedlings with lateral stem damage only (wildlife browse damage category-2) were not
statistically different (P = 0.767) across all silvopasture study sites.

79
Figure 3.5. Mean seedling (N = 424) height by wildlife browse damage category
for all silvopasture sites on Redstone Arsenal in November of 2011
Additionally, the statistical output indicated that the average height of both undamaged
seedlings (wildlife browse damage category-1) and seedlings with lateral stem damage only
(wildlife browse damage category-2) were both significantly taller (P < 0.01) than the mean
height of seedlings with terminal bud damage (wildlife browse damage category-3) and seedlings
with both terminal bud and lateral stem damage (wildlife browse damage category-4), which
were not statistically different from each other (P = 0.117).

80
Table 3.13. Results of the pair-wise comparisons between wildlife browse damage category
levels and mean seedling heights across all silvopasture sites on Redstone Arsenal in 2011.
95% Confidence
Interval
Browse damage
category
Browse damage
category
Mean
difference
Std.
error P-
value
Lower
bound
Upper
bound
1= No damage 2 = Lateral stem 2.92 3.008 0.767 -4.94 10.77
3 = Terminal bud 16.86 2.139 0.000 11.27 22.44
4 = Terminal bud
and lateral stem 23.48 2.754 0.000 16.29 30.67
2 = Lateral stem 1 = No damage -2.92 3.008 0.767 -10.77 4.94
3 = Terminal bud 13.94 3.181 0.000 5.64 22.25
4 = Terminal bud
and lateral stem 20.56 3.624 0.000 11.10 30.03
3 = Terminal bud 1 = No damage -16.86 2.139 0.000 -22.44 -11.27
2 = Lateral stem -13.94 3.181 0.000 -22.25 -5.64
4 = Terminal bud
and lateral stem 6.62 2.943 0.117 -1.06 14.31
4 = Terminal bud
and lateral stem 1 = No damage -23.48 2.754 0.000 -30.67 -16.29
2 = Lateral stem -20.56 3.624 0.000 -30.03 -11.10
3 = Terminal bud -6.62 2.943 0.117 -14.31 1.06

81
Figure 3.6. Results of the analysis between wildlife browse damage levels and mean
seedling height in average stand height across each wildlife browse damage category
levels across all silvopasture sites on Redstone Arsenal
Based on the mean heights of the four wildlife browse damage levels showing in Figure
3.6, PTAEDA 3 growth and yield software projected a range of 7to 8 feet as the average height
of seedlings in wildlife browse damage category-1and browse damage category-2. When
compared to the Hamilton (2008) recommendation of 5 to 6 feet and 7 feet in Pearson (1984), the
projected range of 7 to 8 feet would satisfy minimum height recommendations by the end of the
3rd
growing season in December of 2012. Alternatively, the projected average height of
seedlings in browse damage category-3 and browse damage category-4 were in the height range
of 4 to 6 feet which would meet the height requirement of 5 feet but not the height requirement
of either 6 or 7 feet. Utilizing existing literature and the results of the PTAEDA 3 seedling
47.54" 45.84"
31.75" 29.77"
0
5
10
15
20
25
30
35
40
45
50
1 2 3 4
Mea
n S
eed
lin
g H
eigh
t n
ches
Widlife Browse Damage Category Levels (1 = No damage;
2 = Lateral stem damage only; 3 = Terminal bud damage; 4 =
Terminal bud and lateral stem damage)

82
height projections in characterizing the percentage of trees with terminal bud damage (category-3
= terminal bud damage; category-4 = terminal bud and lateral stem damage) to potentially be at
risk of mortality due to cattle introduction; results are presented in Table 3.11.
Table 3.14. PTAEDA 3 projected loblolly average seedling height in December of 2012 for all
four wildlife browse damage category level in comparison to the recommended minimum
heights for cattle introduction to pine silvopastures on Redstone Arsenal in Alabama.
Seedling
Mortality
Category;
(Number of
Seedlings)
Mean Height of Loblolly
Seedlings by Wildlife
Browse Damage Category
(Levels) in December of
2011
Projected Mean Height of
Loblolly Seedlings by
Wildlife Browse Damage
Category (Levels) in
December of 2012 when
Cattle are Introduced
Minimum Seedling
Heights for Cattle
Introduction
(Pearson 1984;
Hamilton 2008)
Alive; (96) (Category-1; 47.54 in.) 85 – 106 inches = 7 – 8 feet
5 feet =
6 feet =
7 feet =
Pass
Pass
Pass
Alive; (155) (Category-2; 45.84 in.) 86 – 101” inches = 7 – 8 feet
5 feet =
6 feet =
7 feet =
Pass
Pass
Pass
Alive; (69) (*Category-3; 31.75 in.)
53 – 67 inches = 4 – 6 feet
(*At-Risk for cattle
introduction*)
5 feet =
6 feet =
7 feet =
Pass
*Fail
*Fail
Alive; (104) (*Category-4; 29.77 in.)
49 – 67 inches = 4 – 6 feet
(*At-Risk for cattle
introduction*)
5 feet =
6 feet =
7 feet =
Pass
*Fail
*Fail
Based on the output from PTAEDA 3 growth simulations listed in Table 3.14, the
projected average height of seedlings with terminal bud damage and terminal bud plus lateral
stem damage (the seedlings in both category-3 and category-4) will not satisfy the minimum
height recommendations for 6 to 7 feet (Pearson 1984; Hamilton 2008). Collectively, the total
proportion of seedlings per acre represented by these two categories is 28% of seedlings per acre.
The product of multiplying 28% of seedlings per acre by the 2012 seedling replacement value
per acre resulted in the financial projection that a directly proportional 28% of 2012 seedling

83
replacement value per acre ($/acre) was classified as being at-risk due to insufficient average
height.
Figure 3.7 shows proportional representation of seedlings per acre grouped by mortality
category in 2011 (alive; not-alive; missing). The 69% of seedlings “alive” in 2011 are
subdivided by wildlife browse damage category levels (WBD Levels) with 41% of the orginial
350 trees per acre reflected in category levels 1&2, which not projected to be at-risk for cattle
introduction in 2012 (refer back to Table 3.14) . However, the results of PTAEDA 3 loblolly
growth simulations project the seedlings in wildlife browse damage category levels 3&4 (28%)
to be at-risk for cattle introduction for all silvopasture sites on Redstone Arsenal in 2011. Even
though the missing 14% of seedlings per acre and the 17% seedling mortality per acre are
reflected in 2011 nominal values, the unit value is on a per acre basis, therefore the value of the
other 69% of seedlings per acre were considered as 69% of the 2012 replacement value per acre
and is both intrinsically linked to and directly based directly 2009 seedling establishment cost
($/acre).
Figure 3.7. Proportional representation of establishment cost value per acre ($/acre)
for all silvopasture sites on Redstone Arsenal in 2011.
41%
28%
17%
14%
WBD Levels 1 & 2
WBD Levels 3 & 4
"Not-alive"
"Missing"

84
3.3.2. Replacement cost approach and general discounting
Using the 2009 seedling establishment cost of $107/acre, the replacement cost approach
and three interest rates, the results for the 2012 seedling replacement value ($/acre) were
calculated as $117/acre, $127/acre, and $138/acre at 3%, 6%, and 9% interest rates respectively
for all silvopasture sites on Redstone Arsenal and are displayed in Table 3.15. The results of
discounting cattle lease revenue for one year, from 2013 to 2012, were $19/acre, $19/acre
respectively. Following similar discounting procedure for hay revenue, the results were
$58/acre, $57/acre, and $55/acre respectively and are summarized in Table 3.16. In Table 3.17,
product of multiplying the 2012 seedling replacement value ($/acre) by the five different
seedling mortality rates associated with the 28% of seedlings per acre that the PTAEDA 3
growth simulations projected to be at-risk for cattle introduction in 2012 ranged from $8/acre to
$39/acre loss in seedling replacement value per acre. Table 3.18 provides an outline as to how
individual 2012 values for seedlings, cattle, hay, and potential seedling damage costs were
classified as a benefit or cost and incorporated in the net present value framework.
Table 3.15. 2012 replacement cost value per acre for 3-year old loblolly seedlings across all
silvopasture sites on Redstone Arsenal.
Establishment and Replacement Value
Interest Rates (%)
3% 6% 9%
2009 Seedling Establishment Cost ($/acre) $107/acre $107/acre $107/acre
Number of years used in Equation 1 3-years 3-years 3-years
2012 Seedling Replacement Value ($/acre) $117/acre $127/acre $138/acre

85
Table 3.16. 2013 nominal values ($/acre) of individual cattle and hay components discounted to
2012 values ($/acre) for all silvopasture sites on Redstone Arsenal.
Discount
Rate (%)
2013 Cattle
Lease
Value
($/acre)
2012 Discounted Cattle
Lease Value ($/acre)
2013 Hay
Productio
n Value
($/acre)
2012 Discounted Hay
Production Value ($/acre)
3% $20/acre $19/acre $60/acre $58/acre
6% $20/acre $19/acre $60/acre $57/acre
9% $20/acre $18/acre $60/acre $55/acre
Table 3.17. Potential loss of seedling value based on the 2012 replacement cost value for
seedlings and the PTAEDA 3 projections for seedlings “at-risk” for cattle introduction to
silvopastures at Redstone Arsenal in 2012.
2012
Replacement
Cost Value
Per Acre
($/acre)
Scenario B (one-
quarter were lost)
Scenario C (one-
half were lost)
Scenario D (three-
quarters were lost)
Scenario E (all
were lost)
$117/acre ($8/acre) ($16/acre) ($25/acre) ($33/acre)
$127/acre ($9/acre) ($18/acre) ($27/acre) ($36/acre)
$138/acre ($10/acre) ($19/acre) ($29/acre) ($39/acre)

86
Table 3.18. Net present value per acre (NPV/acre) of 2012 benefits/acre minus the 2012
costs/acre of management decisions regarding the introduction of cattle and potential trade-offs
between the value of the tree component for all silvopasture sites on Redstone Arsenal
December 2012: Management Options and
Damage Scenarios for Tree, Cattle , and Hay
Production
NPV/acre = (∑PVB/acre – ∑PVC/acre) @
3%; 6%; 9%;
Option 1. Postpone cattle assuming that all “at-
risk” seedlings and associated seedling
value/acre would be lost (** Hay would not be
produced from silvopasture alleys in the absence
of cattle introduction unless indicated**)
2012 NPV/acre = (28% of 2012 tree
replacement value/acre) – (2012 cattle lease
value/acre)
Option 2. Introduce Cattle (scenario A) :
assuming no loss of “at-risk” seedlings
2012 NPV/acre = (2012 cattle lease
value/acre)
* scenario (2-B): assuming one-quarter
of “at-risk” replacement value/acre was
lost
2012 NPV/acre = (2012 cattle lease
value/acre) – (7% of 2012 replacement
value/acre)
* scenario (2-C): assuming one-half of
“at-risk” replacement value/acre was lost
2012 NPV/acre = 2012 cattle lease
value/acre) – (14% of 2012 replacement
value/acre)
* scenario (2-D): assuming three-
quarters of “at-risk” seedlings and
associated seedling value was lost
2012 NPV/acre = (2012 cattle lease
value/acre) – (21% of 2012 replacement
value/acre)
* scenario (2-E):introduce cattle
assuming all “at-risk” seedlings and
associated seedling value was lost
2012 NPV/acre = (2012 cattle lease
value/acre) – (28% of 2012 replacement
value/acre)
Option 3. Postpone cattle and produce hay:
assuming all “at-risk” seedlings and associated
replacement value/acre would be lost
2012 NPV/acre = (2012 hay value/acre +
28% of 2012 seedling replacement
value/acre) – (2012 cattle lease value/acre)

87
3.3.3. Net present value (NPV/acre) of management options
The results of the net present value analyses are listed in Table 3.19, with the highest
NPV/acre resulting from management option 3(postpone cattle and produce hay) and ranged
from $72/acre to $76/acre. If hay production is not an option, then management option 1
(postpone cattle introduction) produced the next highest NPV/acre ranging from $14/acre to
$21/acre, unless the management scenario-2A (cattle introduction and no loss of “at-risk”
replacement value/acre) could be expected to occur. In this management scenario, postponing
cattle produced the highest NPV/acre because the loss of one-quarter of at-risk seedling resulted
in a lower NPV per acre.
In contrast to postponing cattle, if even one-quarter of the 28% of seedling value was
expected to be lost, such as in management scenario 2-B then the NPV/acre declined to a range
of $8/acre to $11/acre which was below the $14/acre to $21/acre that was calculated for
management option 1 where cattle were introduction was completely postponed and the
revenue/acre for the cattle leases ($18/acre to $19/acre) represented the opportunity cost of tree
production. If cattle are introduced and no loss was expected then the NPV of $18 to $19/acre
was the highest that could be expected. Finally, however, in management scenarios 2C – 2E, the
NPV/acre varied widely based on the percentage of expected seedling loss and the interest rate
used in the replacement cost calculations if approximately one-half of at-risk seedlings were lost
due to cattle introduction, the NPV/acre declined from approximately $11/acre and turned
negative where -$21/acre was the result from losing all at-risk seedling replacement value.

88
Table 3.19. Net present value per acre (NPV/acre) of management decisions regarding the
introduction of cattle and potential trade-offs between the value of the tree and livestock
components for all silvopasture sites on Redstone Arsenal in Alabama.
December 2012: Management Options and Damage
Scenarios for Tree, Cattle , and Hay Production
Discount/Interest
Rate % NPV ($/acre)
Option 1. Postpone cattle assuming that all “at-risk”
seedling replacement value/acre would be lost (** Hay
would not be produced from silvopasture alleys in the
absence of cattle introduction unless indicated**)
3% $14
6% $17
9% $21
Option 2. Introduce Cattle (scenario A) : assuming no
loss of “at-risk” seedlings
3% $19
6% $19
9% $18
* scenario (2-B): assuming one-quarter of “at-
risk” replacement value/acre was lost when cattle
are introduced
3% $11
6% $10
9% $8
* scenario (2-C): assuming one-half of “at-risk”
replacement value/acre was lost when cattle are
introduced
3% $3
6% $1
9% $0
* scenario (2-D): assuming three-quarters of “at-
risk” seedlings and associated seedling value was
lost when cattle are introduced
3% - $6
6% - $8
9% - $11
* scenario (2-E):introduce cattle assuming all
“at-risk” seedlings and associated seedling value
was lost when cattle are introduced
3% - $14
6% - $17
9% - $21
Option 3. Postpone cattle and produce hay: assuming
all “at-risk” seedlings and associated replacement
value/acre would be lost when cattle are introduced
3% $72
6% $74
9% $76

89
3.4. DISCUSSION
The purpose of this research was to examine three distinct but related aspects of wildlife
browse damage to southern yellow pine establishment and growth in silvopasture systems that
were established on Redstone Arsenal (RSA) in December of 2009. The following year, in
December of 2010, RSA foresters reported wildlife browse damage to some of the 1-year old
loblolly pine seedlings. According to RSA, the situation caused uncertainty among managers
regarding the possibility seedling mortality and reduction in value of the tree component.
Furthermore, the damaged seedlings generated questions that pertained to stunted seedling
growth and the possibility further tree damages if cattle were introduced too soon.
The potential impact of wildlife browse damage to silvopasture functionality and value
were important to RSA because their stated objectives were to systematically enhance the
ecological and economic integrity of lands owned and operated by the United States Army by
integrating the production of trees, forage, and cattle into a sustainable system on the same land-
unit. The main objectives of this study were to assess the 1-year old loblolly pine seedlings in
four silvopastures for wildlife browse damage, characterize browse damage variables, measure
seedling heights and mortality, and analyze these data to uncover previously unstudied
relationships.
This study hypothesized that the severity (lateral stem vs. terminal bud), repetition (single
damage event vs. multiple), and timing (winter vs. spring) of wildlife browse damage would
produce differential seedling survival and height by the end of the second growing-season.
Furthermore, based on the established literature relative to the management of timber and cattle
in a silvopasture system, seedling mortality caused by wildlife browse damage could potentially
be high enough such that RSA foresters would need to consider postponing cattle to completely

90
replant the loblolly pine seedlings, or the growth rate of seedlings reduced to the point where a
significant proportion of seedlings/value per acre ($/acre) could be at risk of loss due to cattle
damage and may exceed value gained by revenue from cattle introduction.
3.4.1. Biological interactions
The results of this study suggest, specifically, that there is a statistically significant
inverse relationship between average stand height after the 2nd
growing-season and variables
expressing the severity of wildlife browse damage to seedlings in the 1st year (variables
expressed as wildlife browse damage ≥ level 3 = terminal bud damage). Moreover, the projected
results for 3rd
-year average seedling heights suggest, specifically, that severe wildlife browse
damage (≥ level 3 = terminal bud damage or greater) to seedlings in the 1st year could increase
the potential for cattle related tree damages if cattle are introduced to the silvopastures on
Redstone Arsenal in Madison County, Alabama. The results of this study mean that the
biological impact of wildlife damage to individual silvopasture components, the functionality
and establishment of a complete system, and the economic trade-off among component values or
between values associated with alternative management options depend on the characteristics
and extent wildlife browse damage during the first year, seedling mortality and growth response
over the first, second, and third growing seasons, and the objectives of landowners and values
they assign to each component and economic trade-offs resulting from choice among multiple
management scenarios.
Second, this study did not observe significant browse damage to occur during spring,
summer, or autumn of 2011; suggesting that the damage was present before this study began and
that the mere presence of silvopasture may not influence the timing of seedling browse damage.

91
It should be noted that the literature clearly states that pine are not preferred food items however
this interaction was not well understood for landscapes under silvopasture management practices.
Third, the importance of the timing of damage may be important because browse damage
was observed on more than 80% of all seedlings in this study. If the timing of damage is
concentrated over the winter months, seedling protection efforts may be more effective and cost
efficient due to accurate knowledge of when the protection is needed. Please note however that
this study was limited to observations in the 2nd
growing season only, therefore the true timing of
the observed browse damage is still unknown.
Fourth, this study assumed browse damage to be evenly distributed across all seedlings in
all study sites. While seedlings could be assigned spatial coordinates, their representation and
analysis in fields of such limited size was not practical and when combined with other
confounding variables such as edge-perimeter ratios, wildlife activity at Redstone Arsenal and
the potential influences of man-made infrastructure on wildlife foraging behavior was beyond the
scope this study. Fifth, the true nature of “MISSING” seedlings was unknown. The knowledge
of whether or not those seedlings were planted or whether they had been planted and died within
the 1st year would have provided more data for analysis. For example, the true nature of the
“missing” seedlings could have provided data that affected the overall mortality rate and stand
seedling value/acre. As a result this unknown however all of the “Missing” seedling
designations their value was not represented in economic analyses.
Sixth, a wide range of variables associated with individual site conditions such as damage
from other organisms and human activities, such as mowing (or predator drones), may or may
not have had a unique impact on the observations and data collection. Other such data were
noted by this study, however time and resource limitations did not allow for the systematic and

92
sufficient collection of such data to be formally incorporated into analysis procedures. Future
research might incorporate and analyze detailed variables which may impact and interact with
seedling growth in addition to potential wildlife browse damage including, damage from insects
and other pests, competition from vegetation within seedling rows, human use, road proximity,
proximity of man-made structures, hunting pressure, seedling genotype, and planting method.
Finally, the impact of wildlife browse damage on seedling growth was projected to
influence the timing and initiation of cattle-grazing contracts after the 3rd
growing season. It is
important to note however that the probability of cattle damage as it relates to seedling height is
not well understood and that the literature provides contrasted recommendations for the
minimum height of seedlings (Pearson 1984; Hamilton 2008). For example, multiple species of
southern yellow pine (loblolly, shortleaf, and longleaf) are considered to be suitable for use in
silvopasture, of which each may have a differing growth rate that can vary widely, based on
many variables.
The Hamilton (2008) recommendation of 5 to 6 feet being required for livestock
introduction in a southern pine silvopasture does not specify which animal species (cattle; sheep;
goats) can be introduced at 5 feet and which species may be introduced at 6 feet. In general the
recommendation does not seem to account for differing body mass, height and behaviors
between cattle, sheep and goats that in turn may require differing minimum tree heights based on
the species of pine being utilized. The southeastern U.S. describes a geographically, climatically
and biotically diverse land area in which deer populations have been increasing at a relatively
rapid rate over the last 30 years and the potential for damage in silvopastures and agroforestry
systems as a whole is currently not well understood.

93
3.4.2. Economics of management options
The economic results for Redstone Arsenal suggest that postponing cattle for an
additional year and producing hay from the alleyways in all silvopasture sites would yield a
higher NPV/acre than would other management options. If hay production is not an option for
RSA managers in 2013, then postponement of cattle alone was the most efficient choice because
the loss of even one-quarter of “at-risk” seedlings reduced the NPV below that of postponing
cattle introduction. Any reader should also be aware that the $20/acre generated by the cattle
grazing-leases on Redstone Arsenal may or may not vary widely for any individual or
organization. It is also important to note that any biological or economic management decision
may follow similar methods as outlined in this study but must be based on individual and site
specific details and relationships. The economic projections shown here are representative of
this particular scenario at this point in time.
However, a silvopasture’s 3-year old loblolly pine component was assigned a relative
value based on the replacement cost approach that involved compounding the establishment cost
at conservatively selected interest rates. This was done because the investment principal/cost to
establish loblolly pine as the tree component of a southern silvopasture is a recoverable value
through timber sales, but in the interim is a capital asset employed to reduce both fixed and
variable costs of cattle production. The methods outlined by this study may be appropriate for
evaluating similar silvopastures, with similar components and site conditions in Alabama.
This is important for many reasons, none of which is because discounting future timber
revenue is somehow wrong, but because of the straightforward applicability of the replacement
cost approach for Alabama’s farmers and landowners. The variability among these potential
silvopasture adopters suggests that the interactions and trade-offs between relative timber and

94
livestock values may be more readily assessed by a larger range of Alabama’s residents whether
he or she needs to value some form of damage to pre-merchantable timber, is considering the
expansion of current operations, transitioning from traditional agriculture and forestry to
silvopasture, or taking out a loan in order to establish a first generation farm.
Further research related to tax accounting methods and the relative impacts on financial
statements may be useful to those same groups of stakeholders who seek incentives, must
evaluate the farms net income, seek credit and equity related investments in their farm business
or silvopasture production cooperative. Research suggests that wildlife browse damage can
negatively influence silvopasture components, influences on the timing of cash-flows, and
thereby its value. Things which influence or can influence cash-flows are generally important to
a wide range of people and businesses (Godsey 2007; Hamilton 2008; Godsey et al. 2009).
3.5. MANAGEMENT IMPLICATIONS
Based on the results of this study, management and personnel at Redstone Arsenal should
be advised of the potential impact of wildlife browse damage on the timing of livestock
introduction. The results of this study suggest that ground-truthing of study sites by Redstone
personnel may be warranted near the end of the 2012 growing season in order to evaluate the
accuracy of growth projections presented in this study. Second, similar to Godsey and Dwyer
(2008) the difference between the NPV of a silvopasture without damage and the NPV of a
silvopasture with damage respectively could be considered in future studies to represent a
landowner’s Willingness-to-Pay (WTP) for seedling protection in year 0 at the time of
establishment (Godsey and Dwyer 2008; Ittleson 2009; Zhang and Pearse 2011). By using the
methods outlined in this study, after stakeholders have valued the potential damage loss, they can

95
use that value as a budget tool or guide while comparatively shopping for various protection
mechanisms, devices, or services.
Additionally, the incorporation of hunting leases, special tax incentives and payments
from cost-share programs such as the Conservation Reserve Program (CRP) and the Wildlife
Incentive Program (WHIP) make the practice of silvopasture a financially attractive land
management option (Husak and Grado 2001; Husak and Grado 2002; Rollins et al. 2004; Godsey
2007; Lemus 2009). However, the work done by Grado et al. (2001), Husak and Grado (2002)
and Godsey et al. (2009) suggest that tree/timber component of southern yellow pine
silvopastures can produce a combination of financial benefits not just from timber revenue but
from related sources that include 1) increased cattle performance due to tree shade which
translated into live weight gains and therefore higher average revenue per cattle unit, 2) reduced
fixed and variable cash and non-cash costs for supplemental feed, water, and other animal
maintenance, and 3) improved cash-flows from hunting leases because as the tree component
matures so should vertical and horizontal biodiversity and field-edge/perimeter ratios which
translates into enhanced resource quality, diversity, availability, and juxtaposition of wildlife
habitat components. This has the potential to translate into benefits on other southern pine
silvopastures therefore the ability of wildlife and cattle to severely damage young pine seedlings
may warrant further investigation in relation to livestock introduction and the average heights at
which some of the more common southern yellow pine species can withstand introduction
without severe damage and how those variables change based on the species of livestock being
introduced.
Furthermore, if wildlife browse damage to seedlings in a recently established silvopasture
system can be expected to occur primarily during the nutritionally stressed winter months then

96
the incorporation of hunting leases may provide financial benefits in addition to the revenue of
the hunting lease which includes the preservation the existing tree component value and future
appreciation due to biological growth, and may help to minimize costs associated with a need for
timber protection. The aforementioned variables may be important for a diversity of
stakeholders but for small-scale farmers and landowners, short-term cash-flows are generally a
very important consideration. However, the literature provides few examples for incorporating
wildlife damage into accepted valuation methods.
Benjamin Graham summarized the management implications well in stating: “It has been
an old and sound principle that those who cannot afford to take risks should be content with a
relatively low return on their invested funds. From this there has developed the general notion
that the rate of return which the investor should aim for is more or less proportionate to the
degree of risk he is ready to run. Our view is different. The rate of return sought should be
dependent, rather, on the amount of intelligent effort that the investor is willing and able to bring
to bear on his task. The minimum return goes to our passive investor, who wants both safety of
principal and freedom from concern. An investment operation is one which, upon thorough
analysis, offers safety of principal and an acceptable return. Operations not meeting this
requirement are speculative (Graham and Dodd 1934; Graham 1949).”
Management implications for the enterprising investor and manager of silvopasture
operations: research suggests that a silvopasture system can offer both safety of an investments
principal and an acceptable rate of return. However, silvopasture is not a plant it and leave it
forestry operation. Management intensity and component ratios vary based on a variety of
factors including landowner objectives, region, climate, and component species. When those
factors are combined with others including the financial condition and tax classification of the

97
landowner or farm business, local market conditions, and changing consumer preference,
thorough budget analysis and planning for the silvopasture are important and may impact the
return on investment. “The underlying principles of sound investment should not alter from
decade to decade, but the application of these principles must be adapted to significant changes
in the financial mechanisms, climate, and broader environment (Graham 1949).”
Silvopastures alter habitat components, can attract wildlife, and create the potential for
human-wildlife conflict (Grado et al. 2001; Conover 2002; Sharrow and Fletcher 2003).
Because the potential for negative interactions and associated costs are relatively unknown and
have limited data available, it is important for landowners and land managers to do the
following: 1) Record observations of increasing use by wildlife and potential damages caused to
trees or to livestock. 2) Keep detailed records of planting methods, costs, and tree height at the
time of livestock introduction. 3) Record annual rainfall and seedling height measurements,
insects, extreme climatic events, surrounding habitat conditions, livestock damages, timber
growth, tree canopy cover, average animal/breed weights, average market price received,
average costs of fertilizer, supplemental feed and any other performance indicator or metric
which you believe would help you understand were another person communicating to you.
These data would be of value, both at present and in the future, to a diverse range of landowners,
farmers, and investors when evaluating the costs and benefits of integrating trees, forage, and
livestock on the same land-unit.

98
LITERATURE CITED
Alabama Cooperative Extension Service (ACES). 2011. Alabama farm business management
and financial analysis program. Available online at
http://www.ag.auburn.edu/agec/farm_analysis.php; last accessed Apr. 21, 2011.
Alavalapati, J.R.R. and E.D. Mercer. 2005. Valuing agroforestry systems: Methods and
applications. Springer Science + Business Media, Inc. New York, NY.
Bailey, R.G. 1980. Descriptions of the ecoregions of the United States. United States Department
of Agriculture Miscellaneous Publications 1391. 77 p.
Bambo, S.K., J. Nowak, A.R. Blount, A.J. Long, and A. Osiecka. 2009. Soil nitrate leaching in
silvopastures compared with open pasture and pine plantation. J. Environ. Qual. 38:1870-
1877.
Barras. A. E., J.C. Jones, D.L. Nolte, C.G. Culpepper, L.H. Shearer, and J. H. Fogarty. 2005.
Wildlife damage to seedlings in reforested hardwood sites in Mississippi. P 135-140 in
Proc. of the 11th Wildlife Damage Management Conf. Nolte, D.L, and Fagerstone, K.A.
(eds.) Traverse City, Michigan.
Bendfeldt, E. S., C.M. Feldhake and J. A. Burger. 2001. Establishing trees in an Appalachian
silvopasture: response to shelters, grass control, mulch, and fertilization. Agroforest. Syst.
53:291-295.
Brauer, D., H. Pearson, and D. Burner. 2009. Management factors affecting the establishment of
pine based silvopastures in southern grasslands in the United States. Open For. Sci. J. 2:
1-8.
Brockway, D.G. and C.E. Lewis. 2003. Influence of deer, cattle grazing and timber harvest on
plant species diversity in a longleaf pine bluestem ecosystem. Forest Ecol. Manag. 175:
49-69.
Brooks, C. 2008. Introductory econometrics for finance. Cambridge University Press. New York,
NY.
Burkhart, H.E., R.L. Amateis, J.A. Westfall, and R.F. Daniels. 2003. PTAEDA 3.1: Loblolly
Pine Growth and Yield Simulator. Department of Forestry. Virginia Tech University,
Blacksburg, VA.
Campbell, T.E. 1976. Bird and mammal problems in southeastern pine forests. P. 219-234 in
Proc. of the 7th Vert. Pest Conf. University of Nebraska.

99
Clason, T.R. 1995. Economic implications of silvipastures on southern pine plantations.
Agroforest. Syst. 29: 227-238.
Conover, M. 2002. Resolving human–wildlife conflicts: The science of wildlife damage
management. Lewis Publishers, Boca Raton, FL. 419 p.
Cook, C., and B. Gray. 2003. Biology and management of white-tailed deer in Alabama.
Alabama Department of Conservation and Natural Resources: Division of Wildlife and
Freshwater Fisheries. 174 p.
Curtis, P.D., and K.L. Sullivan. 2001. White-tailed deer. Cornell Cooperative Extension Wildlife
Damage Management Fact Sheet Series. 8 p.
Cutter, B.E., Hunt, K., and J.D. Haywood. 1999. Tree/wood quality in slash pine following
longterm cattle grazing. Agroforest. Syst. 44: 305-312.
Dickson, J.G. 2001. Wildlife of Southern Forests: Habitat and Management. Hancock House
Publishers, USA. 480 p.
Ekelund, R.B., R.W. Ressler, and R.D. Tollinson. 2006. Microeconomics: Private markets and
public choice. 7th
ed. Pearson education, Inc. Boston, MA. 576 p.
Fike J.H., A.L. Bugreler, J.A. Burger, and R.L. Kallenbach. 2004. Considerations for
establishing and managing silvopastures. Forages Grazinglands. doi: 10.1094/FG-2004-
1209-01-RV. 18 p.
Fleuriet, M. 2008. Investment banking explained: An insider’s guide to the industry. McGraw-
Hill Companies, Inc. U.S.A.
Frey, G.E., Mercer, E.D., Cubbage, F.W. and R.C. Abt. 2010. Economic potential of agroforestry
and forestry in the lower Mississippi Alluvial Valley with incentive programs and carbon
payments. South. J. Appl. For. 34:4.
Garret, H.E. 2009. North American agroforestry: An integrated science and practice. American
Society of Agronomy 2nd Edition. 400 p.
Garrett, H.E., M.S. Kerley, K.P. Ladyman, W.D. Walter, L.D. Godsey, J.W. Van Sambeek, and
D.K. Brauer. 2004. Hardwood silvopasture management in North America. Agroforest.
Syst. 61:21-33.
Godsey, L.D. 2007. Agroforestry in action: Tax considerations for the establishment of
agroforestry practices. University of Missouri Center for Agroforestry: AF1004. 8 p.
Godsey, L.D., and J.P. Dwyer. 2008. Estimating willingness to pay for protection of Eastern
Black Walnut from deer damage. P. 249-256 in Proc. of the 16th Central Hardwoods
Forest Conference. University of Missouri.

100
Godsey, L.D., Mercer, E.D., Grala, R.K, Grado, S.C. and J.R.R. Alavalapati. 2009. Agroforestry
Economics and Policy. P. 315-337. North American Agroforestry: An Integrated Science
and Practice 2nd edition, H.E. Garrett (ed.). American Society of Agronomy, Madison,
WI.
Grado, S.C., C.H. Hovermale, and D.J. Louis. 2001. A financial analysis of a silvopasture system
in southern Mississippi. Agroforest. Syst. 53:313–322.
Graham, B. and D.L. Dodd. 1934. Security analysis. McGraw-Hill Companies, Inc. New York,
NY.
Graham, B. and S.B. Spencer. 1937. The interpretation of financial statements. Harper & Row
Publishers, Inc. New York, NY.
Graham, B. 1949. The intelligent investor. Harper & Brothers Publishers. New York, NY.
Graham, B. 1952. Toward a science of security analysis. Financial Analysts Journal. August: 97-
99.
Grewal, D. and M. Levy. 2008. Marketing. McGraw-Hill Irwin, New York, New York. 720 p.
Gurevitch, J., S.M. Scheiner, and G.A. Fox. 2006. The Ecology of Plants. 2nd
ed. Sinauer
Associates, Inc., MA. 574 p.
Hamilton, J. 2008. Silvopasture: Establishment & management principles for pine forests in the
Southeastern United States. USDA Forest Service/ UNL Faculty Publications.
Houdet, J., Pavageau, C., Tormmetter, M. and J. Weber. 2009. Accounting for changes in
biodiversity and ecosystem services from a business perspective: Preliminary guidelines
towards a biodiversity accountability framework. Available online at http://hal.archives-
ouvertes.fr/docs/00/43/44/50/PDF/2009-44.pdf. Last accessed Apr. 30, 2012.
Husak, A.L., and S.C. Grado. 2002. Monetary benefits in a southern silvopastoral system.
Southern J. Appl. Forest. 26(3):159-164.
International Business Machines (IBM). 2012. IBM SPSS Statistics: Solve research problems
easily and efficiently. Available online at
http://public.dhe.ibm.com/common/ssi/ecm/en/ytd03123usen/YTD03123USEN.PDF; last
accessed July 4, 2012.
Ittelson, T.R. 2009. Financial statements. Career Press, Pompton Plains, NJ. 285 p.
Kinicki, A. and B.K. Williams. 2006. Management: a practical introduction. McGraw Hill
Publishers. 672 p.

101
Kush, J.S., Meldahl, R.S., Mcmahon, C.K. and W.D. Boyer. 2004. Longleaf pine: A sustainable
approach for increasing terrestrial carbon in the Southern United States. Environmental
Management. (33):pp 139-147.
Lemus, R. 2009. Silvopasture: How a Grazing System Can Add Value To Trees? Available
online at http://msucares.com/crops/forages/index.html; last accessed Dec. 14, 2010.
Leopold, A. 1933. Game management. University of Wisconsin Press. Madison, WI.
Lewis, C.E., G.W. Burton, W.G. Monson, and W.C. McCormick. 1984. Integration of pines and
pastures for hay and grazing. Agroforest. Syst. 2:31-41.
Long, A.J. 2003. Economic Options to Increase the Value of Your Ranchlands. P. 98-105 in
Proc. 52nd
Annual Beef Cattle Short Course, Univ. of Florida, Gainesville, FL.
McConnel C.R. and S.L. Brue. 2008. Macroeconomics: Principles, Problems and Policies. 17th
ed. McGraw-Hill Irwin Publishers. 732 p.
Miller K.V. and R.L. Marchinton. 1995. Quality Whitetails: The Why and How of Quality Deer
Management. Stackpole Books, Mechanicsburg, PA. 320 p.
Nicholson, W. 2002. Microeconomic theory: Basic principles and extensions 8th
ed. South-
Western College, New York, New York. 768 p.
Nowak, J., A. Long, and A. Blount. 2009. Establishment of Silvopasture in Existing Pastures.
University of Florida IFAS Extension FOR#107. 6 p.
Nowak, D. J. and J.T. Walton. 2005. Projected Urban Growth (2000 – 2050) and Its Estimated
Impact on the US Forest Resource. J. Forest. 103(8):383-389.
Opdyke, J. 2010. Wealthy investors discover timberland. Wall Street Journal - May 1, 2010.
Oswald, B.P., K.W. Farrish, and M.J. Beierle. 2008. Survival of longleaf and loblolly pines
planted at two spacings in an east texas bahiagrass silvopasture. Southern J. Appl. Forest.
32:1.
Pearson, H.A. 1984. Agroforestry. P. 72-79 in Proc. of Southeast Region Conf. on Grazing
Lands and People. Atlanta, GA.
Plunkett, W. R., R. F. Attner and G. S. Allen. 2007. Management: Meeting and exceeding
customer expectations. South-Western College Publishers, USA. 744 p.
Prinn, R.G. and J.M. Reilly, 2012. Energy and climate outlook. Massachusetts Institute of
Technology Joint Program on the Science and Policy of Global Change. Available online
at http://globalchange.mit.edu/files/document/MITJPSPGC-Outlook2012.pdf; last
accessed Feb 10, 2010.
102
Reilly, J. and S. Paltsev. 2007. Biomass energy and competition for land. Massachusetts Institute
of Technology Joint Program on the Science and Policy of Global Change. Report No.
145. 23 p.
Robinson, J. 2005. Silvopasture and eastern wild turkey. Agroforest. Notes 28:1-4.
Rollins, K., L. Heigh, and V. Kanetkar. 2004. Net costs of wildlife damage on private lands. J.
Agr. and Resour. Econ. 29(3):517-536.
Schuhmann, P.W., and K.A. Schwabe 2000. Fundamentals of Economic Principles and Wildlife
Management. P. 1-16 in Proc. of the 3rd
NWRC special symposium, Human Wildlife
Conflicts: Economic Considerations, Clark, L. (ed.). Fort Collins, CO.
Sharrow, S.H. 2001. Effects of shelter tubes on hardwood tree establishment in western Oregon
silvopastures. Agroforest. Syst. 53:283-290.
Sharrow, S.H., D. Brauer and T.R. Clason. 2009. Silvopastoral practices. P. 105-132 in North
American Agroforestry: An Integrated Science and Practice 2nd edition, H.E. Garrett
(ed.). American Society of Agronomy, Madison, WI.
Sharrow, S.H. and R. Fletcher. 2003. Converting a pasture to a silvopasture in the Pacific
Northwest. USDA Forest Service – National Agroforestry Center, Agroforestry Notes.
Available online at http://digitalcommons.unl.edu/agroforestnotes/26; last accessed on
Apr. 11, 2010.
Shelton, M.G., and M.D. Cain. 2002. Recovery of 1-year-old loblolly pine seedlings from
simulated browse damage. Can. J. Forest Resour. 32:373-377.
Shwiff, S.A. 2004. Economics in Wildlife damage management studies: Common problems and
some solutions. Proc. 21st Vertebr. Pest Conf. Published at Univ. of Calif., Davis Pp. 346-
349.
Sorrow, A. 2011. U.S. agriculture deputy secretary announces national agroforestry plan at
UGA. Available online at
http://www.uga.edu/news/artman/publish/printer_110608_agroforestry; last accessed on
Apr. 1, 2011.
Stainback, A.G. and J.R.R. Alavalapati. 2004. Restoring longleaf pine through silvopasture
practices: an economic analysis. Forest Policy Econ. 6:371-378.
Susaeta, A., Lal, P., Alavalapati, J., Mercer, E. and D. Carter. 2012. Economics of intercropping
loblolly pine and switchgrass for bioenergy markets in the southeastern United States.
Agroforest. Syst. 84(1).

103
Udawatta, R.P., and L.D. Godsey. 2010. Agroforestry comes of age: putting science into
practice. Agroforest. Syst. 79:1-4.
USDA. 2011. USDA Agroforestry Strategic Framework, Fiscal Year 2011 – 2016. Available
online at http://www.usda.gov/documents/AFStratFrame_FINAL-lr_6-3-11.pdf. last
accessed April 19, 2012.
USDA Animal and Plant Health Inspection Service. 2010. Managing wildlife damage: The
mission of APHIS' wildlife services program. Available online at
www.aphis.usda.gov/ws/managing.html; last accessed July 18, 2010.
USDA-Economic Research Service. 2010 and 2012. State Fact Sheets: Alabama. Available
online at www.ers.usda.gov/statefacts/al.htm; last accessed October 1, 2010.
USDA-National Agroforestry Center. 2008. Agroforestry health. Available online at
www.unl.edu/nac/insideagroforestry.htm; last accessed October 1, 2010.
USDA-National Agroforestry Center. 2010. Now is the time for agroforestry! Available online
at www.unl.edu/nac/insideagroforestry.htm; last accessed October 1, 2010.
USDA-Natural Resources Conservation Service. 1993. Considerations for forest management on
Alabama soils. Washington, DC. 163p.
U.S. Trust – Bank of America Private Wealth Management. 2010. Timberland: Accessing a
unique investment opportunity. Bank of America Internet Research, National Council of
Real Estate Investment Fiduciaries (NCREIF).
Varian, H.R. 2006. Intermediate microeconomics: A modern approach. W. W. Norton &
Company, New York, New York. 739 p.
Waller, D.M. and W.S. Alverson. 1997. The white-tailed deer: a keystone herbivore. Wildlife
Soc. B. 25(2):217-226.
Ward, A.I., P.C.L. White, A. Smith, and C.H. Critchley. 2004. Modeling the cost of roe deer
browsing damage to forestry. For. Ecol. and Mngt. 191:301-310.
Warren, C.S., J.M. Reeve and J. Duchac. 2008. Financial accounting. South-Western College
Publishers 11th
ed. New York, NY.
Workman, S.W. 2003. Agroforestry potential in the southeastern United States: perceptions of
landowners and extension professionals. Agroforest. Syst. 59:73-83.
World Agroforestry Centre. 2010. Agroforestry and our role. Available online at
www.worldagroforestrycentre.org/about_us/our_role_in_agroforestry; last accessed
October 10, 2010.

104
Yates, H.O., N.A., Overgaard, and T.W. Koerber. 1997. Nantucket pin tip moth. Forest Insect
and Disease Leaflet 70. U.S. Department of Agriculture Forest Service.
http://www.na.fs.fed.us/spfo/pubs/fidls/nantucket/nantucket.htm. Last accessed Apr. 20,
2012.
Zhang, D. and P.H. Pearse. 2011. Forest economics. UBC Press. Vancouver, British Columbia.
390 p.

105
Appendix 1: Location of Redstone Arsenal in Madison County, Alabama in relation to Auburn
University which is located in Lee County, Alabama.
Redstone Arsenal
Auburn University

106
Appendix 2. List of woody & non-woody plant species that were identified in habitat
surrounding all study sites on Redstone Arsenal in Madison County, Alabama.
Scientific name Common Name
Acer rubrum Red maple
Andropogon spp. Broomsedge
Carya ovalis Red hickory
Carya ovata Shagbark hickory
Cercis canadensis Eastern redbud
Cornus florida Flowering dogwood
Diospyros virginiana Common persimmon
Fagus grandifolia American beech
Gleditsia triacanthos Honey locust
Liquidambar styraciflua Sweetgum
Liriodendron tulipifera Tulip poplar
Morus rubra Red mullberry
Pinus echinata Short leaf pine
Pinus taeda Loblolly pine
Prunus serotina Black cherry
Quercus falcata Southern red oak
Quercus michauxii Swamp chestnut oak
Quercus nigra Water oak
Quercus pagoda Cherrybark oak
Quercus rubra Northern red oak
Sassafras albidum Sassafras
Setaria spp. Foxtail
Smilax spp. Green-briar
Trifolium spp. Clover
Vicia spp. Vetch

107
Appendix 3: Location of study sites (AGL1; AGL2; AGL3; AGL4) on Redstone Arsenal in
Madison County, Alabama in 2011.
Study sites AGL2 & AGL3
Study site AGL4
Study site AGL1