silvia valtorta tesi dottorato finalissima - unimi.it · tissue hypoxia is considered as a negative...
TRANSCRIPT
UNIVERSITÀ DEGLI STUDI DI MILANO FACOLTÀ DI MEDICINA E CHIRURGIA
DIPARTIMENTO DI SCIENZE E TECNOLOGIE BIOMEDICHE
CORSO DI DOTTORATO DI RICERCA IN MEDICINA MOLECOLARE
CURRICULUM DI GENOMICA, PROTEOMICA E TECNOLOGIE CORRELATE
CICLO XXIII
TESI DI DOTTORATO DI RICERCA
PRECLINICAL PET IMAGING FOR TUMOUR CHARACTERIZATION : FOCUS ON HYPOXIA AND INFLAMMATION
Settore Disciplinare: Bio-12
DOTTORANDO: Silvia VALTORTA
TUTORE: Ch.ma Prof.ssa Cecilia GELFI CO-TUTORE : Dott.ssa Rosa Maria MORESCO COORDINATORE DEL DOTTORATO: Ch.ma Prof.ssa Maria Luisa VILLA Firma………
ANNO ACCADEMICO 2009/2010

Ai miei genitori, ai miei cari e a tutte le persone che
mi sono state vicine in questi tre anni.

I
ABSTRACT
Imaging molecular techniques including PET, CT, MRI allow to detect and to monitor normal and pathological conditions non-invasively in clinic. The recent development of dedicated small animal instruments together to the availability of appropriate animal models of disease has allowed the use of these methods in preclinical research with the possibility to transfer directly the obtained results in clinic. In this thesis’s work we characterized two preclinical oncology models through the use of an animal PET instrument focusing on two processes correlated to tumour growth such as hypoxia and inflammation. Tissue hypoxia is considered as a negative prognostic factor both for answer to pharmacological and radiant therapy and for tumour progression and invasiveness. Consequently, identification and localization of hypoxic areas within the tumour have an important interest in clinical diagnostic. To this aim, BALB/c nu/nu mice were inoculated with murine cells of mammary adenocarcinoma (EMT-6) and with human cells of prostate adenocarcinoma (PC-3) and pharingeal cancer (FaDu). Animals were monitored using two hypoxic radiopharmaceutical recently developed, [18F]FAZA and [64Cu]ATSM at two different times, using PET and autoradiography. In parallel, an in vitro evaluation of specific hypoxic markers such as carbonic anhydrase IX and cupper transporters (Ctr-1 and ATP7B) was performed. In FaDu model we confirmed the same [64Cu]ATSM distribution at the two analyzed times, that is similar to that of [18F]FAZA. On the contrary, EMT-6 and PC-3 models showed a time-dependent [64Cu]ATSM uptake, with a distribution at late time (24hrs post injection) similar to that of [18F]FAZA. The different distribution of [64Cu]ATSM can be only partially explained by the different cupper pumps localization observed in vitro. Other factors such red-ox and cellular pH may influence [64Cu]ATSM uptake. PET imaging is an interesting method to identify and monitor tumour hypoxia in a non invasive way but it needs further studies that associate metabolic changes to proteomic pattern changes. Positron Emission Tomography (PET) imaging with [18F]2-fluorine-2-deoxy-D-glucose-PET ([18F]FDG-PET) is widely used in neoplastic patients for disease assessment and evaluation of treatment efficacy. Results interpretation must take into account the contribution of inflammatory cells that infiltrate growing tumours for [18F]FDG uptake. In this work, we established a preclinical model of peritoneal carcinomatosis to verify the actual contribution of macrophages to signals obtained with [18F]FDG-PET. Groups of mice with peritoneal carcinosis were longitudinally evaluated with [18F]FDG-PET. Intraperitoneal depletion of macrophages was achieved by an approach that proved to be safe and effective, i.e. administration of clodronate encapsulated into liposomes. Sham-liposomes were used in control animal cohorts. Using [18F]FDG-PET we detected and monitored peritoneal lesions’ growth, with a good correlation between the real neoplastic lesions extension and that measured using [18F]FDG-PET. Macrophage depleted animals showed a substantial drop in tumour growth. In conclusion, [18F]FDG-PET imaging allows the non-invasive detection of peritoneal adenocarcinoma lesions and macrophages are directly and indirectly involved in [18F]FDG uptake by promoting tumour growth and spreading in the peritoneal cavity.
II
SOMMARIO
Le tecniche di imaging molecolare quali PET, CT, MRI permettono di visualizzare e monitorare condizioni normali e patologiche in modo non invasivo nell’uomo. Il recente sviluppo di strumentazione dedicata al piccolo animale e di specifici modelli di malattia ha permesso l’utilizzo di queste tecniche anche a livello preclinico, con la possibilità di trasferire i risultati ottenuti direttamente in clinica. In questo lavoro di tesi ci siamo occupati di caratterizzare due modelli preclinici di lesione tumorale tramite l’impiego della PET animale, focalizzando l’attenzione su due processi correlati alla crescita tumorale quali l’ipossia e l’infiammazione. L’ipossia tessutale rappresenta un fenomeno sfavorevole dal punto di vista prognostico sia in termini di risposta alla terapia farmacologica e radiante che in termini di progressione e invasività del tumore. Di conseguenza è di particolare interesse riuscire a localizzare e identificare le aree ipossiche all’interno del tumore. A tale scopo, topi BALB/c nu/nu sono stati inoculati con cellule murine di carcinoma mammario (EMT-6) e con cellule umane di adenocarcinoma prostatico (PC-3) e di carcinoma della faringe (FaDu). Gli animali sono stati poi monitorati utilizzando due traccianti ipossici di recente sviluppo, [18F]FAZA e [64Cu]ATSM a due tempi diversi, tramite PET e autoradiografia. In parallelo, è stata fatta una valutazione in vitro dei marker specifici dell’ipossia quali l’anidrasi carbonica IX e dei trasportatori del rame (Ctr-1 e ATP7B). Nel modello FaDu abbiamo confermato la stessa distribuzione di [64Cu]ATSM ai due tempi analizzati, che è risultata simile a quella di [18F]FAZA. Al contrario, i modelli EMT-6 e PC-3 mostrano un uptake di [64Cu]ATSM dipendente dal tempo, con una distribuzione tardiva (24h dall’iniezione) più simile a quella di [18F]FAZA. La differente distribuzione di [64Cu]ATSM può essere spiegata solo parzialmente dalla diversa localizzazione delle pompe del Cu osservata in vitro. Altri fattori come il potenziale red-ox e il pH cellulare potrebbero influenzare l’uptake di [64Cu]ATSM. L’imaging PET risulta essere un metodo interessante per poter identificare e monitorare l’ipossia tumorale in modo non invasivo ma necessita di ulteriori studi che associno i cambiamenti metabolici ai cambiamenti dei pattern proteomici. L’imaging PET con [18F]2-fluoro-2-deossi-D-glucosio ([18F]FDG) è largamente utilizzato in pazienti con neoplasia per la valutazione della malattia e per l’efficacia del trattamento. L’interpretazione dei risultati deve tenere conto del contributo delle cellule infiammatorie che infiltrano il tumore per l’uptake di [18F]FDG. In questo lavoro, abbiamo sviluppato un modello preclinico di carcinosi peritoneale per verificare il contributo dei macrofagi nel segnale ottenuto con PET-[18F]FDG. Gruppi di topi con carcinosi peritoneale sono stati monitorati longitudinalmente tramite PET-[18F]FDG. I macrofagi sono stati depletati nel peritoneo utilizzando un approccio sicuro ed efficace, ovvero la somministrazione di clodronato incapsulato in liposomi. Liposomi vuoti sono stati somministrati nel gruppo controllo. Tramite PET-[18F]FDG siamo riusciti a visualizzare e monitorare la crescita delle lesioni con una buona correlazione tra l’estensione reale delle lesioni e quella misurata tramite PET-[18F]FDG. Gli animali depletati hanno mostrato una significativa riduzione della crescita tumorale. In conclusione l’imaging PET-[18F]FDG permette il monitoraggio non invasivo di lesioni tumorali intraperitoneali e i macrofagi contribuiscono all’uptake di [18F]FDG in modo sia diretto che indiretto promuovendo la crescita tumorale e la diffusione nella cavità peritoneale.
III
INDEX
ABSTRACT………………………………………………………………..... I
SOMMARIO…………………………………………………………………. II
LIST OF SYMBOLS……………………………………………………..... VI
1. INTRODUCTION…………………………………………………………. 1 1.1. Molecular imaging………………………………….…………….... 2 1.2. Positron Emission Tomography, PET………………………….. 3
1.2.1. Physical principles……………………………………...…….. 3 1.2.1.1. Acquisition of events in coincidence……………… …………. 3 1.2.1.2. Spatial resolution………………………………………………… 4 1.2.1.3. Detector system…………………………………………………... 5 1.2.1.4. Images acquisition and reconstruction…………… …………. 5
1.2.2. PET and preclinical imaging………………………………… 7 1.2.3. Tomographs for small animals……………………………... 8
1.2.3.1 YAP-(S)PET II…………………………………………………….... 9
1.2.4. PET application………………………………………………. 10 1.3. Tumour and hypoxia……………………………………..……… 12
1.3.1. Pathogenesis of tumour hypoxia..…………………………12 1.3.2. HIF………………………………………………………………. 13
1.3.2.1. HIF structures……………………………………………………. 13 1.3.2.2. Role of HIF in hypoxia………………………………………….. 1 4
1.3.3. Glycolysis and respiration………………………………..... 17 1.3.4. Hypoxia and therapy resistance………………………….. 20 1.3.5. In vivo measurement of tissue hypoxia………………… .. 21
1.3.5.1. Biopsy specimens…………………………………….………… 21 1.3.5.2. Polarographic electrodes……………………………………… 21 1.3.5.3. Imaging techniques…………………………………………….. 22
1.3.5.3.1. BOLD-MRI……………………………………………………. 22
1.3.5.3.2. PET………………………………………………………….… 22
1.4. Cancer and inflammation……………………………………….. 27 1.4.1. The role of macrophages…………………………………… 27
1.4.1.1 Depletion of macrophages: clodronate………………… …… 31
1.4.2. [18F]FDG-PET and inflammation…………………………… 35 1.4.3. Structure and function of peritoneum…………………… . 36 1.4.4. Peritoneal liquid……………………………………………… 38 1.4.5. Peritoneal carcinosis………………………………………... 38
IV
1.4.5.1. Pathological changes in peritoneal liquid… ……………….. 39
1.4.6. Diagnosis and monitoring of peritoneal cance r………... 39 1.4.7. Preclinical model of peritoneal carcinosis…… ………… 42
2. AIM………………………………………………………….……………. 43
3. HYPOXIA MODEL……………………………………………………… 45 3.1. Materials and methods…………………………………………... 46
3.1.1. Cellular lines………………………………………………….. 46 3.1.2. Animal models………………………………………………... 46 3.1.3. Study design………………………………………………….. 46 3.1.4. PET studies…………………………………………………… 46 3.1.5. PET images analysis………………………………………… 47 3.1.6. Dual-tracer ex-vivo autoradiography……………………. . 47 3.1.7. Immunohistochemistry analysis………………………….. 48
3.2. Results………………………………………………………………48 3.2.1. Comparison of intratumoural uptake of [ 18F]FDG and [18F]FAZA in a longitudinal in vivo PET study…………………. 48 3.2.2. Comparison of intratumoural uptake of [ 18F]FAZA and [64Cu]ATSM at early and late time in vivo by PET and e x-vivo by dual tracers autoradiography……………………………………... 53 3.2.3. Immunohistochemistry analysis………………………….. 56
3.3. Discussion………………………………………………………… 57
4. INFLAMMATION MODEL…………………………………………….. 59 4.1. Materials and methods………………………………………….. 60
4.1.1. Mice…………………………………………………………….. 60 4.1.2. Cells and tumour analysis………………………………….. 60 4.1.3. Study design………………………………………………….. 60 4.1.4. PET studies…………………………………………………… 61 4.1.5. Image analysis……………………………………………….. 61 4.1.6. Histological analysis………………………………………... 62 4.1.7. Viability and apoptosis in vitro assays…………… …….. 62 4.1.8. Statistical analysis…………………………………………... 63
4.2. Results……………………………………………………………... 63 4.2.1. Experimental model of peritoneal carcinomato sis and [18F]FDG distribution……………………………………………….. 63 4.2.2. Relative contribution of neoplastic cells an d tumour associated phagocytes to [ 18F]FDG uptake…………………….. 64 4.2.3. Quantification and correlations analysis………… ……... 67

V
4.3. Discussion…………………………………………………………. 70
5. CONCLUSION………………………………………………………….. 72
REFERENCES…………………………………………………………….. 74
WORKS AND CONGRESS ATTENDENCE…………………………… 81

VI
LIST OF SYMBOLS
ANG-1 and -2: angiopoietins ARNT: arylhydrocarbon receptor nuclear translocator ATP7A: Menkes protein, copper exporter ATP7B: Wilson protein, copper exporter bFGF: basic fibroblast growth factor BOLD-MRI: blood oxygenation level dependent-magnetic resonance imaging CAIX: carbonic anhydrase IX CBP: CREB binding protein Clodrolip: clodronate incapsulated in liposomes cMyc: oncogenic factor CXCR4: C-X-C chemokine receptor type 4 COX-2: cyclooxygenase 2 CT: computed tomography Ctr1: Copper transporter [64Cu]ATSM: [64Cu]diacetyl-bis(N4-methylthiosemicarbazone) DC: dendritic cells ECM: extracellular matrix EGF: epidermal growth factor EM: expectation maximization [18F]FDG: 2-[F-18]Fluorine-2-deoxy-D-glucose [18F]FLT: [18F]Fluorine-levo-thymidine fMRI: functional magnetic resonance imaging FBP: filter back projection FIH-1: factor inhibiting HIF-1 [18F]FAZA: [18F]fluoroazomycin-arabinofuranoside [18F]FMISO: [18F]Fluoromisonidazole FLT-1 and FLK-1: VEGF receptors FOV: field of view GLUT-1 and GLUT-3: glucose transporters HGF: hepatocytes growth factor HIF-1: hypoxia inducible factor 1 HK: hexokinase HREs: hypoxia response elements HSPs: heat shock proteins [124I]IAZA: [124I]iodoazomycin arabinoside iNOS: inducible NO synthase LDH-A: lactate dehydrogenase A LOR: line of response LOX: lysyl oxidase M1 and M2: macrophage type 1 and type 2 MAPK: mitogen-activated protein kinase MCSF: macrophage colony stimulating factor MCT1 and MCT4: monocarboxylate transporter 1 and 4 MIP-1α: macrophages inflammatory protein 1α MMP-2 and MMP-9: matrix metalloproteinases MRI: magnetic resonance imaging MRS: magnetic resonance spectroscopy

VII
NKc: natural killer cells OAA: oxaloacetate ODD: oxygen-dependent degradation domain PAI-1: plasminogen activator inhibitor-1 PDGF-B: platelet-derived growth factor B PDK: pyruvate dehydrogenase kinase PET: positron emission tomography PI3K: phosphatidylinositol 3-kinase PHD1, 2 and 3: proline hydroxylases PPP: pentose phosphate pathway PTEN: negative regulator of PI3K pVHL: product of the von Hippel-Lindau tumor suppressor gene ROI: region of interest SDF-1: stromal derived factor 1 Shamlip: liposomes without clodronate SPECT: single photon emission computerized tomography SUV: standardized uptake value TAM: tumour associated macrophage TCA: tricarboxylic acid TGF-β: transforming growth factor TNF-α: tumour necrosis factor alpha: TPO: thrombopoietin uPA: urokinase-type plasminogen activator uPAR: uPA receptor US: ultrasounds VEGF: vascular endothelial growth facto VOR: volume of response

1
1. INTRODUCTION

2
1.1. Molecular imaging
Molecular and cellular imaging is a branch of biomedical sciences including tomographic techniques such as PET (positron emission tomography), SPECT (single photon emission computerized tomography), CT (computed tomography), MRI (magnetic resonance imaging) and non-tomographic techniques like US (ultrasounds) for the study and the characterization of molecular and cellular processes in living organisms in normal and pathological conditions. In general, these techniques allow with some limitations to study specific molecular target or tissues characteristics and their changes during time, by evaluating the different pathological stages. Molecular imaging techniques need: a) the use of probes with high specificity for a target of interest; b) an adequate signal amplification; c) a sensitive system able to reproduce images with high resolution. For these reasons, primarily, research is focused on the selection of suitable molecules which are able to obtain an image of the biological process under study. These probes need specific characteristics to reach the target of interest including capability to cross biological barriers like vessels’ walls, interstitial and cellular membranes and capability to stay in circulation the time necessary to interact with the target before to be excreted and degraded. Moreover, low immunogenicity and absence of pharmacological effect itself are essential properties for the ligand. Second, research is focused on planning the strategies to amplify the signal because of low target concentrations which are in pico-nano moles order and finally on design of dedicated imaging system with high spatial resolution and sensitivity. The most used techniques to obtain molecular information from biological systems are PET and MRI thanks to their higher sensitivity and spatial resolution in comparison to other techniques. Positron emission tomography permits the study of cellular metabolism and biochemical reactions within the organism in normal and pathological conditions; on the other hand, magnetic resonance imaging permits to difference tissues on the basis of their water content and also to determine structural and volumetric changes due to pathological processes. Recently, new technologies are able to obtain further information for example functional Magnetic Resonance Imaging (fMRI) permits to obtain information on tissue perfusion, vascular volume and permeability and on the molecular and metabolic changes of tumours in cerebral studies; magnetic resonance spectroscopy (MRS) is able to visualize changes the concentration of organic molecules, different from water, formed by Carbon and Phosphor and thus applied to cellular metabolism studies. In addition, the conjugation of molecules with elements able to modify magnetic fields has open the potential extension of molecular imaging also to MRI. However, MRI has a lower sensitivity in comparison to Positron Emission Tomography, in fact in PET analysis radiotracers are administered in microdose which is <1/100 of active dose. In this way, using PET it is possible detect a process without perturbing the system. The most recent instruments combine complementary technologies as PET/CT and PET/MR which permit to combine morphological, functional and biochemical information. In this way it is possible to visualize and detect molecular signal

3
exploiting the potential and advantages of each single technology and limiting defects. 1.2. Positron Emission Tomography, PET
Positron Emission Tomography (PET) is an analytic imaging technique based on the use of compounds labelled with emitting positron radioisotopes. The radioligand or radiopharmaceutical drug is used as molecular probe to visualize and measure biochemical processes in vivo in a non invasively way. When the radioisotope decays, the positron annihilates with a tissue electron and generates two photons with a 511 keV energy which are detectied by the tomograph. The two photons are simultaneously emitted in the same direction but with contrary verse. Their flight direction is measured using detectors. The most used radioisotopes in PET are Carbon-11 (11C), Nitrogen-13 (13N), Oxygen-15 (15O) which replace a stable atom within a pharmaceutical molecule without changes in biochemical form. A particular case is Fluorine-18 (18F). Fluorine-18 has chemical properties similar to those of Hydrogen (H) which can be replaced in many natural molecules as aminoacids, carbohydrates, lipids and in many drugs permitting the analysis of metabolic function as for example glucose metabolism. Other isotopes like Gallium-68 and Copper-64 are not present in natural compounds. For their chemical properties or half-life are of particular interest for the labelling of biotechnological molecules like peptide (Ga-68) or antibody (Cu-64). 1.2.1. Physical principles
1.2.1.1. Acquisition of events in coincidence In the positron emission tomography, a decay event can be registered when the two photons are simultaneously detected inside the field of view, FOV, i.e. in the spatial portion sampled by tomograph. The coincidence technique requires that the coincident photons, detected by two different detectors, at the same time fall in a small time window (coincidence window) of about 10 nanoseconds. A line of response (LOR,) obtained by the straight line which connects the detection points of the two photons, is associated at each coincidence event. The source which generated the coincidence is on a point of this straight line. When the LOR is identified, the event is added at the just acquired events for that precise response line and the obtained sum is registered in the system memory. The final value of the acquired events for a LOR is connected at the activity of radionuclide along the straight line[1]. In the practice, it is impossible sampling all infinitive LOR of detected events. At each LOR is associated a volume of response (VOR) and the number of counts of a LOR is connected at the sum of decay events within the VOR. A LOR is identified by 4 coordinates: r, φ, ν, s. r is the shortest distance between the LOR and the centre of tomograph in the transaxial axis; φ e ν are the angles between the LOR and y system axis in transaxial and axial axis respectively; in a definite number of fractions called tilt. A coincidence event is registered if the following conditions are satisfied:
- two photons are detected within the coincidence time window; - the decoded line of response is in the field of view of tomograph;

4
- ν angle of the line of response is smaller than the angle of acceptance of the tomograph;
- the energy of the two detected photons is included in the energetic window of the tomograph, which has an inferior energetic threshold to reduce the number of acquired events of scatter and a superior energetic threshold to remove possible pile-up problems and contaminations problems due to environmental radioactivity.
The events that satisfy these requisites are the prompts (P). The above requisites are not sufficient to remove all undesired events. The number of prompts is the results of the sum of the number of true events (T), random events (R), scatter events (S): P = T + R + S. A scatter coincidence occurs when one or both of photons interact with tissue before the arrival to the detector. Consequently, a wrong LOR is assigned to the event. A decreased contrast and an inaccurate quantification of the final image are the result. A random coincidence occurs when two atoms decay in the same moment. In this case two not correlated photons can be detected in the same coincidence window. An error of localization of decay is the result. A method to estimate the number of random events is the method of delayed window. A delayed coincidence window has the same duration of a classic coincidence window but the time of coincidence is five times delayed. The events detected in this window are only due to random coincidences and they can be used to estimate random events of the first window. Multiple events have analogous origin to random events: three photons of two different annihilations are detected in the same coincidence window. The frequency of detection of multiple events is a function of the count frequency.
1.2.1.2. Spatial resolution The emission positron physics calls for some limits to spatial resolution:
- the path of positron before annihilation because the aim of positron emission tomography is that of mapping the distribution of positron emitters and not that of annihilation points;
- the positron can not have all its energy dissipate. The positron has a residual moment and consequently, for the preservation of the moment, the two photons are not emitted to 180°. Supposing that the two photons are emitted to 180°, an error in the assignment of LOR is committed which causes a degradation of spatial resolution.
The resolution is of millimetres order because the site of annihilation of positron, which is visualized using positron emission tomography, can be localized at various millimetres of distance from the origin site of the positron itself. These limits are intrinsic to the physics of PET. The dimension, the distance and the form of detectors mostly influence the degradation of spatial resolution. Nowadays, the spatial resolution of PET is in the best of cases 5 mm for clinical tomograph and 1,5 mm for tomograph for preclinical studies characterized by a smaller field of view.

5
1.2.1.3. Detector system Physical configuration of PET tomographs is focused to maximize the detection of the coincident events and to minimize that of noise events. PET detectors are inorganic scintillators with high atomic number coupled with a series of photomultiplicators (PMT). The first scintillators, developed in the 70s, were crystals of Sodium Iodure activated with Thallium (NaI(Tl)). Due to the low density of Sodium Iodure, the detection of the 511 Kev annihilation photons was difficult. In the last years, Bismuth Germanate (BGO) was introduced which, thanks to its high density, allows an improvement of sensitivity but it also causes a decrease of energetic resolution. Nowadays, fast scintillators are used including Gadolinium Orthosilicate (GSO) and Luthetium Orthosilicate (LSO), both with the presence of Cerius. These scintillators significantly have improved the quality of the scanner used for clinical imaging. Using these fast scintillators, it is possible decrease the window of coincidence for decreasing the detection of random events. These scintillators also have a higher photoelectric fraction which allows a better energetic resolution and a subdivision of detection blocks into smaller crystals for improving spatial resolution [2].
1.2.1.4. Images acquisition and reconstruction Positron Emission Tomography is intrinsically a 3D imaging modality but it can work also in 2D modality. The 2D acquisition modality is based on Lead or Tungsten septum which allow to define the acquisition level limiting oblique acquisitions. The levels can be generated in different ways depending on number of levels, spatial resolution in axial direction and efficiency of detection per level. In 3D modality, the septum are not present and all possible LOR with an angle inferior to that of acceptance and localized between the rings are accepted. This configuration leads to an increase of sensitivity because the number of response lines, along it is possible to perform the acquisition, increases and the shadow projected on detectors disappears. 3D modality includes a higher number of rare events detected but on the other hand, a higher fraction of random and scatter events in acquired coincidences. The events are acquired in matrix of sinograms, in which each row of matrix represents parallel projection p (s φ) of the distribution of radioactivity in the subject with a specific angle(φ) and axial position (z) (Fig.1).

6
Starting to sinograms, the reconstruction of image is performed by applying algorithms of reconstruction. The most used algorithm is the Filter Back Projection (FBP) which originally was developed for x-rays tomography. The simplicity of implementation and the elevated computational efficiency are the most successful characteristics of this technique. In the 3D acquisition, FBP algorithm is generalized in a three-dimensional space and the vlume g (x,y,z) is oversampled by the integrals of plane p (s,r,φ,ν). FBP algorithm is based on a ideal model and it operates only in the reconstruction of images with low noise such as cerebral acquisition but not in total body acquisition. In presence of high background noise, the FBP algorithm amplify the high frequency components of the data of projection and thus the statistic noise. In the use of it, in a non ideal case, filters for noise attenuation and a correction for attenuation are necessary. Other reconstruction algorithms exist. They are based on iterative techniques which directly incorporates the stochastic nature of emission process and photons detection and important physical characteristic of source-detector system (i.e. attenuation, detection geometry, presence of scatter or random coincidences). These algorithms are based on the research of the convergence solution of an equation system, through a series of subsequent iterations starting from a first approximate solution. In each iteration, the profiles obtained by retroprojecting are corrected through the comparison to measured projection. These techniques, including FORE (Fourier Rebinning) and OSEM (ordered-subset expectation maximization), allow more accurate reconstructions but they are characterized by longer reconstruction time in comparison to FBP [2]. For the data reconstruction, FBP algorithm woks on a limited angle in axial direction; thus the fraction of accepted data by software varies between 15-50% for each
Fig.1 Townsend DW. Physical principles and technology of clinical PET imaging. Annals of the Academy of Medicine 2004;33(2):133-45.
On the left, injection of bradiopharmaceutical and acquisition of a pair of annihilation photons in a PET scan; sinograms collection in which each element of sinogram presents the number of annihilations in a specific
projection direction; finally the whole body image.

7
acquisition. To reconstruct all events without a decrease of resolution, Expectation Maximization (EM) algorithm is used for reconstruction of images [2]. EM algorithm is a general iterative method for the resolution of problems of evaluation, in which a part of observations misses or is censured. The centre of the iterative reconstruction is the matrix of probability i.e. a scattered matrix which needs long time for the computation. In fact digital images are made of matrix. The dimension of this matrix is obtained by the product of the number of detected LOR and the number of voxel in the Field Of View; it varies between hundreds of Gigabyte and tens of Terabyte. The matrix can not be uploaded during algorithm calculation but it may be loaded on-line during the iteration. Using all symmetries, the dimension of space occupied by matrix is reduced for a total factor of 80 value. Scattered matrix properties are used: element value is 0 when the voxel lies out the LOR and only non-zero values are stored. When sinograms parameters and the voxel of the FPV are fixed, before reconstruction starts, only non-zero values of probability and their coordinates in the original LOR are stored on disk. During iteration, the original LOR is analyzed and the index correspondent to the value are calculated. EM iteration needs 3-15 minutes analysis. The time of calculation depends on the parameters: smaller voxel need more time analysis. This type of reconstruction performs spatial resolution and it is used for reconstructing imaging in dedicated tomograph for small animal such as YAP-(S)PET.
1.2.2. PET and preclinical imaging
For many years, PET molecular imaging was focused to clinical studies. Preclinical activities were addressed to develop and characterize new ligands to successively apply in clinical studies. The recent availability of dedicated small animal tomographs with suitable sensitivity and spatial resolution together to the availability of appropriate animal models of disease has enabled the use of this method in preclinical research. This technique offers numerous advantages:
1. extensive field of applicability. Many ligands can be labelled with positron emitted isotopes without changes in the biological activity;
2. scarce invasivity. The radiopharmaceuticals are administered in microdose (<1/100 of active dose);
3. tomographic acquisition; 4. preclinical results can be translated in clinic; 5. studies were performed in vivo as in clinic.
Animal PET allows to reduce the time of screening and the development of new radiotracers to apply in oncologic field and neurodegenerative field and in the study in vivo of specific molecular target in preclinical model. Finally, the use of animal PET allows to reduce the number of animals to employ in the experiments without decrease of information in comparison to the other methods.

8
In addition, techniques for the labelling of antibodies or antibody fragments to apply in preclinical tumour model and techniques for the labelling of probes to use in gene reporter systems for studying genetic expression have been developed [3].
1.2.3. Tomographs for small animals
Nowadays, several types of tomographs dedicated to small animals have been developed. They have different configurations and physic characteristics. For the performance of a clinical scanner, spatial resolution, sensitivity, counts efficiency, image quality and corrections accuracy on total body images are the parameters of reference. In consideration of difference in dimension between clinical and preclinical tomographs, these parameters are not completely applied. For the calibrations, a not-standardized method, using “phantoms”, is applied [4]. The main commercial PET systems for small animal are microPET R4 and microPET P4 (Concorde Microsystem Inc, USA); HIDAC and Quad-HIDAC animal PET system (Oxford Positron System, UK), whose characteristics are summarized in table 1. The most recent system is Triumph pre-clinical system (GE Healthcare, USA), a fully integrated molecular imaging system which combines PET, SPECT and CT. PET unit, thanks to scintillators individually coupled to Avalanche Photo Diode (APD) detectors, reaches a spatial resolution similar to the limit of geometric resolution of crystals (about 0.9 mm FWHM). The high energy resolution (4.5% at 140keV) of the Cadmium Zinc Telluride (CZT) detector of the SPECT unit reduces radiation scatter, enables simultaneous multi-isotope imaging and allows a high resolution (<1mm). The CT X-O unit allows a 100 µm spatial resolution coupled with sub-minute whole body acquisition time.
MicroPET system is based on a detection system with scintillators with high density and high resolution LSO crystals coupled with photomoltiplicators sensitive to the position. HIDAC animal PET system is based on high density avalanche chamber detector modules consisting of argon-flooded multiwire proportional chambers (MWPC) applied with conversion plates made up of laminated layers of lead and insulating sheets, drilled with a dense matrix of small holes [4].
Tab.1 Weber and Bauer. European Journal of Nuclear Medicine and Molecular Imaging. 2004;31(11):1545-55.
Animal PET charactetistics. FORE Fourier Rebinning, FBP Filtered Back Projection, OSEM Ordered Subset EM, EM Expectation Maximization, ns not
specified.
9
HIDAC animal PET system has a field of view similar to that of MicroPET system (10-17cm in transaxial direction 10-12cm respectively) but a higher spatial resolution (0,9-1,2 mm in comparison to 1,8 mm).
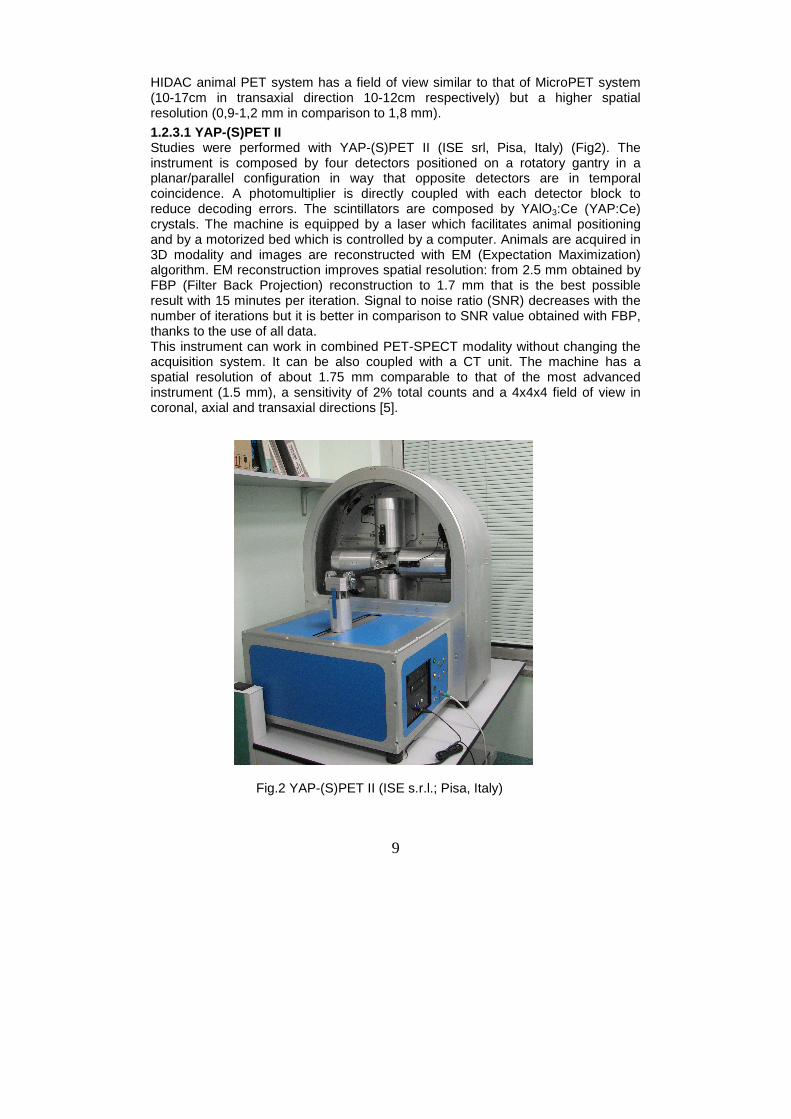
1.2.3.1 YAP-(S)PET II Studies were performed with YAP-(S)PET II (ISE srl, Pisa, Italy) (Fig2). The instrument is composed by four detectors positioned on a rotatory gantry in a planar/parallel configuration in way that opposite detectors are in temporal coincidence. A photomultiplier is directly coupled with each detector block to reduce decoding errors. The scintillators are composed by YAlO3:Ce (YAP:Ce) crystals. The machine is equipped by a laser which facilitates animal positioning and by a motorized bed which is controlled by a computer. Animals are acquired in 3D modality and images are reconstructed with EM (Expectation Maximization) algorithm. EM reconstruction improves spatial resolution: from 2.5 mm obtained by FBP (Filter Back Projection) reconstruction to 1.7 mm that is the best possible result with 15 minutes per iteration. Signal to noise ratio (SNR) decreases with the number of iterations but it is better in comparison to SNR value obtained with FBP, thanks to the use of all data. This instrument can work in combined PET-SPECT modality without changing the acquisition system. It can be also coupled with a CT unit. The machine has a spatial resolution of about 1.75 mm comparable to that of the most advanced instrument (1.5 mm), a sensitivity of 2% total counts and a 4x4x4 field of view in coronal, axial and transaxial directions [5].
Fig.2 YAP-(S)PET II (ISE s.r.l.; Pisa, Italy)
10
1.2.4. PET application
PET molecular imaging allows to identify and study specific biological alterations which are present in the beginning phase of disease and to monitor disease progression in a non-invasively way. The possibility to correlate biological data with specific symptomatologycal cluster in the initial phase of disease and during its progression is very important for the identification of specific subpopulation which are present within a clinical class and for the development and the monitoring of innovative therapies. One of the most used radiotracers is an analogue of glucose labelled with F-18, the 2-[F-18]Fluorine-2-deoxy-D-glucose ([18F]-FDG). It is used both in clinical and in preclinical research. This radiotracer is uptaked by cells through glucose transporters and it is phosphorylated in position 6 by hexokinase. [18F]FDG does not have hydroxyl group in position 2; after phosphorylation it can not continue glycolysis pathway and it is entrapped within cell. [18F]FDG is the most used tracer to imaging heart, brain and tumour diseases. In the brain, glucose is the main metabolite for ATP synthesis and during a disease its consumption decreases, thus this radiotracer has allowed to study many neurodegenerative pathologies including cortical dementia, Alzheimer’s disease and to differentiate patients affected by dementia from the normal effects of aging or from the presence of depressive disease [6,7]. In the heart tissue, using [18F]FDG is possible to distinguish ipoperfused but vital areas from ipoperfused necrotic area. In oncology, neoplastic tissues showed a higher consumption of glucose due to the progressive lost of the tricarboxylic acid cycle and the consequent activation of the pentose phosphate pathway. Pentose phosphate pathway produces the carbonic skeletons for the synthesis of DNA and RNA due to the high cell proliferation. Using [18F]FDG-PET is possible to identify metabolic alterations before anatomical alterations are present, thus this technique has a higher sensitivity in comparison to CT in the diagnosis of some types of tumours including non-small cell lung carcinoma, colon carcinoma, breast carcinoma, melanoma and head-neck tumours [8]. The development of total body PET analysis has been important to detect the presence of primary recurrence lesions. In addition it has allowed to identify the presence of secondary lesions (metastases) and to improve therapeutic protocols monitoring the response to different types, doses and time of treatment [4].
The information obtained using PET analysis, summed to anatomical information obtained by CT and MRI can:
1. discriminate benign to malign lesions, 2. identify biological changes of tumour from primary stage to its progression, 3. visualize all boy organs to detect primary tumours, metastases and their
extension. In this way it is possible to detect also asymptomatic diseases 4. discriminate malign tissues from, necrotic ones, oedema, scared tissues. 5. monitor therapy response and to improve therapeutic protocol.
[18F]FDG can be also used to visualize inflammatory process, this application will be discussed in a following paragraph.

11
Successively, many other radiopharmaceuticals have been developed to visualize and monitor specific metabolism and processes. [11C]Choline allows to monitor the metabolism of phospholipids of membrane. Tumour cells showed an increase of phosphatidylcholine due to an increase of choline kinase activity to sustain tumour growth. This molecule was used in brain, lung and bladder cancer but its main application is in prostate cancer because of its localization, near bladder, [18F]FDG use is impaired. [11C]PK11195 and analogue molecules of ligands of peripheral benzodiazepine receptors allow to monitor neuroinflammatory disorders such as Alzheimer disease and multiple sclerosis. [18F]FLT (Fluorine-levo-thymidine) is a specific marker of cell proliferation and the most important field of application of FLT is lung cancer. Another important process that can be monitored using PET imaging is tumour hypoxia which will be extensively discussed in the next paragraphs of the thesis.
12
1.3. Tumour and hypoxia
Many solid tumours as breast, cervical, head-neck, prostate, colon, lung cancer and melanoma are characterized by the presence of areas of hypoxic tissue which are due to a lack of equilibrium between the pO2 supply to the cell and the cellular pO2 consumption rate [9]. Hypoxia is known to be a negative prognostic factor both for the answer to pharmacological and radiant therapy and for disease progression and tumour invasiveness. In fact, since the half of the last century hypoxia was described as cause of radiotherapy failure in solid tumours [9,10]. More recently, tumour hypoxia was associated to decrease the efficacy of certain cytotoxic drugs including cyclophosphamide, carboplatin, carmustine and melphalan [9]. Finally the hypoxic microenvironment promotes tumour progression in particular local invasion and distant metastasis. Hypoxic stress can lead to two consequences to tumoural cells. From one side, it induces cellular growth stasis or impairment through modulations of the cellular pathways; from the other side, it promotes tumour propagation by helping cells to adapt to nutritive deprivation by facilitating cellular proliferation, local invasion and metastatic spread [9]. The first phenomena could explain the delayed recurrences, dormant micrometastasis and growth retardation observed in large tumour masses [9]. Hypoxia stimulates the transcription of glycolytic enzymes (hexokinase), of glucose transporters (GLUT-1 and GLUT-3), of angiogenetic molecules, of growth factors (VEGF) and of enzymes and proteins involved in the tumour spread. A lot of these factors are controlled by hypoxia inducible factor called HIF-1 [9,11]. For these reasons the study of methods and instruments which permit identification and localization of hypoxic areas has a particular interest in clinical diagnostics.
1.3.1. Pathogenesis of tumour hypoxia
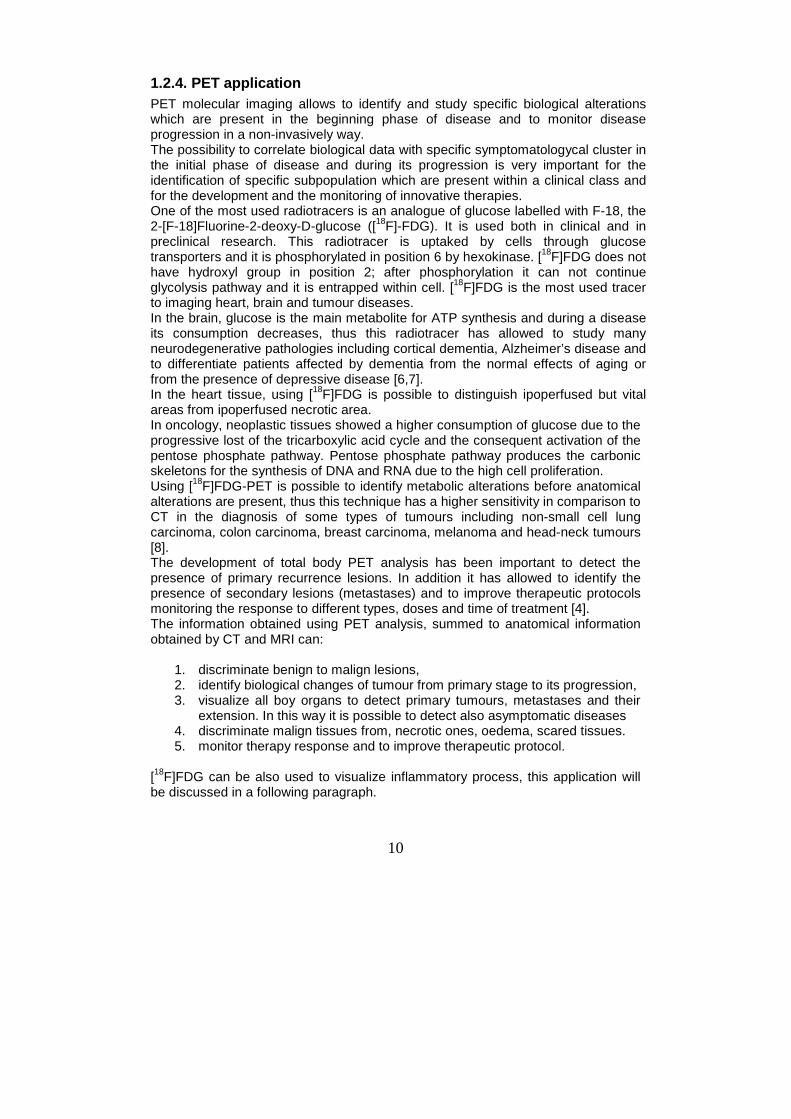
Hypoxic areas are the result of a disequilibrium between oxygen (O2) supply and consumption rate. Many factors can cause hypoxia but most of which are perfusion- or diffusion-related. Perfusion-related (acute) hypoxia is caused by a sudden inadequate blood flow in tissue [9]. The neo-vases which grow within tumoural masses frequently have severe structural and functional abnormalities, such as a disorganized vascular network which cause a sudden and complete reduction in blood flow [9,12]. The phenomena is often transient. In diffusion-related (chronic) hypoxia, the growth of the tumour mass itself cause an increase of distance from blood vessels and cells that are exposed to a gradually decreasing levels of oxygen [9,12] (Fig.3)
13
1.3.2. HIF
1.3.2.1. HIF structures The most important regulator of the cellular response to hypoxic stress is hypoxia-inducible factor 1 (HIF-1). This factor helps cell to adapt to oxygen deprivation by regulating the expression of genes that are involved in many cellular processes as glucose uptake, metabolism, angiogenesis, erythropoiesis, cell proliferation and apoptosis [10]. HIF-1, is an αβ-heterodimeric transcription factor, consists of a constitutively expressed HIF-1β subunit also known as ARNT (arylhydrocarbon receptor nuclear translocator) and a oxygen-sensitive alpha subunit (HIF-1α). Three alpha HIF subunits have been characterized. HIF-1α contains four distinct domains including a bHLH domain (basic helix-loop-helix) for DNA binding and dimerization, a PAS domain (PER-ARNT-SIM family) for dimerization and target gene specificity, an oxygen-dependent degradation domain (ODD) required for degradation by the ubiquitin-proteasome pathway, and two transactivation domains located in the C-terminal portion of the protein (Fig.4). It is ubiquitously expressed and induces the expression of many hypoxia-inducible genes [10]. HIF-2α is structurally similar to HIF-1α and contains bHLH, PAS and ODD motifs with 85, 70 and 70% amino-acid sequence omology to HIF-1α. It heterodimerizes with ARNT and can induce gene expression. In contrast to HIF-1α, HIF2α expression is restricted to specific cell types that include endothelial cells, glial cells, type II pneumocytes, cardiomyocytes, fibroblasts of the kidney, interstitial cells of the pancreas and duodenum and hepatocytes [10]. The third alpha member HIF-3α has an amino-acid sequence with 57% and 53% of identity to HIF-1α and HIF-2α respectively and an ODD domain 61% similar in sequence to the HIF-1α ODD domain. It can dimerizes with the subunit beta and bind to the hypoxia response elements (HREs) in vitro. The mRNA can be detected
Fig.3 Stewart et al. British Journal of Urology International 2009;105:8-13. Schematic representation of acute and cronic hypoxia within a solid tumor
deposit.

14
in many tissues including thymus, lung, brain, heart, kidney, liver, eye and brain [10]. ARNT or HIF beta subunit is the general binding partner for all bHLH/PAS family members. Similar to HIF-α subunits, ARNT contains bHLH, PAS, and a transactivation domain (Fig.4). However, ARNT lacks an ODD domain and is therefore constitutively expressed in all tissues under aerobic conditions [10]. Another HIF-β subunit exists and it can also heterodimerize with HIF-alpha proteins, ARNT2. The two proteins are very similar but the expression patters are different. In particular, whereas Arnt mRNA is ubiquitously expressed, Arnt2 expression is restricted to the brain and kidney in adult tissues.
1.3.2.2. Role of HIF in hypoxia The synthesis of HIF-1α is regulated by activation of the phosphatidylinositol 3-kinase (PI3K) and mitogen-activated protein kinase (MAPK) pathways. These pathways can be activated by signalling via receptor tyrosine kinases, non-receptor tyrosine kinases or G-protein-coupled receptors [13]. In condition of normoxia (O2) and in presence of Fe2+, 2-oxoglutarate (2-OG) and ascorbate, HIF-1α is hydroxylated by proline hydroxylases (PHD1, 2 and 3) at level of Proline (Pro)-402 and -564. Hydroxilated HIF-1α(OH) is recognized by pVHL (the product of the von Hippel-Lindau tumour suppressor gene) which, together with a multisubunit ubiquitin ligase complex, tags HIF-1α with polyubiquitin. The formed complex is recognized by the proteosome and degradated. Oxygen also regulates the interaction of HIF-1α with transcriptional co-activators. The factor inhibiting HIF-1 (FIH-1) hydroxylates asparagine (Asn)-803 in the transactivation domain blocking the binding of p300 and CBP and therefore inhibiting HIF-1-mediated genes transcription. In hypoxic condition, proline hydroxylases can not hydroxylate HIF-1α and the binding of VHL to HIF-1α and the successively degradation are inhibited. HIF-1α accumulates and translocates in the nucleus where dimerizes with the subunit β. The heterodimer binds to hypoxia-response elements (HREs) within the
Fig.4 Rankin and Giaccia. Cell Death and Differentiation 2008;15:678-85. Schematic representation of HIF family member protein domains.

15
promoters of target genes and recruits transcriptional co-activators such as p300/CBP for full transcriptional activity (Fig.5). The same mechanism is valid also for HIF-2α and HIF-3α [12].
HIF-1α expression is also induced from pathways activated by growth factor signals. In comparison to the increase of HIF-1α induced by hypoxia, growth factor signals stimulate HIF-1α expression in a cell-type specific manner [13]. The synthesis is performed through activation of phosphatidylinositol 3-kinase (PIK3) or mitogen-activated protein (MAPK) pathways as illustrated in figure 6. The effect of growth factor signalling is an increased of expression of HIF-1α protein. In this condition of over-expression of HIF-1 protein, FIH-1 could became limiting and the number of HIF-1α or HIF-2α transcriptionally active could increase. HIF-1 could transcript growth factor gene initiating an autocrine signalling pathway that in cancer cells could be crucial for tumour progression.
Fig.5 Stewart et al. BJU International 2010;105:8-13. Representation of the mechanism of action of HIF-1α in presence (A) or
absence (B) of oxygen.

16
HIF promotes the transcription of many genes involved in key steps of tumorigenesis including angiogenesis, metabolism, proliferation, metastasis and differentiation. Angiogenesis is very important for tumour progression to supply oxygen and nutriments. HIF can activate the expression of a number of pro-angiogenic factors including VEGF, VEGF receptors FLT-1 and FLK-1, plasminogen activator inhibitor-1 (PAI-1), angiopoietins (ANG-1 and -2), platelet-derived growth factor B (PDGF-B) and matrix metalloproteinases MMP-2 and MMP-9. VEGF is expressed in a large number of human tumours. HIF directly regulates genes involved in glycolytic metabolism including glucose transporters GLUT-1 and GLUT-3, glycolytic enzymes like hexokinase 1 and 3, lactate production and pyruvate metabolism. HIF family controls cellular proliferation through modulation of C-Myc activity.
Fig.6 Semenza. Nature Reviews Cancer 2003;3:721-732. Representation of HIF-1α synthesis via growth factor signalling pathways.

17
The presence of metastasis is a negative prognostic factor in tumour pathogenesis. The metastatic process is characterized by several steps: cell invasion, intravasation, extravasation and proliferation. HIF actives and promotes metastasis through the activation of many factors including: E-cadherin that regulates cell-cell adhesion; extracellular matrix protein LOX (lysyl oxidase) that is involved in extracellular matrix formation; CXCR4 (C-X-C chemokine receptor type 4) and its ligand SDF-1 (stromal derived factor 1) that play a role in the directional migration of metastatic tumour cells.
1.3.3. Glycolysis and respiration
Altered glucose metabolism is a characteristic of invasive cancers. Otto Warburg since 1924 noticed that cancer cells preferentially converted glucose into lactic acid instead of pyruvate even in presence of sufficient oxygen, for this reason “Warburg Effect” is also called aerobic glycolysis. Warburg hypothesized that this phenomenon was due to an impairment of mitochondrial functionality but many studies deny this hypothesis [14,15]. Aerobic glycolysis seems a disadvantageous method to create energy. In fact, it generates only 2 ATPs per molecule of glucose, whereas oxidative phosphorilation generates up to 36 ATPs molecules upon complete oxidation of one glucose molecule. Unicellular organisms such as microbes change their metabolic phenotype in relationship with environmental conditions. In presence of abundant nutrients, they quickly replicate growing by fermentation of glucose into a small organic molecule such as ethanol. When nutrients are scarse, cell stops biomass production and converts metabolism to extract the maximum possible energy from the available supply to survive the starvation period. In a similar way, multicellular organism adopts a proliferative metabolism in presence of growth signals and a quiescent metabolism in absence of growth signals [16] (Fig.7). Cancer cells have genetic mutations in growth pathway that overcome this control system. Proliferating tumour cells seem to use a less efficient metabolism which is anyway able to satisfy the need of the cell. Glucose and glutamine supply most of the carbon, nitrogen, free energy and reduced equivalents necessary to support cell growth and division. Glucose can be converted to macromolecular precursors such as acetyl-CoA for fatty acids, glycolytic intermediates for nonessential aminoacids and ribose for nucleotides. For example, the pentose phosphate pathway (PPP) uses glucose-6-phosphate to generate NADPH which contributes to fatty acid synthesis and, together with ribose-5-phosphate, to nucleotide synthesis (Fig.8). In addition, glutamine is used by proliferating tumour cells to generate α-ketoglutarate which can be metabolized through the tricarboxylic acid (TCA) cycle to generate oxaloacetate (OAA) [17]. Glutaminolysis can produce NADPH as energy source via the activity of NADP+-specific malate dehidrogenase with production of lactate as end-product.

18
Mutations in metabolic enzymes become very important to carcinogenesis in fact normal cells need exogenous stimulation to proliferate whereas in tumour cells genetic alterations support cell growth in every condition. The most important regulators identified are the members of PI3K/Akt/mTOR pathway, HIF-1α and c-myc. Akt increases the expression of glucose transporters and glycolytic enzymes favoring glucose to lactate metabolic pathway and Warburg effect. Genetic alterations in PI3K and PTEN (a negative regulator of PI3K) lead to a chronic activation of Akt. HIF-1α is stabilized by the activation of the PI3K/Akt/mTOR pathway. HIF-1α increases the expression of glucose transporters, glycolytic enzymes, PDK and LDH-A. c-Myc is an oncogenic factor and also stimulates the expression of glycolyitic enzymes and genes involved in mitochondrial biogenesis. Lactate may be also seen as a source of energy in particular conditions. Sonveaux et al. demonstrated the presence of a metabolic symbiosis between hypoxic and aerobic tumour cells [18]. Hypoxic cells produced lactate which was used as principal source of energy by aerobic cells. Aerobic tumour cells, which were localized near blood vessels, prefered using lactate over glucose in oxidative metabolism and in this way, glucose could be available for hypoxic cells for aerobic glycolysis. Sonveaux et al. identified, in mouse and human tumours, MCT1 (monocarboxylate transporter 1) as the major transporter ensuring lactate uptake by oxidative tumour cells and MCT4 (monocarboxylate transporter 4) as a hypoxia-induced transporter involved in the removal of lactate from glycolytic cells [17,18]
Fig.7 Vander Heiden et al. Science 2009;324:1029-1033. Microbes and cells from multicellular organisms have a similar
metabolism under similar environmental conditions. Proliferative cells metabolize glucose or sugar through glycolysis excreting large amounts of carbon in the form of ethanol, lactate or other organic acids. In lack of
nutrients, unicellular organism use a oxidative metabolism to starve energy as do cells in multicellular organism in absence of growth
signals.

19
(Fig.9). Moreover, MCT1 was found in the tumour cell population located in vascularised tumour area whereas MCT4 was consistently concentrated in hypoxic regions.
The upregulation of glycolysis and the consequent production of lactate lead to a decrease of extracellular pH. Normal cells death, due to a prolonged exposition to an acidic microenvironment, is induced for necrosis or apoptosis through p53- and caspase-3-dependent mechanism. Tumoural cells adapt to extracellular acidosis through resistance to apoptosis or upregulation of membrane transporters to maintain normal intracellular pH. Acidosis is crucial for the development of invasive cancer. First, acidosis alters the local environment permitting the survival of tumoural cells and causing the death of other populations. Second, acidification of the microenvironment facilitates invasion both through destruction of adjacent normal populations and through acid-induced degradation of the extracellular matrix (ECM) and promotion of angiogenesis [19]. Gatenby and Gillies suggest that acidosis itself can be mutagenic and clastogenic, possibly through inhibition of DNA repair and can lead to both inhibition of gap-
Fig.8 Feron. Radiotherapy and Oncology 2009; doi:10.1016/j.radonc.2009.06.025.
Glycolysis in proliferating cells. Glycolytic flux generates ATP and biosynthetic precursors in the cytosol. Pyruvate is converted into lactate by lactate
dehydrogenase A (LDH-A). Pyruvate dehidrogenase kinase (PDK) blocks the activation of mithocondrial pyruvate dehydrogenase (PDH), limiting the pyruvate
conversion into acetyl-CoA and further feeding the TCA cycle. Hypoxia-inducible factor 1alpha (HIF-1alpha) stimulates the expression of LDH-A and PDK and moreover the glycolytic flux by increasing the expression of glucose transporters and/or glycolytic enzymes as well as Akt and c-Myc. C-Myc also
stimulates LDH-A expression.

20
junction conductance and to spontaneous transformation of normal diploid fibroblasts. In this way the basement membrane can be breached and the tumour become vascular both by the pre-existing vessels within the stroma and by the new vessels growth directly into the tumour mass. Tumour cells can come out and invade other tissues.
1.3.4. Hypoxia and therapy resistance
Gottwald Schwart in 1909 for the first time described the phenomenon of clinical radioresistance [20] but only in 1953 Gray et al. pointed toward the importance of tumour hypoxia as a cause of radioresistance. Now it is well established that solid tumours may contain oxygen-deficient hypoxic areas and that cells are radioresistant [21]. Moreover hypoxia also induces resistance to chemotherapy treatments including cyclophosphamide, carboplatin, carmustine and melfalan [22]. Hypoxia-induced radioresistance is multifactorial. First, the presence of oxygen causes DNA damage through the formation of oxygen free radicals which occurs after the interaction of radiation with intracellular water. Well-oxygenated cell are three times more sensitive to x-and gamma radiation than the same cells when
Fig.9 Feron. Radiotherapy and Oncology 2009; doi:10.1016/j.radonc.2009.06.025.
Lactate metabolic symbiosis. Aerobic tumor cell is near blood vessel and express monocarboxylate transporter 1 (MCT1) to
uptake lactate fro using it as principal substrate for mithocondrial oxidative phosphorylation. In this way, glucose is available for
glycolysis in hypoxic tumor cells. Lactate is then secreted through the hypoxia-induced monocarboxylate transporter 4
(MCT4) in the interstitial fluid.

21
they are hypoxic [23]. Moreover hypoxia mediates proteomic and genomic changes that contribute to radioresistance as increase of heat shock proteins (HSPs) or increase of the number of tumour cells that can resist to apoptosis by mutating p53 or expression of stress proteins that protect cells by the action of DNA topoisomerases inhibitors, including etoposide and camptotecine [24]. Finally, anomalous angiogenesis may interfere with the correct release of chemotherapy drugs. All these mechanisms together ensure that tumour hypoxia is a negative prognostic factor. In order to outcome and identify patients with a worst prognosis and/or patients that would benefit from appropriate treatments, in vivo measurement of tumour hypoxia is required.
1.3.5. In vivo measurement of tissue hypoxia
Tumour hypoxia is a very important biological feature and there is not a simple and good method to identify its presence. Imaging could be a good non-invasively way to visualize tumour hypoxia and select patients for the most appropriate therapy. Imaging could also be used to monitor the effect of re-oxigenation after radiotherapy. Nowadays, it is possible to measure hypoxia on the basis of three principles:
1) Identification of gene activation and molecular activity caused by hypoxia in biopsy specimens.
2) Measurement of the physical amount of oxygen in a tissue using polarografic electrodes.
3) Use of radiolabelled compounds that are reduced by hypoxic cells.
1.3.5.1. Biopsy specimens Hypoxia-inducible factor 1 (HIF-1) is responsible of the transcription of many genes in condition of hypoxia. The HIF-1 pathway mediates hypoxia response by transcription of genes involved in glucose metabolism as glucose transporters (GLUT) and hexokinase (HK), in angiogenesis as vascular endothelial growth factor (VEGF), in erythropoiesis as erythropoietin and in apoptosis as carbonic anhydrase IX (CAIX). All these molecules are possible target of hypoxia condition. In particular carbonic anhydrase IX is the most used in immunohistochemical analysis. Carbonic anhydrase IX favours cellular survival by promoting invasiveness and by inhibiting apoptosis. A further marker for hypoxia is pimonidazole which is used ex-vivo particularly for preclinical studies. Pimonidazole hydrochloride is a bioreductive chemical probe with an immunorecognizable side chain. The addition of the first electron during bioreductive activation is reversibly inhibited by oxygen, resulting in futile cycling with half-maximal p=2 of inhibition of about 3 mmHg, with complete inhibition occurring at about 10 mmHg [25]. 1.3.5.2. Polarographic electrodes Polarographic electrodes is the most used technique for tissue hypoxia determination. Oxygen probes are implanted directly into tumours to measure oxygen concentration. The probe has a surface of about 25 µm. A negative voltage is applied between the catode and the anode, the oxygen flow reaches the cathode where it is reduced. The electrons are captured by the cathode and the produced current is proportional to oxygen concentration.

22
Recently this method has been coupled with computed tomography and a ultrasound guide to improve the probe localization within the tumour. Three linear sections were analyzed and a total of 100-220 measurements were performed in each tumour to limit the tumour heterogeneity [26]. Lyng et al. studied the pO2 in tumoural tissues and compared the results with histological analysis. Measured pO2 were consistent with the histological characteristics of tissue [26]. Nevertheless, the technique is very invasive for a clinical use and it cannot define the real extension of tumour hypoxia because the presence of oxygen within tumour is very heterogeneous.
1.3.5.3. Imaging techniques Imaging method allows the visualization of tissue hypoxia in a non-invasive way and monitoring the extension and heterogeneity of hypoxia within the tumour. The most potential techniques are MRI-BOLD and PET in association with selected tracers.
1.3.5.3.1. BOLD-MRI BOLD-MRI (Blood oxygenation level dependent-MRI) allows to obtain information on tissue perfusion, vascular volume and permeability and on the molecular and metabolic changes of tumours in cerebral studies by measuring oxyhaemoglobin and deoxyhaemoglobin ratio. BOLD-MRI contrast is affected by intrinsic tissue properties including spin-lattice and spin-spin relaxations as in classic MRI but also by blood flow and paramagnetic deoxyhaemoglobin within red blood cells. Oxyhaemoglobin is not paramagnetic. Deoxihaemoglobin increases the MR transverse relaxation rate (R2) of water in blood and surrounding tissues thus BOLD-MRI is sensitive to pO2 within tumour. Static tissue components include iron content (e.g. globin found in muscle) and the presence of fibrosis or ligamentous structures also affect the appearances of intrinsic susceptibility weighted images. In order to decouple the effects of flow from deoxyhaemoglobin and static components it is necessary to measure the T2 relaxation rate (R2=1/T2). It is also important to remember that improving blood flow and vascular functioning will increase tissue oxygenation which can be seen in R2 images. Thus BOLD-MRI images are more likely to reflect on acute tissue hypoxia which occurs because of transient occlusion of vessels. In contradistinction, chronic hypoxia is less likely to be reflected by BOLD-MRI because the red blood cells in vessels are too distant from the area of hypoxia. Moreover it is important that red blood cells are delivered to the tissue in analysis. It is important to determine the distribution of blood volume in tissue for correctly interpreting images [23]. BOLD-MRI is a technique with high temporal and high spatial resolution. It is possible to decouple the effect of flow and deoxyhaemoglobin and demonstrate changes in oxygenation independent of changes in blood flow. Moreover, there is no need to administer a radioactive contrast. Indirect measurement of tissue pO2, images with low signal to noise ratio and the technical challenge of carbogen vasomodulation in clinical studies are the major limits. BOLD-MRI appears most sensitive to oxygen levels adjacent to perfused vessels [23].
1.3.5.3.2. PET In vivo PET imaging allows the visualization of tissue hypoxia using the oxygen-dependent cellular retention of radiopharmaceuticals like [64Cu]ATSM and nitroimidazoles compounds such as [18F]FMISO and [18F]FAZA. Among nitroimidazoles compounds, [18F]FAZA showed the highest signal to noise ratio.
23
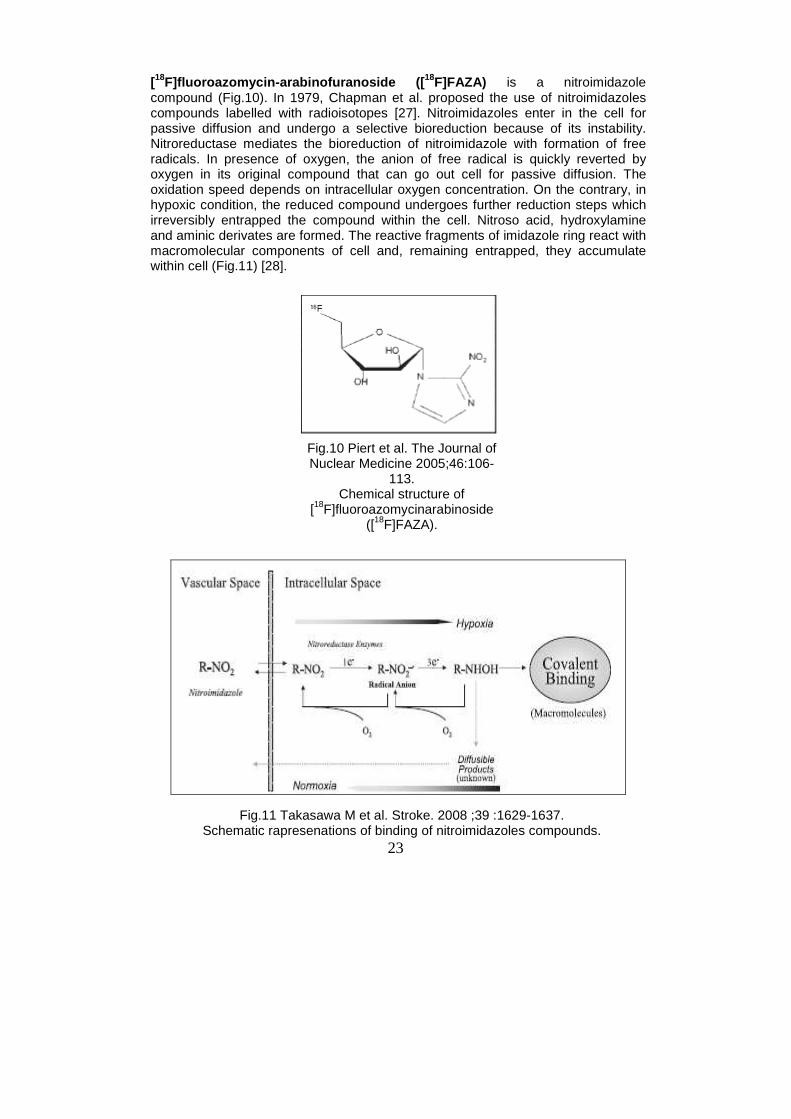
[18F]fluoroazomycin-arabinofuranoside ([ 18F]FAZA) is a nitroimidazole compound (Fig.10). In 1979, Chapman et al. proposed the use of nitroimidazoles compounds labelled with radioisotopes [27]. Nitroimidazoles enter in the cell for passive diffusion and undergo a selective bioreduction because of its instability. Nitroreductase mediates the bioreduction of nitroimidazole with formation of free radicals. In presence of oxygen, the anion of free radical is quickly reverted by oxygen in its original compound that can go out cell for passive diffusion. The oxidation speed depends on intracellular oxygen concentration. On the contrary, in hypoxic condition, the reduced compound undergoes further reduction steps which irreversibly entrapped the compound within the cell. Nitroso acid, hydroxylamine and aminic derivates are formed. The reactive fragments of imidazole ring react with macromolecular components of cell and, remaining entrapped, they accumulate within cell (Fig.11) [28].
Fig.10 Piert et al. The Journal of Nuclear Medicine 2005;46:106-
113. Chemical structure of
[18F]fluoroazomycinarabinoside ([18F]FAZA).
Fig.11 Takasawa M et al. Stroke. 2008 ;39 :1629-1637. Schematic rapresenations of binding of nitroimidazoles compounds.

24
Piert et al. studied [18F]FAZA biodistribution in vivo in two tumour models: murine mammary carcinoma cells (EMT-6) and pancreatic acinar tumour cells (AR42J). In both tumours, at 180 min from radiotracer injection, [18F]FAZA displayed higher tumour to background, tumour to muscle and tumour to blood ratios due to its more rapid clearance from blood and non-target tissues in comparison to [18F]FMISO [29]. This data were confirmed also in a study by Reischl et al. where [18F]FAZA, [18F]FMISO and [124I]IAZA were compared in a preclinical model of human squamous cell carcinoma cells [30]. Sorger et al. compared the uptake of [18F]FAZA and [18F]FMISO in hypoxic cells in vitro and in a Walker 256 rat sarcoma model. In vitro [18F]FAZA indicated a reduced oxygen supply in the same magnitude order than [18F]FMISO. In vivo, [18F]FMISO displayed a slightly higher standardized uptake value (SUV) and tumour to muscle ratio compared to [18F]FAZA even if the elimination of the latter was faster [31]. Busk et al. verified the distribution of [18F]FAZA in hypoxic tumour region by comparing it to eppendorf electrode measurement and the hypoxia marker pimonidazole and it was proved to be consistent with tumour hypoxia [32]. Successively, Busk et al. compared the in vitro the cellular retention of [18F]FDG and [18F]FAZA in hypoxic condition and tested tracer distribution between hypoxic and non-hypoxic areas in different mice xenograft. The in vitro and in vivo experiments indicated that [18F]FAZA is an excellent marker for tumour hypoxia whereas [18F]FDG is not [33]. In clinic, the role of [18F]FAZA was evaluated in two studies with patients with head and neck cancer. A study concluded that [18F]FAZA-PET imaging was a feasible and adequate method for imaging tumour hypoxia [34]. The other one concluded that [18F]FAZA-PET imaging may be used for planning radiation treatment and intensity-modulated radiotherapy [35]. Among nitroimidazoles compounds, [18F]FAZA displayed the highest signal to noise ratio. Another promising hypoxia marker for PET is [64Cu]diacetyl-bis(N 4-methylthiosemicarbazone) ([ 64Cu]ATSM) (Fig12) [36]. [64Cu]ATSM has small molecular weight and high cell membrane permeability and thus it can diffuse easily from bloodstream to surrounding cells. Preclinical studies indicate that [64Cu]ATSM preferentially accumulates in tumour cells and more rapidly in hypoxic cells compared to well oxygenated cells [37-39]. Clinical studies on [64Cu]ATSM showed an inverse correlation between the level of radiotracer uptake in tumours and clinical outcome in patients with non-small cell lung cancer and cervical carcinoma [40,41]. Despite these promising data and studies, the exact trapping mechanism in hypoxic cells remains uncertain. Three different mechanisms were proposed. The first mechanism was proposed by Fujibayashi in 1997: Cu(II)-ATSM is reduced to Cu(I) in hypoxic cells, then it rapidly dissociates remaining entrapped within cell (Fig.13) [36]. Dearling et al. suggested than Cu(II)-ATSM reduction occurs in all cells independent of oxygen levels. In presence of oxygen, Cu(I)-ATSM is reoxidized to Cu(II)-ATSM and can come out cell; in absence of oxygen, Cu(I) dissociates from the parent compound remaining entrapped within cell (Fig.13) [42]. Burgman et al. suggested that after Cu(I) dissociation, copper is absorbed into the intracellular copper pool. Intracellular copper homeostasis is regulated by a complex system of membrane transporters. Ctr1 is the primary cellular transporter for Cu(I) whereas the two primary exporters are ATP7A (Menkes protein) and ATP7B (Wilson protein). These molecules are specific for

25
Cu(I) transport. The expression of these proteins is cell dependent and may be responsible for the different uptake of tracer in different types of cells (Fig.13) [43].
In different studies of comparison between [18F]FDG and [64Cu]ATSM, the hypoxic radiotracers were not present in necrotic areas of tumour but it mainly accumulated at the edge of tumour whereas [18F]FDG accumulated in the inner part [44,45]. In clinic, numerous studies were performed using Cu-60 which has a short life time (23.7min) in order to demonstrate the feasibility of using Cu-ATSM to identify hypoxic areas in tumours, [40,41]. In a recent work, Lewis et al. compared [60Cu]ATSM and [64Cu]ATSM (half time: 12.5 h) in patients with cervical carcinoma concluding that [64Cu]ATSM was a safe radiopharmaceutical and the quality of obtained images was high [46]. The half-time of Cu-64 allows to perform late studies. O’Donoghue et al. compared the distribution of [18F]FAZA to that of [64Cu]ATSM at early (2 after injection) and late time (24 after injection) in a head neck cancer mouse model and a prostate
A B
Fig.12 Fujibayashi et al. J Nucl Med. 1997;38(7):1155-60.
Chemical structure of Cu-ATSM.
Fig.13 Fujibayashi et al. J Nucl Med. 1997;38(7):1155-60 and Burgman et al. Nucl Med Biol. 2005;32:623-630
Models for the uptake and accumulation of Cu-ATSM hypothesized by Fujibayashi (A) and Burgman (B). For Burgman uptake and accumulation of Cu-
ATSM are cell-dependent because also linked to intracellular Copper homeostasis.

26
cancer rat model. The authors observed that the distribution of [64Cu]ATSM at early and late time was similar to that of [18F]FAZA in the head neck tumour. On the contrary, in prostate tumour, the distribution of [64Cu]ATSM was different at early and late time and [18F]FAZA distribution was more similar to that of [64Cu]ATSM at early time (Fig.14) [47]. [18F]FAZA and [64Cu]ATSM, for their characteristics, are two very interesting molecules for detecting hypoxic tumour areas and planning the best therapy strategy. On the other hand, they need further studies to understand better the molecular mechanisms that regulate tumour uptake.
FaD R3327-
Fig.14 O’Donoghue J.A et al. Int. J. Radiation Oncology Biol. Phys. 2005;61:1493–1502.
On the left, PET images of prostatic tumour model (R3327-AT) and on the right PET images of head-neck tumour model (FaDu). A and B indicates two different animals injected with the same tumour cells. In head neck cancer model, the two
radiopharmaceutical showed the same uptake. In prostatic tumour, [64Cu]ATSM at early and late showed a different uptake and late uptake is more similar to that of
[18F]FAZA.

27
1.4. Cancer and inflammation
In presence of a pathogen, organisms adopt a system of defence called immune response which is composed by two main mechanisms: innate immunity which represents the first response to an enemy and it is composed by granulocytes, macrophages and natural killer cells (NKc); and specific immunity which is successively activated through the presentation of specific molecules to lymphocytes T and B by the cells of innate immunity. The response of immunological system is regulated by a complex mechanism of chemical signals, based on the interaction of specific molecules as chemokines with their receptors. Immune system is naturally programmed to generate a response against tumoral cells. In response to this, tumour cells have created mechanisms to elide the attack of immune cells and in addition to use them to facilitate tumour growth and progression. For these reasons, the relationship between immune system and neoplasia is of particular interest. In the 1850s, Virchow suggested chronic inflammation as possible cause of cancer development. Many works have recently indicated that this inflammation participate or even is the cause, of many neoplasma [48,49]. Generally, pathogens are responsible of the development of chronic inflammation and cancer development (helicobacter pylori on stomach cancer, herpes virus on cervical cancer and schistosomes on bladder cancers) [49]. Chronic inflammation may be also caused by the continuous actions of irritants such as asbestos, silica and smoke (bronchial cancers). Moreover, colonic inflammation such as that found in ulcerative colitis or Crohn’s disease, facilitates colorectal cancer [49]. Inflammatory response can facilitate tumour growth both in a direct and in a indirect way. Indirectly: inflammation is a strong response of immune system against a pathogen and it generates cellular and metabolic processes that bring to the production of free radicals and consequently they can bring to DNA damage. For this reason, inflammatory response has to have a fine control in the way that the damages do not exceed the benefits. Directly: inflammatory cells release factors that facilitate tumour maintenance. In particular, inflammatory cells regulate angiogenesis by angiogenic and angiostatic factors and matrix remodelling by metalloproteases and lytic enzymes.
1.4.1. The role of macrophages
Tumour is an heterogeneous mix of different cell types. It is composed by malignant cells, but also by many resident cell types, such as adipocytes and fibroblasts, and by migratory haematopoietic cells, most notably macrophages, neutrophils and mast cells which are the cells involved in innate immune response. Immune cells perform a protective role but also they can have a pro-tumour function. In fact macrophages are recruited to tumours by growth factors and chemokines which are produced by the tumour cells themselves. Clinical studies have shown a correlation between presence of macrophages and poor prognosis, in particular for breast, prostate, ovarian and cervical cancers [49]. Macrophages originate from circulating monocytes which leave the blood flow to migrate in tissues (Fig.15). Macrophages are localized in the connective tissue in association with gastro-intestinal tract, in the lungs, along blood vessels in the liver

28
(where they are called kupffer cells) and in the spleen. The main role of macrophages is the phagocytosis of the pathogen. In fact they are the first cells that meet pathogens in the tissues. Macrophages recognize pathogens through receptors present on the cellular surface. The binding between the receptor and the molecules of pathogens leads to the internalization of the pathogen. During phagocytosis, macrophages produce many toxic products that help to kill the phagocytated microorganism such as hydrogen peroxide (H2O2), superoxide anion (O2
-) and nitric oxide (NO) [50,51].
Fig.15 Hussein MR. Int J Exp Pathol. 2006;87:163-76.
Formation of macrophages. They originated from haemapoietic stem cells of
blood marrow. Monocytes from blood flow migrate in tissues where then formed
macrophages.

29
The interaction between pathogen’s antigens and macrophage’s receptors actives macrophages and differentiates them in two subpopulations:
- macrophages of type 1 (M1); - macrophages of type 2 (M2) or tumour associated macrophages (TAM).
The activation of the two types of macrophages is regulated by a different expression of molecules such cytokines and chemokines. Polarized macrophages (M1 and M2) differ in terms of receptor expression, effector function and cytokine and chemokine production as it is possible to see in fig 16. [52].
Fig.16 Mantovani A et al. TRENDS in Immunology.2002;23:549-555.
Different produced molecules by macrophage of type 1 or type 2.

30
Macrophages of type 1 are the responsible of the response against a pathogen through the phagocytosis and the production of toxic products, in fact they show a pro-inflammatory phenotype. Successively, macrophages of type 2 take part in the interruption of the response of M1. In particular, they “clean” the areas from debris, repair and reconstructed the tissue which has been damaged by M1 action. Tumour cells exploit the capabilities of macrophages of promoting angiogenesis, tissue remodelling and proliferation to growth and progress. Tumour cells release chemotactic factors which facilitates the migration of macrophages of type 2 or TAMs, including Macrophages Colony Stimulating Factor (M-CSF) and chemokines such as MCP-1/CCL2, Macrophages Inflammatory Protein/CC Ligand (MIP-1α/CCL3; MIP-1β/CCL4; RANTES/CCL5; MCP-2/CCL8) and interleukins 6 (IL-6) (Fig.17) [49].
Fig.17 Pollard JW. Nature Reviews Cancer.2004;4:71-78. Pro- and anti-tumorigenic properties of macrophages depend on the cytokine
microenvironment in the tumour. Soluble CSF-1promotes trophic macrophages and together with interleukin-6 (IL-6) blocks dendritic cells maturation. In
contrast cell surface CSF-1 activates cytotoxic macrophages.

31
TAMs produce many factors that help tumour growth, invasion, angiogenesis and the deposition/dissolution of connective tissue. TAMs express many factors that stimulate tumour proliferation including Epidermal Growth Factor (EGF), Platelet Derived Growth Factor (PDGF), Transforming Growth Factor (TGF-β), Hepatocytes Growth Factor (HGF) and basic Fibroblast Growth Factor (bFGF). Angiogenesis is influence by the release of Vascular Endothelial Growth Factor (VEGF) and a number of potent proangiogenic cytokines such as TNF-α (Tumour Necrosis Factor alpha), IL-8 and IL-1 which, through cyclooxygenase 2 (COX-2), upregulate HIF-1, resulting in an increase in the transcription of VEGF. TAMs also release NO through the induction of the enzyme inducible NO synthase (iNOS). Finally, tumour associated macrophages facilitate tumour invasion through the production of enzymes and inhibitors that regulate the digestion of the extracellular matrix including matrix metalloproteases (MMPs), plasmin, urokinase-type plasminogen activator (uPA) and the uPA receptor (uPAR) [49,52] (Fig.18).
1.4.1.1 Depletion of macrophages: clodronate Selective in-vivo depletion of macrophages is a widely accepted approach to study functions and effects of these cells in biological processes. One of the most diffused methods for eliminating macrophages is the liposomes-mediated intraphagocytic delivery of drugs belonging to the class of bisphosphonates [53].
Fig.18 Mantovani A et al. TRENDS in Immunology.2002;23:549-555. Role of tumour associated macrophages (TAMs) in the immunobiology of the
tumour.
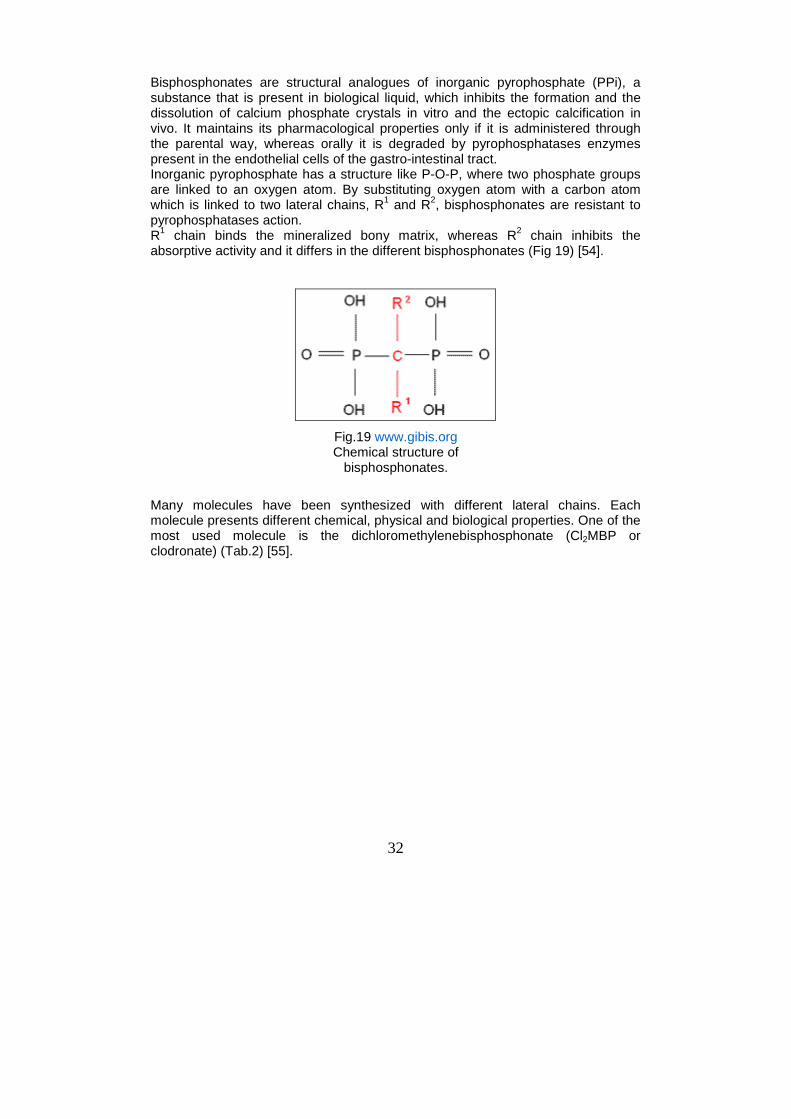
32
Bisphosphonates are structural analogues of inorganic pyrophosphate (PPi), a substance that is present in biological liquid, which inhibits the formation and the dissolution of calcium phosphate crystals in vitro and the ectopic calcification in vivo. It maintains its pharmacological properties only if it is administered through the parental way, whereas orally it is degraded by pyrophosphatases enzymes present in the endothelial cells of the gastro-intestinal tract. Inorganic pyrophosphate has a structure like P-O-P, where two phosphate groups are linked to an oxygen atom. By substituting oxygen atom with a carbon atom which is linked to two lateral chains, R1 and R2, bisphosphonates are resistant to pyrophosphatases action. R1 chain binds the mineralized bony matrix, whereas R2 chain inhibits the absorptive activity and it differs in the different bisphosphonates (Fig 19) [54].
Many molecules have been synthesized with different lateral chains. Each molecule presents different chemical, physical and biological properties. One of the most used molecule is the dichloromethylenebisphosphonate (Cl2MBP or clodronate) (Tab.2) [55].
Fig.19 www.gibis.org Chemical structure of
bisphosphonates.

33
The mechanism of action of bisphosphonates is not completely understood. Anyway, the principal target is the osteoclast. The osteoclast is a multinucleus cell, that originates from monocyte line. It is involved in the remodelling of bone matrix and in the homeostasis of phosphorus and calcium destroying hydroxyapatite and inhibiting the absorption of matrix. The bisphosphonates cause morphological and functional alterations in osteoclasts including: loss of the brush border, decrease of the production of lactic acid, decrease of lysosomal enzymes and prostaglandynes, decrease of pyrophosphatases and acid phosphatises which are fundamental for phagocytic activity of osteoclast and loss of the function of elimination of intracellular protons. The idea is that bisphosphonates bind hydroxyapatite crystals in the areas where osteclast erodes the bone by forming holes. During the re-absorptive phase, osteoclast acidifies the bone matrix causing the dissolution of hydroxyapatite crystals and the free bisphosphonate can be ingested by the ostoclast. Consequently, it causes ostecoclast’s apoptosis. Bisphosphonates are clinically used for the treatment of osteoporosis, osteitis deformans (Paget's disease of the bone), bone metastasis (with or without hyper calcemia), multiple myeloma. In consideration of the onto-genetically relationship between osteoclasts and macrophages, bisphosphonates are proposed as elective drugs for acting on macrophages. In addition, an important limit of liposomes, a drug-delivery system, has been exploited to target drugs to macrophages. Liposomes are one of the most versatile and promising drug-delivery system but they are easily phagocytised by macrophages before reaching target organ.
Tab.2 en.wikipedia.org Summary table of different bisphosphonate
compounds.

34
Liposomes are artificially prepared lipid spheres, consisting of concentric phopsholipids bilayers, separated by aqueous compartments. They are prepared dispersing phospholipids in an aqueous solution in which drugs, such as bisphosphonates molecules, have been dissolved. During the formation of lipid bilayers, drug molecules are encapsulated (fig.20) [56].
The number of concentric phospholipids bilayers (unilamemmalr or multilamellar), the phospholipid composition and the charge of liposomes can be varied: this positively or negatively influences the predisposition of macrophages to phagocytose liposomes (for example, macrophages internalize with higher efficiency negatively charged liposomes) [57]. The exact mechanism that induces macrophages elimination is not completely understood. Liposomes are ingested by macrophages and targeted to the phagocytic/endocytic pathway; after the fusion with lysosomes, the lipid bilayers of the liposomes are disrupted by phospholipases and the bisphosphonate drug released into the cell (Fig.21) [53]. The high intracellular concentration of drug alters cellular metabolism, possibly by modulation of intracellular iron [58] or through a direct effect on the ATP cellular metabolism [59]. Macrophages die via both caspases dependent and independent mechanisms.
Fig.20 www.nanolifenutra.com Example of liposomes structure.

35
In the thesis’s work we used clodronate encapulated in liposomes, referred as Clodro-Lip, as therapy to kill macrophages. About 1% of dissolved clodronate appears to be encapsulated in liposomes and the final preparation usually contains around 5mg of clodronate/ ml of suspension.
For experiments with laboratory animals, Clodro-Lip are administered through different routes, on the basis of what specific populations of macrophages researchers want to study. Frequently, and also in our case, Clodro-lip is administered via the intraperitoneal route.
1.4.2. [18F]FDG-PET and inflammation
[18F]Fluorine-2-deoxy-D-glucose is the most used radiotracer in oncology. It is used to diagnose recurrent lesions and to monitor and follow therapy response. Since inflammatory cells are characterized by high glucose uptake, the accumulation of [18F]FDG in non-neoplastic cells that infiltrate the neoplasm represents a potential confounder, particularly in the peritoneal environment [60,61]. Yamada and colleagues studied the distribution of [18F]FDG in a rat model of inflammation induced by subcutaneously injection of turpentine oil. The maximum
Fig.21 van Rooijen N et al. TibTech.1997;15:178-185. Mechanism of action of Clodro-Lip.1) Clodro-Lip is ingested by macrofage; 2)
the vaculum fuses with lysosomes; 3) the lipid bylayers is disrupted and 4) clodronate is released in the cell. L= lysosomes; arrowheads= phospholypases.

36
uptake of [18F]FDG was observed one hour after injection of radiopharmaceutical. In addition, in the longitudinal study, authors observed an increase of [18F]FDG uptake during time until to reach the peak level 4 days after inoculation. The highest uptake was found in the external zone of abscess where endothelial cells, fibroblasts and macrophages were present [61]. However, the performance of [18F]FDG-PET in infections is still not fully elucidated. Different approaches to investigate the relative role of tumour associated inflammatory cells have been proposed. Zhuang et al. investigated a dual time imaging method to differentiate malignant to benign lesions both in in vitro studies using different tumour cell lines and also in vivo in a rat model inoculated with rat malignant mesothelioma cell line. Successively, patients who had dual time [18F]FDG-PET scan were retrospectively analyzed. In animal models, the uptake of malignant lesions increased over time, instead benign lesion slightly decreased. In clinical studies, the SUVs of delayed images from malignant lesions in comparison with those of earlier scans increased over time. The SUVs of benign lesions decreased during time whereas the SUVs of inflammatory lesions caused by radiation therapy remained stable over time. In another work, [18F]FDG uptake after chemotherapy was evaluated using human B-lymphoblast cell line Daudi inoculated in SCID mice in presence or absence of corticosteroids. Inflammatory response in corticosteroids treated group was present but less pronounced and earlier [62,63]. In this thesis, we decided to evaluated the uptake of [18F]FDG before or after depletion of phagocytes by means of clodronate encapsulated into liposomes, a drug able to kill activated macrophages [64,65].
1.4.3. Structure and function of peritoneum
The peritoneum is a large serous membrane, it extends for 2 m2 occupying a surface equivalent to that of skin, lining the abdominal cavity and covers various solid organs including liver, spleen, stomach, the first portion of duodenum, small intestine, cecum, sigmoid colon and, in females, uterus, fallopian tubes and ovaries. In the male it forms a closed sac whereas in the female it communicates with exterior through the uterine tubes, the uterus and the vagina. These organs are connected each other and with the abdominal wall through connective structures (ligaments, folds, mesenteries). Peritoneum is divided in two ligaments: the lesser omentum and the greater omentum. The lesser omentum is the double layer of peritoneum that extends from the liver to the lesser curvature of the stomach and the start of the duodenum. The greater omentum is the double layer that extends from the stomach to the posterior abdominal wall after associating with the transverse colon (Fig.22) [66]. It is made up of two serous layer: the parietal layer (outer layer), lining the abdominal wall and the visceral layer (inner layer), which tightly envelops the abdominal organs. The peritoneum is made up of a layer of flattened mesothelial cells of mesenchymal origin, resting on a continuous basement membrane supported by submesothelium. This layer is kept moist and smooth by a thin film of serous fluid, the peritoneal liquid.

37
The submesothelium layer consists of an extracellular matrix made up of different types of collagen, glycoproteins, glycosaminoglycans and proteoglycans. The subserous space is provided with vascular and lymphatic vessels. Embryological, these serous membranes arise from the mesoderm, as membranes present in the pleural and pericardial cavities.
The principal function of peritoneum is the protection of abdominal content but it performs many other functions as movements, absorption, dialysis, healing power and storage of fat. Protection: it contains phagocytic cells which protect from infections; lymphocytes provide both cellular and humoral response; greater omentum has the capability to move toward sites of infection and to seal them, preventing spread of infection. Movement: it permits peristalsis of stomach and intestine and abdominal movements during respiration. Absorption: the mesothelium acts as a semi-permeable membrane across which fluids and small molecules can pass. Thus, it can absorb fluid effusions from the peritoneal cavity. In addition, water and crystalloids are absorbed directly in the blood capillaries whereas colloids pass into lymphatics with the aid of phagocytes. The great absorptive power is due to its large surface area. Dialysis: metabolites as urea can be removed from the blood by artificial circulating fluid through the peritoneal cavity. Therapeutically, considerable amount of fluids can be administered through peritoneal cavity.
Fig.22 www.theodora.com/anatomy/the_abdomen.html. Horizontal disposition of the peritoneum in the upper part of
the abdomen.

38
Healing power : the mesothelial cells can transform themselves into fibroblasts, which promote healing and wound. They may also form adhesions causing obstruction in hollow organs. Storage of fat: peritoneum has the capability to store large amounts of fat.
1.4.4. Peritoneal liquid
The mesothelium can be considered as a semi-permeable membrane which ultrafiltrates plasma, giving rise to a liquid called peritoneal liquid. Moreover, mesothelial cells produce a surfactant that facilitates the sliding of abdominal viscera. The peritoneal liquid arises principally from plasma transudate, but also from macrophages secretion and ovarian exudates, tubal fluid and retrograde menstruation in women. The peritoneal liquid of normal individuals is characterized by low protein (lower than 3g/dl3) and cellular contents. There is always a residual amount of serous fluid in the peritoneum of approximately 50-100ml, but this volume widely varies. The peritoneal liquid circulates within the peritoneal cavity and it is absorbed in particular districts as diaphragm, pelvis and the big epiploon. The motility is regulated by gravity, bowels peristalsis and respiratory motion.
1.4.5. Peritoneal carcinosis
The peritoneum is exposed to a variety of threats, including infections, injuries (mechanical or induced by surgery procedures) and neoplastic formations. Peritoneal infections may be: localized, with abscess formation i.e. areas of swollen tissue colonized by neutrophils recognized and responding to bacteria; or generalized like peritonitis. The peritoneum consistently responds to infectious with oedema, inflammation, fibroblastic exudates resulting in adhesions between the peritoneal surfaces [67]. Injury of the peritoneum can be generated by surgical procedure, inflammatory responses or ischemic events. In all of these conditions, mesothelial cells are damaged and their lining disrupted, leaving an exposed area of submesothelium [68]. This situation causes an inflammatory reparative response with leukocyte infiltration, cytokine production and enhanced proliferation rate of mesothelial cells. Mesothelial hyperplasia is principally a consequence of the increased level of growth factors and cytokines produced in the inflamed environment [69]. Peritoneal carcinosis comprises both primary neoplasms, generated from peritoneal tissue and peritoneal disseminations of cancer cells come from tumours of abdominal organs. The primary peritoneal cancers are subdivided in mesothelioma and lipomatous tumours. Mesothelioma arises from tissue of mesothelial origin (pleura, pericardium and peritoneum), often in association with asbestos exposure. Peritoneal involvement can occur as a single manifestation or coupled to involvement of the pleura. Associated conditions are calcification and ascites formation [70]. Lipomatous tumours only occasionally involve the peritoneum. They comprise benign lipomas, well-differentiated liposarcomas or high-grade liposarcomas and myxoid liposarcomas [71].

39
The peritoneal dissemination of cancer cells is the most common malignant process that involves peritoneum. Tumoral cells, which come from primary neoplasia of intra-abdominal organs, reach and pass visceral peritoneum accumulating in the peritoneal liquid. Through the peritoneal circulation, tumour cells reach the areas of high absorption rate where they can attach and growth with the crescent formation of tumoral masses. Progressively, these phenomena involve more districts diffusing carcinosis within all abdomen and causing the formation of neoplastic ascites. The neoplastic ascite is caused by an anomalous increase of peritoneal liquid, it reaches about 8-10 litres, where tumoral cells are present. This increase of peritoneal liquid depends on two factors:
- iperproduction of peritoneal liquid by peritoneal cells caused by the presence of tumoral cells;
- production of serum and mucina by tumoral cells. The formation of carcinosis and ascites lead to an increase of intra-abdominal pressure due to a compression of intra-abdominal viscera. Different to many malignant tumours, peritoneal carcinosis can remain localized in peritoneum without originating in metastases at distant sites for many months or years. The presence of peritoneal carcinosis represents a prognostic negative factors for life expectancy, in addition it also influences the quality of life. The main tumours that cause peritoneal carcinosis are:
- ovarian carcinoma; - colon carcinoma; - stomach carcinoma.
Ovarian carcinoma is the eight most common cancer and the fifth leading cause of cancer death among women in the United States. Ovarian carcinoma causes more death that any other cancer of the female reproductive system and the rate of mortality is about constant since 1982 [72]. Peritoneal carcinosis is present in almost 80% of ovarian cancer patients at the diagnosis because of the lack of specific initial symptoms and the lack of sensitive screening methods to detect early tumoral lesions.
1.4.5.1. Pathological changes in peritoneal liquid Pathological conditions induce profound changes in terms of activation and adaptation in the peritoneal microenvironment. In an experimental model of murine carcinosis, it has been demonstrated that the seeding of tumoral cells leads to the production of factors, including VEGF, that increase the permeability of peritoneal membrane with resulting fluid accumulation [73]. For example, IL-6, M-CSF and DC cells increase in ovarian cancer, macrophages in endometriosis and IL-10 in malignant tumours.
1.4.6. Diagnosis and monitoring of peritoneal cance r
Peritoneal carcinosis has been considered a difficult disease to treat with classical therapeutics and above all with a chirurgical approach.

40
Peritoneum is not considered such as an organ but like a layer which covers abdominal cavity and its organs. In recent years, the development of innovative chirurgical techniques has allowed to apply a chirurgical approach also to peritoneum cancer. Generally, peritoneal carcinosis is treated using systemic chemotherapy in association with chirurgical cytoreduction for reducing tumour mass and improving symptoms and the quality of life. The presence of peritoneal tumours is one the most significant prognostic indicators in ovarian cancer and in colorectal carcinoma. Early diagnosis of peritoneal tumours is important to assess cytoreduction. In the post-treatment setting, accurate monitoring is essential to plan the best therapy and to detect tumour recurrence. An early and effective diagnosis is hampered by the lack of sensitive screening methods to detect early tumoural lesions. Computed Tomography (CT), the actual gold standard for detection of peritoneal carcinomatosis, has a low sensitivity. In fact, various factors influences the sensitivity of CT, including size, site, morphology of tumour deposit, presence of ascites, paucity of intraabdominal fat, adequacy of bowel opacification, and concomitant use of peritoneography [74]. In addition peritoneal lavage and biopsy often present sample errors. MRI permits a good evaluation of parietal and visceral peritoneum covered by fluid, but MRI acquisition is long, influenced by artefacts of respiratory movements and its spatial resolution is low [75]. Molecular imaging and Positron Emission Tomography (PET)-based techniques in particular represent essential tools for neoplastic patient’s stratification and follow-up after treatment [76, 77] in many types of common tumours, including lymphoma, lung cancer, breast cancer, and colorectal cancer. In table 3, it is presented a summary of PET sensitivity and specificity compared to those of CT for several malignancies.

41
Tab.3 Margolis D et al. Radiology. 2007;245 :333-356.
Summary of PET sensitivity and specificity compared to those of CT for several malignancies.

42
[18F]2-fluoro-2-deoxy-D-glucose ([18F]FDG) in association with CT has been extensively used for staging and diagnosis of recurrent ovarian cancer [78] and for the detection of peritoneal carcinomatosis. Yoshida et al. suggested that [18F]FDG-PET/CT may improve surgical planning. Moreover, in their work, [18F]FDG-PET has been shown to predict response to neoadjuvant chemotherapy and survival in advanced ovarian cancer [78]. [18F]FDG-PET, in association with CT, is characterized by high sensitivity and high positive predict value. Turlakow and colleagues, in their study, evaluated the role of [18F]FDG-PET in detecting peritoneal carcinomatosis in patients with stomach, ovarian, and adrenal cancer and mesothelioma and to compare the results with CT scans in the same patient group. They observed that sensitivity and positive predict values increase using both modalities together until reaching 78% and 95% respectively [79].
1.4.7. Preclinical model of peritoneal carcinosis
Development of mouse models is very important to study and understand molecular and metabolic changes of a pathological disease and to test and monitor new therapeutic strategies. A good preclinical disease model should be more similar to the real disease or at least it should reproduce the main clinical features of human pathology. In this way, information and results obtained in preclinical studies may be translated in clinic more easily. In vivo studies of preclinical model of peritoneal carcinogenesis have been hampered by the inaccessibility of the peritoneal cavity using classic methods. The recent availability of dedicated small animal tomographs has enabled the longitudinal monitoring of lesions in preclinical settings [80,62]. So far, [18F]FDG-PET imaging for the monitoring of traditional or innovative therapy has been investigated in a limited number of studies particularly in case of peritoneal lesions [81-83]. Most preclinical studies have been conducted on xenograft models that rely on human ovarian cancer cells transferred into immuno-deficient mice [84]. Unfortunately these models do not fully reproduce the environment of peritoneal carcinomatosis, since mice that do not reject human cells lack, by definition, key components of the innate or acquired immune system [85, 82]. By the other hand, only few murine cell lines of ovarian cancer are available and none of them properly reproduced peritoneal lesions characterizing human disease because of its very low aggressiveness. For these reasons, in our study we established a mouse model based on the intraperitoneal injection of murine syngenic TS/A adenocarcinoma cells. This model reproduces the main clinical features of human neoplastic peritoneal lesions [86], including the presence of an abundant inflammatory infiltrate.

43
2. AIM
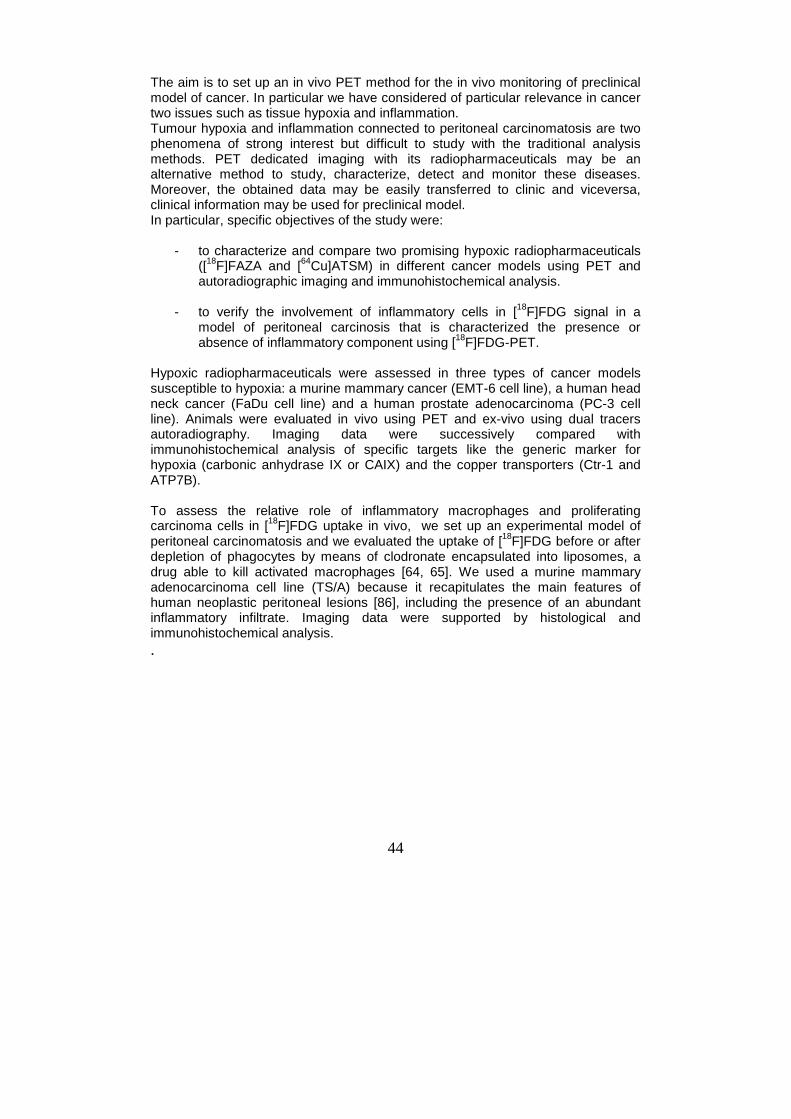
44
The aim is to set up an in vivo PET method for the in vivo monitoring of preclinical model of cancer. In particular we have considered of particular relevance in cancer two issues such as tissue hypoxia and inflammation. Tumour hypoxia and inflammation connected to peritoneal carcinomatosis are two phenomena of strong interest but difficult to study with the traditional analysis methods. PET dedicated imaging with its radiopharmaceuticals may be an alternative method to study, characterize, detect and monitor these diseases. Moreover, the obtained data may be easily transferred to clinic and viceversa, clinical information may be used for preclinical model. In particular, specific objectives of the study were:
- to characterize and compare two promising hypoxic radiopharmaceuticals ([18F]FAZA and [64Cu]ATSM) in different cancer models using PET and autoradiographic imaging and immunohistochemical analysis.
- to verify the involvement of inflammatory cells in [18F]FDG signal in a
model of peritoneal carcinosis that is characterized the presence or absence of inflammatory component using [18F]FDG-PET.
Hypoxic radiopharmaceuticals were assessed in three types of cancer models susceptible to hypoxia: a murine mammary cancer (EMT-6 cell line), a human head neck cancer (FaDu cell line) and a human prostate adenocarcinoma (PC-3 cell line). Animals were evaluated in vivo using PET and ex-vivo using dual tracers autoradiography. Imaging data were successively compared with immunohistochemical analysis of specific targets like the generic marker for hypoxia (carbonic anhydrase IX or CAIX) and the copper transporters (Ctr-1 and ATP7B). To assess the relative role of inflammatory macrophages and proliferating carcinoma cells in [18F]FDG uptake in vivo, we set up an experimental model of peritoneal carcinomatosis and we evaluated the uptake of [18F]FDG before or after depletion of phagocytes by means of clodronate encapsulated into liposomes, a drug able to kill activated macrophages [64, 65]. We used a murine mammary adenocarcinoma cell line (TS/A) because it recapitulates the main features of human neoplastic peritoneal lesions [86], including the presence of an abundant inflammatory infiltrate. Imaging data were supported by histological and immunohistochemical analysis. .

45
3. HYPOXIA MODEL

46
3.1. Materials and methods
3.1.1. Cellular lines
Murine mammary carcinoma cells (EMT-6), human prostate adenocarcinoma cells (PC-3) and human pharyngeal carcinoma cells (FaDu) were purchased by ATCC (American Type Colture Collection). Cell lines were routinely cultured at 37°C in a 5% CO2-humidified incubator. Cell lines were maintained on Complete Medium as followed: EMT-6 and PC3 on Waymouth’s Medium (Sigma Aldrich S.r.l.) and D-MEM medium (Sigma Aldrich) respectively with 10% heat-inactivated fetal calf serum (FBS) (Gibco-Invitrogen S.r.l), 100 units/ml penicillin and 100 mg/ml streptomycin, 2mM L-glutamine; FaDu on D-MEM Medium (Sigma Aldrich S.r.l.) with 10% heat inactivated FBS, 100 units/ml penicillin and 100 mg/ml streptomycin, 2mM L-glutamine and 1 mM sodium pyruvate.
3.1.2. Animal models
Cells (2 x 10⁶ cells) were injected subcutaneously in the right hind leg. EMT-6 were implanted into female BALB/c nu/nu mice and PC-3 and FaDu into male BALB/c nu/nu mice. The lesions were weekly monitored using a caliber. Animals were kept under specific pathogen-free conditions, handled and maintained according to our Institutional Animal Care and Use Committee ethical regulations. All animals were purchased by Charles River Laboratories.
3.1.3. Study design
Phase 1 : identification in a longitudinal study of the optimal window of tumour growth by in vivo PET evaluation of [18F]FDG and [18F]FAZA uptake at different times from cells inoculation. PET scan were performed weekly starting from a lesions size of 6 x 7 mm. Phase 2 : comparison of the intratumoural distribution of [18F]FAZA and [64Cu]ATSM using in vivo PET in the same animals. Phase 3 : comparison of the intratumoural distribution of [18F]FAZA and [64Cu]ATSM using ex vivo dual isotope autoradiography. Phase 4: immunohistochemical evaluation of hypoxia factors as carbonic anhydrase IX (CAIX) and Copper transporters as ATP7B (Copper exporter) and Ctr1 (Copper importer) in the same tumour sample analyzed using PET.
3.1.4. PET studies
[18F]FDG was synthesized according to European Pharmacopoeia V Edition and it was injected with a radiochemical purity greater than 99%. [18F]FAZA and [64Cu]ATSM were prepared as previously described [87,88]. For longitudinal studies, animals (n= 3 per each line) were injected in the tail vein with 4.19±0.2 MBq or 3.13±0.42 MBq of [18F]FDG or [18F]FAZA respectively. A hour after [18F]FDG injection or 2 hours after [18F]FAZA injection, mice were positioned on the PET bed and underwent a 30 minutes dynamic acquisition scan (6 scans of 5 minutes each) centred on the tumour. During acquisition animals were anaesthetized with gas anaesthesia (isoflurane/air 1.5:2). In the PET studies of phase 2, mice (n= 5 per each line) were injected intravenously with 4.66±0.88 or 3.87±1.03 MBq of [18F]FAZA or [64Cu]ATSM respectively. For [18F]FAZA we applied the same procedure previously described, for [64Cu]ATSM, animals were acquired at 2 hours and 24 hours after the injection.

47
To compare the intratumoural distribution of the two hypoxic radiotracers, PET acquisition were performed on the same mice as followed: at day 1 [18F]FAZA, at day 2 early [64Cu]ATSM and at day 3 late [64Cu]ATSM (fig.23).
3.1.5. PET images analysis
PET data were acquired in list mode using the full axial acceptance angle of the scanner (3D mode) and all images were then reconstructed by the expectation maximization (EM) algorithm [2]. Radioactivity concentration was corrected for physical decay and calibrated in order to transform counts per voxel values in MBq/ml. Radiotracers uptake was measured using Region of Interest (ROIs) analysis. A circular ROI (area=15mm2) was drawn on the tumour region of maximum uptake and another one was drawn on a muscle (area=7mm2) as background. Automatically, maximum, mean and minimum uptake values and standard deviation were generated. The radiopharmaceutical distribution was calculated as tumour to background ratio (T/B ratio) of the maximum uptake expressed as percentage of injected dose on tissue grams (%ID/g). After the analysis, animals were sacrificed and tumours were removed for histological analysis. Analysis were performed using PMOD 2.7 software (PMOD, Zurich, Switzerland).
3.1.6. Dual-tracer ex-vivo autoradiography
Thanks to the different half life of the two radioisotopes (18F t1/2=110 min; 64Cu t1/2=12.7 h), a dual-tracer autoradiography was possible. Mice (n= 1 per cell line) were co-injected intravenously with 2.66±0.05 MBq [18F]FAZA and 0.4±0.01 MBq [64Cu]ATSM so that we sacrificed mice 3 hours and 2 hours post-injection of [18F]FAZA and [64Cu]ATSM respectively. After the sacrifice, tumours were removed, covered with optimal cutting temperature (OCT) compound, frozen at -20°C and cut using a cryostat (Cryostat Leica, Wetzlar, Germany) into 60 micron thick slices. Slices were fixed in acetone for 4 minutes and then the slices were exposed on the imaging plate for 3 hours. Then they were scanned with a bioimaging analyzer system (Perkin Elmer, Waltham, Massachusetts, USA) to obtain the image of the sum of [18F]FAZA and [64Cu]ATSM. After F-18 decay, the slices were re-exposed on the imaging plate overnight to obtain the [64Cu]ATSM image. Image analysis were performed using Optiquant softwareTM (PerkinElmer, CT, USA): the images of Cu-64 were corrected
Days 15 16
PET
[18F]FAZA [64CU]ATSM early (2h p.i.)
[64CU]ATSM late (24h p.i.)
Immunohistochemistry
12
Fig.23 schematic representation of the study design
days from implantation

48
pixel per pixel for the isotope decay (t1/2= 762 min) and then subtracted to the image of the F-18 and Cu-64 sum scanned the day before. The slices adjacent to the cutting slices were used for the immunostaining. 3.1.7. Immunohistochemistry analysis
For the hematoxylin and eosin (H&E) staining, the standard protocol was followed. Briefly: hematoxylin (6 min), tap water to wash (20 min), acid alcohol to decolorize (1 sec), tap water to wash (5 minutes), Lithium Carbonate (3 sec), tap water to wash (5 min) and finally Eosin to counterstain (15 sec). For IHC with carbonic anhydrase IX (CAIX), Ctr-1 and ATP7B antibodies, the protocol was the follow: tissue samples were deparaffinized for 30’ and rehydrated to water in a downgraded series of ethanol. Then, they were flushed in water, heat-induced antigen retrieval was performed for 30 minutes at 97°C with tris EDTA. Then, the endogenous peroxidase activity was blocked for 5 minutes with 3% H2O2. After that, the sections were washed in Phosphate-buffered saline with BSA for 5 minutes and then incubated with the primary antibody as follows: CAIX (1:1500 over night, DBA Italia s.r.l., Italy), Ctr-1 (1:1000; ON, DBA Italia s.r.l., Italy), ATP7B (1:400; 1h, DBA Italia s.r.l., Italy). After washing, the tissue sections were incubated for 30 minutes with antirabbit secondary antibody (1:2) (Kit Rabbit Biocare). Successively, the samples were washed in PBS to block non-specific antibody binding and incubated for 5’ with DAB (3,3' diaminobenzidine tetrahydrochloride) chromogen (Dako). Finally, the tissue sections were counterstained with Mayer’s hematoxylin to visualize the signal. 3.2. Results
3.2.1. Comparison of intratumoural uptake of [ 18F]FDG and [ 18F]FAZA in a longitudinal in vivo PET study
Tumour growth was periodically monitored by caliper and volume calculated as follows: V = π/6 × D1 × D22 where D1 is the longer diameter and D2 is the shorter diameter [89]. EMT-6 tumours were significantly larger (p<0.05) than FaDu and PC-3 only at the end of the study (Fig.24).

49
Starting to 10 days after cell inoculation, mice weekly underwent to [18F]FDG and [18F]FAZA PET acquisitions. In Fig.25 it is possible to observe an increase of a central necrotic region where there is not uptake of radiotracers and that was maximum at PET3, in particular for EMT-6 and PC-3 tumours. During time, we noticed a progressive enlargement of [18F]FAZA uptake areas which only partially overlapped with [18F]FDG uptake areas. Moreover [18F]FDG uptake area was preferentially concentrated in the outer part of the tumour.
PET 1 PET 2 PET 3
[18F]FDG
[18F]FAZA
min max
0.0
0.2
0.4
0.6
0.8
1.0
1.2
0 2 4 6 8 10 12 14 16 18 20 22 24
time after cells inj (days)
Vol
ume
(cm
3 )EMT-6
FaDu
PC3PET 1
PET 2
PET 3
Fig.24 Tumour growth graph. At the end of the study EMT-6 tumours were significantly larger than FaDu and PC-3. PET1 acquisitions were performed at 9 and 10 days with [18F]FDG and [18F]FAZA respectively. PET2 acquisitions were performed at 16 and 17 days and PET 3 at 21 and 22 days from cell inoculation.
EMT-6

50
Fig.26 is an example of [18F]FAZA and [18F]FDG imaging fusion performed using PMOD software. In FaDu tumour model we observed a partial overlap of [18F]FAZA and [18F]FDG uptake areas. Hypoxic areas are localized in the inner part of the tumour.
PET 1 PET 2 PET 3
[18F]FDG
[18F]FAZA
min max
PET 1 PET 2 PET 3
[18F]FDG
[18F]FAZA
min max
Fig.25 Transaxial [18F]FAZA and [18F]FDG PET images of EMT-6 (top), FaDu (middle) and PC-3 (bottom) tumour model. Yellow
arrows indicate tumour. The other signal present in the images is bladder. Animals were positioned supine
FaDu
PC-3

51
Images were then quantified using a ROI analysis. [18F]FDG uptake was not significantly different in the three cell lines but it decreased significantly from the first to the last PET scan (p<0.05) performed at 3.5 weeks where we observed a wide necrotic area. In addition we observed a regional extension of hypoxic areas but we failed to observed any increment in absolute values of radiotracer concentration. Only in EMT-6 we observed a slightly but significant increase of [18F]FAZA uptake at PET2 in comparison to PET1 and PET3 (fig.27).
[18F]FDG
[18F]FAZA
FUSION
max
max
min
min
Fig.26 Transaxial [18F]FAZA (middle) and [18F]FDG (top) PET images and fusion (bottom) a FaDu tumour model. Animals were positioned
supine.

52
Histological analysis confirmed the presence of wide necrosis areas at 21 days after inoculation (Fig.28). Consequently basing on tumour size, presence of necrotic regions and tracers uptake, we choose 2.5 weeks as optimal time window for in vivo and ex vivo experiments.
0.0
1.0
2.0
3.0
4.0
5.0
6.0
7.0
1 2 3 PET
T/M
(%ID
/g /
%ID
/g)
EMT-6
FaDu
PC-3
0.0
1.0
2.0
3.0
4.0
5.0
6.0
7.0
1 2 3 PET
T/M
(%ID
/g /
%ID
/g)
EMT-6
FaDu
PC-3
A
B
Fig.27 Radiopharmaceutical uptake was calculated as tumour to muscle ratio (T/M) of percentages of maximum of injected dose per tissue grams.
[18F]FDG uptake decreased during time in all three lines (A). [18F]FAZA uptake was lower than [18F]FDG but constant during time (B). Only in
EMT-6 [18F]FAZA tumour was significantly higher in PET2 than PET1 and 3.

53
3.2.2. Comparison of intratumoural uptake of [ 18F]FAZA and [64Cu]ATSM at early and late time in vivo by PET and e x-vivo by dual tracers autoradiography
Mice were inoculated with EMT-6, FaDu or PC-3 tumour cancer cells (n=6 for each cell line) in the hind right leg. Five mice per each cell line underwent to [18F]FAZA- and [64Cu]ATSM-PET as previously described in materials and methods. The remaining mice (n=1 per each cell line) were used for a dual tracers autoradiography. FaDu model confirmed the results obtained by O’Donoghue et al.: there were not temporal changes in [64Cu]ATSM uptake which was very similar to that of [18F]FAZA [47]. In addition, dual tracers autoradiography performed at early time confirmed PET data. The tumours were big and in the central part there was absence of uptake because of necrosis (Fig.29).
EMT-6
FaDu
PC-3
5x
5x
5x
20x
20x
20x
Fig.28 Results of histological analysis. The tumours were excised at the end of the last PET analysis. In all three tumours,
it was possible to observe a wide necrosis area.

54
For EMT-6 and PC-3 animals, [64Cu]ATSM images acquired at 24 hrs. were similar to those observed after [18F]FAZA administration. In the 2 h images, [64Cu]ATSM distribution was more homogenous and diffused whereas in the 24 h images [64Cu]ATSM accumulated in the outer areas of the tumour. Using autoradiography we confirmed results PET at early time. [64Cu]ATSM tumour uptake was more diffused in all tumour areas, in particular in PC-3 model that was smaller and less necrotic (fig.30 and 31).
[18F]FAZA
[64Cu]ATSM 2h
[64Cu]ATSM 24h
T/M = 1.8
T/M = 3.0
T/M = 2.3
PET
[18F]FAZA
[64Cu]ATSM 2h
Inner Medium External
Autoradiography
0.2 µCi/cc 15.0 µCi/cc
H&E Staining
Fig.29 PET, dual tracer autoradiography and Hematoxil&Eosin staining results of FaDu model. For PET images, it is possible to observe transaxial (on the left)
and sagittal (on the right) view of the tumour. Tumour uptake of both radiotracers is similar. In central part there was not uptake because of necrosis.
Similar uptake of [18F]FAZA and [64Cu]ATSM at early time was also observed using autoradiography. At PET, animals were positioned prone.

55
[18F]FDG
[18F]FAZA
[64Cu]ATSM 2h
[64Cu]ATSM 24h
T/M = 2.2
T/M = 2.2
T/M = 4.7
T/M = 3.3
PET
[18F]FAZA
[64Cu]ATSM 2h
Inner Medium External
Autoradiography
H&E Staining
0.2 µCi/cc 15.0 µCi/cc
[18F]FAZA
[64Cu]ATSM 2h
[64Cu]ATSM 24h
0.2 µCi/cc 15.0 µCi/cc
T/M = 4.1
T/M = 2.9
T/M = 2.5
External
[18F]FAZA
Inner
Autoradiography
Medium
[64Cu]ATSM 2h
H&E PET
Fig.30 PET, dual tracer autoradiography and Hematoxylin&Eosin staining results of EMT-6 model. For PET images, it is possible to observe transaxial (on the left)
and sagittal (on the right) view of the tumour. During time, it was possible to observe changes in [64Cu]ATSM uptake. 24 hours [64Cu]ATSM images is more similar to that of [18F]FAZA. In addition, in autoradiography we observed a more
diffuse [64Cu]ATSM uptake at 2 hours within tumour. At PET, animals were positioned prone
Fig.31 PET, dual tracer autoradiography and Hematoxylin&Eosin staining results of PC-3 model. For PET images, it is possible to observe transaxial (on the left)
and sagittal (on the right) view of the tumour. During time, it was possible to observe changes in [64Cu]ATSM uptake. 24 hours [64Cu]ATSM images is more similar to that of [18F]FAZA. In addition, in autoradiography we observed a more
diffuse [64Cu]ATSM uptake at 2 hours within tumour. At PET, animals were positioned prone

56
3.2.3. Immunohistochemistry analysis
After sacrifice, tumours were excised and general marker for hypoxia, carbonic anhydrase IX (CAIX), Copper transporters (ATP7B and Ctr-1) were evaluated. In all three types of tumours, carbonic anhydrase IX stained tumour areas near necrosis zones. Ctr1 and ATP7B, stained different tumour areas in these cell lines. In EMT-6 the two markers were positive in the same peripheral areas, that corresponded also to CAIX positive areas. In FaDu cell lines, Ctr1 staining was localized in the same areas of CAIX, while ATP7B displayed a pattern characterized by a decreasing gradient from periphery to necrotic areas. In PC-3 tumour, the expression of Ctr1 and ATP7B was more homogenous (Fig.32).
At higher magnification, ATP7B staining was positive for blood vessels in all cell lines but cellular localization was different in the three tumours: in EMT-6 and FaDu it stained cell cytoplasm whereas in PC-3 we observed a cell membrane expression (Fig.33A). Ctr1 staining resulted particularly positive for blood vessels only in PC-3 cells while (Fig.33B).
CA IX CTR1 ATP7B
1x
1x 1x
1x
1x
1x 1x 1x
1x
FaDu
EMT-6
PC-3
Fig.32 Immunohistochemistry of FaDu, EMT-6 and PC-3 tumours.

57
3.3. Discussion
In these studies we tried to compare, in vivo using PET, the distribution of the metabolic tracer [18F]FDG and the distribution of the hypoxic tracer [18F]FAZA. In addition, to better understand hypoxia ligand distribution mechanism, we compared both in vivo and ex vivo the kinetic of regional distribution of specific radiotracers [64Cu]ATSM and [18F]FAZA. In the longitudinal study, we noticed a decrease of maximum [18F]FDG uptake during time within all tumour whereas a constant maximum uptake of [18F]FAZA, associated to a more extended positive area respect to that of [18F]FDG. In addition, we observed that [18F]FDG and [18F]FAZA displayed a different pattern of distribution within the tumour mass because the first ligand preferentially was located in the external part of tumour while the second displayed a more uniform distribution, with areas of partial overlapping. In the regions of mixed uptake we supposed that the hypoxia condition promoted an over-expression of glycolytic markers that increased [18F]FDG uptake. On the contrary as explained by Obata et al. and Tanaka et al. [44,45], regions where there was only [18F]FDG uptake may be characterized by a high density of microvessels which increased O2 supply and cell proliferation. Hematoxylin & eosin staining confirmed that the areas, where ligands uptake were not present, were necrotic, but for PET we didn’t determine with IHC tumoural markers to confirm our hypothesis. In the further study of in vivo [18F]FAZA and [64Cu]ATSM comparison we observed that this latter displayed a kinetic of distribution similar to that of [18F]FAZA at 24 hrs after injection for EMT-6 and PC-3 cells but not at 2 hrs. This time-dependent kinetics was not present in FaDu lesions, where early and later times images of [64Cu]ATSM were similar to that of [18F]FAZA. We observed that generally distribution of both tracers was overlapped in the outer region of the tumour mass whereas in the inner areas [64Cu]ATSM uptake was higher. Results obtained in vivo by PET were confirmed using autoradiography by co-injecting in the same mouse the two tracers to detect 2 h post-injection hypoxia with [18F]FAZA and [64Cu]ATSM. We didn’t compare [18F]FAZA and [64Cu]ATSM later time distribution. Accordingly, for a more complete analysis, experiments will be repeated evaluating Cu-64 distribution 24 hours after the injection. A time-dependent distribution was previously described by O’Donoghue et al. [47] in rats injected with prostate cancer cells R3327-AT but, as observed also in our study, not in animals injected with
A B
40x FaDu 40x EMT-6 40x PC-3 40x PC-3
Blood vessels
Fig.33 Immunohistochemistry of FaDu, EMT-6 and PC-3 tumours at higher magnification. A) In all three tumours ATP7B staining was positive for blood
vessels. In FaDu and EMT-6, it stained cell cytoplasm, instead in PC-3 tumour, it stained cell membrane. B) Only in PC-3, Ctr-1 stained blood
vessels.

58
FaDu cells. The regional [64Cu]ATSM uptake, metabolism and exit are controlled by a complex system of transporters and enzymes which can influence its uptake. In immunohistochemical analysis, we observed that the generic marker for hypoxia, carbonic anhydrase IX (CAIX), stained the tumoural area resulted positive with [64Cu]ATSM in all three cell lines. The staining with CAIX was characterized by spotted pattern with higher intensity in necrotic surrounding areas. The markers for copper transporters, Ctr1 and ATP7B, stained different tumour areas in these cell lines. In EMT-6 the two markers were positive in the same peripheral areas, that corresponded also to CAIX and [64Cu]ATSM-PET positive areas. In FaDu cell lines, Ctr1 staining was localized in the same areas of CAIX (corresponding to [64Cu]ATSM-PET positive areas), while ATP7B displayed a pattern characterized by a decreasing gradient from periphery to necrotic areas. In PC-3 cells, Ctr1 and ATP7B staining were more diffused within tumour as observed with CAIX and [64Cu]ATSM-PET. At higher magnification, Ctr1 staining resulted particularly positive for blood vessels only in PC-3 cells while ATP7B staining was positive for blood vessels in all cell lines. In addition, ATP7B cellular localization was different in the three tumours: in EMT-6 and FaDu it stained cell cytoplasm whereas in PC-3 we observed a cell membrane expression. Consequently to these results, the only localization of copper pumps can not explain per se the different time-dependent behaviour of [64Cu]ATSM in the three cell lines. Other factors like delivery dependence of the high lipophilic [64Cu]ATSM may be involved in the cell type kinetics of this tracer and also specific cellular characteristics as red-ox potential or intra- and extra-cellular pH may influence [64Cu]ATSM uptake. In a recent work, Holland et al. suggested that hypoxia-selective uptake of [64Cu]ATSM may reside in the stability of the copper (I) anion with respect to protonation and ligand dissociation. Moreover, their study supported the idea of an involvement of NADH-dependent enzyme in the reduction of the copper (II) complexes [111]. Then, despite its high imaging potential, more issue will be cleared regarding the mechanism of [64Cu]ATSM binding. In contrast, [18F]FAZA behaviour was well established but in comparison to [64Cu]ATSM it displayed a lower tumour to noise ratio. Preliminary clinical studies in both non–small-cell lung cancer and cancer of the cervix have suggested that [60Cu]ATSM uptake was predictive of response to chemo-radiotherapy [40,41] and the use [64Cu]ATSM allows high-quality image [46] In conclusion, the use of hypoxic radiopharmaceuticals in association with the use of positron emission tomography is a very interesting technique and promising to localize and monitor tumour hypoxia. This method may be used for planning the most appropriate therapy and to monitor the response. Nevertheless, they need to further studies to understand the different kinetic and behaviour, in particular of [64Cu]ATSM, in relationship to the different tumour types. In fact, a limitation of this method is represented by the lack of complete information about the real molecular characteristic of tumour, like as protein expression during the different stages of tumoural growth. An important thing is the characterization and identification of the proteomic pattern of normal tumour and hypoxic tumour by correlating it with the metabolic changes which can be monitored using PET. In this way it may be possible to understand what proteins are present (in particular HIF-1α, PI3K and other proteins connected with hypoxia and tumour growth) and in what moment of the tumour progression for identifying new possible therapeutic strategies.

59
4. INFLAMMATION MODEL

60
4.1. Materials and methods
4.1.1. Mice Balb/C female mice (6-7 weeks of age) were purchased from Charles River. Animals were kept under specific pathogen-free conditions, handled and maintained according to our Institutional Animal Care and Use Committee ethical regulations. At the end of experiments, animals were sacrificed by CO2 inhalation.
4.1.2. Cells and tumour analysis
TS/A is murine spontaneous adenocarcinoma originated in Balb/C mice [86]. Cells were grown in RPMI (Gibco BRL, Grand Island, NY) containing 10% FBS (South American Origin, BioWhittaker-Lonza, B-4800Verviers, Belgium), 2 mM glutamine, 100 IU/ml penicillin, 100g/ml streptomycin (Gibco BRL, Grand Island, NY). Cells were routinely tested for Mycoplasma by MycoAlert Mycoplasma detection kit (BioWhittaker-Lonza, B-4800Verviers, Belgium). Tumour lesions were micro-dissected and either processed for immunohistochemistry (see below) or, when indicated, dehydrated in order to associate the net weight to neoplastic load.
4.1.3. Study design
Balb/C mice were intraperitoneally implanted with TS/A adenocarcinoma cells (4 x 10⁵ cells/mouse). The dose represents the minimum tumour dose that elicited the growth of neoplastic lesions in 100% of animals, as determined in preliminary experiments. First, we performed a model setting study (n=4) to evaluate the feasibility of [18F]FDG-PET to monitor onset and progression of peritoneal carcinomatosis, then a longitudinal study (n=12) to evaluate disease progression in macrophages competent or depleted mice and finally a single point studies (n=20) focusing obtained data. In the model setting study, [18F]FDG-PET was performed at 4 and 10 days after TS/A adenocarcinoma cells inoculation; the day after the last PET acquisition animals were sacrificed for histological analysis. For the longitudinal and the single point studies, mice were divided in two groups and treated intraperitoneally with dichloromethylenebisphosphonic acid (clodronate; 1mg clodronate/20mg body weight in 200µl of suspension) in order to deplete macrophages or PBS encapsulated into liposomes (“Clodrolip” and “Shamlip”, respectively), prepared as described [64] and purchased from clodronateliposomes.org. Treatments were administered 6 hours after TS/A adenocarcinoma cells injection and consistently (at day 2, 5, 8 and 11 after TS/A adenocarcinoma cells inoculation) until the end of study (Fig.34). In the longitudinal study mice were evaluated using [18F]FDG-PET at 5, 7, 9, 12 days after cell inoculation and sacrificed the day after the last PET acquisition. Additional groups of mice (single point study) were evaluated using PET at 7 or 12 days and sacrificed at 8 and 13 days after TS/A adenocarcinoma cells inoculation respectively (Fig.34). At the moment of necropsy, one mouse per cohort was used for immunohistochemical analysis; the rest of the mice were used for the assessment of lesion weight (longitudinal and single point studies).

61
4.1.4. PET studies
[18F]FDG is routinely prepared in our facility for clinical use (European Pharmacopeia V ed.) and it was injected with a radiochemical purity greater than 99%. In vivo imaging studies were performed using a small animal tomograph, the YAP-(S)-PET II (I.S.E. s.r.l., Pisa, Italy). After a slight anesthesia with ether animals were injected in a tail vein with 4.3 ± 0.3 MBq of [18F]FDG dissolved in 50 µl of saline. Immediately before PET acquisition, mice were anesthetized with isoflurane (isoflurane/air 1:1) and positioned prone on the tomograph bed with the abdomen centered in the tomograph field of view. PET scans started 60 min after tracer injection and lasted for 30 min (six frames of five min each). PET data were acquired in list mode using the full axial acceptance angle of the scanner (3D mode) and then reconstructed with the expectation maximization (EM) algorithm [2].
4.1.5. Image analysis To verify the feasibility of [18F]FDG-PET to monitor the growth and diffusion of peritoneal carcinomatosis and the effect of macrophages depletion on tracer uptake, a visual inspection analysis was applied to PET images. Adjacent transaxial [18F]FDG positive slices, depending on the presence of abnormal areas of radioactivity accumulation, were selected. Images were also quantified using ImageJ [90] and MatLab (MathWorks Inc, Natick; MA) software to obtain the following parameters: - max [18F]FDG uptake in lesions expressed as percentage of injected dose per gram of tissue (max %ID/g); - mean [18F]FDG uptake in lesions expressed as percentage of injected dose per gram of tissue (mean %ID/g); - extension of [18F]FDG uptake areas expressed as tumour volume (cm3). To this aim, PET images were calibrated to transform count per voxel values in MBq/g and corrected for 18F half-life (108.9 min). Volumes of radioactivity accumulation were automatically extracted (mask) using ImageJ software after the definition of threshold values according to the procedure described below. In order to automatically extract lesion from background radioactivity or non specific uptake present in urinary bladder an upper and lower threshold values were selected from each mouse PET study. Upper values were identified by centring a circular region of interest (ROI, mean area=11 mm2) on the maximum value of radioactivity uptake present in the abdominal region. Upper values were selected in order to avoid urinary bladder uptake that is higher than that present in lesions. Lower values were then defined as the double value of radioactivity concentration measured by
1 day
Cells inoculation
PET PET Sacrifice
0 day 13 days
PET PET
Treatment administration Single point study PET
Fig.34 Schematic representation of the study design

62
drawing a circular ROI (mean area=7 mm2) on a thorax muscle. The use of thorax muscle instead of abdominal background was previously set up and validated in a group of normal mice. This procedure was validated also in normal mice in order to verify that thresholded maps extracted using this methods did not include gastrointestinal activity. Using the thresholds above, lesions masks were automatically extracted for each PET study using MatLab software. Mean, maximum uptake (± SD) of radioactivity concentration expressed in MBq/g and the number of voxels with radioactivity values included in the identified threshold range were automatically calculated. Finally radioactivity concentration values were transformed into percentage of injected dose per gram of tissue (%ID/g) and number of voxel was multiplied by voxel volume (1 voxel=0.00015 cm3). Quantification analysis was performed by pooling together animals of longitudinal study and single point studies.
4.1.6. Histological analysis After sacrifice, tumour lesions were dissected, fixed in 4% PFA, cryopreserved in liquid N2 cooled isopentane and embedded in OCT (Killik, Bio-Optica). Serial 6 µm thick sections were treated with 0.3% H2O2 to quench endogenous peroxidase activity. To evaluate leukocyte infiltration, tissue sections were incubated in PBS + 4%BSA (SIGMA) + 0.1% Triton (BDH) and then with biotinilated anti-mouse/LCA (Leukocyte Common Antigen) CD45.2 mAb (clone 104, BD Pharmingen); signals were revealed with R.T.U horseradish peroxidase streptavidin (Vector Laboratories, Burlingame, CA), which was detected using Vector NovaRED substrate kit (Vector Laboratories, Burlingame, CA). Slides were counterstained with Mayer’s hematoxylin and examined under a Nikon Eclipse 55i microscope (Nikon, Tokyo, Japan). Images were captured with Digital Sight DS-5 M digital camera (Nikon) using Lucia G software (Laboratory Imaging, Prague, CZ). Parallel slides in which the primary mAb had been omitted were identically processed and used as negative controls. Stained sections were examined by three independent operators blinded to experimental design.
4.1.7. Viability and apoptosis in vitro assays TS/A adenocarcinoma cells were challenged with increasing amounts of liposomes containing or not clodronate (5, 10, 20 and 40 µl of Clodrolip or Shamlip suspensions/ml). 16 hours after supernatants were retrieved and frozen and cells were harvested. Apoptotic cells were identified by flow cytometry using the Annexin V-FITC Apoptosis Detection Kit (Immunostep Research, Valter Occhiena) according to the manufacturer’s instructions. Cytometric analysis was performed using a FACS Calibur (Becton Dickinson) and the Cell Quest Software. Data were analyzed with FCS Express Software. In parallel, the concentration of lactate dehydrogenase (LDH) in the supernatants was verified using the CytoTox-ONETM Homogeneous Membrane Integrity Assay (Promega). Analysis was performed by a Victor3™ Wallac (1420 Multilabel Counter, Perkin Elmer), according to manufacturer’s instructions. As a positive control of necrosis, the supernatant of adenocarcinoma cells lysed in the presence of the Triton X100 non ionic detergent (1%) was used.

63
4.1.8. Statistical analysis Results are expressed as mean ± SD. Experimental differences were tested for statistical significance using Student’s t test (unpaired, two sided, p considered statistically significant when <0.05), by Graph Pad PRISM Software (version 4.0c for Macintosh by Software MacKiev). Correlation was calculated with Pearson test (two tailed, confidence interval 95%9) using Graph Pad PRISM Software (version 4.0c for Macintosh by Software MacKiev); linear regression was calculated using Graph Pad PRISM Software (version 4.0c for Macintosh by Software MacKiev).
4.2. Results
4.2.1. Experimental model of peritoneal carcinomato sis and [ 18F]FDG distribution To evaluate the feasibility of [18F]FDG PET to monitor onset and progression of peritoneal carcinomatosis, we set up a model of peritoneal carcinomatosis based on the intraperitoneal injection of syngenic murine TS/A adenocarcinoma cells in Balb/C female mice. TS/A adenocarcinoma is a spontaneous tumour cell line arisen in a Balb/C female retired breeder and expanded in vitro [86]. The model nicely recapitulates the histological features of the human disease: adenocarcinoma cells distributed along the cavity and yielded several three-dimensional masses attached to the peritoneal lining. In one week, animals developed masses with a microscopic architecture typical of adenocarcinoma lesions, with cribriform-like structures (Fig.35A), characterized by scant vascularization and huge macrophages infiltration. We initially verified whether this model was suitable for [18F]FDG PET study. To this aim we performed a model setting pilot study scanning mice at 4 and 10 days after TS/A adenocarcinoma cells injection. No evidence of disease was detectable at 4 days. At 10 days intense spots of [18F]FDG uptake inside the peritoneum were detectable in all animals. These areas corresponded to actual peritoneal neoplastic lesions, as verified at necropsy (Fig.35B).

64
4.2.2. Relative contribution of neoplastic cells an d tumour associated phagocytes to [ 18F]FDG uptake We then studied parallel cohorts of macrophage competent and depleted TS/A adenocarcinoma bearing mice. To this aim animals were treated with either Shamlip or Clodrolip according to the scheme of Fig.34. The efficiency of peritoneal macrophages depletion was assessed analyzing peritoneal cells by flow cytometry, and was routinely between 46,5 and 97,9%. Clodrolip had no direct cytotoxic effects on adenocarcinoma cells, as verified by the in vitro release of the necrosis enzyme LDH (Fig.36), and by the staining with labelled Annexin V, that reveals the exposure of anionic phospholipids on the outer plasma membrane, an early event in programmed cell death via apoptosis We monitored disease progression in macrophages competent or depleted animals by [18F]FDG PET at 5, 7, 9, 12 day after TS/A adenocarcinoma cells injection, in a longitudinal PET study (Fig.37A-D). Starting at 7 days after TS/A adenocarcinoma cells injection, neoplastic lesions of control mice displayed high uptake of [18F]FDG. Scattered positive spots of [18F]FDG rapidly increased in terms of intensity and extension thereafter, from day 9 to day 12 (Fig.37A). Macrophages were important for [18F]FDG accumulation and diffusion: in macrophages-depleted mice we failed to detect any relevant uptake at 7 and 9 days. Only at later time (12 days) some defined signals could be identified in macrophage-depleted mice (Fig.37C). In both cohorts of mice radioactivity corresponded to actual neoplastic lesions, as observed by necropsy (Fig.37B and D).
B
50
4 days 10 days 10 days
a
b
A
min max
Fig.35 Set up of peritoneal carcinomatosis experimental model. (A) Representative picture of haematoxylin and eosin staining of peritoneal TS/A
adenocarcinoma lesions: neoplastic three-dimensional lesions grew as independent masses attached to peritoneal linings or to abdominal organs like
pancreas (arrowhead). (B) [18F]FDG-PET scans of the abdomen of a representative mouse followed in the model setting study. Coronal view (a) of
the image reconstruction and axial slices (b) taken at the level of tumour location (dashed white line). Right panel shows a picture of the same mouse at
the moment of necropsy. Tumour masses are indicated by yellow arrows.

65
We analyzed by immunohistochemistry the presence and relative proportion of inflammatory cells infiltrating peritoneal adenocarcinoma lesions in mice at 7 (early effect) and 12 days (late effect) after TS/A adenocarcinoma cells injection (Fig.37E). The treatment with Clodrolip drastically reduced the inflammatory infiltrate both at early and late time points (Fig.37F). The same result was obtained at 7 days after TS/A adenocarcinoma cells injection: radioactivity distribution obtained from PET studies corresponded to the location of lesions observed during necropsy.
Mean (%)
SEM
NT 3,24 1,52
Shamlip 5 4,36 1,35
Shamlip 20 7,91 4,40
Clodrolip 5 10,04 2,16
Clodrolip 20 6,41 0,01
A
B C
FL2
-H
AnnexinV-FITC
NT ShamLip ClodroLip
Fig.36 Clodrolip does not affect TS/A viability in vitro. (A) Representative dot plots of AnnexinV+ TS/A incubated for 16 hours in vitro with nominal concentration of 200
µg/µl of Clodrolip and correspondent volumes of Shamlip or medium (NT) as controls. (B) Mean % of apoptotic cells, calculated as % of Annexin V+ TS/A cells, in different conditions where nominal concentrations are indicated as 5= 25µg/µl, 20=100µg/µl; data are obtained from 2 replicates, 2 independent experiments. (C) LDH release by
Clodrolip vs Shamlip treated TS/A 16 hours after treatment in different conditions, where nominal concentrations are indicated as 5= 25µg/µl, 20=100µg/µl; error bars
are SD from 2 replicates.

66
Fig.37 Relative contribution of neoplastic cells and macrophages to [18F]FDG uptake. [18F]FDG-PET scans of abdomen of representative mice from Shamlip (A) and
Clodrolip (C) treated cohorts at different time points. Coronal view (a) of the image reconstruction and axial slices (b) taken at the level of tumour location (dashed white line). (B) and (D) are pictures of scanned mice at the moment of necropsy. Tumour
masses are indicated by yellow arrows. (E) Immunohistochemical staining for CD45.2 of neoplastic lesions from representative Shamlip and Clodrolip treated animals, at
early (8 days) and late (13 days) time points. (F) Quantification of the number of CD45.2 positive cells per field of view (FOV - at 20X magnification) infiltrating tumour lesions; results are expressed as mean of counts of four fields per tumour mass per
animal.
a
b
a
b
A 13 days 5 days 7 days 9 days B
C D
max
min
max
min
12 days
E F Day 8 Day 13
Sha
mlip
C
lodr
olip
50
50 50
50

67
4.2.3. Quantification and correlations analysis To better clarify the effects of macrophages on [18F]FDG distribution we: i) applied a quantitative analysis on [18F]FDG-PET images, ii) correlated the results of [18F]FDG-PET images quantification with the weight of neoplastic lesions sampled post mortem. In Fig.38A is possible to observe a representative example of thresholded maps of radioactivity distribution and the correspondent PET images of representative mice. The tumour volume measured using [18F]FDG-PET was significantly lower after macrophage depletion (0.64±0.40 cm3 vs 0.17±0.19, p<0.005; 0.87±0.29 vs 0.13±0.13, p<0.0005 and 1.31±0.71 vs 0.53±0.49, p=0.01 at 7, 9 and 12 days after TS/A adenocarcinoma cells injection in control and macrophage-depleted mice, respectively). At 12 days after TS/A adenocarcinoma cells injection an increase in the extension of tumour volume was present in macrophage-depleted animals, thus suggesting an escape of tumour growth at the end of the treatment (Fig.38A). Mean values of maximum and mean [18F]FDG uptake in thresholded tumour regions, expressed as %ID/g, were significantly lower in macrophage-depleted mice if compared to control Shamlip treated mice at 9 days (p=0.002 and p=0.02 respectively) after TS/A adenocarcinoma cells injection (Fig.38B and C). The signal at 7 days in depleted animals was independent of the accumulation of phagocytes, since the presence of leukocytes was reduced by 92.59% (Fig.37F), indicating that the principal contribution to [18F]FDG uptake is given by neoplastic proliferating cells. The observed increase in [18F]FDG uptake in macrophage-depleted mice from 7 to 12 days after TS/A adenocarcinoma cells injection was confirmed by the quantification of maximum and mean radioactivity concentration (Fig.38B and C, * p<0.05). Since we observed that the presence of leukocytes was still reduced at the last time point (Fig.37F), the increased in radioactivity possibly reflects a renewal of tumour growth. Moreover, we directly assessed the tumour load by weighting lesions harvested from macrophage-depleted and competent animals. Macrophage depletion was associated with a substantial smaller tumour burden 13 days after TS/A adenocarcinoma cells inoculation in comparison to the sham group (Fig.39A). This observation confirmed the trend observed by [18F]FDG-PET analysis and is in agreement with the established trophic action of macrophages. A partial reduction in neoplastic load was also observed at an earlier time point (7 days) in macrophage-depleted mice (Fig.39C). In addition, the weight of lesions positively correlated with the extension of radioactivity uptake measured in vivo using [18F]FDG-PET, both at 7 and 12 days after TS/A adenocarcinoma cells injection (Fig.39D and B respectively).

68
a b
a b
PET image
Tumour contour
7 days PET
image Tumour contour
9 days PET
image Tumour contour
12 days A
B
Sha
mlip
C
lodr
olip
min max min max min max
7 days 9 days 12 days0.0
2.0
4.0
6.0
8.0
10.0
12.0
14.0Shamlip
Clodrolip
****
max
%ID
/g
7 days 9 days 12 days0.0
2.0
4.0
6.0
8.0
10.0
12.0
14.0Shamlip
Clodrolip
** *
*m
ean
%ID
/g
C
min max min max min max
Fig.38 (A) Axial [18F]FDG-PET scans (a) and re-elaborated images with tumour contour masks (b) from two representative mice from Shamlip (upper panel) and
Clodrolip (bottom panel) treated cohorts analyzed at different time points. (B) Variation of maximum and (C) mean [18F]FDG uptake (expressed as %ID/grams)
during time in Shamlip and Clodrolip treated cohorts of mice. Error bars represent SD of two independent experiments for 7 (n=9 for Shamlip and n=11 for Clodrolip) and 12 days (n=10 for each group) and one experiment for 9 days (n=5 for Shamlip and n=6
for Clodrolip).

69
Fig.39 PET information strongly correlates with necropsy. (A) Lesion weight from Shamlip and Clodrolip treated cohorts of mice at 12 days after TS/A cell injection.
Errors bars are SD; n=9 each cohort from 2 independent experiments, * p<0.05. (B) Correlation plot between lesion weight (x axis) and volume of tumour measured at
PET (y axis) of tumours of Shamlip and Clodrolip treated mice at 12 days after TS/A cell injection, n=9 from 2 independent experiments. Linear regression curve considers
both cohorts. Correlation value is r=0.8107. (C) Lesion weight from Shamlip and Clodrolip treated cohorts of mice at 7 days after TS/A cell injection. Error bars are SD; n=4 for Clodrolip and n=3 for Shamlip. (D) Correlation plot between lesion weight (x
axis) and volume of tumour measured at PET (y axis) of tumours of Shamlip and Clodrolip treated mice at 7 days. Linear regression curve considers both cohorts.
Correlation value is 0.8368.
C
B
D
A
0.00 0.02 0.04 0.06 0.08 0.100.0
0.5
1.0
1.5
2.0
2.5
3.0
Linear regression
ShamlipClodrolip
R2=0.7003p=0.0189
Lesion weight (g)
Tum
or v
olum
e (c
m3)
0.0 0.1 0.2 0.3 0.4 0.5 0.6 0.70.0
0.5
1.0
1.5
2.0
2.5
3.0 ShamlipClodrolip
R2=0.6572p<0.0001
Linear regression
Lesion weight (g)
Tum
or v
olum
e (c
m3)

70
4.3. Discussion
Proliferating metabolically active neoplastic cells as well as tumour associated inflammatory cells possibly contribute to the uptake of [18F]FDG tracer [91]. [18F]FDG uptake by inflammatory cells is responsible for false positive results of PET imaging. To overcome the problem of false positives, Zhuang et al. [62] applied a kinetic approach based on the different level of glucose metabolism targets expressed by cancer and inflammatory lesions. It is well known that presence of inflammation may affect the interpretation of PET studies. This effect has been observed in PET studies evaluating the effect of radiotherapy as well as chemotherapeutic approaches. A transient increase in [18F]FDG uptake has been described at early time points after cyclophosphamide administration, an effect that can be minimized by corticosteroid co-administration [63]. In order to address this issue in the setting of peritoneal carcinomatosis, we established an ad hoc system using murine TS/A adenocarcinoma cells intraperitoneally injected in syngeneic mice. This model reproduces the main clinical characteristics of the human carcinomatosis. We followed tumour spreading and growth in the peritoneal cavity by imaging with [18F]FDG-PET. The results demonstrate the feasibility of preclinical approaches for the imaging and study of inaccessible sites, like the abdominal cavity (Fig.35). We validated our imaging results performing a quantification analysis on the [18F]FDG-PET images, and found a positive correlation between the extension of radioactivity uptake measured by [18F]FDG-PET and the weight of tumour masses (Fig.39). Several biochemical changes possibly contribute to the uptake of [18F]FDG in neoplastic lesions. Transformed cells are characterized by the aberrant expression of membrane glucose transporters [92, 93], like the glucose transporter 1 -Glut-1, and by the increased activity of glycolytic enzymes, principally hexokinase, with an increased glycolytic metabolism even in aerobic conditions [16, 94]. The diffusion of drugs and diagnostic tracers in neoplastic tissue is altered by the inefficient and leaky blood supply: the tumour associated vascular bed is characterized by an highly disorganized structure, enhanced permeability and an irregular basement membrane structure [95]. Moreover, the accumulation of inflammatory cells is often associated with false positive results in [18F]FDG-PET based studies [96, 97] and both the number and activation state of inflammatory cells have been demonstrated to contribute to the [18F]FDG uptake [98]. Immune activation indeed depends on an increased glucose import, primarily through Glut-1, which is accompanied by an acceleration of glycolysis [99, 100]. Phagocytes, like macrophages and granulocytes, are effective accumulators of [18F]FDG because of their constitutively high endocytic activity [101]. Here we directly addressed the role of macrophages by comparing neoplastic lesions weight and tumour volume measured at [18F]FDG-PET after their in vivo pharmacological depletion. Depletion with clodronate encapsulated into liposomes is an effective method to achieve the pharmacological elimination of phagocytes in preclinical setting in vivo [102]. This “suicide” approach is based on the liposome-mediated internalization of the small hydrophilic molecule clodronate in phagocytes. Clodronate belongs to the pharmacological family of bisphosphonates, drugs extensively used in the clinical practice to prevent or inhibit development of bone metastases, excessive bone resorption and for inflammatory diseases such as rheumatoid arthritis and osteoarthritis. Their mechanism of action, that is not
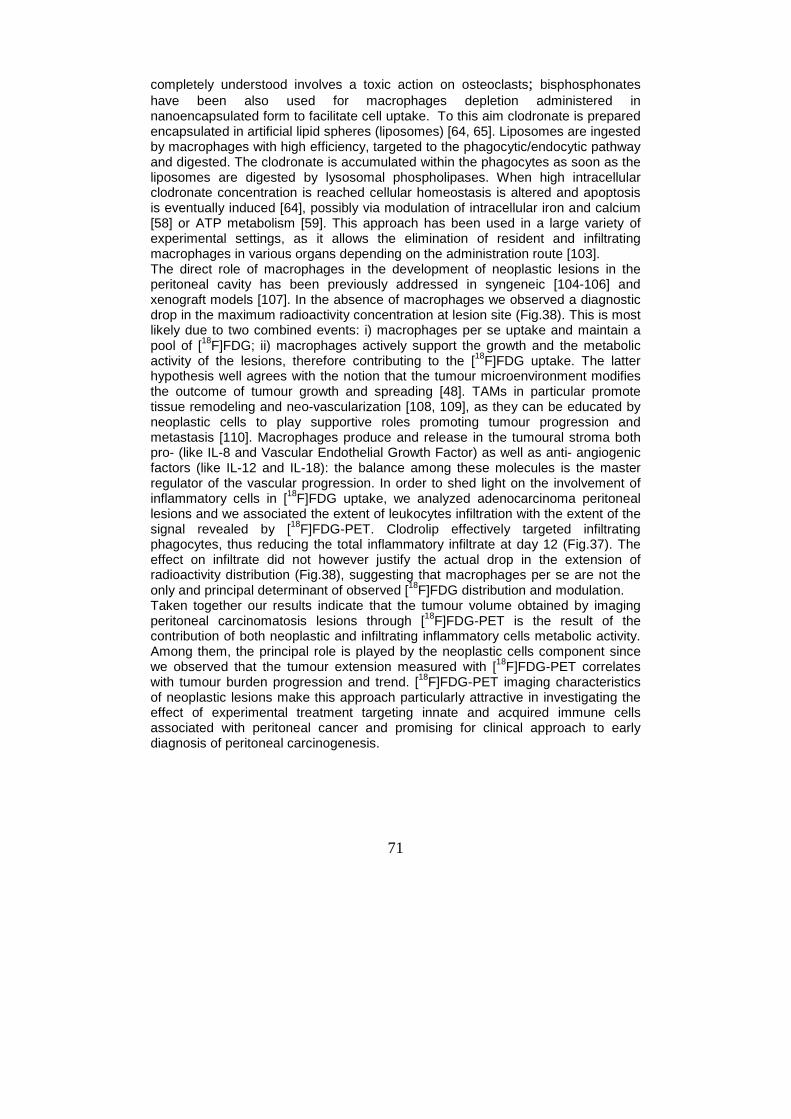
71
completely understood involves a toxic action on osteoclasts; bisphosphonates have been also used for macrophages depletion administered in nanoencapsulated form to facilitate cell uptake. To this aim clodronate is prepared encapsulated in artificial lipid spheres (liposomes) [64, 65]. Liposomes are ingested by macrophages with high efficiency, targeted to the phagocytic/endocytic pathway and digested. The clodronate is accumulated within the phagocytes as soon as the liposomes are digested by lysosomal phospholipases. When high intracellular clodronate concentration is reached cellular homeostasis is altered and apoptosis is eventually induced [64], possibly via modulation of intracellular iron and calcium [58] or ATP metabolism [59]. This approach has been used in a large variety of experimental settings, as it allows the elimination of resident and infiltrating macrophages in various organs depending on the administration route [103]. The direct role of macrophages in the development of neoplastic lesions in the peritoneal cavity has been previously addressed in syngeneic [104-106] and xenograft models [107]. In the absence of macrophages we observed a diagnostic drop in the maximum radioactivity concentration at lesion site (Fig.38). This is most likely due to two combined events: i) macrophages per se uptake and maintain a pool of [18F]FDG; ii) macrophages actively support the growth and the metabolic activity of the lesions, therefore contributing to the [18F]FDG uptake. The latter hypothesis well agrees with the notion that the tumour microenvironment modifies the outcome of tumour growth and spreading [48]. TAMs in particular promote tissue remodeling and neo-vascularization [108, 109], as they can be educated by neoplastic cells to play supportive roles promoting tumour progression and metastasis [110]. Macrophages produce and release in the tumoural stroma both pro- (like IL-8 and Vascular Endothelial Growth Factor) as well as anti- angiogenic factors (like IL-12 and IL-18): the balance among these molecules is the master regulator of the vascular progression. In order to shed light on the involvement of inflammatory cells in [18F]FDG uptake, we analyzed adenocarcinoma peritoneal lesions and we associated the extent of leukocytes infiltration with the extent of the signal revealed by [18F]FDG-PET. Clodrolip effectively targeted infiltrating phagocytes, thus reducing the total inflammatory infiltrate at day 12 (Fig.37). The effect on infiltrate did not however justify the actual drop in the extension of radioactivity distribution (Fig.38), suggesting that macrophages per se are not the only and principal determinant of observed [18F]FDG distribution and modulation. Taken together our results indicate that the tumour volume obtained by imaging peritoneal carcinomatosis lesions through [18F]FDG-PET is the result of the contribution of both neoplastic and infiltrating inflammatory cells metabolic activity. Among them, the principal role is played by the neoplastic cells component since we observed that the tumour extension measured with [18F]FDG-PET correlates with tumour burden progression and trend. [18F]FDG-PET imaging characteristics of neoplastic lesions make this approach particularly attractive in investigating the effect of experimental treatment targeting innate and acquired immune cells associated with peritoneal cancer and promising for clinical approach to early diagnosis of peritoneal carcinogenesis.

72
5. CONCLUSION

73
In conclusion this thesis proposes imaging PET as an interesting and useful technique for studying and monitoring changes in metabolic processes as hypoxia and glucose metabolism during a neoplasia. We investigated the distribution of two hypoxia radiopharmaceutical, [18F]FAZA and [64Cu]ATSM, in three tumour cell lines. First we set up the best temporal window for studying tumours performing in vivo longitudinal [18F]FAZA- and [18F]FDG-PET scan acquisitions. In all three lines we observed a partial overlap of the two radiotracers. [18F]FDG was more distributed in the peripheral tumour areas near muscle, whereas [18F]FAZA was preferentially distributed in the central area of the lesion. Successively, we compared [18F]FAZA distribution in EMT-6, FaDu and PC-3 with [64Cu]ATSM at early and late time in vivo and ex-vivo. In FaDu, the distribution of [64Cu]ATSM was not time-dependent and it was similar to that of [18F]FAZA. In EMT-6 and PC-3, [64Cu]ATSM showed a different distribution at 2 and 24 hours. The images of the tumours acquired with [64Cu]ATSM at early time were more similar to that of [18F]FAZA. These results were also confirmed by double-tracers autoradiography. We observed that [64Cu]ATSM uptake was influenced by biological and molecular characteristics of each cell type. The time-dependent uptake of [64Cu]ATSM can not be explained only with the different localization of copper pumps observed in immuhistochemical analysis but also by red-ox potential or intra- and extra-cellular pH. Further proteomic studies will be essential to understand and know what proteins are expressed in a precise time of the tumour progression. Proteomic data in association with imaging results may be useful to connect molecular changes to metabolic processes. In this thesis we also define the feasibility of the use of PET technique as a non invasive and sensitive method to monitor neoplasms in peritoneal cavity and demonstrates that the innate immune response associated to peritoneal carcinosis are directly involved in peritoneal tumour establishment. We set up a model of peritoneal carcinosis by injected murine mammary adenocarcinoma cells in the peritoneum of Balb/c mice. A group of mice were macrophage-depleted using clodronate. Using [18F]FDG-PET we monitored longitudinally tumour growth and we observed that tumour lesions revealed using imaging had the same localization at necropsy. Moreover we found a correlation between the volume tumour measured at PET and the tumour weight sampled and dried after death. Depleted mice showed a slower tumour growth in comparison to control mice, confirming that macrophages execute an important role in tumour growth and progression above all in the first stage of disease onset. This model of peritoneal cancer will be employed to test new therapeutic strategies which they will be monitored using [18F]FDG-PET imaging.

74
References 1. Townsend DW, “Physical principles and technology of clinical PET imaging”, Annals of the Academy of Medicine 2004;33(2):133-45. 2. Motta A, Damiani C, Del Guerra A, Di Domenico G and Zavattini G, “Use of a fast EM algorithm for 3D image reconstruction with the YAP-PET tomography”, Computerized Medical Imaging and Graphics 2002;26:293-02. 3. Herschman HR, “Noninvasive imaging of reporter gene expression in living subjects”, Advances in Cancer Research 2004;92:29-80. 4. Weber S and Bauer A, “Small animal PET: aspects of performance assessment”, European Journal of Nuclear Medicine and Molecular Imaging 2004;31(11):1545-55. 5. Del Guerra A and Belcari N, “Advances in animal PET scanners”, The Quarterly Journal of Nuclear Medicine 2002;46:35-47. 6. Phelps ME, “Positron emission tomography provides molecular imaging of biological process”, PNAS 2000;97(16):9226-33. 7. Ido T, Wan CN, Casella V, Fowler JS, Wolf AP, Reinich M, Kuhl DE, “Labelled 2-deoxy-D-glucose analogs. 18F-labelled 2-deoxy-2-fluoro-D-glucose, 2-deoxy-2-fluoro-D-mannose and 11C-2-deoxy-2-fluoro-D-glucose”, Journal of Labelled Compounds and Radiopharmaceuticals 1978;14:175-83. 8. Bar-Shalom R, Valdivia AJ, Blaufox MD, “PET imaging in oncology”, Seminars in Nuclear Medicine 2000;30:150-85. 9. Vaupel P and Harrison L, “Tumor Hypoxia: Causative Factors, Compensatory Mechanisms, and Cellular Response”, The Oncologist 2004;9(suppl 5):4-9. 10. Rankin EB and Giaccia AJ, “The role of hypoxia-inducible factors in tumorigenesis”, Cell Death and Differentiation 2008;15:678–685. 11. Hockel M and Vaupel P, “Tumor Hypoxia: Definitions and Current Clinical, Biologic, and Molecular Aspects”, Journal of the National Cancer Institute 2001;93:266-76. 12. Stewart GD, Ross JA, McLaren DB, Parker CC, Habib FK, Riddick ACP, “The relevance of a hypoxic tumour microenvironment in prostate cancer”, British Journal of Urology International 2009;105:8-13. 13. Semenza GL, “Targeting HIF-1 for cancer therapy”, Nature Reviews Cancer 2003;3:721-732. 14. Fantin VR, St-Pierre J, Leder P, “Attenuation of LDH-A expression uncovers a link between glycolysis, mitochondrial physiology, and tumor maintenance”, Cancer Cell 2006;9:425-434. 15. Moreno-Sanchez R, Rodriguez-Enriquez S, Marin-Hernandez, Saavedra E, “Energy metabolism in tumor cells”, FEBS Journal 2007;274:1393-418. 16. Vander-Heiden MG, Cantley LC, Thompson CB, “Understanding the Warburg effect: the metabolic requirements of cell proliferation”, Science 2009;324:1029-1033. 17. Feron O, “Pyruvate into lactate and back: from the Warburg effect to symbiotic energy fuel exchange in cancer cells”, Radiotherapy and Oncology 2009;doi:10.1016/j.radonc.2009.06.025. 18. Sonveaux P, Végran F, Schroeder T, Wergin MC, Verrax J, Rabbani ZN, De Saedeleer CJ, Kennedy KM, Diepart C, Jordan BF, Kelley MJ, Gallez B, Wahl ML, Feron O, Dewhirst MW, “Targeting lactate-fueled respiration selectively kills hypoxic tumor cells in mice”, The Journal of Clinical Investigation 2008;118:393-42.

75
19. Gatenby RA, Gillies RJ, “Why do cancers have high aerobic glycolysis?”, Nature Reviews Cancer 2004;4:891-899. 20. Overgaard J, “Hypoxic radiosensitization: adored and ignored”, Journal of Clinical Oncology 2007;25:4066-4074. 21. Gray LH, Conger AD, Ebert M, Hornsey S, Scott OC, “The concentration of oxygen dissolved in tissues at the time of irradiation as a factor in radiotherapy”, British Journal of Radiology 1953;312:638-48. 22. Song X, Liu X, Chi W, Liu Y, Wei L, Wang X, Yu J, “Hypoxia-induced resistance to cisplatin and doxorubicin in non-small cell lung cancer is inhibited by silencing of HIF-1alpha gene” Cancer Chemotherapy and Pharmacology 2006;58:776-84. 23. Padhani AR, Krohn KA, Lewis JS, Alber M, “Imaging oxygenation of human tumours” European Radiology 2007;17:861-72. Eur Radiol. 2007 Apr;17(4):861-72. Epub 2006 Oct 17. 24. Tomida A, Tsuruo T, “Drug resistance mediated by cellular stress response to the microenvironment of solid tumors”, Anticancer drug design 1999;14:169-177. 25. Oh M, Tanaka T, Kobayashi M, Furukawa T, Mori T, Kudo T, Fujieda S, Fujibayashi Y, “Radio-copper-labeled Cu-ATSM: an indicator of quiescent but clonogenic cells under mild hypoxia in a Lewis lung carcinoma model”, Nuclear Medicine and Biology 2009;36:419-26. 26. Lyng H, Sundfør K, Rofstad EK, “Oxygen tension in human tumours measured with polarographic needle electrodes and its relationship to vascular density, necrosis and hypoxia”, Radiotherapy and Oncology, 1997;44:163-9. 27. Chapman JD, “Hypoxic Sensitizers — Implications for Radiation Therapy”, New England Journal of Medicine 1979; 301:1429-1432. 28. Takasawa M, Moustafa RR, Baron JC, “Applications of nitroimidazole in vivo hypoxia imaging in ischemic stroke”, Stroke 2008;39:1629-37. 29. Piert M, Machulla HJ, Picchio M, Reischl G, Ziegler S, Kumar P, Wester HJ, Beck R, McEwan AJ, Wiebe LI, Schwaiger M, “Hypoxia-specific tumor imaging with 18F-fluoroazomycin arabinoside”, The Journal of Nuclear Medicine 2005;46:106-113. 30. Reischl G, Dorow DS, Cullinane C, Katsifis A, Roselt P, Binns D, Hicks RJ, “Imaging of tumor hypoxia with [124I]IAZA in comparison with [18F]FMISO and [18F]FAZA-first small animal PET results”, Journal of Pharmacy and Pharmaceutical Sciences 2007;10:203-11. 31. Sorger D, Patt M, Kumar P, Wiebe LI, Barthel H, Seese A, Dannenberg C, Tannapfel A, Kluge R, Sabri O, “[18F]Fluoroazomycinarabinofuranoside (18FAZA) and [18F]Fluoromisonidazole (18FMISO): a comparative study of their selective uptake in hypoxic cells and PET imaging in experimental rat tumors”, Nuclear Medicine and Biology 2003;30:317-26. 32. Busk M, Horsman MR, Jakobsen S, Keiding S, van der Kogel AJ, Bussink J, Overgaard J “Imaging hypoxia in xenografted and murine tumors with 18F-fluoroazomycin arabinoside: a comparative study involving microPET, autoradiography, PO2-polarography, and fluorescence microscopy”, International Journal of Radiation, Oncology, Biology, Physics 2008;70:1202-12. 33. Busk M, Horsman MR, Jakobsen S, Bussink J, van der Kogel A, Overgaard J, “Cellular uptake of PET tracers of glucose metabolism and hypoxia and their linkage”, European Journal of Nuclear Medicine and Molecular Imaging 2008;35:2294-303.

76
34. Souvatzoglou M, Grosu AL, Röper B, Krause BJ, Beck R, Reischl G, Picchio M, Machulla HJ, Wester HJ, Piert M, “Tumour hypoxia imaging with [18F]FAZA PET in head and neck cancer patients: a pilot study”, European Journal of Nuclear Medicine and Molecular Imaging 2007;34:1566-75. 35. Grosu AL, Souvatzoglou M, Röper B, Dobritz M, Wiedenmann N, Jacob V, Wester HJ, Reischl G, Machulla HJ, Schwaiger M, Molls M, Piert M, “Hypoxia imaging with FAZA-PET and theoretical considerations with regard to dose painting for individualization of radiotherapy in patients with head and neck cancer”, International Journal of Radiation Oncology, Biology, Physics 2007;69:541-51. 36. Fujibayashi A, Taniuchi H, Yonekura Y, Ohtani H, Konishi J, Yokoyama A, “Copper-62-ATSM: A New Hypoxia Imaging Agent with High Membrane Permeability and Low Redox Potential”, Journal of Nuclear Medicine 1997;38:1155-1160. 37. Lewis JS, McCarthy DW, McCarthy TJ, Fujibayashi Y, Welch MJ, “Evaluation of 64Cu-ATSM in vitro and in vivo in a hypoxic tumor model”, Journal of Nuclear Medicine 1999;40:177-83. 38. Obata A, Yoshimi E, Waki A, Lewis JS, Oyama N, Welch MJ, Saji H, Yonekura Y, Fujibayashi Y, “Retention mechanism of hypoxia selective nuclear imaging/radiotherapeutic agent cu-diacetyl-bis(N4-methylthiosemicarbazone) (Cu-ATSM) in tumor cells”, Annuals of Nuclear Medicine 2001;15:499-504. 39. McQuade P, Martin KE, Castle TC, Went MJ, Blower PJ, Welch MJ, Lewis JS, “Investigation into 64Cu-labeled Bis(selenosemicarbazone) and Bis(thiosemicarbazone) complexes as hypoxia imaging agents”, Nuclear Medicine and Biology 2005;32:147-56. 40. Dehdashti F, Grigsby PW, Mintun MA, Lewis JS, Siegel BA, Welch MJ, “Assessing tumor hypoxia in cervical cancer by positron emission tomography with 60Cu-ATSM: relationship to therapeutic response-a preliminary report”, International Journal of Radiation Oncology, Biology, Physics 2003;55:1233-8. 41. Dehdashti F, Mintun MA, Lewis JS, Bradley J, Govindan R, Laforest R, Welch MJ, Siegel BA, “In vivo assessment of tumor hypoxia in lung cancer with 60Cu-ATSM”, European Journal of Nuclear Medicine and Molecular Imaging 2003;30:844-50. 42. Dearling JLJ, Lewis JS, Muellen GED, Welch MJ, Blower PJ, “Copper bis(thiosemicarbazone) complexes as hypoxia imaging agents: structure-activity relationships”, Journal of Biological Inorganic Chemistry 2002;7:249-259. 43. Burgman P, O’Donoghue JA, Lewis JS, Welch MJ, Humm JL, Ling CC, “Cell line-dependent differences in uptake and retention of the hypoxia-selective nuclear imaging agent Cu-ATSM”, Nuclear Medicine and Biology 2005;32:623–630. 44. Obata A, Yoshimoto M, Kasamatsu S, Naiki H, Takamatsu S, Kashikura K, Furukawa T, Lewis JS, Welch MJ, Saji H, Yonekura Y, Fujibayashi Y, “Intra-tumoral distribution of (64)Cu-ATSM: a comparison study with FDG”, Nuclear Medicine and Biology 2003;30:529-34. 45. Tanaka T, Furukawa T, Fujieda S, Kasamatsu S, Yonekura Y, Fujibayashi Y, “Double-tracer autoradiography with Cu-ATSM/FDG and immunohistochemical interpretation in four different mouse implanted tumor models”, Nuclear Medicine and Biology 2006;33:743-50. 46. Lewis JS, Laforest R, Dehdashti F, Grigsby PW, Welch MJ, Siegel BA, “An imaging comparison of 64Cu-ATSM and 60Cu-ATSM in cancer of the uterine cervix” Journal of Nuclear Medicine 2008;49:1177-82.

77
47. O'Donoghue JA, Zanzonico P, Pugachev A, Wen B, Smith-Jones P, Cai S, Burnazi E, Finn RD, Burgman P, Ruan S, Lewis JS, Welch MJ, Ling CC, Humm JL, “Assessment of regional tumor hypoxia using 18F-fluoromisonidazole and 64Cu(II)-diacetyl-bis(N4-methylthiosemicarbazone) positron emission tomography: Comparative study featuring microPET imaging, Po2 probe measurement, autoradiography, and fluorescent microscopy in the R3327-AT and FaDu rat tumor models”, International. Journal of Radiation Oncology, Biology, Physics 2005;61:1493–1502. 48. Coussens L and Werb Z, “Inflammation and cancer”, Nature 2002;420:860–867. 49. Pollard JW, “Tumour-educated macrophages promote tumour progression and metastasis” NATURE REVIEWS CANCER 2004;4:71-78. 50. Janeway CA, Travers P, Walport M, Shlomchik, “Immunobiologia Fisiologia e fisiopatologia del sistema immunitario” V Ed, Piccin editore pag.752. 51. Hussein M, “Tumour-associated macrophages and melanoma tumourigenesis: integrating the complexity”, International Journal of Experimental Pathology 2006; 87:163-176. 52. Mantovani A, Sozzoni S, Locati M, Allavena P, Sica A, “Macrophage polarization: tumor-associated macrophages as a paradigm for polarized M2 mononuclear phagocytes”, TRENDS in Immunology 2002;23:549-555. 53. van Rooijen N, Bakker J, Sanders A, “Transient suppression of macrophage functions by liposome-encapsulated drugs”, TIBTECH 1997;15:178-185. 54. www.gibis.org 55. en.wikipedia.org 56. www.nanolifenutra.com 57. Fadok VA, Voelker DR, Campbell PA, Cohen JJ, Bratton DL, Henson PM, “Exposure of phosphatidylserine on the surface of apoptotic lymphocytes triggers specific recognition and removal by macrophages”, Journal of Immunology 1992;148:2207-16. 58. Monkkonen J and Heath TD, “ The effects of liposome-encapsulated and free clodronate on the growth of macrophage-like cells in vitro: the role of calcium and iron”, Calcified Tissue International 1993;53:139-46. 59. van Rooijen N, “Extracellular and intracellular action of clodronate in osteolytic bone disease: a hypothesis”, Calcification Ttissue International 1993;52:407-10. 60. Tahara T, Ichiya Y, Kuwabara Y, Otsuka M, Miyake Y, Gunasekera R, et al. “High [18F]-fluorodeoxyglucose uptake in abdominal abscesses: a PET study”, Journal of Computer Assisted Tomography. 1989;13:829-31. 61. Yamada S, Kubota K, Kubota R, Ido T, Tamahashi N, “High accumulation of fluorine-18-fluorodeoxyglucose in turpentine-induced inflammatory tissue”, Journal of Nuclear Medicine, 1995;36:1301-6. 62. Zhuang H, Pourdehnad M, Lambright ES, Yamamoto AJ, Lanuti M, Li P, Mozley PD, Rossman MD,. Albelda SM, Alavi A, “Dual Time Point 18F-FDG PET Imaging for Differentiating Malignant from Inflammatory Processes”, Journal of Nuclear Medicine 2001;42:1412–1417. 63. Brepoels L, Stroobants S, Vandenberghe P, Spaepen K, Dupont P, Nuyts J, Bormans G, Mortelmans L, Verhoef G, De Wolf-Peeters C,“Effect of corticosteroids on 18F-FDG uptake in tumor lesions after chemotherapy” Journal of Nuclear Medicine 2007;48:390-7.

78
64. Van Rooijen N, Sanders A, “Liposome mediated depletion of macrophages: mechanism of action, preparation of liposomes and applications”, Journal of Immunological Methods 1994;174:83-93. 65. Zeisberger SM, Odermatt B, Marty C, Zehnder-Fjallman AH, Ballmer-Hofer K, Schwendener RA, “Clodronate-liposome-mediated depletion of tumour-associated macrophages: a new and highly effective antiangiogenic therapy approach”, British Journal of Cancer 2006;95:272-81. 66. www.theodora.com/anatomy/the_abdomen.html 67. Healy JC and Reznek RH, “The peritoneum, mesenteries and omenta: normal anatomy and pathological processes”, European Radiology 1998;8:886-900. 68. van der Wal JB and Jeekel J, “Biology of the peritoneum in normal homeostasis and after surgical trauma”, Colorectal Disease 2007;9:9-13. 69. Mutsaers SE, Whitaker D, Papadimitriou JM, “ Stimulation of mesothelial cell proliferation by exudate macrophages enhances serosal wound healing in a murine model”, American Journal of Pathology 2002;160:681-92. 70. Bridda A, Padoan I, Mencarelli R, Frego M, “Peritoneal mesothelioma: a review”, Medscape General Medicine 2007;9:32. 71. Hinshaw JL and Pickhardt PJ, “Imaging of primary malignant tumors of peritoneal and retroperitoneal origin”, Cancer Treatment and Research 2008;143:281-97. 72. Lurie G, Thompson PJ, McDuffie KE, Carney ME, Goodman M, “Prediagnostic symptoms of ovarian carcinoma: A case-control study”, Gynecologic Oncology 2009;doi:10.1016/j.ygyno.2009.05.001. 73. Nagy JA, Masse EM, Herzberg KT, Meyers MS, Yeo KT, Yeo TK, Sioussat TM, Dvorak HF, “Pathogenesis of ascites tumor growth: vascular permeability factor, vascular hyperpermeability, and ascites fluid accumulation”, Cancer Research 1995;55:360-8. 74. Turlakow A, Yeung HW, Salmon AS, Macapinlac HA, Larson SM, “Peritoneal carcinomatosis: role of (18)F-FDG PET” Journal of Nuclear Medicine 2003;44:1407-1412 75. González-Moreno S, Gonzalez-Bayon L, Ortega-Perez G, “Imaging of Peritoneal Carcinomatosis”, The Cancer Journal 2009;15:184-189. 76. Margolis DJ, Hoffman JM, Herfkens RJ, Jeffrey RB, Quon A, Gambhir SS, “Molecular imaging techniques in body imaging” Radiology. 2007;245:333-56. 77. Picchio M, Sironi S, Messa C, Mangili G, Landoni C, Gianolli L, Zangheri B, Viganò R, Aletti G, De Marzi P, De Cobelli F, Del Maschio A, Ferrari A, Fazio F, ”Advanced ovarian carcinoma: usefulness of [(18)F]FDG-PET in combination with CT for lesion detection after primary treatment”, The Quarterly Journal of Nuclear Medicine 2003;47:77-84. 78. Yoshida Y, Kurokawa T, Tsujikawa T, Okazawa H, Kotsuji F, “Positron emission tomography in ovarian cancer: 18F-deoxy-glucose and 16alpha-18F-fluoro-17beta-estradiol PET” Journal of Ovarian Research 2009;2:7. 79. Iagaru AH, Mittra ES, McDougall IR, Quon A, Gambhir SS, “18F-FDG PET/CT evaluation of patients with ovarian carcinoma” Nuclear Medicine Communications 2008;29:1046-51. 80. Zavaleta CL, Goins BA, Bao A, McManus LM, McMahan CA, Phillips WT, “Imaging of 186Re-liposome therapy in ovarian cancer xenograft model of peritoneal carcinomatosis” Journal of Drug Targeting 2008;16:626-37.

79
81. Kim TJ, Ravoori M, Landen CN, Kamat AA, Han LY, Lu C, Lin YG, Merritt WM, Jennings N, Spannuth WA, Langley R, Gershenson DM, Coleman RL, Kundra V, Sood AK, “Antitumor and antivascular effects of AVE8062 in ovarian carcinoma”, Cancer Research 2007;67:9337-45. 82. Niu G, Li Z, Cao Q, Chen X. “Monitoring therapeutic response of human ovarian cancer to 17-DMAG by noninvasive PET imaging with (64)Cu-DOTA-trastuzumab” European Journal of Nuclear Medicine and Molecular Imaging 2009;36:1510-9. 83. Lin YY, Li JJ, Chang CH, Lu YC, Hwang JJ, Tseng YL, Lin WJ, Ting G, Wang HE, “Evaluation of pharmacokinetics of 111In-labeled VNB-PEGylated liposomes after intraperitoneal and intravenous administration in a tumor/ascites mouse model”, Cancer Biotherapy and Radiopharmaceuticals 2009 Aug;24(4):453-60. 84. Fong MY KS “Ovarian cancer mouse models: A summary of current models and their limitations” Journal of Ovarian Research. 2009;2(1):12. 85. Brown RS, Fisher SJ, Wahl RL “Autoradiographic evaluation of the intra-tumoral distribution of 2-deoxy-D-glucose and monoclonal antibodies in xenografts of human ovarian adenocarcinoma”, Journal of Nuclear Medicine 1993;34:75-82. 86. Nanni P, de Giovanni C, Lollini PL, Nicoletti G, Prodi G, “TS/A: a new metastasizing cell line from a BALB/c spontaneous mammary adenocarcinoma”, Clinical and Experimental Metastasis 1983;1:373-80. 87. Reischl G. Ehrlichmann W, Bieg C, Solbach C, Kumar P, Wiebe LI, Machulla HJ, “Preparation of the hypoxia imaging PET tracer [18F]FAZA: reaction parameters and automation”, Applied Radiation and Isotopes 2005;62: 897-901. Appl Radiat Isot. 2005 Jun;62(6):897-901. 88. Szajek L.P, Kao C-HK, Kiesewetter DO, Sassaman MB, Lang L, Plascjak P and Eckelman WC: “Semi-remote production of [64Cu]CuCl2 and preparation of high specific activity [64Cu]Cu-ATSM for PET studies” Radiochimica ACTA 2005;93:239-244. 89. T. Danielsen and Rofstad EK, “VEGF, bFGF and EGF in the angiogenesis of human melanoma xenografts”, International Journal of Cancer 1998;76(6):836-41. 90. http://rsbweb.nih.gov/ij/ 91. Rosenbaum SJ, Lind T, Antoch G, Bockisch A, “False-positive FDG PET uptake--the role of PET/CT”, European Radiology 2006;16:1054-65. 92. Scheepers A, Joost HG, Schurmann A “The glucose transporter families SGLT and GLUT: molecular basis of normal and aberrant function” JPEN Journal of Parenteral and Enteral Nutritions. 2004;28:364-71. 93. Macheda ML, Rogers S, Best JD, “Molecular and cellular regulation of glucose transporter (GLUT) proteins in cancer” Journal of Cellular Physiology 2005;202:654-62. 94. DeBerardinis RJ, Lum JJ, Hatzivassiliou G, Thompson CB, “The biology of cancer: metabolic reprogramming fuels cell growth and proliferation” Cell Metabolism 2008;7:11-20. 95. Hida K, Hida Y, Shindoh M, “Understanding tumor endothelial cell abnormalities to develop ideal anti-angiogenic therapies” Cancer Science 2008;99:459-66 96. Bakheet SM, Powe J “Benign causes of 18-FDG uptake on whole body imaging” Seminars of Nuclear Medicine 1998;28:352-8. 97. Brewer S, McPherson M, Fujiwara D, Turovskaya O, Ziring D, Chen L, Takedatsu H, Targan SR, Wei B, Braun J, “Molecular imaging of murine intestinal

80
inflammation with 2-deoxy-2-[18F]fluoro-D-glucose and positron emission tomography” Gastroenterology 2008;135:744-55. 98. Shozushima M, Tsutsumi R, Terasaki K, Sato S, Nakamura R, Sakamaki K, “Augmentation effects of lymphocyte activation by antigen-presenting macrophages on FDG uptake”, Annals of Nuclear Medicine 2003;17:555-60. 99. Frauwirth KA, Riley JL, Harris MH, Parry RV, Rathmell JC, Plas DR, Elstrom RL, June CH, Thompson CB, “The CD28 signaling pathway regulates glucose metabolism” Immunity 2002;16:769-77. 100. Fox CJ, Hammerman PS, Thompson CB, “Fuel feeds function: energy metabolism and the T-cell response” Nature Reviews Immunology 2005;5:844-52. 101. Kubota R, Yamada S, Kubota K, Ishiwata K, Tamahashi N, Ido T, “Intratumoral distribution of fluorine-18-fluorodeoxyglucose in vivo: high accumulation in macrophages and granulation tissues studied by microautoradiography” Journal of Nuclear Medicine 1992;33:1972-80. 102. van Rooijen N “Liposomes for targeting of antigens and drugs: immunoadjuvant activity and liposome-mediated depletion of macrophages” Journal of Drug Targeting, 2008;16:529-34. 103. Buiting AM, Zhou F, Bakker JA, van Rooijen N, Huang L, “Biodistribution of clodronate and liposomes used in the liposome mediated macrophage 'suicide' approach”, Journal of Immunological Methods 1996;192:55-62. 104. Nagy JA, Meyers MS, Masse EM, Herzberg KT, Dvorak HF, “Pathogenesis of ascites tumor growth: fibrinogen influx and fibrin accumulation in tissues lining the peritoneal cavity”, Cancer Research 1995;55:369-75. 105. Nagy JA, Morgan ES, Herzberg KT, Manseau EJ, Dvorak AM, Dvorak HF, “Pathogenesis of ascites tumor growth: angiogenesis, vascular remodeling, and stroma formation in the peritoneal lining” Cancer Research 1995;55:376-85. 106. Miselis NR, Wu ZJ, Van Rooijen N, Kane AB, “Targeting tumor-associated macrophages in an orthotopic murine model of diffuse malignant mesothelioma” Molecular Cancer Therapy 2008;7:788-99. 107. Robinson-Smith TM, Isaacsohn I, Mercer CA, Zhou M, Van Rooijen N, Husseinzadeh N, McFarland-Mancini MM, Drew AF “Macrophages mediate inflammation-enhanced metastasis of ovarian tumors in mice” Cancer Research 2007;67:5708-16. 108. Gordon S, “Alternative activation of macrophages”, Nature Reviews Immunology, 2003;3:23-35. 109. Mosser DM, Edwards JP, “Exploring the full spectrum of macrophage activation”, Nature Reviews Immunology 2008;8:958-69. 110. Coffelt SB, Hughes R, Lewis CE, “Tumor-associated macrophages: effectors of angiogenesis and tumor progression” Biochimica et Biophysica Acta, 2009;1796:11-8. 111. Holland JP, Giansiracusa JH, Bell SG, Wong LL, Dilworth JR, “In vitro kinetic studies on the mechanism of oxygen-dependent cellular uptake of copper radiopharmaceuticals”, Physics in Medicine and Biology 2009;54:2103-2119
Published works during doctorate Cottone L*, Valtorta S *, Capobianco A, Belloli S, Rovere-Querini P, Fazio F, Manfredi AA, Moresco RM, “Contribution of tumour-associated macrophages to [18f]-fdg uptake in experimental models of peritoneal carcinomatosis” Submitted to

81
European Journal of Nuclear Medicine and Molecular Imaging *The first two authors equally contributed to this work . Belloli S, Jachetti E, Moresco RM, Picchio M, Lecchi M, Valtorta S , Freschi M, Hess Michelini R, Bellone M, Fazio F, “Characterization of preclinical models of prostate cancer using PET-based molecular imaging” European Journal of Nuclear Medicine and Molecular Imaging 2009;36:1245-55.
Congress Attendance Oral Presentation Valtorta S , Belloli S, Carina V, Rocchi M, Sanvito F, Doglioni C, Masiello V, Fazio F, Matarrese M, Moresco RM, “Autoradiographic and small-animal PET comparisons between [18F]FAZA and [64Cu]ATSM in EMT-6, FaDu and PC-3 xenograft tumor models” 51st Annual Meeting of the Italian Cancer Society Sesto San Giovanni/Milano 23-26 November 2009.
Poster Presentation Valtorta S , Ronchetti F, Lo Dico A, Politi L, Masiello V, Matarrese M, Zenga F, Zara GP, Scotti G, Mauro A, Moresco RM, “PET and MRI studies applied on characterization of Fisher/F98 rat glioma model”, 5th European Molecular Imaging Meeting Warsaw, Poland 26-29 May 2010.
Valtorta S , Cottone L, Belloli S, Florea I, Capobianco A, Rovere-Querini P, Manfredi A, Fazio F, Moresco RM, "In vivo PET monitoring of an experimental model of peritoneal carcinogenesis” 4th European Molecular Imaging Meeting Barcelona 27-30 May 2009.
Valtorta S , Carina V, Simonelli P, Fazio F, Moresco RM, “Effects of Hormonal Therapy on [18F]FDG and [11C]Choline in vitro uptake on several prostatic cell lines”, 4th European Molecular Imaging Meeting Barcelona 27-30 May 2009.