silver and gold enhancement methods for lateral flow
TRANSCRIPT

1 2 3 4 5 6 7 8 9 10 11 12 13 14 15 16 17 18 19 20 21 22 23 24 25 26 27 28 29 30 31 32 33 34 35 36 37 38 39 40 41 42 43 44 45 46 47 48 49 50 51 52 53 54 55 56 57 58 59 60 61 62 63 64 65
1
2
Silver and Gold enhancement methods for lateral flow immunoassays 3
4
Myriam Oliveira Rodríguez, Lucía Blanco Covián, Agustín Costa García, Maria 5
Carmen Blanco-López* 6
7
Departamento de Química Física y Analítica, Universidad de Oviedo, Julián 8
Clavería 8, 33006 Oviedo, Spain 9
10
11
12
13
14
15
16
17
18
*Corresponding author. 19
20
21
e-mail: 22
23
Field Code Changed
*Revised Manuscript (clean copy)Click here to view linked References

1 2 3 4 5 6 7 8 9 10 11 12 13 14 15 16 17 18 19 20 21 22 23 24 25 26 27 28 29 30 31 32 33 34 35 36 37 38 39 40 41 42 43 44 45 46 47 48 49 50 51 52 53 54 55 56 57 58 59 60 61 62 63 64 65
Abstract: Sensitivity is the main concern at the development of rapid test by lateral 24
flow immunoassays. On the other hand, low limits of detection are often required at 25
medical diagnostics and other field of analysis. To overcome this drawback, several 26
enhancement protocols have been described. In this paper, we have selected different 27
silver enhancement methods and one dual gold conjugation, and we critically compared 28
the amplification produced when applied to a gold-nanoparticle based lateral flow 29
immunoassay for the detection of prostate specific antigen (PSA). The highest 30
amplification was obtained by using an immersion method based on a solution of silver 31
nitrate and hydroquinone/citrate buffer in proportion 1:1. Under these conditions, the 32
system is capable of detecting PSA within 20 min at levels as low as 0.1 ng/mL, with a 33
3-fold sensitivity improvement . 34
Keywords: Lateral Flow Immunoassay Dipstick, Enhancement procedures, Silver 35
enhancement, Dual gold conjugate 36
37
38
39
40
41
42
43
44

1 2 3 4 5 6 7 8 9 10 11 12 13 14 15 16 17 18 19 20 21 22 23 24 25 26 27 28 29 30 31 32 33 34 35 36 37 38 39 40 41 42 43 44 45 46 47 48 49 50 51 52 53 54 55 56 57 58 59 60 61 62 63 64 65
1. Introduction 45
Nowadays, there is a need to develop rapid, simple, and cost-effective tests capable of 46
being performed by unskilled operators in areas such as diagnosis of diseases in 47
developing countries or emergency rooms [1]. In this way, lateral flow immunoassay 48
test (LFIA) represent a well-established and very appropriate technology when applied 49
to a wide variety of point-of-care (POC) or in-field use applications. However, the 50
detection sensitivity of the LFIA is lower than the others immunoassays based on 51
fluorescent, radioactive, and enzyme-colorimetric methods (ELISA) [2] and a higher 52
sensitivity is often required in medical diagnostics. Many studies have attempted to 53
improve the sensitivity of the immunoassay, such as by using different labels (colloidal 54
metal nanoparticles [3-6], enzymes [7-9], magnetic beads [10-12], quantum dots [13-55
14], etc.), coupling with transducters or by amplifying the detection signals. Gold 56
nanoparticles (AuNP) are commonly used because they can be easily conjugated with 57
biomolecules. Furthermore, they allow signal amplification in biosensing where they 58
serve as labels [15]. One strategy to follow in order to enhance the signal is the use of 59
larger nanoparticles. However, while colloidal gold particles smaller than 15 nm were 60
found to be too small for producing an intense color, AuNP larger than 60-70 nm are 61
more unstable, forming aggregates after several days of storage at 4ºC [16]. They also 62
require larger concentrations of antibodies in the conjugation, increasing costs. Tang et 63
al. [17] developed a novel LFIA for the screening of aflatoxin B2 in food samples. The 64
detector reagent consisted of magnetic nanogold microspheres (with nano-Fe2O3 65
particles as core and AuNP as shell) bio-functionalized with monoclonal anti-AFB2 66
antibodies. The visual detection limit obtained with this approach was about threefold 67
lower compared to a conventional immunodipstick test using AuNP. Parolo et al. [18] 68
discussed the development of an enhanced LFIA based on the use of AuNP in 69
combination with the enzymatic activity of the HRP when it is coupled to the detection 70
antibody. A detection limit of 310 pg/mL was achived using this approach. Recently, H. 71
Chon et al. [19] have carried out a similar approach using AuNP-assisted enzyme for 72
detection of pathogens in food, adding the substrate in the cross-flow direction. With 73
this approach, the limit of detection can be increased by about 1000-fold. AuNP can act 74
as a catalyst and reduce copper and especially silver ions into their respective metals in 75
the presence of a reducing agent. The reaction leads to the deposition of copper and 76
silver on the gold surface as nucleation site and enlargement of the size of AuNP, 77

1 2 3 4 5 6 7 8 9 10 11 12 13 14 15 16 17 18 19 20 21 22 23 24 25 26 27 28 29 30 31 32 33 34 35 36 37 38 39 40 41 42 43 44 45 46 47 48 49 50 51 52 53 54 55 56 57 58 59 60 61 62 63 64 65
resulting in a remarkable signal amplification in the test and control line of the 78
immunostrip [20]. The silver staining can be carried out in an incubation mode by 79
immersing the membrane in the enhancement silver after performance the LFIA [21]. 80
Silver enhancement technology was developed by Yang et al. [22] based on the use of 81
two pads where AgNO3 and the reduction agent were fixed. These two approaches have 82
the inconvenient of involving additional operation steps in the assay, increasing the time 83
and the difficulty to use them outside of the laboratory. To overcome this technical 84
limitation Choi et al. [23] developed a new method to detect Troponin I utilizing two 85
AuNP-antibody conjugates in different pads. The 1st AuNP conjugate was blocked with 86
BSA and it was immobilized at the conjugate pad with an antibody against the antigen 87
chosen. The 2nd AuNP anti-BSA conjugate was designed to bind only with the 1st 88
AuNP conjugate and to enhance the signal. The LFIA method developed in this study is 89
useful since it is a rapid one step analysis with a signal 100-fold more sensitive than the 90
normal LFIA. Similarly, Wiriyachaiporn et al. [24] have recently proposed a double-91
targeted nanogold using the 2nd gold conjugate with anti-biotin instead of anti-BSA. 92
With this approach they demonstrated a 4-fold lower LOD in the detection of influenza 93
virus. Other approaches based on the use of two different AuNPs make use of DNA as 94
crosslinker agent [25,26]. 95
In this study, one new protocol of silver enhancement was developed with the aim 96
of amplifying the signal of colloidal gold on the test strip after the standard assay, 97
avoiding therefore the silver solution handling by the end user. This consisted on 98
immobilizing the silver salt in a separated pad. Results were compared with those 99
obtained by using other protocols reported at the literature. The thick silver layer on the 100
gold nanoparticles endowed particular features, such as colorimetric, electrical and 101
electrochemical properties for quantitative biosensing [27]. Silver has been used as 102
electrochemical label for immunoassays [28,29], and therefore this protocol could be 103
useful to explore the coupling of the strip with an electrochemical transducer in future 104
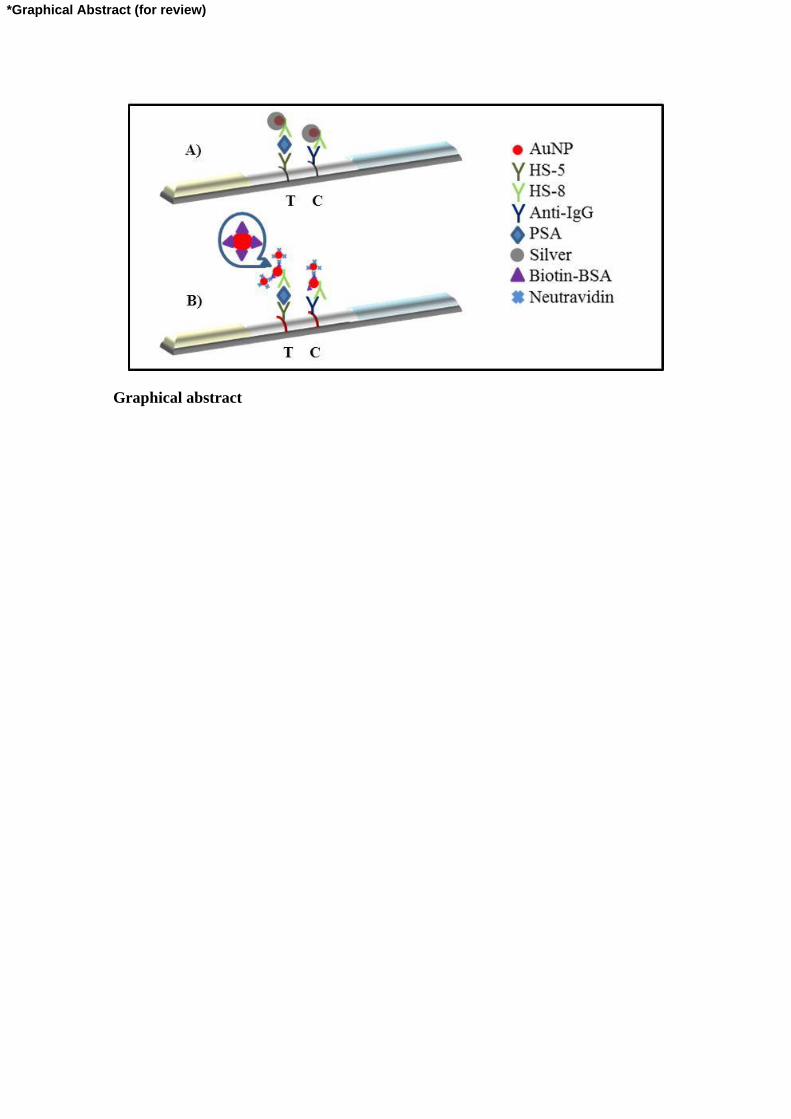
work. A novel gold enhancement system was also developed based on the use of biotin-105
neutravidin bridge. While other methods reported in the literature use secondary 106
antibodies such as anti-BSA or anti-biotin to perform the amplification [23, 24], in this 107
work a new method is presented, potentially more advantageous than others reported 108
previously, because it involves a neutravidin protein instead a specific antibody. As a 109

1 2 3 4 5 6 7 8 9 10 11 12 13 14 15 16 17 18 19 20 21 22 23 24 25 26 27 28 29 30 31 32 33 34 35 36 37 38 39 40 41 42 43 44 45 46 47 48 49 50 51 52 53 54 55 56 57 58 59 60 61 62 63 64 65
model antigen for this immunoassay research, prostate specific antigen (PSA), 110
biomarker of prostate cancer, was used. 111
112
2. Material and methods 113
2.1. Chemicals and reagents 114
Mouse monoclonal anti-PSA antibodies HS-5 (capture antibody) and HS-8 (detection 115
antibody) were produced by Healthsens (Oviedo, Spain). Anti-mouse IgG was 116
purchased from Sigma-Aldrich (Spain). PSA standard solution, calibrated against 117
International Standard Stamey 9010 was obtained from Fujirebio Diagnosis. Gold 118
nanoparticles (AuNP) of 40-nm and 20-nm were purchased from BBInternational (UK) 119
to conjugate the antibody or neutravidin. Bovine serum albumin (BSA), Biotin-120
conjugated bovine serum albumin, AgNO3, hydroquinone, citric acid monohydrate and 121
sodium citrate dehydrate were purchased by Sigma-Aldrich. Neutravidin was purchased 122
by Thermo Fischer Scientific (Massachusetts,USA). Other reagents used in this study 123
were of analytical grade. 124
Nitrocellulose membranes (UniSart CN95) were purchased from Sartorius (Spain). 125
Other materials used were: glass fiber sample pads (GFCP001000, Millipore, 126
Germany), backing cards (KN-V1080, Kenoshatapes, Netherlands) and absorbent pads 127
(Whatman, USA). 128
Based on previous results, the sample buffer consisted of 10mM PBS pH 7.4 with 129
0.05% Tween-20 and 2% BSA. 130
2.2. Equipment 131
An IsoFlow reagent dispensing system (Imagene Technology, USA) was used to 132
dispense the detection line. A guillotine Fellowes Gamma (Spain) was used to cut the 133
strips. To analyze the enhancement procedure, the strip was scanned before and after 134
this step using a HP Officejet Pro 8500A scan. The optical density of the capture image 135
from the signal monitoring window was digitized using ImageJ 1.48v software. 136
137
138

1 2 3 4 5 6 7 8 9 10 11 12 13 14 15 16 17 18 19 20 21 22 23 24 25 26 27 28 29 30 31 32 33 34 35 36 37 38 39 40 41 42 43 44 45 46 47 48 49 50 51 52 53 54 55 56 57 58 59 60 61 62 63 64 65
2.3. Labelling antibody with colloidal gold 139
The desirable concentration of the antibody to stabilize the gold nanoparticles was 140
found following the titration of gold colloid procedure as described in reference [30]. 141
Then, 100L of 150 g/mL HS-8 anti-PSA was added to 1.5mL of gold solution. After 142
shaking for 1h, 100L of the blocking solution Biotin-conjugated BSA (40% v/v ; 143
prepared by mixing 40 L of 1 mg/mL Biotin-conjugated BSA with 60 L of 1 mg/mL 144
BSA in phosphate buffer (PBS 10mM, pH 7.4) was added to the mixture to block the 145
residual surfaces of antibody-colloidal gold conjugated. After 20 min of reaction, the 146
solution was centrifuged at 10,000 rpm for 20 min. The supernatant was discarded and 147
the pellet was resuspended in PBS with 10% sucrose and 1% BSA (100 L). The 148
product (AuNPs-HS-8 conjugate) was then stored at 4ºC until used. 149
2.4. Characterization of nanoparticles conjugates 150
Size distribution and -potential were carried out with a Zetasizer Nano ZS (Malvern) 151
equipped with a solid-state He-Ne laser (= 633) for monitoring the conjugation 152
process. 153
2.5. Preparation of immunostrip 154
The nitrocellulose membrane (NC, 25 mm-wide) was incorporated onto a plastic 155
backing card to give robustness to the membrane. The test zone of the strip was 156
prepared dispensing a desired volume of 1 mg/mL mouse monoclonal HS-5 anti-PSA 157
and anti-IgG to form the test (T) and control (C) lines respectively with the dispenser 158
IsoFlow onto NC membrane at a dispensing rate of 0.100 L/mm and was dried for 20 159
min at 37ºC. The sample pad and the absorbent pad were then settled onto the backing 160
card with an overlap between them of around 2 mm. The complete strip was cut into 161
individual 4 mm strips. The strip was assembled as describe in Figure 1. 162
2.6. Lateral flow immunoassay 163
PSA standard solutions at concentrations of 0, 0.1, 0.5, 1, 4 and 10 ng/mL were 164
prepared by diluting a PSA stock solution in the sample buffer. The amount of BSA and 165
Tween-20 was optimized for this assay, obtaining the best results when 2% BSA and 166
0.05% Tween-20 were added to the PBS. The volume of AuNPs-HS8 conjugate was 167

1 2 3 4 5 6 7 8 9 10 11 12 13 14 15 16 17 18 19 20 21 22 23 24 25 26 27 28 29 30 31 32 33 34 35 36 37 38 39 40 41 42 43 44 45 46 47 48 49 50 51 52 53 54 55 56 57 58 59 60 61 62 63 64 65
also optimized, looking for a compromise between sensitivity and reagent costs. For 168
dipstick analysis, samples were transferred into the microtube containing 10 L of 169
AuNPs-HS-8 conjugate and homogenized (final volume 100 L). Then the dipstick was 170
added into the microtube and the sample was allowed to run for 10 min (Figure 1). The 171
performance of the immunostrip relied on non-competitive assay formats. PSA in the 172
sample was sandwiched between an anti-PSA antibody immobilized on the strip (Test 173
line, T) and the AuNP-conjugated antibody. The unbound AuNP-conjugates migrated 174
further to be captured by anti-mouse immunoglobulin antibodies (Control, C) for 175
system functional verification. Once the test was run, the line intensities were recorded 176
by scanning the images. 177
[ FIGURE 1] 178
2.7. Silver enhancement procedure 179
2.7.a. Immersion 180
The immersion protocol for silver enhancement was carried out according to the 181
literature with some variations [31]. A solution of silver nitrate (0.3 % w/v in water) 182
and other of hydroquinone (3 % w/v in 0.5 M citrate buffer pH 4.0) were prepared and 183
stored at room temperature in the dark. Just before use, the enhancing solution was 184
freshly prepared by 1:1 mixing of the two solutions. 10 min after the addition of the 185
sample, the NC strip was dipped into the microtube containing 100 L of this solution 186
for 10 min. The strip was then scanned to analyze the signal intensity. 187
2.7.b. Sandwich immunochromatographic assay 188
The protocol was executed as described elsewhere [22]. A glass fiber pad (4x10 mm) 189
was washed with distilled water and immersed in a silver nitrate solution (0.3 % w/v in 190
water). Another pad with the same dimensions was saturated with the reducing agent 191
(3% w/v hydroquinone in 0.5 M citrate buffer pH 4.0). Both pads were dried at room 192
temperature in the dark and kept in those conditions until use. After 10 min of the 193
sample adding, the test zone on the NC membrane was covered by the silver pad, and 194
then the reducer pad was placed above it. Once the pads were located forming a 195
sandwich in the strip, 100 L of distilled water was added to the pads. After 10 min, the 196
strip was scanned to measure the optical density of the stain. 197

1 2 3 4 5 6 7 8 9 10 11 12 13 14 15 16 17 18 19 20 21 22 23 24 25 26 27 28 29 30 31 32 33 34 35 36 37 38 39 40 41 42 43 44 45 46 47 48 49 50 51 52 53 54 55 56 57 58 59 60 61 62 63 64 65
2.7.c. Conjugated pad modified with silver 198
In order to perform this assay, the silver salt for silver enhancement was incorporated 199
into the device itself. A glass fiber sample pad (4x10 mm) was washed with different 200
solutions to study the release of the silver from the pad and was immersed in a silver 201
nitrate solution (0.3 % w/v in water). It was dried at room temperature in the dark and 202
placed in the strip in the place of the sample pad. The strip should be kept in the dark 203
until use. The test was carried out as described in part 2.5. After running the test, 50 μl 204
of 3 % w/v hydroquinone in 0.5 M citrate buffer pH 4.0 were added in the microtube. 205
Line intensities were recorded by scanning images after 10 min. 206
207
2.8. Gold enhancement procedure 208
In this assay, two AuNP conjugates were used. The first conjugate contained a 209
monoclonal antibody against the analyte in the same way as in previous assays. The 210
second conjugate is prepared by conjugation of 20-nm AuNP with neutravidin (the 211
conjugation protocol is the same that in the case of AuNP with HS-5 described in part 212
2.3, after the optimization of the neutravidin concentration required to stabilize the 213
gold). This procedure was designed to bind only the first primary AuNP conjugate to 214
improve the signal. The test was carried out as described in part 2.5. Once the test was 215
run, 8 L AuNP-neutravidin conjugate, previously optimized, was added to the 216
microtube containing PBS buffer with 0.05% Tween (final volume 50 L). Line 217
intensities were recorded by scanning images after 10 min. 218
3. Results and Discussion 219
3.1. Characterization of nanoparticles conjugates 220
Dynamic Light Scattering (DLS) measurements were carried out to confirm the 221
conjugation reaction between the gold nanoparticles and the antibody or neutravidin in 222
each case. This technique allows monitoring the size variation of the nanoparticles after 223
the conjugation reaction. Comparing with TEM, the DLS values are expected to be 224
larger due to the double layer which goes into the calculations of the hydrodynamic 225
diameter of the particles in solution. The results showed that the hydrodynamic sizes of 226

1 2 3 4 5 6 7 8 9 10 11 12 13 14 15 16 17 18 19 20 21 22 23 24 25 26 27 28 29 30 31 32 33 34 35 36 37 38 39 40 41 42 43 44 45 46 47 48 49 50 51 52 53 54 55 56 57 58 59 60 61 62 63 64 65
the conjugates were 85.60 nm (PDI 0.180) and 43.88 (PDI 0.230) for AuNP-HS8 and 227
AuNP-Neutravidin respectively. The data from DLS shows that the conjugates are 228
monodisperse (Figure 2). The absence of additional peaks, together with the PDI value 229
obtained, indicate the not presence of aggregates in the solution. The radious observed 230
following conjugation is consistent with the steps carried out, including blocking with 231
BSA. 232
To determinate their stability, -potential measures were carried out. To remain stable, 233
they must have enough repulsion to keep the particles apart. The results showed a -234
potential of -20 mV and -23 mV for AuNP-HS8 and AuNP-Neutravidin respectively, 235
indicating that the conjugates were stable. 236
[FIGURE 2] 237
3.2. Silver immobilization optimization 238
The first step to carry out the silver enhancement was to study the silver immobilization 239
process itself. In order to optimize the silver release from the sample pad, it was treated 240
with different solutions before the immobilization process (water, PBS 10mM with 241
0.05% Tween and PBS 10mM with 1%BSA). Only in the case that the sample pad was 242
treated with BSA, the grey signal produced when the hydroquinone/citrate solution was 243
added in the second step appeared. This could be explained because in the others 244
methods either the immobilization process was less effective or the silver was strongly 245
bond to the sample pad and couldn’t be released from it. Additional experiments were 246
carried out by modifying the sample pad with PBS 10mM with 1%BSA before the 247
silver immobilization. 248
3.3. Gold enhancement procedure 249
Different volumes of AuNP-Neutravidin and different sample buffers were tested in 250
order to obtain the higher amplification. The best results were obtained when 8 L of 251
AuNP-Neutravidin were added to PBS buffer with 0.05% Tween. Higher volumes 252
resulted in a high background, hindering the signal. 253
254
255
1 2 3 4 5 6 7 8 9 10 11 12 13 14 15 16 17 18 19 20 21 22 23 24 25 26 27 28 29 30 31 32 33 34 35 36 37 38 39 40 41 42 43 44 45 46 47 48 49 50 51 52 53 54 55 56 57 58 59 60 61 62 63 64 65
3.4. Comparison of enhancement procedures 256
We compared four signal amplification methods involving gold, silver or both: 257
Immersion in silver hydroquinone/citrate solution, Sandwich immunochromatographic 258
assay, Conjugated pad modified with silver and Gold enhancement procedure (Figure 259
3). In order to compare these different enhancement strategies, and based in previous 260
experiments, we selected a low PSA concentration, which produced a weak red line in 261
the test line, almost undetectable when it was scanned. The concentration chosen was 262
0.5 ng/mL. All the assays were performed by triplicate and were scanned in grey scale 263
with a scan resolution of 2400ppp. The results are shown in Figure 4. The test line 264
intensity was analyzed using ImageJ software. 265
266
[FIGURE 3 and 4] 267
268
Referring to Figure 4, we see that, basing on naked-eye, the higher amplification was 269
obtained using the immersion method. These results were confirmed using the ImageJ 270
software, which showed 3-fold amplification related to the signal obtained when only 271
gold is used. The optical density in this case is higher than in the other amplification 272
methods. The results obtained when the sandwich method was used were good too, but 273
the process is more tedious because it needs more user manipulation to put the two 274
modified pads over the test and control lines. Moreover, it produces a higher 275
background that in the case of the immersion. When silver is immobilized in the 276
conjugate, the signal obtained in the test line is not homogeneous when the first binding 277
assay with AuNP-HS8 is carried out. This is probably due to the non-homogeneous 278
presence of BSA and silver nitrate in the sample pad. This effect also results in a lower 279
sensitivity even before the enhancement step. The assay performed using two gold 280
nanoparticles produced good results. However, they do not reach the amplification level 281
of the silver immersion method. This approach has got the advantage of that it can be 282
performed in a single step, mixing the two conjugates in the microtube before dipping 283
the strip in . The amplification, however, is a bit worst, due probably to some steric 284
impediments. 285
In view of these results, it can be concluded that the immersion in silver and 286
hydroquinone/citrate solution produced low background, and yielded a relatively strong 287

1 2 3 4 5 6 7 8 9 10 11 12 13 14 15 16 17 18 19 20 21 22 23 24 25 26 27 28 29 30 31 32 33 34 35 36 37 38 39 40 41 42 43 44 45 46 47 48 49 50 51 52 53 54 55 56 57 58 59 60 61 62 63 64 65
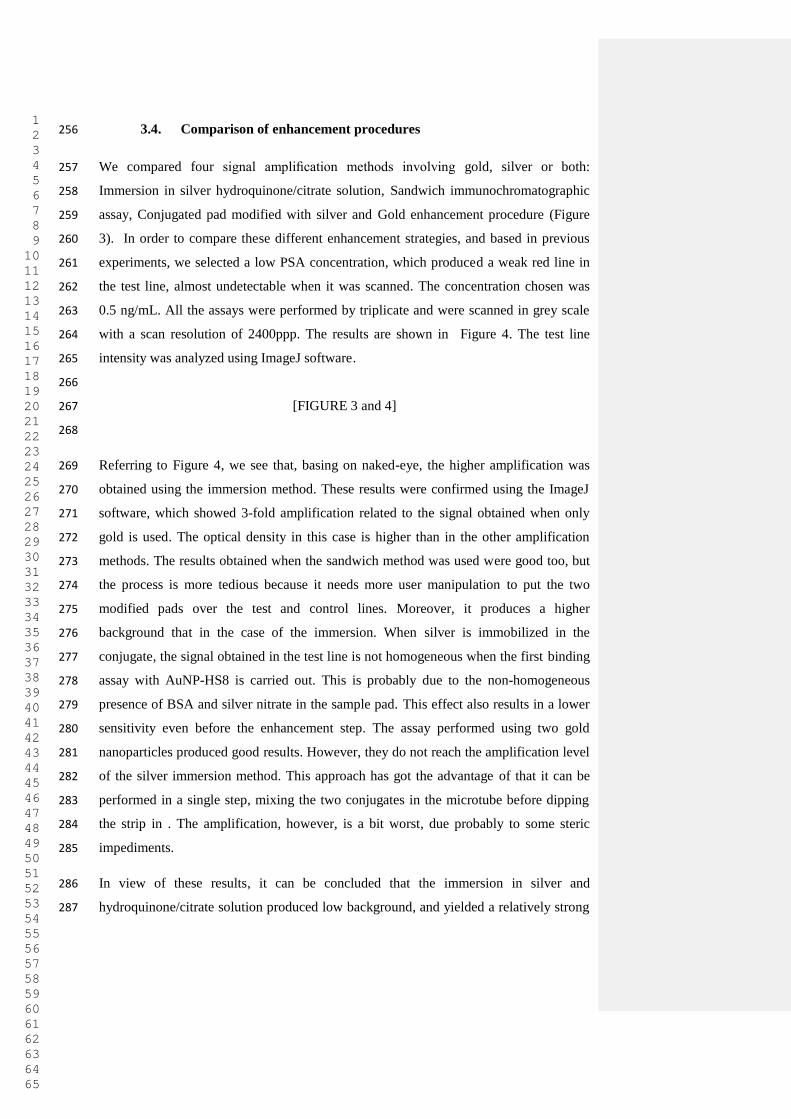
signal, in a simple step consisting in mixing two solutions previously prepared. 288
Therefore this was selected as the best amplification method for further assays. A 289
photograph showing the red and grey-dark test and control lines produced by both gold 290
(primary) and the best silver enhancement method is shown in Figure 5. 291
[ FIGURE 5] 292
293
3.5. Calibration curve with silver enhancement 294
Several standards were prepared by spiking the buffer solution with various 295
concentrations of PSA, and they were assayed by the test strip. Detection limit for the 296
first step (AuNP-HS8 as label) was 0.5 ng/mL by eye-naked. To improve detection 297
limit, the tested strip was dipped in the silver enhancer solution. Using this approach, 298
0.1 ng/ml of PSA was easily detected by naked-eye. Very low non-specific binding is 299
shown in the absence of PSA in the silver enhancement step. The line intensities were 300
recorded before and after the silver enhancement using the HP scan and the intensities 301
were measured using ImageJ software. Results are comparatively shown in Figure 6. 302
303
[ FIGURE 6] 304
305
306
4. Conclusion 307
An enhanced lateral flow immunoassay was successfully developed using different 308
silver staining and one dual gold method as signal amplification strategy to detect PSA. 309
The best results were obtained when the strip was dipped in a second step in a solution 310
containing silver nitrate and hydroquinone/citrate buffer in proportion 1:1. A 3-fold 311
improvement in sensitivity with a detection limit of 0.1 ng/mL of PSA could be 312
achieved by using this approach. The proposed method is simple, convenient, and low 313
cost. The performance of the assay was simple and can be completed in 20 minutes. 314

1 2 3 4 5 6 7 8 9 10 11 12 13 14 15 16 17 18 19 20 21 22 23 24 25 26 27 28 29 30 31 32 33 34 35 36 37 38 39 40 41 42 43 44 45 46 47 48 49 50 51 52 53 54 55 56 57 58 59 60 61 62 63 64 65
This study demonstrated a proof-of-concept of different LFIA amplification procedures, 315
which could be potentially used in other applications. 316
5. Acknowledgments 317
Founding from project CTQ2013-47396-R is acknowledged. M. Oliveira-Rodríguez 318
thanks FICYT for her pre-doctoral grant. 319
6. Conflict of interest 320
All authors declare no conflict of interest 321
322
323
324
325
326
327
328
329
330
331
332
333
334
335
336
7. References 337

1 2 3 4 5 6 7 8 9 10 11 12 13 14 15 16 17 18 19 20 21 22 23 24 25 26 27 28 29 30 31 32 33 34 35 36 37 38 39 40 41 42 43 44 45 46 47 48 49 50 51 52 53 54 55 56 57 58 59 60 61 62 63 64 65
[1] J. Gordon, G. Michel. Analytical Sensitivity Limits for Lateral Flow 338
Immunoassays. Clin. Chem. 54 (2008) 1250-1251. 339
[2] GA. Posthuma-Trumpie, J. Korf J, A. van Amerongen. Lateral flow (immuno)assay: 340
its strengths, weaknesses, opportunities and threats. A literature survey. Anal Bioanal 341
Chem. 393 (2009) 569-582. 342
[3] RH. Shyu, HF. Shyu, HW. Liu, SS. Tang. Colloidal gold-based 343
immunochromatographic assay for detection of ricin. Toxicon 40 (2002) 255-258. 344
[4] S. Goudarzia, A. Ahmadi, M. Farhadi, SK. Kamrava, F. Mobarrez, K. Omidfar. A 345
new gold nanoparticle based rapid immunochromatographic assay for screening EBV-346
VCA specific IgA in nasopharyngeal carcinomas. J. Appl. Biomed. 13 (2015) 123-129. 347
[5] J. Liang H. Liu, C. Lan, Q. Fu, C. Huang, Z. Luo, T. Jiang, Y. Tang. Silver 348
nanoparticle enhanced Raman scattering-based lateral flow immunoassays for ultra-349
sensitive detection of the heavy metal chromium. Nanotechnology 25 (2014) 495501. 350
[6] CW. Yen, H. de Puig, JO. Tam, J- Gómez-Márquez, I. Bosch, K. Hamad-Schifferli, 351
L. Gehrke. Multicolored silver nanoparticles for multiplexed disease diagnostics: 352
distinguishing dengue, yellow fever, and Ebola viruses. Lab Chip 15 (2015) 1638-1641. 353
[7] JH. Cho, EH. Paek, IH. Cho, SH. Paek. An enzyme immunoanalytical system based 354
on sequential cross-flow chromatography. Anal Chem 77 (2005) 4091-4097. 355
[8] ZX. Zou, J. Wang, H. Wang, YQ. Li, Y. Lin. An integrated electrochemical device 356
based on immunochromatographic test strip and enzyme labels for sensitive detection of 357
disease-related biomarkers. Talanta 94 (2012) 58-64. 358
[9] MR. Akanda, HA. Joung, V. Tamilavan, S. Park, S. Kim, MH. Hyun, MG. Kim, H. 359
Yang. An interference-free and rapid electrochemical lateral-flow immunoassay for 360
one-step ultrasensitive detection with serum. Analyst 139 (2014) 1420-1425. 361
[10] C. Liu, Q. Jia, C. Yang, R. Qiao, L. Jing, L. Wang, C. Xu, M. Gao. Lateral Flow 362
Immunochromatographic Assay for Sensitive Pesticide Detection by Using Fe3O4 363
Nanoparticle Aggregates as Color Reagents. Anal Chem 83 (2011) 6778-6784. 364
[11] DB. Wang, B. Tian, ZP. Zhang, JY. Deng, ZQ. Cui, RF Yang, XY. Wang, HP. 365
Wei, XE. Zhang. Rapid detection of Bacillus anthracis spores using a super-366
paramagnetic lateral-flow immunological detection system. Biosens. Bioelectron. 42 367
(2013) 661-667. 368
[12] D. Liu, Y. Huang, S. Wang, K. Liu, M. Chen, Y. Xiong, W. Yang, W. Lai. A 369
modified lateral flow immunoassay for the detection of trace aflatoxin M1 based on 370

1 2 3 4 5 6 7 8 9 10 11 12 13 14 15 16 17 18 19 20 21 22 23 24 25 26 27 28 29 30 31 32 33 34 35 36 37 38 39 40 41 42 43 44 45 46 47 48 49 50 51 52 53 54 55 56 57 58 59 60 61 62 63 64 65
immunomagnetic nanobeads with different antibody concentrations. Food Control 51 371
(2015) 218-224. 372
[13] F. Cimaglia, A. Aliverti, M. Chiesa, P. Poltronieri, E. De Lorenzis, A. Santino, 373
LA. Sechi. Quantum dots nanoparticle-based lateral flow assay for rapid detection of 374
Mycobacterium species using anti-FprA antibodies. Nanotechnology Development 2 375
(2012) e5. 376
[14] X. Li, D. Lu, Z. Sheng, K. Chen, X. Guo, M. Jin, H. Han. A fast and sensitive 377
immunoassay of avian influenza virus based on label-free quantum dot probe and lateral 378
flow test strip. Talanta 100 (2012) 1–6. 379
[15] X. Cao, Y. Ye, S. Liu. Gold nanoparticle-based signal amplification for biosensing 380
Anal Biochem 417 (2011) 1-16. 381
[16] K. Omidfar, S. Kia, S. Kashanian, M. Paknejad, A. Besharatie, S. Kashanian, B. 382
Larijani. Colloidal Nanogold-Based Immunochromatographic Strip Test for the 383
Detection of Digoxin Toxicity. Applied Biochem and Biotechnology 160 (2010) 843-384
855. 385
[17] D. Tang, J.C. Sauceda, Z. Lin, S. Ott, E. Basova, I. Goryacheva, S. Biselli, J. Lin, 386
R. Niessner, D. Knopp. Magnetic nanogold microspheres-based lateral-flow 387
immunodipstick for rapid detection of aflatoxin B2 in food. Biosens. Bioelectron. 25 388
(2009) 514-518. 389
[18] C. Parolo, A. de la Escosura-Muñiz, A. Merkoçi. Enhanced lateral flow 390
immunoassay using gold nanoparticles loaded with enzymes. Biosens. Bioelectron. 40 391
(2013) 412-416. 392
[19] IH. Cho, A. Bhuniac, J. Irudayaraj. Rapid pathogen detection by lateral-flow 393
immunochromatographic assay with gold nanoparticle-assisted enzyme signal 394
amplification. International Journal of Food Microbiology 206 (2015) 60–66. 395
[20] K. Omidfar, F. Khorsand, MD. Azizi. New analytical applications of gold 396
nanoparticles as label in antibody based sensors. Biosens. Bioelectron 43 (2013) 336-397
347. 398
[21] DJ. Chiao, RH. Shyu, CS. Hu, HY. Chiang, SS. Tang. Colloidal gold-based 399
immunochromatographic assay for detection of botulinum neurotoxin type B. J. 400
Chromatogr. B 809 (2004) 37-41. 401
[22] W. Yang, XB. Li, GW. Liu, BB. Zhang, Y. Zhang, T. Kong, JJ. Tang, DN. Li, Z. 402
Wang. A colloidal gold probe-based silver enhancement immunochromatographic assay 403
for the rapid detection of abrin-a. Biosens. Bioelectron. 26 (2011) 3710–3713. 404

1 2 3 4 5 6 7 8 9 10 11 12 13 14 15 16 17 18 19 20 21 22 23 24 25 26 27 28 29 30 31 32 33 34 35 36 37 38 39 40 41 42 43 44 45 46 47 48 49 50 51 52 53 54 55 56 57 58 59 60 61 62 63 64 65
[23] DH. Choi, SK. Lee, YK. Oh, BW. Bae, SD. Lee, S. Kim, YB. Shina, MG. Kim. A 405
dual gold nanoparticle conjugate-based lateral flow assay (LFA) method for the analysis 406
of troponin I. Biosens. Bioelectron. 25 (2010) 1999-2002. 407
[24] N. Wiriyachaiporn, W. Maneeprakorn, C. Apiwat, T. Dharakul. Dual-layered and 408
double-targeted nanogold based lateral flow immunoassay for influenza virus. 409
Microchim Acta (2015) 182: 85-93. 410
[25] G. Shen, S. Zhang, X. Hu. Signal enhancement in a lateral flow immunoassay 411
based on dual gold nanoparticle conjugates. Clinical Biochemistry 46 (2013) 1734–412
1738. 413
[26] J. Zhu, N. Zou, D. Zhu, J. Wang, Q. Jin, J. Zhao, H. Mao. Simultaneous Detection 414
of High-Sensitivity Cardiac Troponin I and Myoglobin by Modified Sandwich Lateral 415
Flow Immunoassay: Proof of Principle. Clinical Chemistry 57 (2011) 1732–1738. 416
[27] R. Liu, Y. Zhang, S. Zhang, W. Qiu, Y. Gao. Silver Enhancement of Gold 417
Nanoparticles for Biosensing: From Qualitative to Quantitative. Applied Spectroscopy 418
Reviews 2014; 49: 121-138. 419
. ern ndez- antos M . onz lez- arc a . osta- arc a. Electrochemical 420
determination of gold nanoparticles in colloidal solutions. Electrochim. Acta 46 (2000) 421
607-615. 422
[29] . Mart nez- aredes M . onz lez- arc a . osta- arc a. Screen-printed 423
electrodes for electrochemical DNA detection, in M. Ozsos (Eds.), Elecrochemical 424
DNA biosensors., Pan Stanford Publishing Pte. Ltd., Singapore, 2012, pp. 291-328. 425
[30] S. Thobhani, S. Attree, R. Boyd, N. Kumarswami, J. Noble, M. Szymanski, RA. 426
Porter. Bioconjugation and characterisation of gold colloid-labelled proteins. Journal of 427
Immunological Methods 356 (2010) 60-69. 428
[31] P. Chun. Colloidal Gold and Other Labels for Lateral Flow Immunoassays, in RC. 429
Wong, HY. Tse (Eds.), Lateral Flow Immunoassay, Springer, New York, 2009, pp. 82-430
83. 431
432
433
434
435
Figure captions 436

1 2 3 4 5 6 7 8 9 10 11 12 13 14 15 16 17 18 19 20 21 22 23 24 25 26 27 28 29 30 31 32 33 34 35 36 37 38 39 40 41 42 43 44 45 46 47 48 49 50 51 52 53 54 55 56 57 58 59 60 61 62 63 64 65
437
Figure 1. 438
A) Schematic representation of the Lateral Flow Immunoassay Dipstick. Specific 439
antibodies against prostate specific antigen (PSA) (Test, T) and anti-mouse 440
immunoglobulin antibodies (Control, C) are immobilized on the membrane. B) 441
Detection of PSA before the amplification procedure. PSA, if present in the sample, 442
form a complex with AuNP-conjugated antibodies and are captured onto the membrane 443
by the immobilized antibodies. C) Dipstick procedure for sample analysis 444
445
446
Figure 2. . 447
Hydrodynamic size distribution profiles of different gold nanoparticles solutions before 448
(denoted as AuNP 40 nm and AuNP 20 nm) and after the conjugation with antibody or 449
neutravidin (denoted as AuNP-HS8 and AuNP-Neu, respectively) 450
451
452
Figure 3. 453
A) Silver enhancement procedure. Reducing reagent and silver ions are applied on the 454
membrane and silver clusters are formed around the AuNP. B) Gold enhancement 455
procedure. A second AuNP-conjugated is added on the membrane and it binds with the 456
AuNP-conjugated antibody immobilized in the test line. 457
458
Figure 4. 459
Results obtained by enhancement process. In each cell of the table, the strip before the 460
amplification process is on the left, and the strip after the amplification is on the right. 461
The strips are accompanied by corresponding signal intensity peaks generated by 462
ImageJ software A) Immersion. B) Sandwich immunochromatographic assay. C) 463
Conjugated pad modified with silver. D) Gold enhancement procedure. Bottom row 464
show the amplification obtained in each case. Both images and the image analysis are 465
representative of three individual experiments. 466
467
468

1 2 3 4 5 6 7 8 9 10 11 12 13 14 15 16 17 18 19 20 21 22 23 24 25 26 27 28 29 30 31 32 33 34 35 36 37 38 39 40 41 42 43 44 45 46 47 48 49 50 51 52 53 54 55 56 57 58 59 60 61 62 63 64 65
Figure 5. Comparison of the test lines obtained in a Lateral Flow Immunoassay 469
Dipstick for PSA (0.5 ng/mL). A) Antibody labelled with AuNP (40nm). B) Silver 470
enhancement signal using the immersion method 471
472
473
Figure 6 Detection of PSA with varying concentrations by LFIA Dipstick and the silver 474
enhancement by immersion. The data points were obtained in triplicate and error bars 475
represent the standard deviations of triplicate runs. Representative examples of results 476
obtained in the strips before and after the silver enhancement process are shown on the 477
right. 478
479
480
481
482

Fig. 1 A) Schematic representation of the Lateral Flow Immunoassay Dipstick.
Specific antibodies against prostate specific antigen (PSA) (Test, T) and anti-mouse
immunoglobulin antibodies (Control, C) are immobilized on the membrane. B)
Detection of PSA before the amplification procedure. PSA, if present in the
sample, forms a complex with AuNP-conjugated antibodies and are captured onto
the membrane by the immobilized antibodies. C) Dipstick procedure for sample
analysis
Figure1

Fig 2. Hydrodynamic size distribution profiles of different gold nanoparticles
solutions before (denoted as AuNP 40 nm and AuNP 20 nm) and after the
conjugation with antibody or neutravidin (denoted as AuNP-HS8 and AuNP-Neu,
respectively)
Figure2

Fig. 3A) Silver enhancement procedure. Reducing reagent and silver ions are
applied on the membrane and silver clusters are formed around the AuNP. B)
Gold enhancement procedure. A second AuNP-conjugated is added on the
membrane and it binds with the AuNP-conjugated antibody immobilized in the
test line.
Figure3

Fig. 4. Results obtained by enhancement process. In each cell of the table, the strip
before the amplification process is on the left, and the strip after the amplification
is on the right. The strips are accompanied by corresponding signal intensity peaks
generated by ImageJ software A) Immersion. B) Sandwich
immunochromatographic assay. C) Conjugated pad modified with silver. D) Gold
enhancement procedure. Bottom row show the amplification obtained in each case.
Both images and the image analysis are representative of three individual
experiments.
Figure4
Fig. 5. Comparison of the test lines obtained in a Lateral Flow Immunoassay
Dipstick for PSA (0.5 ng/mL). A) Antibody labelled with AuNP (40nm). B) Silver
enhancement signal using the immersion method.
Figure5

Fig. 6. Detection of PSA with varying concentrations by LFIA Dipstick and the
silver enhancement by immersion. The data points were obtained in triplicate and
error bars represent the standard deviations of triplicate runs. Representative
example of results obtained in the strips before and after the silver enhancement
process is shown on the right.
Figure6

Potencial Reviewers
Arben Merkoci: [email protected]
Nanobioelectronics & Biosensors Group
Institut Català de Nanociència i Nanotecnologia (ICN2)
Edifici ICN2
Campus de la UAB (delante parque de bomberos)
08193 Bellaterra
Barcelona, Spain
Tel: +34937374604
Duncan Graham: [email protected]
Molecular Nanometrology WestCHEM
Department of Pure and Applied Chemistry
Technology and Innovation Centre University of Strathclyde
99 George Street
Glasgow
Tel: +41 (0)141 548 4701
Fax: +41 (0) 141 552 0876
Jesús M. de la Fuente: [email protected]
Instituto de Nanociencia de Aragon (INA), Universidad de Zaragoza, Campus R ´ ´ıo Ebro,
Edif´ıcio I+D,
Mariano Esquillor, s/n, 50018 Zaragoza, Spain
*List of Three Potential Reviewers
Graphical abstract
*Graphical Abstract (for review)