silica−polyamine-based carbon composite adsorbents as media for effective hydrogen sulfide...
TRANSCRIPT

Silica-Polyamine-Based Carbon Composite Adsorbents as Mediafor Effective Hydrogen Sulfide Adsorption/Oxidation
Teresa J. Bandosz,*,† Mykola Seredych,† Jesse Allen,‡ Jessica Wood,‡ andEdward Rosenberg*,‡
Department of Chemistry, The City College of New York, 138th Street and ConVent AVenue,New York, New York 10031, and Department of Chemistry, UniVersity of Montana,
Missoula, Montana 59812
ReceiVed December 15, 2006. ReVised Manuscript ReceiVed March 7, 2007
New silica-carbon adsorbents were prepared by pyrolysis of silica-polyamine composites at 600°C.The heat treatment was expected to activate nitrogen for effective hydrogen sulfide oxidation. Moreover,the same pyrolysis treatment was applied on silica-polyamine adsorbents previously used to removecopper ions for aqueous solution. The performance of these materials as H2S adsorbents was tested usinga home-developed dynamic breakthrough test. Samples from before and after the adsorption processwere characterized by adsorption of nitrogen, surface pH, thermal analysis, elemental analysis, FTIR,optical microscopy, and solid-state CPMAS13C NMR. Differences in the performance were linked tothe surface properties such as content of nitrogen, content of copper, surface acidity/basicity, and porousstructure. It was found that the capacity for hydrogen sulfide removal/selectivity for oxidation to sulfurdepends on the granulation of the silica matrix, the kind of polymer used for grafting, surface basicity,and porosity. Thermal transformation of the polymer causes the formation of new highly dispersed catalyticcenters with active nitrogen atoms. The silica matrix also provides pore space for the storage of oxidationproducts, mainly elemental sulfur.
1. Introduction
The search for new sources of energy coming frombiomass results in an increased demand for effective removalof pollutants. Examples of these pollutants are sulfur-containing compounds formed during anaerobic digestion ofan organic matter. Such compounds (e.g., hydrogen sulfide,dimethyl sulfide, thiophene, benzothiophenes), besides hav-ing detrimental (acid rain) and toxic effects on the environ-ment, are well-known sources of poisoning for reformingcatalysts. The latter has become a problem when the gasescontaining sulfur even at the parts per billion levels are usedas a source of hydrogen for fuel-cell operation.
Removal of sulfur-containing gases is carried out eitherat ambient or elevated temperatures. Although the former isapplied for desulfurization of air,1,2 natural gas,3-8 orbiogas,9,10 the latter is important in the case of syngas.11
Under ambient conditions, activated carbons with various
surface modifications are used,1 whereas at high temperatures(>400°C), oxide- or ceramic-based membranes were foundto be effective media.11,12
The advantage of activated carbons over oxide-basedadsorbents is in their high surface area and pore volume,where huge amounts of oxidation products can be stored,and in their numerous possibilities for making surfacechemistry modifications.13 Their disadvantage lies in surfaceinstability at high temperatures and strong adsorption forces,which make their in situ regeneration problematic.1,14,15
One of the ways to increase an activated carbon’s capacityfor gas-phase desulfurization is by shifting its surface pHtoward highly basic values, which promotes dissociation ofhydrogen sulfide or methyl mercaptanes.1,16 This is usuallydone via impregnation with caustics1,18,19 or alkali metal
* To whom correspondence should be addressed. Tel: (212) 650-6017 (T.B.);(406) 243-2592 (E.R.). Fax: (212) 650-6107 (T.B.); (406) 243-4227 (E.R.).E-mail: [email protected] (T.B.); [email protected] (E.R.).
† City University of New York.‡ University of Montana.
(1) Bandosz, T. J.J. Colloid Interface Sci.2002, 246, 1.(2) Bagreev, A.; Bandosz, T. J.Ind. Chem. Eng. Res.2005, 44, 530.(3) Coskun, I.; Tollefson, E. L.Can. J. Chem. Eng.1986, 58, 72.(4) Ghosh, T. K.; Tollefson, E. L.Can. J. Chem. Eng.1986, 64, 960.(5) Ghosh, T. K.; Tollefson, E. L.Can. J. Chem. Eng.1986, 64, 969.(6) Dalai, A. K.; Majumadar, M.; Chowdhury, A.; Tollefson, E. L.Can.
J. Chem. Eng.1993, 71, 75.(7) Yang, A.; Tollefson, E. L.; Dalai, A. K.Can. J. Chem. Eng.1998,
76, 76.(8) Dalai, A. K.; Tollefson, E. L.Can. J. Chem. Eng.1986, 76, 902.(9) Bagreev, A.; Katikaneni, S.; Parab, S.; Bandosz, T. J.Catal. Today
2005, 99, 329.(10) Seredych, M.; Bandosz, T. J.Ind. Chem. Eng. Res.2006, 45, 3658.
(11) Flytzani-Stephanopoulos, M.; Sakbodin, M.; Wang, Z.Science2006,312, 1508.
(12) Sirling, D.The Sulfur Problem: Cleaning up Industrial Feedstocks;Royal Commonwealth Society: Cambridge, U.K., 2000.
(13) Bandosz, T. J.; Ania, C. O. Surface Chemistry of Activated Carbonsand its Characterization. InActiVated Carbon Surfaces in EnViron-mental Remediation; Bandosz, T. J., Ed.; Elsevier: Amsterdam, U.K.,2006; pp 159-231.
(14) Bansal, R. C.; Donnet, J. B.; Stoeckli, F.ActiVe Carbon; MarcelDekker: New York, 1988.
(15) Adil, F.; Bagreev, A.; Bandosz, T. J.Ind. Eng. Chem. Res.2000, 39,2439.
(16) Bandosz, T. J. Desulfurization on Activated Carbons. InActiVatedCarbon Surfaces in EnVironmental Remediation; Bandosz, T. J., Ed.;Elsevier: Amsterdam, 2006; pp 231-293.
(17) Bashkova, S.; Bagreev, A.; Bandosz, T. J.Ind. Chem. Eng. Res.2002,41, 4346.
(18) Bagreev, A.; Bandosz, T. J.Ind. Eng. Chem. Res.2002, 41, 672.(19) Adib, F.; Bagreev, A.; Bandosz, T. J.EnViron. Sci. Technol.2000,
34, 686.
2500 Chem. Mater.2007,19, 2500-2511
10.1021/cm062984i CCC: $37.00 © 2007 American Chemical SocietyPublished on Web 04/20/2007

carbonates.20,21 The overall surface pH can be also changedwhen alkaline earth oxides are added as catalysts22 or basicnitrogen-containing species are introduced onto the sur-face.23,24 The latter process is done via impregnation of acarbon surface with nitrogen-containing organic com-pounds followed by their high-temperature conversion to
pyridinyl or quaternary nitrogen.25 These nitrogen centerswere found to be an important factor for activating oxygenand thus enhancing oxidation of reduced sulfur com-pounds.25-27 Another species that was found to play a rolein oxygen activation is copper in a highly dispersed stateon the carbon surface.28 It significantly increases the ef-ficiency of desulfurization adsorbents and its presenceincreases selectivity for elemental sulfur as an oxidationproduct.
(20) Przepiorski, J.; Oya, A.J. Mater. Sci. Lett.1998, 17, 679.(21) Przepiorski, J.; Abe, Y.; Yoshida, S.; Oya, A.J. Mater. Sci. Lett.1997,
16, 1312.(22) Graham, J. Activated carbon for odor control and method for making
some. U.S. Patent 6 858 192, 2005.(23) Hayden, R. A. Process for making catalytic carbon. U.S. Patent
5 444 031, 1995.(24) Adib, F.; Bagreev, A.; Bandosz, T. J.Langmuir2000, 16, 1980.(25) Strohr, B.; Boehm, H. P.; Schlogl, R.Carbon1991, 26, 707.
(26) Biniak, S.; Szymanski, G.; Siedlewski, J.; Swiatkowski, A.Carbon1997, 35, 1799.
(27) Bagreev, A.; Menendez, J. A.; Dukhno, I.; Tarasenko, Y.; Bandosz,T. J. Carbon2004, 42, 469.
(28) Nguyen-Thanh, D.; Bandosz, T. J.Carbon2005, 43, 359.
Figure 1. Organic polyamines grafted to the silica surface.
Silica-Polyamine-Based Carbon Composite Absorbents Chem. Mater., Vol. 19, No. 10, 20072501

The objective of this paper is to evaluate the suitability ofsilica-polyamine-based composite adsorbents as hydrogensulfide removal media. These materials contain a thin carbonlayer with incorporated nitrogen functionalities, which canactivate oxygen.25 Moreover, the silica matrix providesstorage space in large pores (mesopores, mostly in the rangeof 10-30 nm), which might be more effective than the smallpores of activated carbons.29,30Because these silica polyaminecomposites are already designed for use on the industrialscale as adsorbents of copper from mine waters,31 a newwindow of opportunity for an inexpensive way of surfacemodification via incorporation of a catalytically active metalcan also be explored. The results are analyzed from the pointof view of the importance of the surface features for oxida-tion of hydrogen sulfide to elemental sulfur. Another impor-tant aspect of these new materials lies in their greater thermalstability compared with that of activated carbons and thelarge pores in which there are hardly any diffusion limita-tions. The former may indicate an application of this kindof materials for high-temperature desulfurization of syngas.
2. Experimental Section
2.1. Materials.Adsorbents were prepared from silica-polyaminecomposites BP-1, WP-2(A), WP-2(B), and CuWRAM.31 Schematic
structures of the composites are shown in Figure 1. The compositeswere prepared by published literature procedures.31 To produceadsorbents containing copper, we exposed the samples to a cationexchange process with a 3 g/L solution of CuSO4 (10 g ofadsorbents and 100 mL of solution). In all cases, the pyrolysis wasdone in a horizontal furnace under a nitrogen atmosphere with aheating rate 10°/min. The final pyrolysis temperature was 600°Cwith a 0.5 h holding time. The names of adsorbents and their yieldsare collected in Table 1. After exposure to hydrogen sulfide andexhaustion, a letter E is added to the name of the adsorbent.
2.2. Methods.EValuation of H2S Sorption Capacity.A custom-designed dynamic test was used to evaluate the performance ofadsorbents for H2S adsorption from gas streams as describedelsewhere.1 Adsorbent samples were packed into a glass column(length 370 mm, internal diameter 9 mm, bed volume 6 cm3) andpre-humidified with moist air (relative humidity 80% at 25°C) for2 h. The amount of water adsorbed was estimated from the increasein the sample weight. Moist air (relative humidity 70% at 25°C)containing 0.3% (3000 ppm) of H2S was passed through the columnof the adsorbent at 0.5 L/min. The flow rate was controlled usingCole Palmer flow meters. The breakthrough of H2S was monitoredusing electrochemical sensors. The test was stopped at thebreakthrough concentration of 100 ppm. The adsorption capacitiesof each adsorbent in terms of milligrams of hydrogen sulfide pergram of adsorbent were calculated by integration of the area abovethe breakthrough curves and from the H2S concentration in the inletgas, flow rate, breakthrough time, and mass of sorbent. For eachsample, the test was repeated at least twice.
To check the influence of water, the best-performing sampleswere exposed to H2S adsorption from moist air without pre-humidification. Such samples are referred to with an additionalletter D.
Characterization of the Pore Structure of Adsorbents.Sorptionof nitrogen at its boiling point was carried out using ASAP 2010(Micromeritics) on the materials obtained. Before the experiments,the samples were outgassed at 120°C to a constant vacuum (1×10⁻⁴ Torr). From the isotherms, the surface areas (BET method),total pore volumesVt (from the last point of the isotherm at arelative pressure equal to 0.99), volumes of microporesVmic,mesopore volumeVmes, and pore size distributions (PSD) werecalculated.14 The PSDs were calculated using density functionaltheory, DFT.32,33
pH. The pH of an adsorbent was measured in a suspension andprovided information about the acidity and basicity of the carbonsurface. A sample of 0.4 g of the dry carbonized composite powderwas added to 20 mL of distilled water and the suspension was stirredovernight to reach equilibrium. Then the pH of the suspension wasmeasured.
Thermal Analysis.Thermal analysis was carried out using a TAInstruments Thermal Analyzer. The instrument settings were as
(29) Bandosz, T. J.; Block, K.EnViron. Sci. Technol. 2006, 40, 3378.(30) Bandosz, T. J.; Block, K.Ind. Chem. Eng. Res.2006, 45, 3666.(31) (a) Rosenberg, E.; Pang, D. System for extracting soluble heavy metals
from liquid solution. U.S. Patent 5 695 882, 1997. (b) Rosenberg, E.;Pang, D. System for extracting soluble heavy metals from liquidsolutions. U.S. Patent 5 997 748, 1999. (c) Rosenberg, E.; Fischer, R.U.S. Patent 6 576 303, 2003. (d) Hughes, M.; Nielsen, D.; Rosenberg,E.; Gobetto, R.; Viale, A.; Burton, S. D.Ind. Eng. and Chem. Res.2006, 45, 6538.
(32) Lastoskie, Ch. M.; Gubbins, K. E.; Quirke, N.J. Phys. Chem.1993,97, 4786.
(33) Olivier, J. P.J. Porous Mater.1995, 2, 9.
Table 1. Name of Adsorbents (after Pyrolysis “C” is Added in Front of the Initial Sample Name), Nitrogen-Containing Polymer, Granulation,and Yield
sample N-containing polymer granulation (µm) yield (%)
CBP-1 (from BP-1) polyallylamine linear (MW)1500) 150-250 64CBP-1-Cu above+ Cu 68CWP-2A (from WP-2A) polyethyleneimine branched (MW)1200)+ CH2ClCOOH 150-250 66CWP-2A-Cu above+ Cu 150-250 69CWP-2B (from WP-2B) polyethyleneimine branched (MW)1200)+ CH2ClCOOH 250-540 65CWP-2B-Cu above+ Cu 250-540 78CWram (from CuWRAM) polyallylamine linear (MW)1500)+ 2 chloromethyl pyridne 250-500 61CWram-Cu above+ Cu 250-500 66
Table 2. Copper, Carbon, Hydrogen, and Nitrogen Contents (%)after Pyrolysis and Carbon, Hydrogen, and Nitrogen Contents of
Selected Composites prior to Pyrolysis (%)
After Pyrolysis
sample C H N N/C Cu
CBP-1 5.07 0.85 <0.10 0.02CBP-1-Cu 9.61 0.74 0.47 0.05 4.4CWP-2A 8.01 0.78 1.52 0.19CWP-2A-Cu 7.83 1.60 1.57 0.20 3.4CWP-2B 3.60 0.59 0.48 0.13CWP-2B-Cu 3.82 0.41 0.44 0.11 3.4CWram 16.9 1.26 2.29 0.13CWram-Cu 18.2 1.56 2.54 0.14 5.7
Prior to Pyrolysis
sample C H N N/C
BP-1 13.5 2.96 3.85 0.27WP-2A 14.98 3.02 4.32 0.29WP-2B 11.59 3.07 2.92 0.25CuWRAM 16.58 2.29 4.47 0.27
2502 Chem. Mater., Vol. 19, No. 10, 2007 Bandosz et al.

follows: heating rate of 10°C/min and a nitrogen atmosphere witha 100 mL/min flow rate. For each measurement, about 25 mg ofan adsorbent sample was used. Differential thermogravimetriccurves (DTG) were chosen for analysis.
Elemental Analysis.Carbon, hydrogen, and nitrogen content wereestimated by Schwarzkopf Microanalytical Laboratory, Woodside,NY. Copper content was calculated on the basis of the differencesin concentration of copper solution before and after the ion-exchange process. The concentration was evaluated using Smart-Spectro at the wavelength of 410 nm.
Optical Microscopy.Optical microscopy images were obtainedon a Nikon microscope using 5× and 2× magnifications.
FT-IR. FT-IR spectra were obtained on a Thermo-Nicolet 633spectrophotometer as KBr pellets.
CPMAS13C NMR.CPMAS13C NMR were obtained at 125 MHzon a Varian 500 MHz instrument using 4 mm rotor with a spinspeed of 7500 rpm.
3. Results and Discussion
The DTG curves for nitrogen for the initial materials arecollected in Figure 2. Peaks represent mass loss due to thedecomposition of organic matter and dehydroxylation ofsilica. For the BP-1 and CuWRAM series of samples (Figure2A), the peaks are found at about 100°C, between 200 and400°C, and between 400 and 600°C. At temperatures higherthan 600°C, no major mass loss occurs, which was therationale for choosing this temperature as the final pyrolysis
temperature for our samples. Because these two samples havethe same main polymer, polyallyamine (Table 1), we assignthe peak between 200 and 600°C to decomposition of thepolymer manifested by its loss of hydrogen (likely in theform of hydrocarbons) and amine groups as NH3. The latterlikely decomposes at lower temperature.34 This decomposi-tion does not mean that nitrogen is totally removed fromthe sample. It can still be incorporated in various arrange-ments, as amine, pyridinyl, or quaternary nitrogen.25 Differ-ences in intensities of the peaks are related to differences inthe incorporation of polymer onto the silica. As shown inTable 1, in the case of CuWRAM, picolylamine was alsopresent in the system. Addition of copper decreases the massloss, which might be related to the “dilution effect” of copperadded to the mass of the sample. On the other hand, it canstabilize a carbon phase via chelation, and catalyze thegraphitization process.
In the case of the WP-2 series of samples, the decomposi-tion of the polymer occurs in the same temperature range(200-600 °C); however, the peaks are less intense (Figure2B). It is interesting that the composite obtained from silicawith larger particle sizes is thermally more stable and thefirst peak, at about 250°C, practically does not exist. The
(34) Handbook of Chemistry and Physics, 67th ed.; CRC Press: BocaRaton, FL, 1986.
Figure 2. DTG curves in nitrogen for BP-1 and CuWRAM series ofsamples (A) and WP-2 series of samples (B). Figure 3. DTA curves in air for CBP-1 and CWram series of samples (A)
and CWP-2 series of samples (B).
Silica-Polyamine-Based Carbon Composite Absorbents Chem. Mater., Vol. 19, No. 10, 20072503

larger particle size significantly reduces surface area andtherefore polymer loading and this in combination with morerapid diffusion through the sample reduces the intensity ofthis first peak. On the other hand, addition of copper resultsin an increase in the mass loss at 250°C, which may berelated to the decomposition of copper ion-organic phasecomplexes and its catalytic effect on graphitization. In thiscomposite, the amine groups are about 70% modified withacetate groups. It is likely that the first stage of decompositionis decarboxylation of the modified amine sites and this couldexplain the absence of the first nitrogen loss peak (vide infra).
Although in all cases copper incorporation increases theyield of the materials (Table 2A), which might be the resultof its presence and how it affects composite stability, in thecase of CWP-2BCu, an exceptionally high (13%) increasein the weight was found that is in agreement with the datapresented in Figure 2B. Indeed, comparison of the increasesin the yield observed with an increase in the copper content(Table 2) reveals the same trend for all samples but CWP-2BCu, for which the effect of copper on the organic phasemust be different. Here, the initial decomposition phase may
again be decarboxylation and thus nitrogen retention incooperation with the chelation effect could account for thisincreased yield.
The mentioned effects are also seen via analysis of carbon,hydrogen, and nitrogen contents in our samples presentedin Table 2. It is interesting that the highest carbon contentwas found for CWram and the lowest for CWP-2B. Thatsmall amount of carbon present in the latter sample is theresult of lower polymer loading due to the lower surfacearea on the larger particle silica gel. The high content ofcarbon in CWram can be linked to the coexistence of pyridinewith the linear polymer (Figure 1).31 Addition of copperincreases the carbon content only for sample CBP-1. This isconsistent with DTG analysis, where a decrease in theintensity of the peak about 450°C was observed for thesample exposed to copper adsorption (Figure 2A). It isinteresting that for all samples but CBP-1 and CBP-1Cu,the ratio of the content of nitrogen to carbon is over 0.1.
The conclusions from analysis of the DTG data are alsosupported by a comparison of the elemental analysis beforeand after pyrolysis (Table 2b). The carbon content of all the
Figure 4. H2S breakthrough capacity curves.
2504 Chem. Mater., Vol. 19, No. 10, 2007 Bandosz et al.

composites is dramatically reduced except for CuWRAM,where the presence of the aromatic system can nucleate theformation of graphene layers (vide infra). Nitrogen loss isalso much lower for CuWRAM relative to the othercomposites undoubtedly due to the fact that the pyridinylnitrogen is not lost during pyrolysis. Indeed, the N:C ratiois reduced by almost exactly one-half. This is consistent withthe preferential loss of the aliphatic amines. The lowerpolymer loading of the larger particle size WP-2B is evidentfrom its elemental analysis relative to WP-2A. Even moreimportant is the much higher N/C ratios for WP-2A and WP-2B relative to BP-1 after pyrolysis, whereas this ratio isalmost the same prior to pyrolysis (Table 2). This lendscredence to the loss of carbon dioxide as the primarymechanism of decomposition for WP-2A and WP-2B,whereas for BP-1, aliphatic amine loss is the primarydecomposition pathway.
Another important asset of these materials for desulphu-rization is the stability of the carbon layer. Because it wasobtained at 600°C in an inert atmosphere, the stability shouldbe preserved up to this temperature. The situation mightchange in the presence of air or other oxidants. Figure 3shows DTA curves obtained in air where the peaks representthe extent of the exothermic effects. In all cases, addingcopper catalyzes ignition because the temperature of theexotherm decreases and that decrease is up to 100°C.Overall, the silica-nitrogen-containing carbon compositesburn at about 500°C, which is slightly higher than for theaverage activated carbon.35
The features described above, in addition to porosity,should affect the performance of the materials as hydrogensulfide removal media. The H2S breakthrough capacitycurves indicate that the materials differ and the best adsor-bents are CWP-2B and CWP-2BCu (Figure 4). Althoughtheir performance depends on the presence of water in thegas phase, even with dry air, the capacity is higher than thosefor other adsorbents. The breakthrough capacity valuescalculated at 100 ppm H2S in the outlet gas are collected inTable 3, along with the amount of water adsorbed duringthe pre-humidification and the surface pH before and afterhydrogen sulfide adsorption. As expected, the H2S break-through capacity on our samples is related to the surfacehydrophilicity and pH. Although in the case of water a linear
relationship between the capacity and the amount of wateradsorbed is found (Figure 5), in the case of capacity/pHdependence (Figure 6) an indication of a threshold at thepH 9 is revealed. This must be related to formation of HS-
when surface chemistry allows it (the pH is greater thanapparent pKa1 of hydrogen sulfide in the pore system).
The extent of surface hydrophilicity, assuming that carbonlayer covers the pores of silica, is linked to the presence ofnitrogen- and oxygen-containing functional groups.13 Themore heteroatoms that are incorporated into the carbonizedsilica surface as functional groups, the higher the wateradsorption is. The surface pH value is also governed by thosefunctional groups (if they have a distinct acidity or basicity)and the most basic ones are found on CWP-2B in spite ofits low carbon content. This is consistent with the proposeddecarboxylation, which occurs and leaves more nitrogenatoms as amines (vide supra) The most acidic surface is thatof CBP-1, which in fact has the lowest H2S removal capacity.As described elsewhere,1 basic pH in the presence of waterresults in a shift in dissociation of hydrogen sulfide to theright and thus the oxidation efficiency of HS- by oxygen
(35) Van Der Merwe, M.; Bandosz, T. J.J. Colloid Interface Sci.2005,282, 102.
Table 3. Breakthrough Capacity, Amount of Water Adsorbed, andpH Values of the Carbon Surfaces
sample
H2Sbreakthrough
capacity(mg/g)
H2Sbreakthrough
capacity(mg/cm3)
wateradsorbed(mg/g) pH pHE
CBP-1 2 0.7 37 5.6 5.0CBP-1-Cu 40 16 40 5.3 4.8CWP-2A 20 9 53 7.3 6.0CWP-2A-Cu 38 18 59 5.8 5.3CWP-2B 307 170 126 10.2 8.6CWP-2B-Cu 165 91 82 9.8 8.1CWP-2BD 240 135 N.D. 10.2 8.4CWP-2B-CuD 153 83 N.D. 9.8 8.0CWram 54 27 49 7.5 4.2Cwram-Cu 51 24 67 6.1 5.3
Figure 5. Dependence of the H2S breakthrough capacity on the amount ofwater preadsorbed.
Figure 6. Dependence of the H2S breakthrough capacity on the surfacepH of adsorbents.
Silica-Polyamine-Based Carbon Composite Absorbents Chem. Mater., Vol. 19, No. 10, 20072505

increases.1 It is interesting that when the samples were notpre-humidified, their capacity was only 20% less comparedto the situation when pre-humidification was applied. Theseresults differ from those found for activated carbons. Forthem, the pre-humidification step was much more important.1
This must be related to the kinetics of water adsorption andformation of water film. In the case of silica, the bigger poreshelp in establishing the surface layer of water in the smallpores, whereas in the case of activated carbon, this processis usually very slow because of the much smaller pore sizes.37
Addition of copper to the system has a positive effect onthe H2S breakthrough capacities of the CBP-1Cu and CWP-2ACu samples. On the other hand, the capacities of CWP-2BCu and CWram-Cu, however high, were found to decreaseafter this kind of modifications. It is worth mentioning thatfor these two sorbents, similarities in the N:C ratio werefound (Table 2). This suggests that in this particular case,complexation of copper blocks the active nitrogen species,which have their origin in the presence of pyridine or tertiaryamines in the carbon precursor. For the samples in whichcopper significantly enhanced the removal capacity, thebasicity of the nitrogen-containing groups was not enough
to enhance the dissociation of hydrogen sulfide or activeoxygen. Copper added to the system activated oxygen,38,39
which resulted in a capacity on the level of about 30-50mg/g, which was similar for all samples but CWP-2B, whosebehavior as hydrogen sulfide removal media is exceptionallygood.
The CWP-2B sample has a high hydrogen sulfide removalcapacity in spite of its low carbon content. As seen fromTable 3, adsorption of large quantities of hydrogen sulfide(almost 30 wt %) results in only a less than 2 pH unitsdecrease in the surface pH. The fact that the surface remainsbasic suggests oxidation of hydrogen sulfide to elementalsulfur, which was the case for carbon modified withmelamine27 but not for carbon modified with urea, for whichsulfuric acid was the main oxidation product.23
In Figures 7 and 8, DTG curves in nitrogen are presented.Peaks on the curves represent the mass loss as a result ofremoval/decomposition of surface oxidation products. Be-cause our materials were obtained at 600°C, only the features
(36) Brennan, J. K.; Bandosz, T. J.; Thomson, K. M.; Gubbins, K.ColloidSurf., A2001, 539, 187-188.
(37) Harding, A. W.; Foley, N. J.; Norman, P. R.; Francis, D. C.; Thomas,K. M. Langmuir1998, 14, 3858.
(38) Hafen, J. A.; Mahapatra, S.; Wilkinson, E. C.; Kaderli, S.; Young,V., Jr.; Que, L., Jr.; Zuberbuhler, A. D.; Tolman, W. B.Science1996,272, 1397.
(39) Hu, Z.; Williams, R. D.; Tran, D.; Spiro, T.; Gorun, S.J. Am. Chem.Soc.2000, 122, 3556.
(40) Silverstein, R. M.; Bassler, G. C.; Morrill, T. C.SpectroscopicIdentification of Organic Compounds; John Wiley and Sons: NewYork, 1981.
Figure 7. DTG curves in nitrogen for CWram series of samples (A) andCWP-2B series of samples (B) before and after H2S adsorption.
Figure 8. DTG curves in nitrogen for CBP-1 series of samples (A) andCWP-2A series of samples (B) before and after H2S adsorption.
2506 Chem. Mater., Vol. 19, No. 10, 2007 Bandosz et al.
at T < 600 °C can be discussed. The first peak, similar forall samples at about 100°C, represents loss of water andweakly adsorbed SO2. The second peak, between 200 and500 °C is assigned to the removal of elemental sulfur. Itswidth is related the distribution of the pore sizes of theadsorbents. As shown previously,29,30sulfur from larger poresis removed at lower temperature. The order in intensity ofthis peak reflects the order in the values of the breakthroughcapacity of the adsorbents studied. To confirm our assump-tion, the mass balance of sulfur present on the surface ofCWP-2BE is presented in Table 4. Even though the data isnot corrected for the mass loss of the samples not exposedto H2S (as seen form Figure 7 and 8, the mass loss atT <600 °C is minimal), a good agreement in the sulfur massbalance numbers indicates that almost all (about 90%)hydrogen sulfide is converted to elemental sulfur. That sulfurcan be easily removed by heating atT < 400 °C or even at120 °C if a vacuum is applied (during sample outgassingfor porosity measurements, the condensation of elementalsulfur on the walls of the sample tube was noticed).
The elemental sulfur must be stored in the pore system ofthe adsorbents. The values of the structural parameterscalculated from nitrogen adsorption isotherms are presentedin Table 5. The surface areas are 200-450 m2/g, which istypical for mesoporous silicas. In fact, the microporositydegree (Vmic/Vmes) being only between 10 and 20% clearlyshows that the materials studied have the mesoporous
structure with some fraction of micropores. Those pores seemto be the most active in the removal of hydrogen sulfide.For exhausted samples, especially those, which have the highcapacity, the volume of micropores decreased 50% afterhydrogen sulfide reactive adsorption. It has to mentioned herethat that decrease in the volume of pores due to depositionof sulfur is underestimated because some sulfur was removedfrom the samples during outgassing. For CWP-2B, a decreasein the volume of mesopores after H2S adsorption is alsonoticed, suggesting the contribution of their surface to theremoval process and deposition of elemental sulfur there.In fact, to store 30 wt % sulfur, a significant volume of poresis needed. Incorporation of copper does not affect the porosityin a noticeable way. For all samples, the parameters of porousstructure decreased after exposure to H2S.
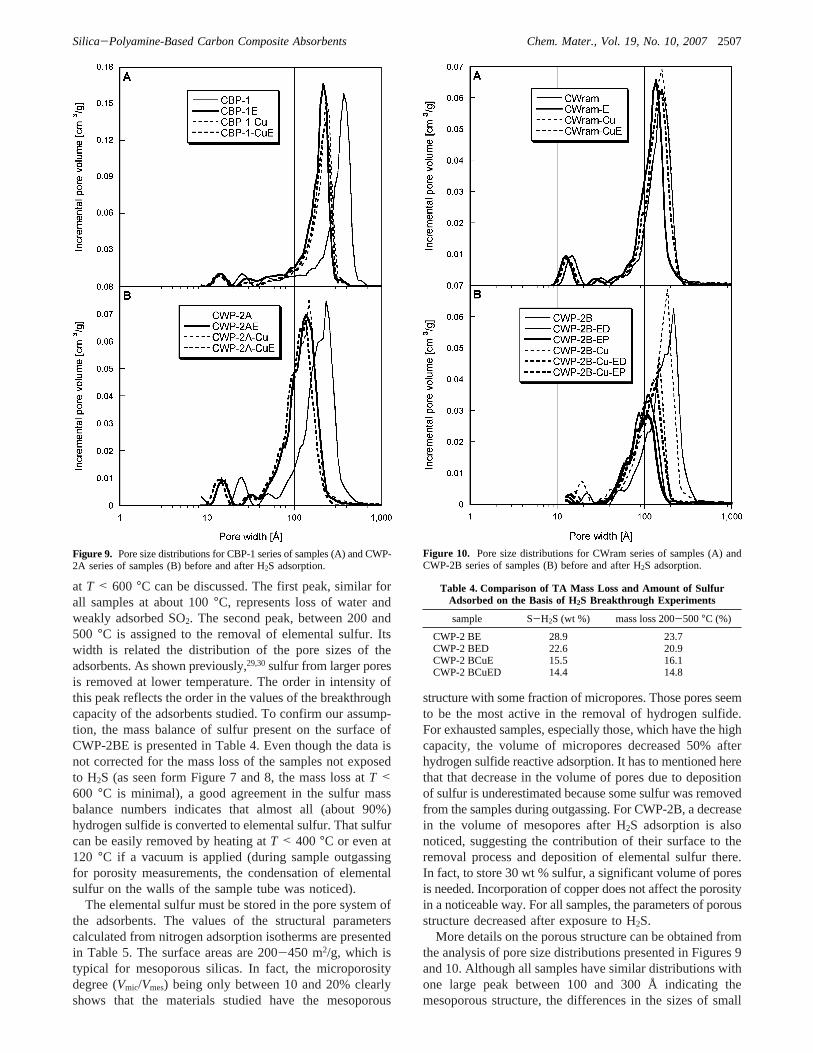
More details on the porous structure can be obtained fromthe analysis of pore size distributions presented in Figures 9and 10. Although all samples have similar distributions withone large peak between 100 and 300 Å indicating themesoporous structure, the differences in the sizes of small
Figure 9. Pore size distributions for CBP-1 series of samples (A) and CWP-2A series of samples (B) before and after H2S adsorption.
Figure 10. Pore size distributions for CWram series of samples (A) andCWP-2B series of samples (B) before and after H2S adsorption.
Table 4. Comparison of TA Mass Loss and Amount of SulfurAdsorbed on the Basis of H2S Breakthrough Experiments
sample S-H2S (wt %) mass loss 200-500°C (%)
CWP-2 BE 28.9 23.7CWP-2 BED 22.6 20.9CWP-2 BCuE 15.5 16.1CWP-2 BCuED 14.4 14.8
Silica-Polyamine-Based Carbon Composite Absorbents Chem. Mater., Vol. 19, No. 10, 20072507

pores and their accessibility are seen. Whereas for linearpolymers the pores between 10 and 20 Å are revealed, forthe branched ones, the very small pores do not existsuggesting the blocking of their entrances by carbon depositsafter pyrolysis. Copper adsorption shifts the distribution tothe left with the highest decrease in the size of pores for theCBP-1 and CWP-2A. This might be related to the differencesin the fluid solid interactions used for PSD calculations andsimilarities in the loading of copper in these two samples.On the other hand, for the CWram and CWP-2B series ofmaterials, the copper uptake does not have a visible effecton the pore size distribution. In the case of CWP-2B samples,a decrease in the intensity and size of pores is observed afterexposure to hydrogen sulfide, which is in agreement withan increasing amount of sulfur deposited in the pores. Thatsulfur is deposited in small micropores (they practicallydisappear after H2S adsorption) and pores larger than 200
Å. Pores of such sizes were also found to be important foradsorption of hydrogen sulfide on sludge-derived samplesexposed to the catalytic surface.29,30Because no dependenceof the capacity on the total pore volume was found, theperformance of these composite samples is apparentlygoverned by surface chemistry of the carbon phase.
The possible reaction paths for adsorbents with basicpyridine-like compounds on the surface are presented inFigure 11. As seen, pyridine-like nitrogen is able to bindhydrogen sulfide even in its undissociated form; however,the compound formed is unstable. A more stable compoundis formed when the sulfide ion is attached to the aromaticring. This species is oxidized in the presence of oxygen andelemental sulfur and OH- ions are the surface reactionproducts and the pyridine-like compound is converted to apyridine phenol. On the other hand, H+ ions in the presence
Figure 11. Possible surface reaction paths. The condensed aromatic rings represent the fragments of graphene layers.
Table 5. Structural Parameters Calculated from Adsorption ofNitrogen at -196 °C
sample SBET
(m2/g)Vmic
(cm3/g)Vmes
(cm3/g)Vt
(cm3/g)Vmic/Vt
(%)CBP-1 395 0.140 1.106 1.106 11CBP-1E 378 0.135 1.084 1.219 11CBP-1-Cu 334 0.127 0.966 1.093 12CBP-1-CuE 290 0.110 0.936 1.046 11CWP-2A 448 0.170 0.772 0.942 18CWP-2AE 396 0.148 0.741 0.889 17CWP-2A-Cu 412 0.157 0714 0.871 18CW-2A-CuE 356 0.132 0.706 0.838 16CWP-2B 261 0.093 0.586 0.679 14CWP-2BE 112 0.047 0.285 0.332 14CWP-2B-Cu 288 0.105 0.611 0.716 15CWP-2B-CuE 149 0.059 0.361 0.420 14CWP-2BD 135 0.055 0.0332 0.387 14CWP-2B-CuD 186 0.072 0.421 0.493 15CWram 305 0.126 0.512 0.638 20CWram-E 228 0.091 0.479 0.570 16CWram-Cu 322 0.133 0.543 0.676 20CWram-CuE 246 0.099 0.521 0.620 16
Figure 12. Optical microscopy images of the surface of the initial adsorbent,CWP-2B (A, B), and that exposed to H2S reactive adsorption, CWP-2BE(C,D).
2508 Chem. Mater., Vol. 19, No. 10, 2007 Bandosz et al.

of water result in formation of pyridineN-oxide. Thesechanges, along with the deposition of sulfur on the activesites, results in exhaustion of the adsorption capacity.
This deposition of sulfur in the crystalline form is seenon the surface of adsorbent particles (Figure 12). Images aand b of Figure 12 show the smooth surface of the silicaspheres. The low carbon content in CW-2B sample causesthe spheres to be translucent. After exposure to hydrogensulfide the surface of the spheres is covered by crystals ofsulfur of various sizes (images c and d of Figure 12). Infact, the sulfur present on the surface is in either therhombohedral or monoclinic form, as seen on X-ray diffrac-tion pattern presented in Figure 13.
The FT-IR and CPMAS12C NMR support the conclusionsreached regarding the surface composition of the pyrolyzedcomposites. The FT-IR of WP-2B, WP-2B-Cu, and WP-2B-EP-H2S samples show a much more intense band at 1635cm-1 compared with those CuWram and BP-1 that can beassigned to the R-N-H bending (Figure 14). The intenseband at 3447 cm-1 is assigned to an overlap between the
N-H and OH stretches from the amines and from adsorbedmoisture. Also notable is the appearance of weak C-Hstretches above 3000 cm-1, indicating the formation ofaromatic moieties on the surface. The pyrolyzed samples ofBP-1 and CuWRAM exhibit only very weak or no absorp-tions at 1635 cm-1, and the intense peak at 3447 cm-1 showsdiminished shouldering, indicating a decrease in the intensityof the N-H stretch for these samples typically observed at3350 cm-1. These assignments are consistent with the higherpH observed for the WP-2 samples and the DTG, both ofwhich suggest that decarboxylation is a major pathway forthe composites containing the amino acetate ligand.
The solid-state CPMAS13C NMR of WP-2A and WP-2Bbefore and after pyrolysis lends further support to theconclusions drawn from the previous data. Prior to pyrolysisWP-2 exhibits a broad envelope of resonances centered at44.5 ppm due to the polyamine carbons, a resonance at-10.3ppm due to the silane methyls on the surface of the silicagel, and a resonance at 161.8 ppm due to the carboxylates(Figure 15a). After pyrolysis, a very broad ill defined
Figure 13. X-ray diffraction pattern for CWP-2B and CWP-2BE.
Figure 14. FT-IR of (a) WP-2B, (b) CWP-2B-Cu, (c) WP-2 EP-H2S-3000.
Silica-Polyamine-Based Carbon Composite Absorbents Chem. Mater., Vol. 19, No. 10, 20072509
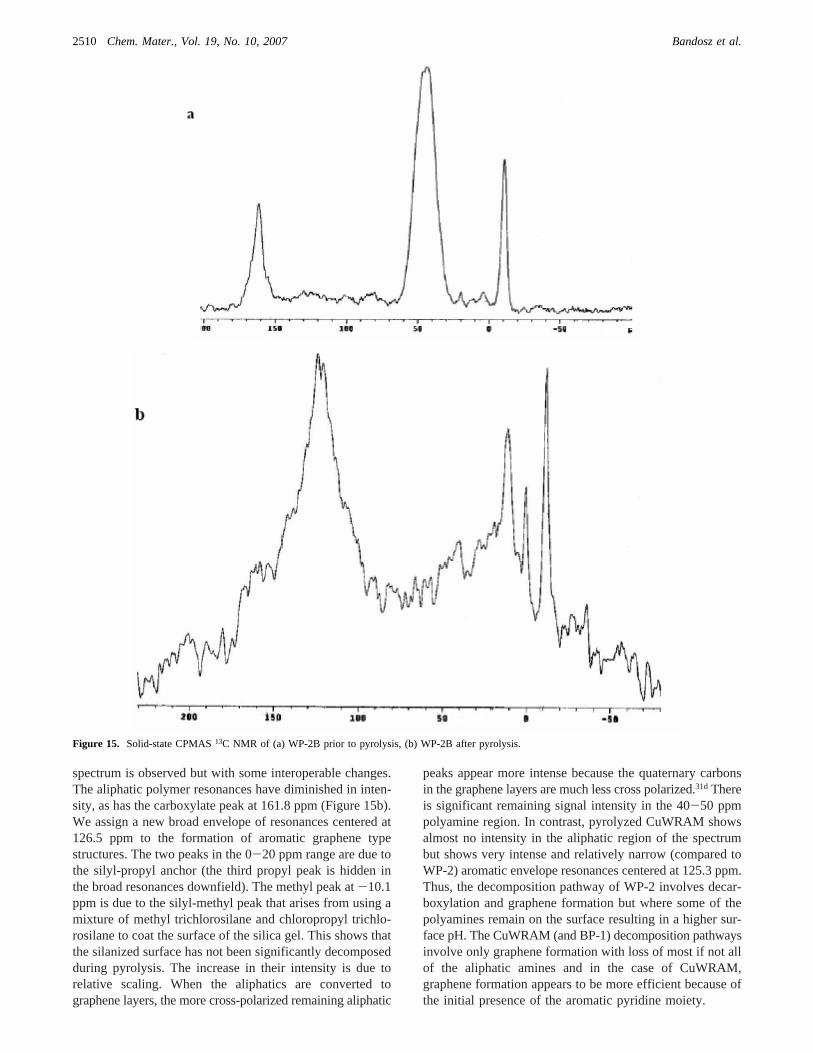
spectrum is observed but with some interoperable changes.The aliphatic polymer resonances have diminished in inten-sity, as has the carboxylate peak at 161.8 ppm (Figure 15b).We assign a new broad envelope of resonances centered at126.5 ppm to the formation of aromatic graphene typestructures. The two peaks in the 0-20 ppm range are due tothe silyl-propyl anchor (the third propyl peak is hidden inthe broad resonances downfield). The methyl peak at-10.1ppm is due to the silyl-methyl peak that arises from using amixture of methyl trichlorosilane and chloropropyl trichlo-rosilane to coat the surface of the silica gel. This shows thatthe silanized surface has not been significantly decomposedduring pyrolysis. The increase in their intensity is due torelative scaling. When the aliphatics are converted tographene layers, the more cross-polarized remaining aliphatic
peaks appear more intense because the quaternary carbonsin the graphene layers are much less cross polarized.31d Thereis significant remaining signal intensity in the 40-50 ppmpolyamine region. In contrast, pyrolyzed CuWRAM showsalmost no intensity in the aliphatic region of the spectrumbut shows very intense and relatively narrow (compared toWP-2) aromatic envelope resonances centered at 125.3 ppm.Thus, the decomposition pathway of WP-2 involves decar-boxylation and graphene formation but where some of thepolyamines remain on the surface resulting in a higher sur-face pH. The CuWRAM (and BP-1) decomposition pathwaysinvolve only graphene formation with loss of most if not allof the aliphatic amines and in the case of CuWRAM,graphene formation appears to be more efficient because ofthe initial presence of the aromatic pyridine moiety.
Figure 15. Solid-state CPMAS13C NMR of (a) WP-2B prior to pyrolysis, (b) WP-2B after pyrolysis.
2510 Chem. Mater., Vol. 19, No. 10, 2007 Bandosz et al.
4. Conclusions
The results presented in this paper indicate the possibilityof application of silica-carbon composites for the processof hydrogen sulfide adsorption/oxidation. Both the silicamatrix and carbon phase contribute to the measured highcapacity (up to 30 wt %). Although the former providesaccessible pores without diffusion limitations, the lattercontributes to specific surface chemistry. That chemistry,based on carbon and nitrogen, via basic pH and activationof oxygen leads to the high removal efficiency with elementalsulfur as the main surface oxidation product. In the caseswhere nitrogen-based chemistry is not able to provide
sufficient surface pH, addition of copper contributes toformation of elemental sulfur in large quantities depositedin the pore system.
Acknowledgment. The authors are grateful to Dr. ChristianKloc of Bell Laboratories, Lucent Technologies, for help inreceiving the optical microscopy images. Help of Dr. VolodymyrTsyalkovsyy from Clemson University in deriving the surfacereaction paths is appreciated. E.R. and J.A. acknowledge theMontana Board of Research and Commercialization Technology,the National Science Foundation, and Purity Systems forsupport.
CM062984I
Silica-Polyamine-Based Carbon Composite Absorbents Chem. Mater., Vol. 19, No. 10, 20072511