significant industries - new york · this report lists significant industries in the long island...
TRANSCRIPT
Significant Industries A Report to the Workforce Development System
The New York State Department of Labor is an Equal Opportunity Employer/Program. Auxiliary aids and services are available upon request to individuals with disabilities.
Long Island | 2015
9/15
1
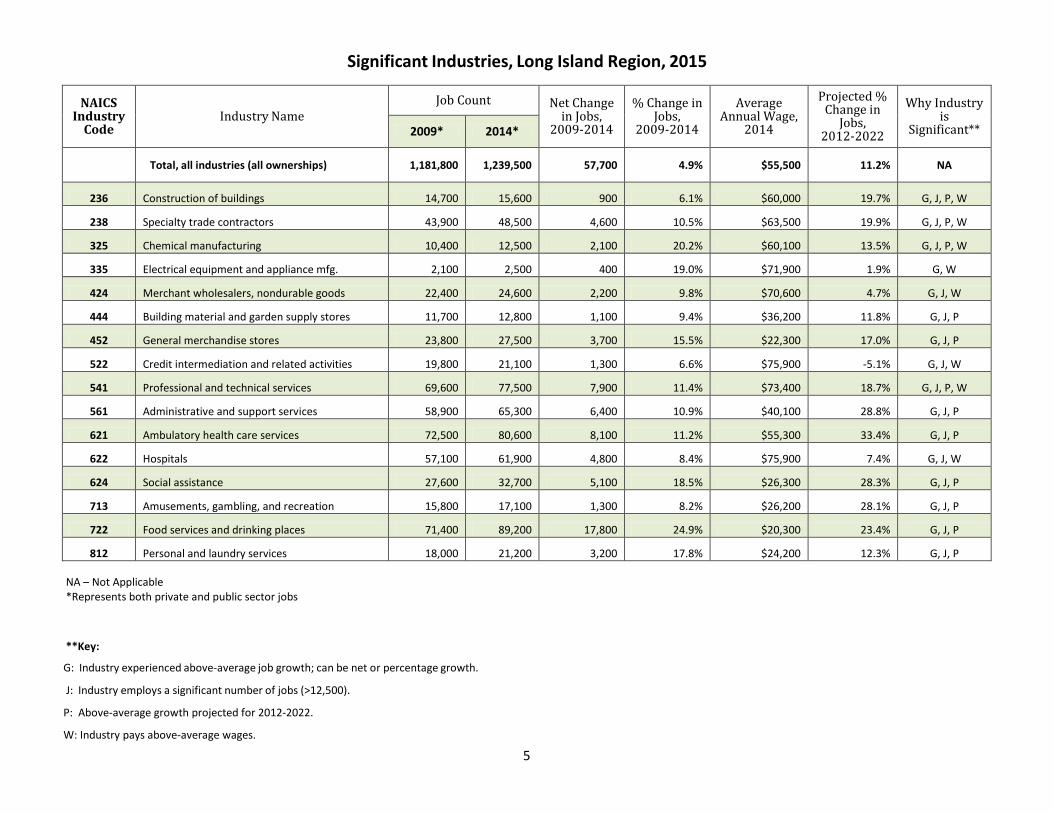
Preface One of the major objectives of the workforce development system is to encourage local workforce investment boards (LWIBs) to plan strategically and focus their resources on priority industries (and eventually on priority occupations within those industries). To assist in this effort, the New York State Department of Labor’s Division of Research and Statistics decided to concentrate this report on industries identified as “significant industries.” Industries presented here are classified according to their North American Industry Classification System (NAICS) code. This report lists significant industries in the Long Island Region based on various criteria. Local workforce investment boards should concentrate their workforce development resources on these particular industries. Significant industries were identified on the basis of job counts, wage levels, job growth (both net and percent) over the 2009-2014 period, and expected job growth based on industry employment projections through 2022. Priority industries that may have been designated by economic development or workforce development officials were also considered. Regional Industries Sixteen regional industries are designated as “significant” in this report. All sixteen of these industries increased their regional employment levels between 2009 and 2014. In addition, 15 of these 16 industries employed at least 12,500 during 2014. Finally, all “significant industries” shared one or more of the following characteristics: rapid growth (percentage basis); large growth (absolute basis); high wages (average annual wage above the regional average of $55,500 in 2014); or strong expected growth through 2022. The specific reason(s) why each industry was designated as “significant” are presented in the last column of the first table. A broad-based set of industries were identified for this report. They fall into eight major industry groups: construction; manufacturing; trade, transportation, and utilities; financial activities; professional and business services (which primarily sell to other businesses); health care and social assistance; leisure and hospitality; and other services. Industry Analysis In the following analysis, industries are presented in ascending NAICS industry code order. For additional information regarding the NAICS industry classification system, visit http://www.census.gov/eos/www/naics/. Construction Skilled trade occupations comprise much of the employment within the construction of buildings (NAICS Industry 236) and specialty trade contractors (NAICS 238) industry categories.
2
The region’s job growth rate in specialty trade contractors, 10.5 percent, was the fastest out of the 10 labor market regions throughout the state over the 2009-2014 time period. Most new construction will be required to meet new high standards for energy efficiency and use of green materials, and this will require some retraining for workers in the industry. Construction activity is booming across a number of sectors including residential projects and health care. Downtown revitalization plans surrounding Long Island Railroad stations should help the construction sector grow. Looking ahead over the next decade, the impending retirement of many baby boomers will contribute to job opportunities in this industry, especially among the skilled trades. Manufacturing Manufacturing on Long Island has undergone significant restructuring in the last decade. The defense-manufacturing industry gave the region a strong base in engineering, and research and product development. Maintaining this critical mass of skills, talent, and innovation can be a strong asset in a world where technology and innovation are critical for economic growth. Long Island’s chemical manufacturing (NAICS 325) industry is the largest out of the 10 regions in the state, and had the second fastest growth rate, 20.2 percent, over the 2009-2014 time period. Activity is concentrated in pharmaceutical and nutraceutical manufacturing. Electrical equipment, appliance, and component manufacturing (NAICS 335), particularly surveillance and systems integration, continues to service both military and civilian product markets. Engineers and computer hardware and software professionals are key to retaining technology in the region. Annual wages in this industry are amongst the highest of the “significant industries” ($71,900) in the Long Island region. Trade, Transportation, and Utilities Merchant wholesalers, nondurable goods (NAICS 424) are often tied to the region’s manufacturing base in medical equipment and supplies, pharmaceuticals, and nutraceuticals. High rents in New York City have forced many wholesalers to relocate their operations to Long Island. Professional and sales positions with technical expertise are important for this industry. Unlike many jobs in retail trade, average annual wages are well paying, 27.2 percent higher than the all-industry average annual wage. The region’s job growth rate for building material and garden equipment and supplies dealers (NAICS 444), 9.4 percent, was the fastest out of the ten regions throughout New York State over the 2009-2014 time period. Expansion by national chains like Home Depot, Lowe’s, etc. played a key role in recent job gains. Assuming a rebound in the housing market, the industry is projected to grow by 11.8 percent between 2012 and 2022. General merchandise stores (NAICS 452) is the second largest industry in the retail trade sector and offers a range of occupations from an entry level cashier to a career in merchandising or finance. As with building material and garden supply stores, the expansion by national chains Walmart, Costco, and other department stores has played a key role in the recent job gains.
3
Financial Activities While the financial activities sector is not expected to return to the high levels of the last decade it remains a critical component of the overall economy. With its high wages and proximity to the larger New York City financial markets, the credit intermediation and related activities industry (NAICS 522) will continue to be a facilitator of economic growth. Professional and Business Services The professional and business services sector includes a range of industries reflecting Long Island’s wide-ranging skills and capabilities in science, engineering, and technology. It also reflects Long Island’s small business-based economy. The professional, scientific, and technical services (NAICS 541) industry sector includes key research and development laboratories as well as companies providing computer systems design, engineering consulting, accounting, and legal services. This industry is the fourth largest employer in the region and pays wages well above the all-industry average annual wage ($73,400). Because services to buildings and dwellings are a large part of administrative and support services, this industry is closely tied to the health of the overall economy. Between 2009 and 2014, the industry grew rapidly gaining more than 6,400 jobs, and it is projected to grow by 28.8 percent. Many of its largest occupations, including janitors and landscaping workers, require only short-term training and offer wages well below the median wage for all occupations. Health Care and Social Assistance Growth in health care industry employment is driven primarily by demographics rather than by overall economic conditions. Many health care occupations are expected to see strong demand over the next decade as the population continues to expand and age. Growth in health care also benefits from continued technological innovation which creates more demand for health care services and requires new types of technical skills. Ambulatory health care services (NAICS 621), which includes doctor and other health care practitioner offices as well as testing and diagnostic laboratories, is both the largest and fastest growing part of the health care sector. Between 2009 and 2014, growth in ambulatory health care services outpaced that in hospitals as pressure mounted to reduce costs by shifting to outpatient care. This trend will continue under health care reform. New technologies will facilitate remote care monitoring and ease the sharing of health care information and treatment expertise. Skill levels are expected to rise for home health care workers, and staffing shortages are expected to increase beyond nursing to include technical occupations and fields such as doctors and surgeons. While employment at hospitals (NAICS 622) is projected to grow at a much slower pace compared to ambulatory health care services (NAICS 621) over the 2012-2022 period (7.4% versus 33.2%), hospitals remain a major employer on Long Island. Average annual wages in this industry are the highest wages of the “significant industries”.

4
More than most industries, health care industries offer a wide range of occupational opportunities. There are health care occupations with large numbers of jobs, or occupations that are rapidly growing and require few skills, but offer low wages (home health aides). There are also technical jobs that require some training and offer average pay (dental assistants) and high wage jobs that require considerable training and educational credentials (registered nurses). These health care industries are also major employers of clerical and administrative workers. Social assistance (NAICS 624) is a large industry that has enjoyed steady growth for many years and is expected to continue to perform well in the future. It is similar to jobs in health care and education in that many of the services this industry provides are not directly tied to the economic cycle, but tend be required even during downturns. Leisure and Hospitality Food services and drinking places (NAICS 722) added the most jobs of any “significant industry”, and is expected to grow faster than the overall economy going forward. This industry has the lowest annual wage of all 16 significant industries. Many of its largest occupations require only short-term training and offer wages well below the median wage for all occupations. However, food services and drinking places also offers considerable opportunity for advancement to a higher-paying supervisory position. It also provides a first job work skills-learning environment for many younger workers. A myriad of beaches and parks on Long Island have helped bolster the region’s amusements, gambling, and recreation (NAICS 713) industry. Employment is projected to grow by 28.1 percent over the 2012-2022 time period. This trend will continue as major investments are taking place throughout the region like Jones Beach and Long Beach. Other Services Other services is a mix of personal and laundry services, auto repair, religious and charitable organizations, and business and civic associations. The largest industry in this sector, personal and laundry services (NAICS 812), is on the significant industries list. An aging population will require more help with their personal care activities. For Further Information It is hoped that the statewide and local workforce investment boards find the information in this report useful. The New York State Department of Labor’s regional labor market analyst for Long Island, Shital Patel, is available for consultation. She can be reached via email at [email protected] or by phone at (516) 934-8533. The statewide report entitled “Significant Industries in New York State: A Report to the Workforce Development System” may be found at http://www.labor.ny.gov/stats/PDFs/Significant-Industries-New-York-State.pdf.
5
Significant Industries, Long Island Region, 2015
NAICS Industry
Code Industry Name
Job Count Net Change in Jobs,
2009-2014
% Change in Jobs,
2009-2014
Average Annual Wage,
2014
Projected % Change in
Jobs, 2012-2022
Why Industry is
Significant** 2009* 2014*
Total, all industries (all ownerships) 1,181,800 1,239,500 57,700 4.9% $55,500 11.2% NA
236 Construction of buildings 14,700 15,600 900 6.1% $60,000 19.7% G, J, P, W
238 Specialty trade contractors 43,900 48,500 4,600 10.5% $63,500 19.9% G, J, P, W
325 Chemical manufacturing 10,400 12,500 2,100 20.2% $60,100 13.5% G, J, P, W
335 Electrical equipment and appliance mfg. 2,100 2,500 400 19.0% $71,900 1.9% G, W
424 Merchant wholesalers, nondurable goods 22,400 24,600 2,200 9.8% $70,600 4.7% G, J, W
444 Building material and garden supply stores 11,700 12,800 1,100 9.4% $36,200 11.8% G, J, P
452 General merchandise stores 23,800 27,500 3,700 15.5% $22,300 17.0% G, J, P
522 Credit intermediation and related activities 19,800 21,100 1,300 6.6% $75,900 -5.1% G, J, W
541 Professional and technical services 69,600 77,500 7,900 11.4% $73,400 18.7% G, J, P, W
561 Administrative and support services 58,900 65,300 6,400 10.9% $40,100 28.8% G, J, P
621 Ambulatory health care services 72,500 80,600 8,100 11.2% $55,300 33.4% G, J, P
622 Hospitals 57,100 61,900 4,800 8.4% $75,900 7.4% G, J, W
624 Social assistance 27,600 32,700 5,100 18.5% $26,300 28.3% G, J, P
713 Amusements, gambling, and recreation 15,800 17,100 1,300 8.2% $26,200 28.1% G, J, P
722 Food services and drinking places 71,400 89,200 17,800 24.9% $20,300 23.4% G, J, P
812 Personal and laundry services 18,000 21,200 3,200 17.8% $24,200 12.3% G, J, P
NA – Not Applicable *Represents both private and public sector jobs
**Key: G: Industry experienced above-average job growth; can be net or percentage growth.
J: Industry employs a significant number of jobs (>12,500).
P: Above-average growth projected for 2012-2022.
W: Industry pays above-average wages.
6
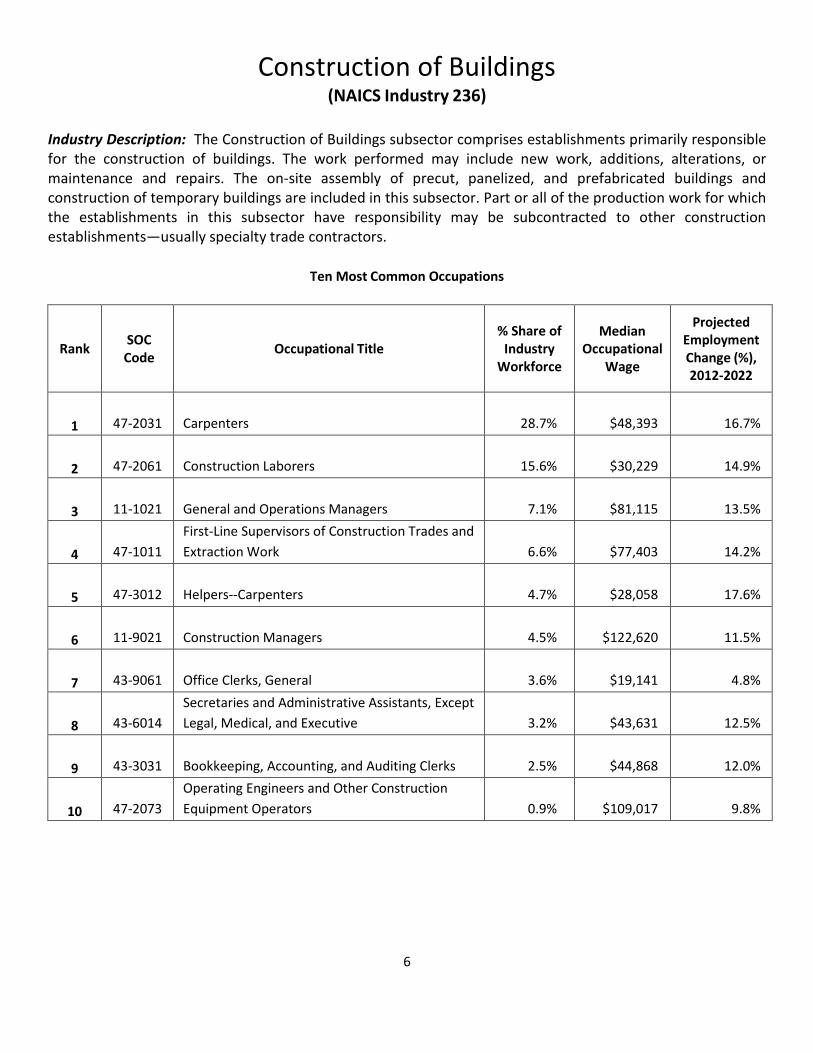
Construction of Buildings (NAICS Industry 236)
Industry Description: The Construction of Buildings subsector comprises establishments primarily responsible for the construction of buildings. The work performed may include new work, additions, alterations, or maintenance and repairs. The on-site assembly of precut, panelized, and prefabricated buildings and construction of temporary buildings are included in this subsector. Part or all of the production work for which the establishments in this subsector have responsibility may be subcontracted to other construction establishments—usually specialty trade contractors.
Ten Most Common Occupations
Rank SOC Code Occupational Title
% Share of Industry
Workforce
Median Occupational
Wage
Projected Employment Change (%), 2012-2022
1 47-2031 Carpenters 28.7% $48,393 16.7%
2 47-2061 Construction Laborers 15.6% $30,229 14.9%
3 11-1021 General and Operations Managers 7.1% $81,115 13.5%
4 47-1011
First-Line Supervisors of Construction Trades and Extraction Work 6.6% $77,403 14.2%
5 47-3012 Helpers--Carpenters 4.7% $28,058 17.6%
6 11-9021 Construction Managers 4.5% $122,620 11.5%
7 43-9061 Office Clerks, General 3.6% $19,141 4.8%
8 43-6014
Secretaries and Administrative Assistants, Except Legal, Medical, and Executive 3.2% $43,631 12.5%
9 43-3031 Bookkeeping, Accounting, and Auditing Clerks 2.5% $44,868 12.0%
10 47-2073
Operating Engineers and Other Construction Equipment Operators 0.9% $109,017 9.8%
7
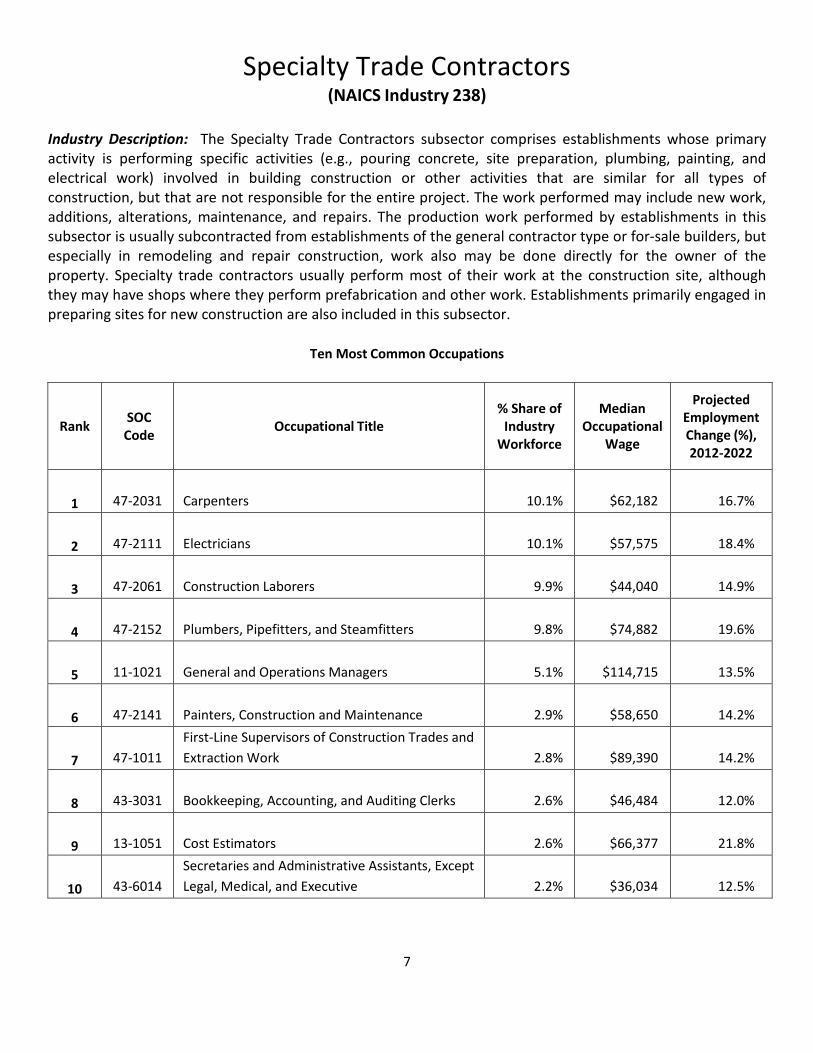
Specialty Trade Contractors (NAICS Industry 238)
Industry Description: The Specialty Trade Contractors subsector comprises establishments whose primary activity is performing specific activities (e.g., pouring concrete, site preparation, plumbing, painting, and electrical work) involved in building construction or other activities that are similar for all types of construction, but that are not responsible for the entire project. The work performed may include new work, additions, alterations, maintenance, and repairs. The production work performed by establishments in this subsector is usually subcontracted from establishments of the general contractor type or for-sale builders, but especially in remodeling and repair construction, work also may be done directly for the owner of the property. Specialty trade contractors usually perform most of their work at the construction site, although they may have shops where they perform prefabrication and other work. Establishments primarily engaged in preparing sites for new construction are also included in this subsector.
Ten Most Common Occupations
Rank SOC Code Occupational Title
% Share of Industry
Workforce
Median Occupational
Wage
Projected Employment Change (%), 2012-2022
1 47-2031 Carpenters 10.1% $62,182 16.7%
2 47-2111 Electricians 10.1% $57,575 18.4%
3 47-2061 Construction Laborers 9.9% $44,040 14.9%
4 47-2152 Plumbers, Pipefitters, and Steamfitters 9.8% $74,882 19.6%
5 11-1021 General and Operations Managers 5.1% $114,715 13.5%
6 47-2141 Painters, Construction and Maintenance 2.9% $58,650 14.2%
7 47-1011 First-Line Supervisors of Construction Trades and Extraction Work 2.8% $89,390 14.2%
8 43-3031 Bookkeeping, Accounting, and Auditing Clerks 2.6% $46,484 12.0%
9 13-1051 Cost Estimators 2.6% $66,377 21.8%
10 43-6014 Secretaries and Administrative Assistants, Except Legal, Medical, and Executive 2.2% $36,034 12.5%
8
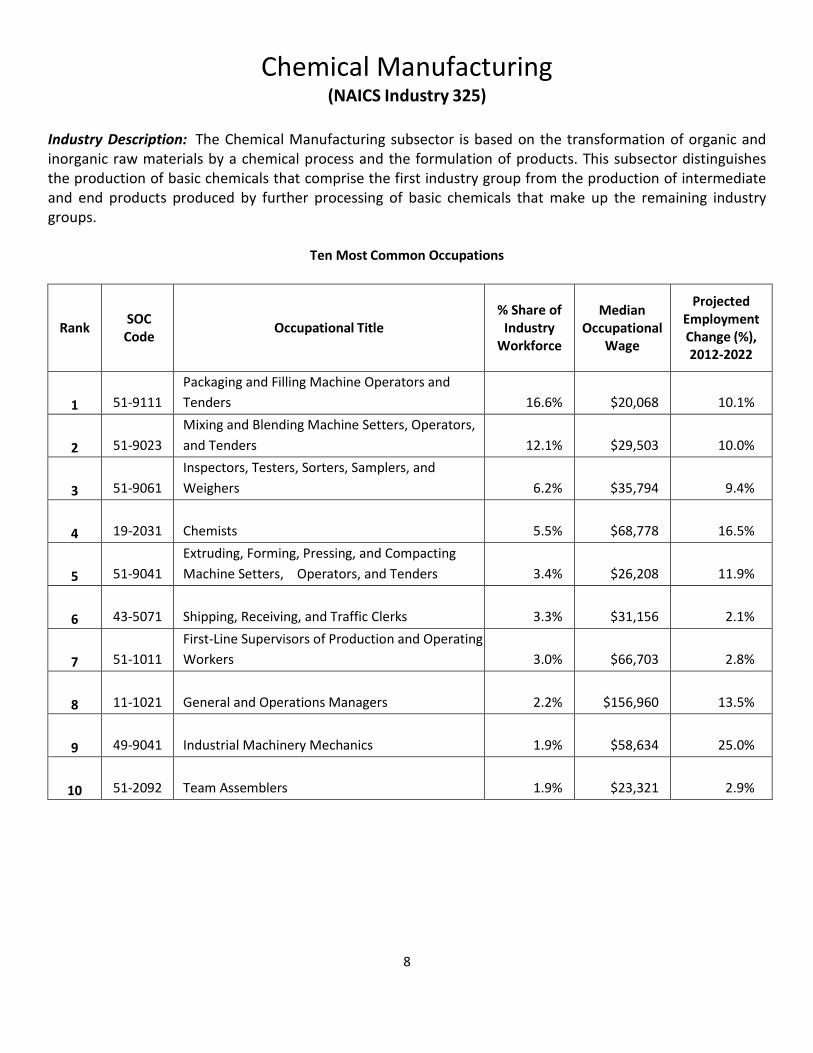
Chemical Manufacturing (NAICS Industry 325)
Industry Description: The Chemical Manufacturing subsector is based on the transformation of organic and inorganic raw materials by a chemical process and the formulation of products. This subsector distinguishes the production of basic chemicals that comprise the first industry group from the production of intermediate and end products produced by further processing of basic chemicals that make up the remaining industry groups.
Ten Most Common Occupations
Rank SOC Code Occupational Title
% Share of Industry
Workforce
Median Occupational
Wage
Projected Employment Change (%), 2012-2022
1 51-9111 Packaging and Filling Machine Operators and Tenders 16.6% $20,068 10.1%
2 51-9023 Mixing and Blending Machine Setters, Operators, and Tenders 12.1% $29,503 10.0%
3 51-9061 Inspectors, Testers, Sorters, Samplers, and Weighers 6.2% $35,794 9.4%
4 19-2031 Chemists 5.5% $68,778 16.5%
5 51-9041 Extruding, Forming, Pressing, and Compacting Machine Setters, Operators, and Tenders 3.4% $26,208 11.9%
6 43-5071 Shipping, Receiving, and Traffic Clerks 3.3% $31,156 2.1%
7 51-1011 First-Line Supervisors of Production and Operating Workers 3.0% $66,703 2.8%
8 11-1021 General and Operations Managers 2.2% $156,960 13.5%
9 49-9041 Industrial Machinery Mechanics 1.9% $58,634 25.0%
10 51-2092 Team Assemblers 1.9% $23,321 2.9%

9
Electrical Equipment, Appliance, and Component Manufacturing
(NAICS Industry 335)
Industry Description: Industries in the Electrical Equipment, Appliance, and Component Manufacturing subsector manufacture products that generate, distribute and use electrical power. Electric Lighting Equipment Manufacturing establishments produce electric lamp bulbs, lighting fixtures, and parts. Household Appliance Manufacturing establishments make both small and major electrical appliances and parts. Electrical Equipment Manufacturing establishments make goods, such as electric motors, generators, transformers, and switchgear apparatus. Other Electrical Equipment and Component Manufacturing establishments make devices for storing electrical power (e.g., batteries), for transmitting electricity (e.g., insulated wire), and wiring devices (e.g., electrical outlets, fuse boxes, and light switches).
Ten Most Common Occupations
Rank SOC Code Occupational Title
% Share of Industry
Workforce
Median Occupational
Wage
Projected Employment Change (%), 2012-2022
1 51-2092 Team Assemblers 12.2% $25,627 2.9%
2 51-2022 Electrical and Electronic Equipment Assemblers 8.2% $25,250 0.0%
3 43-4051 Customer Service Representatives 6.5% $45,421 9.0%
4 13-2011 Accountants and Auditors 4.7% $65,363 17.8%
5 11-1021 General and Operations Managers 4.3% $150,899 13.5%
6 41-4012
Sales Representatives, Wholesale and Manufacturing, Except Technical and Scientific Products 3.9% $82,180 3.9%
7 43-5071 Shipping, Receiving, and Traffic Clerks 3.6% $34,478 2.1%
8 13-1161 Market Research Analysts and Marketing Specialists 2.5% $82,957 27.8%
9 15-1142 Network and Computer Systems Administrators 2.5% $92,219 9.5%
10 17-2141 Mechanical Engineers 2.5% $86,457 4.9%
10
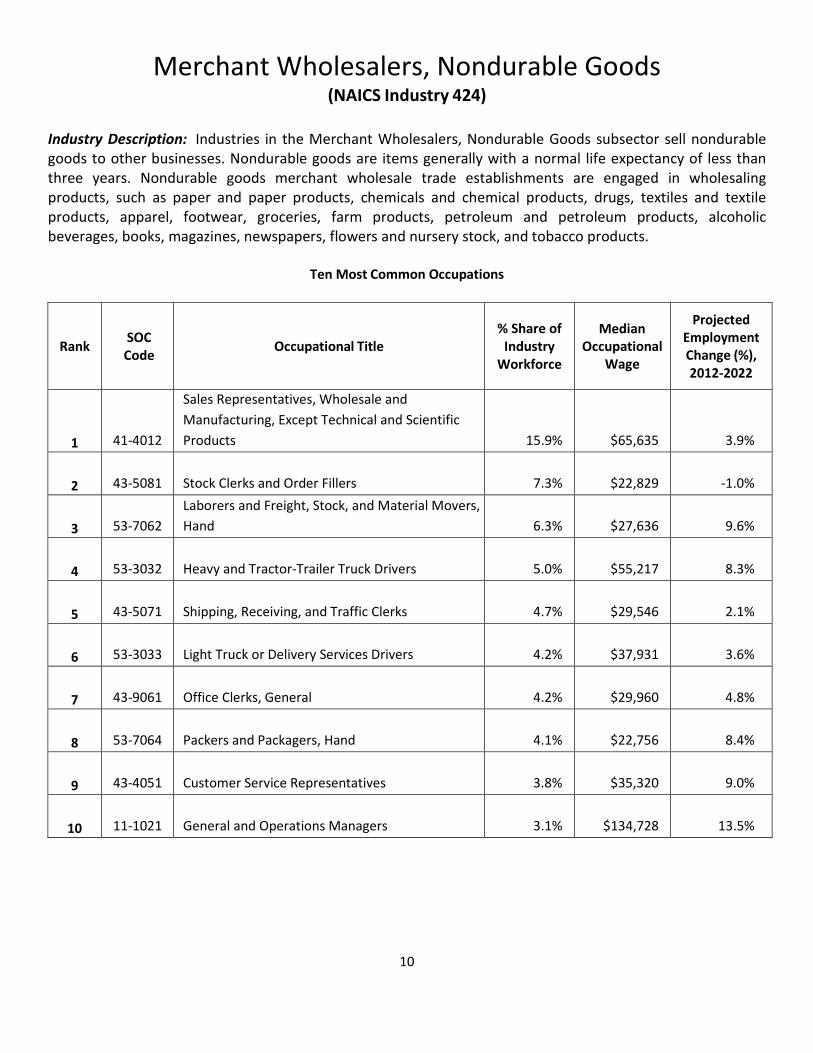
Merchant Wholesalers, Nondurable Goods (NAICS Industry 424)
Industry Description: Industries in the Merchant Wholesalers, Nondurable Goods subsector sell nondurable goods to other businesses. Nondurable goods are items generally with a normal life expectancy of less than three years. Nondurable goods merchant wholesale trade establishments are engaged in wholesaling products, such as paper and paper products, chemicals and chemical products, drugs, textiles and textile products, apparel, footwear, groceries, farm products, petroleum and petroleum products, alcoholic beverages, books, magazines, newspapers, flowers and nursery stock, and tobacco products.
Ten Most Common Occupations
Rank SOC Code Occupational Title
% Share of Industry
Workforce
Median Occupational
Wage
Projected Employment Change (%), 2012-2022
1 41-4012
Sales Representatives, Wholesale and Manufacturing, Except Technical and Scientific Products 15.9% $65,635 3.9%
2 43-5081 Stock Clerks and Order Fillers 7.3% $22,829 -1.0%
3 53-7062 Laborers and Freight, Stock, and Material Movers, Hand 6.3% $27,636 9.6%
4 53-3032 Heavy and Tractor-Trailer Truck Drivers 5.0% $55,217 8.3%
5 43-5071 Shipping, Receiving, and Traffic Clerks 4.7% $29,546 2.1%
6 53-3033 Light Truck or Delivery Services Drivers 4.2% $37,931 3.6%
7 43-9061 Office Clerks, General 4.2% $29,960 4.8%
8 53-7064 Packers and Packagers, Hand 4.1% $22,756 8.4%
9 43-4051 Customer Service Representatives 3.8% $35,320 9.0%
10 11-1021 General and Operations Managers 3.1% $134,728 13.5%
11
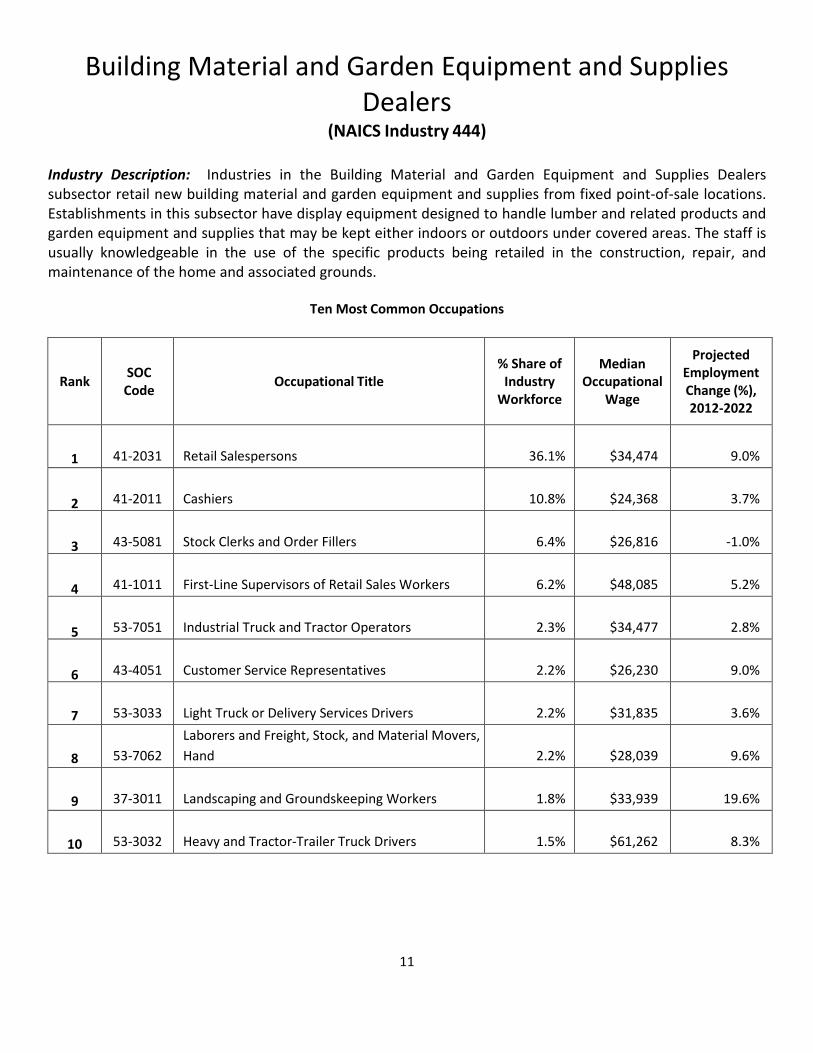
Building Material and Garden Equipment and Supplies Dealers
(NAICS Industry 444)
Industry Description: Industries in the Building Material and Garden Equipment and Supplies Dealers subsector retail new building material and garden equipment and supplies from fixed point-of-sale locations. Establishments in this subsector have display equipment designed to handle lumber and related products and garden equipment and supplies that may be kept either indoors or outdoors under covered areas. The staff is usually knowledgeable in the use of the specific products being retailed in the construction, repair, and maintenance of the home and associated grounds.
Ten Most Common Occupations
Rank SOC Code Occupational Title
% Share of Industry
Workforce
Median Occupational
Wage
Projected Employment Change (%), 2012-2022
1 41-2031 Retail Salespersons 36.1% $34,474 9.0%
2 41-2011 Cashiers 10.8% $24,368 3.7%
3 43-5081 Stock Clerks and Order Fillers 6.4% $26,816 -1.0%
4 41-1011 First-Line Supervisors of Retail Sales Workers 6.2% $48,085 5.2%
5 53-7051 Industrial Truck and Tractor Operators 2.3% $34,477 2.8%
6 43-4051 Customer Service Representatives 2.2% $26,230 9.0%
7 53-3033 Light Truck or Delivery Services Drivers 2.2% $31,835 3.6%
8 53-7062 Laborers and Freight, Stock, and Material Movers, Hand 2.2% $28,039 9.6%
9 37-3011 Landscaping and Groundskeeping Workers 1.8% $33,939 19.6%
10 53-3032 Heavy and Tractor-Trailer Truck Drivers 1.5% $61,262 8.3%
12
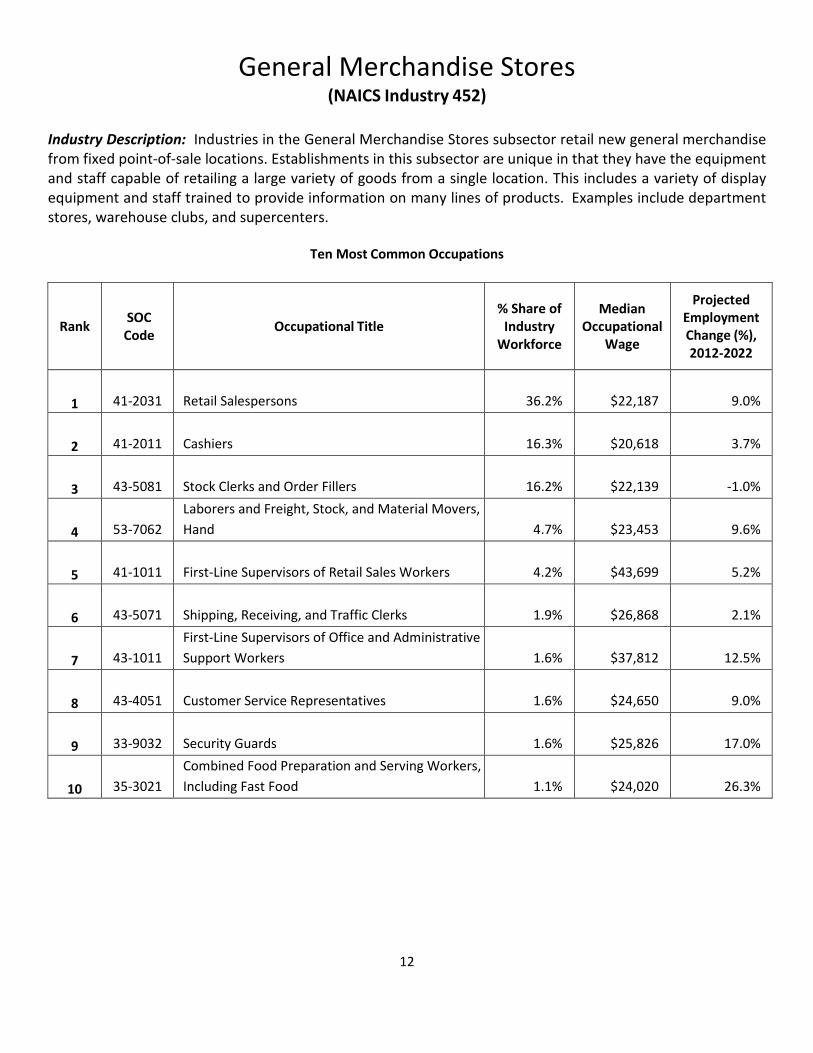
General Merchandise Stores (NAICS Industry 452)
Industry Description: Industries in the General Merchandise Stores subsector retail new general merchandise from fixed point-of-sale locations. Establishments in this subsector are unique in that they have the equipment and staff capable of retailing a large variety of goods from a single location. This includes a variety of display equipment and staff trained to provide information on many lines of products. Examples include department stores, warehouse clubs, and supercenters.
Ten Most Common Occupations
Rank SOC Code Occupational Title
% Share of Industry
Workforce
Median Occupational
Wage
Projected Employment Change (%), 2012-2022
1 41-2031 Retail Salespersons 36.2% $22,187 9.0%
2 41-2011 Cashiers 16.3% $20,618 3.7%
3 43-5081 Stock Clerks and Order Fillers 16.2% $22,139 -1.0%
4 53-7062
Laborers and Freight, Stock, and Material Movers, Hand 4.7% $23,453 9.6%
5 41-1011 First-Line Supervisors of Retail Sales Workers 4.2% $43,699 5.2%
6 43-5071 Shipping, Receiving, and Traffic Clerks 1.9% $26,868 2.1%
7 43-1011
First-Line Supervisors of Office and Administrative Support Workers 1.6% $37,812 12.5%
8 43-4051 Customer Service Representatives 1.6% $24,650 9.0%
9 33-9032 Security Guards 1.6% $25,826 17.0%
10 35-3021
Combined Food Preparation and Serving Workers, Including Fast Food 1.1% $24,020 26.3%
13
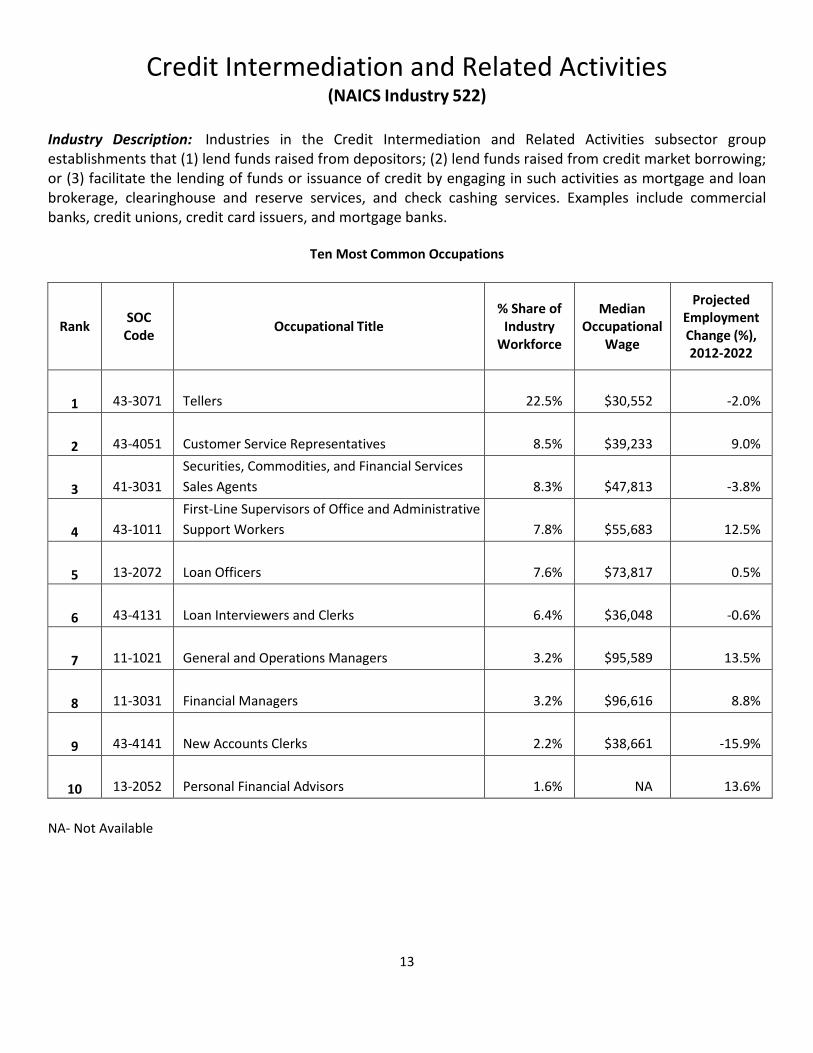
Credit Intermediation and Related Activities (NAICS Industry 522)
Industry Description: Industries in the Credit Intermediation and Related Activities subsector group establishments that (1) lend funds raised from depositors; (2) lend funds raised from credit market borrowing; or (3) facilitate the lending of funds or issuance of credit by engaging in such activities as mortgage and loan brokerage, clearinghouse and reserve services, and check cashing services. Examples include commercial banks, credit unions, credit card issuers, and mortgage banks.
Ten Most Common Occupations
Rank SOC Code Occupational Title
% Share of Industry
Workforce
Median Occupational
Wage
Projected Employment Change (%), 2012-2022
1 43-3071 Tellers 22.5% $30,552 -2.0%
2 43-4051 Customer Service Representatives 8.5% $39,233 9.0%
3 41-3031
Securities, Commodities, and Financial Services Sales Agents 8.3% $47,813 -3.8%
4 43-1011
First-Line Supervisors of Office and Administrative Support Workers 7.8% $55,683 12.5%
5 13-2072 Loan Officers 7.6% $73,817 0.5%
6 43-4131 Loan Interviewers and Clerks 6.4% $36,048 -0.6%
7 11-1021 General and Operations Managers 3.2% $95,589 13.5%
8 11-3031 Financial Managers 3.2% $96,616 8.8%
9 43-4141 New Accounts Clerks 2.2% $38,661 -15.9%
10 13-2052 Personal Financial Advisors 1.6% NA 13.6%
NA- Not Available

14
Professional and Technical Services (NAICS Industry 541)
Industry Description: Establishments in this industry group are engaged in processes where “human capital” is the major input. Firms make available the knowledge and skills of their employees, often on an assignment basis, where an individual or team is responsible for the delivery of services to the client. The distinguishing feature of this industry group is that firms within it are almost wholly dependent on worker skills. Thus, firms here are selling expertise. Examples include legal, accounting, architectural, advertising, scientific R&D, and other professional services.
Ten Most Common Occupations
Rank SOC Code Occupational Title
% Share of Industry
Workforce
Median Occupational
Wage
Projected Employment Change (%), 2012-2022
1 43-6014
Secretaries and Administrative Assistants, Except Legal, Medical, and Executive 7.2% $35,917 12.5%
2 23-1011 Lawyers 6.9% $103,470 11.3%
3 13-2011 Accountants and Auditors 6.5% $84,413 17.8%
4 43-9061 Office Clerks, General 5.2% $28,851 4.8%
5 43-3031 Bookkeeping, Accounting, and Auditing Clerks 4.1% $38,732 12.0%
6 23-2011 Paralegals and Legal Assistants 2.8% $43,901 19.8%
7 43-6012 Legal Secretaries 2.6% $54,750 -0.7%
8 15-1132 Software Developers, Applications 2.5% $76,814 21.5%
9 19-4061 Social Science Research Assistants 2.5% $18,651 27.4%
10 11-1021 General and Operations Managers 2.3% $153,250 13.5%

15
Administrative and Support Services (NAICS Industry 561)
Industry Description: Industries in the Administrative and Support Services subsector group establishments engaged in activities that support the day-to-day operations of other organizations. The processes employed in this sector (e.g., general management, personnel administration, clerical activities, cleaning activities) are often integral parts of the activities of establishments found in all sectors of the economy. Many of the activities performed in this subsector are ongoing routine support functions that all businesses and organizations must do and that they have traditionally done for themselves. Recent trends, however, are to contract or purchase such services from businesses that specialize in such activities and can, therefore, provide the services more efficiently.
Ten Most Common Occupations
Rank SOC Code Occupational Title
% Share of Industry
Workforce
Median Occupational
Wage
Projected Employment Change (%), 2012-2022
1 37-2011
Janitors and Cleaners, Except Maids and Housekeeping Cleaners 15.5% $21,789 15.3%
2 37-3011 Landscaping and Groundskeeping Workers 11.3% $29,494 19.6%
3 33-9032 Security Guards 10.9% $28,269 17.0%
4 43-6014
Secretaries and Administrative Assistants, Except Legal, Medical, and Executive 4.2% $38,738 12.5%
5 43-9061 Office Clerks, General 3.6% $27,618 4.8%
6 43-4051 Customer Service Representatives 3.5% $31,066 9.0%
7 53-7062
Laborers and Freight, Stock, and Material Movers, Hand 2.1% $24,202 9.6%
8 41-3099 Sales Representatives, Services, All Other 2.0% $76,035 12.9%
9 11-1021 General and Operations Managers 1.9% $111,662 13.5%
10 43-1011
First-Line Supervisors of Office and Administrative Support Workers 1.8% $68,127 12.5%
16
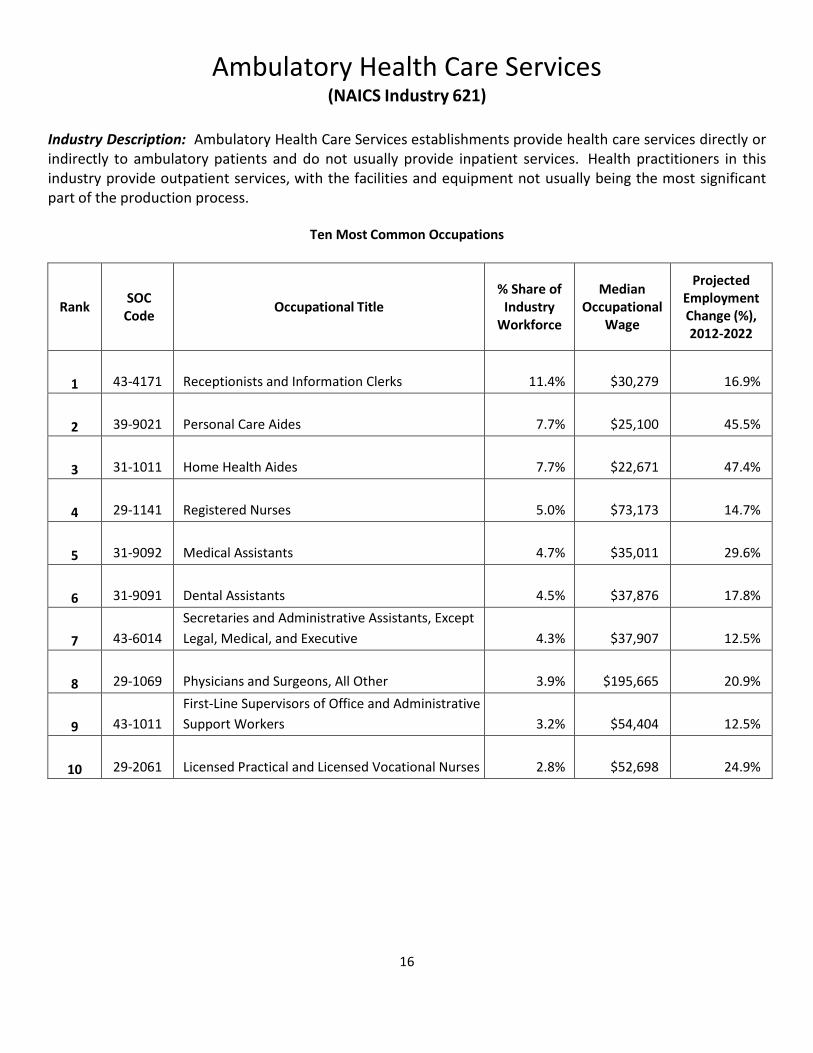
Ambulatory Health Care Services (NAICS Industry 621)
Industry Description: Ambulatory Health Care Services establishments provide health care services directly or indirectly to ambulatory patients and do not usually provide inpatient services. Health practitioners in this industry provide outpatient services, with the facilities and equipment not usually being the most significant part of the production process.
Ten Most Common Occupations
Rank SOC Code Occupational Title
% Share of Industry
Workforce
Median Occupational
Wage
Projected Employment Change (%), 2012-2022
1 43-4171 Receptionists and Information Clerks 11.4% $30,279 16.9%
2 39-9021 Personal Care Aides 7.7% $25,100 45.5%
3 31-1011 Home Health Aides 7.7% $22,671 47.4%
4 29-1141 Registered Nurses 5.0% $73,173 14.7%
5 31-9092 Medical Assistants 4.7% $35,011 29.6%
6 31-9091 Dental Assistants 4.5% $37,876 17.8%
7 43-6014
Secretaries and Administrative Assistants, Except Legal, Medical, and Executive 4.3% $37,907 12.5%
8 29-1069 Physicians and Surgeons, All Other 3.9% $195,665 20.9%
9 43-1011
First-Line Supervisors of Office and Administrative Support Workers 3.2% $54,404 12.5%
10 29-2061 Licensed Practical and Licensed Vocational Nurses 2.8% $52,698 24.9%
17
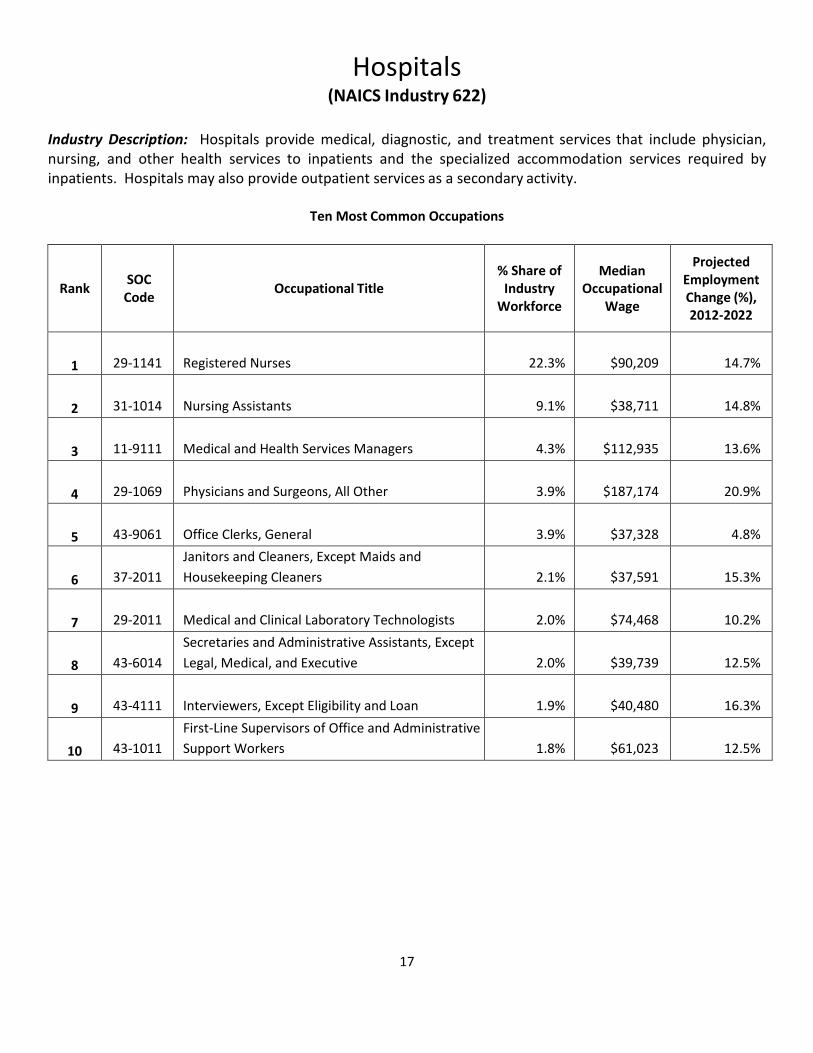
Hospitals (NAICS Industry 622)
Industry Description: Hospitals provide medical, diagnostic, and treatment services that include physician, nursing, and other health services to inpatients and the specialized accommodation services required by inpatients. Hospitals may also provide outpatient services as a secondary activity.
Ten Most Common Occupations
Rank SOC Code Occupational Title
% Share of Industry
Workforce
Median Occupational
Wage
Projected Employment Change (%), 2012-2022
1 29-1141 Registered Nurses 22.3% $90,209 14.7%
2 31-1014 Nursing Assistants 9.1% $38,711 14.8%
3 11-9111 Medical and Health Services Managers 4.3% $112,935 13.6%
4 29-1069 Physicians and Surgeons, All Other 3.9% $187,174 20.9%
5 43-9061 Office Clerks, General 3.9% $37,328 4.8%
6 37-2011
Janitors and Cleaners, Except Maids and Housekeeping Cleaners 2.1% $37,591 15.3%
7 29-2011 Medical and Clinical Laboratory Technologists 2.0% $74,468 10.2%
8 43-6014
Secretaries and Administrative Assistants, Except Legal, Medical, and Executive 2.0% $39,739 12.5%
9 43-4111 Interviewers, Except Eligibility and Loan 1.9% $40,480 16.3%
10 43-1011
First-Line Supervisors of Office and Administrative Support Workers 1.8% $61,023 12.5%
18
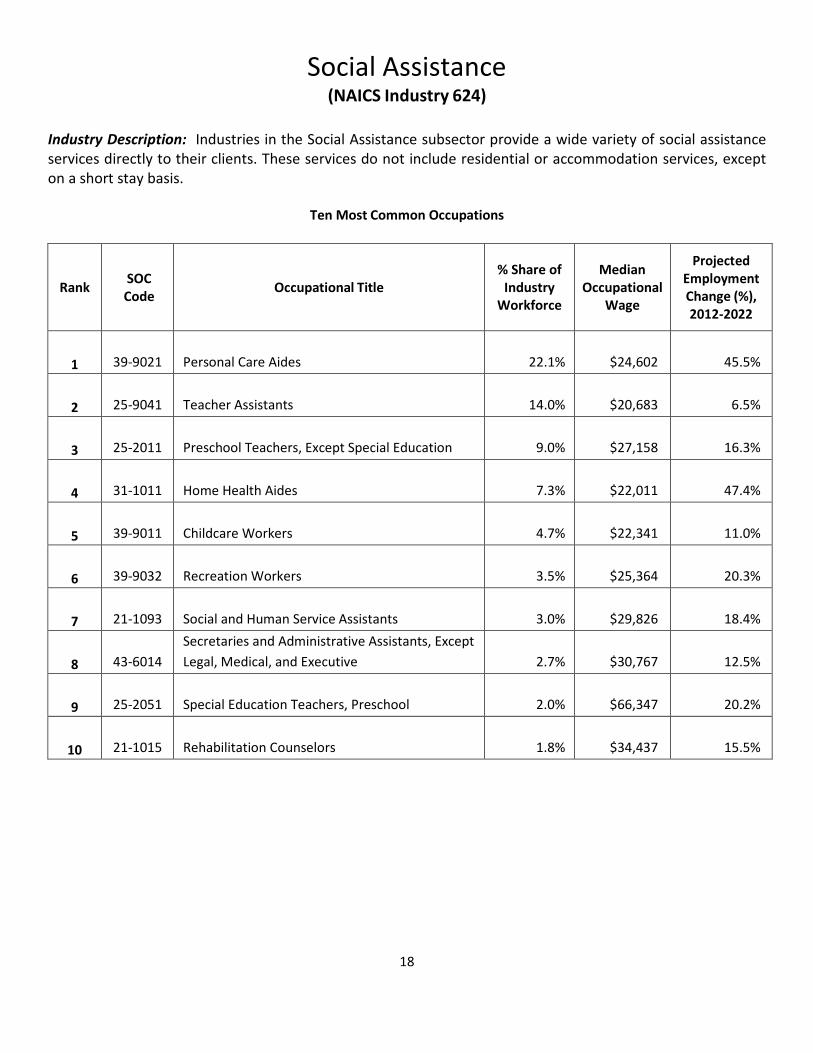
Social Assistance (NAICS Industry 624)
Industry Description: Industries in the Social Assistance subsector provide a wide variety of social assistance services directly to their clients. These services do not include residential or accommodation services, except on a short stay basis.
Ten Most Common Occupations
Rank SOC Code Occupational Title
% Share of Industry
Workforce
Median Occupational
Wage
Projected Employment Change (%), 2012-2022
1 39-9021 Personal Care Aides 22.1% $24,602 45.5%
2 25-9041 Teacher Assistants 14.0% $20,683 6.5%
3 25-2011 Preschool Teachers, Except Special Education 9.0% $27,158 16.3%
4 31-1011 Home Health Aides 7.3% $22,011 47.4%
5 39-9011 Childcare Workers 4.7% $22,341 11.0%
6 39-9032 Recreation Workers 3.5% $25,364 20.3%
7 21-1093 Social and Human Service Assistants 3.0% $29,826 18.4%
8 43-6014
Secretaries and Administrative Assistants, Except Legal, Medical, and Executive 2.7% $30,767 12.5%
9 25-2051 Special Education Teachers, Preschool 2.0% $66,347 20.2%
10 21-1015 Rehabilitation Counselors 1.8% $34,437 15.5%
19
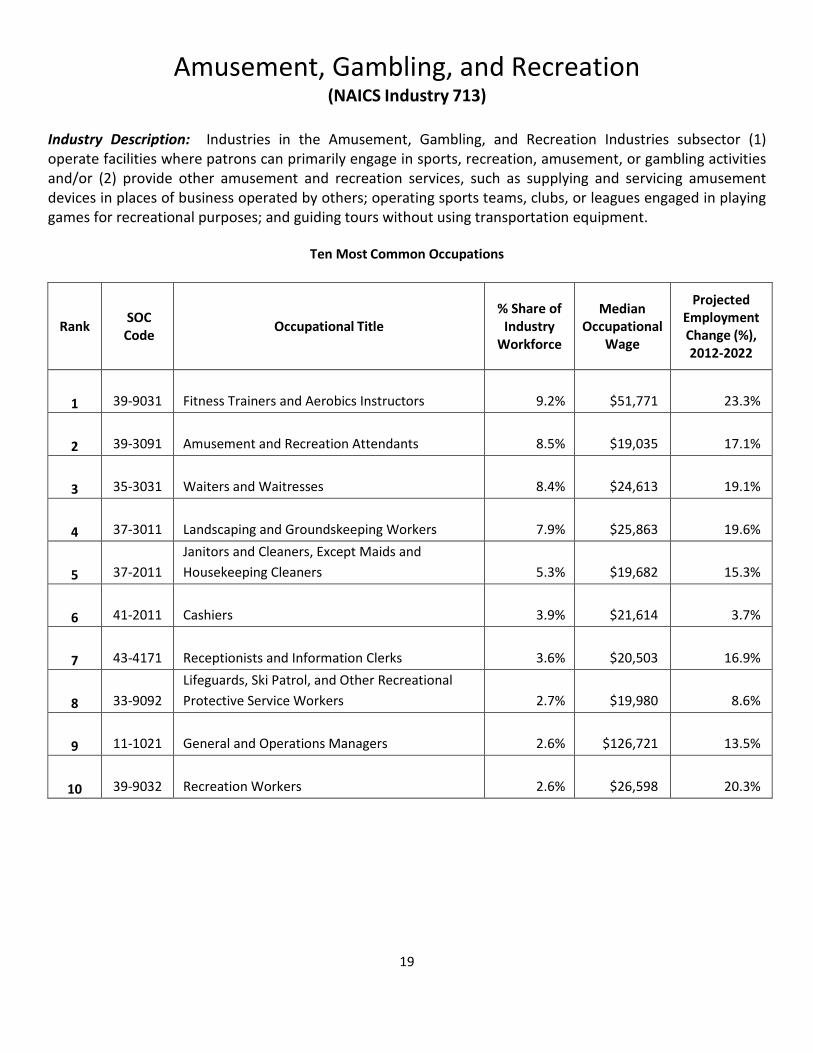
Amusement, Gambling, and Recreation (NAICS Industry 713)
Industry Description: Industries in the Amusement, Gambling, and Recreation Industries subsector (1) operate facilities where patrons can primarily engage in sports, recreation, amusement, or gambling activities and/or (2) provide other amusement and recreation services, such as supplying and servicing amusement devices in places of business operated by others; operating sports teams, clubs, or leagues engaged in playing games for recreational purposes; and guiding tours without using transportation equipment.
Ten Most Common Occupations
Rank SOC Code Occupational Title
% Share of Industry
Workforce
Median Occupational
Wage
Projected Employment Change (%), 2012-2022
1 39-9031 Fitness Trainers and Aerobics Instructors 9.2% $51,771 23.3%
2 39-3091 Amusement and Recreation Attendants 8.5% $19,035 17.1%
3 35-3031 Waiters and Waitresses 8.4% $24,613 19.1%
4 37-3011 Landscaping and Groundskeeping Workers 7.9% $25,863 19.6%
5 37-2011
Janitors and Cleaners, Except Maids and Housekeeping Cleaners 5.3% $19,682 15.3%
6 41-2011 Cashiers 3.9% $21,614 3.7%
7 43-4171 Receptionists and Information Clerks 3.6% $20,503 16.9%
8 33-9092
Lifeguards, Ski Patrol, and Other Recreational Protective Service Workers 2.7% $19,980 8.6%
9 11-1021 General and Operations Managers 2.6% $126,721 13.5%
10 39-9032 Recreation Workers 2.6% $26,598 20.3%
20
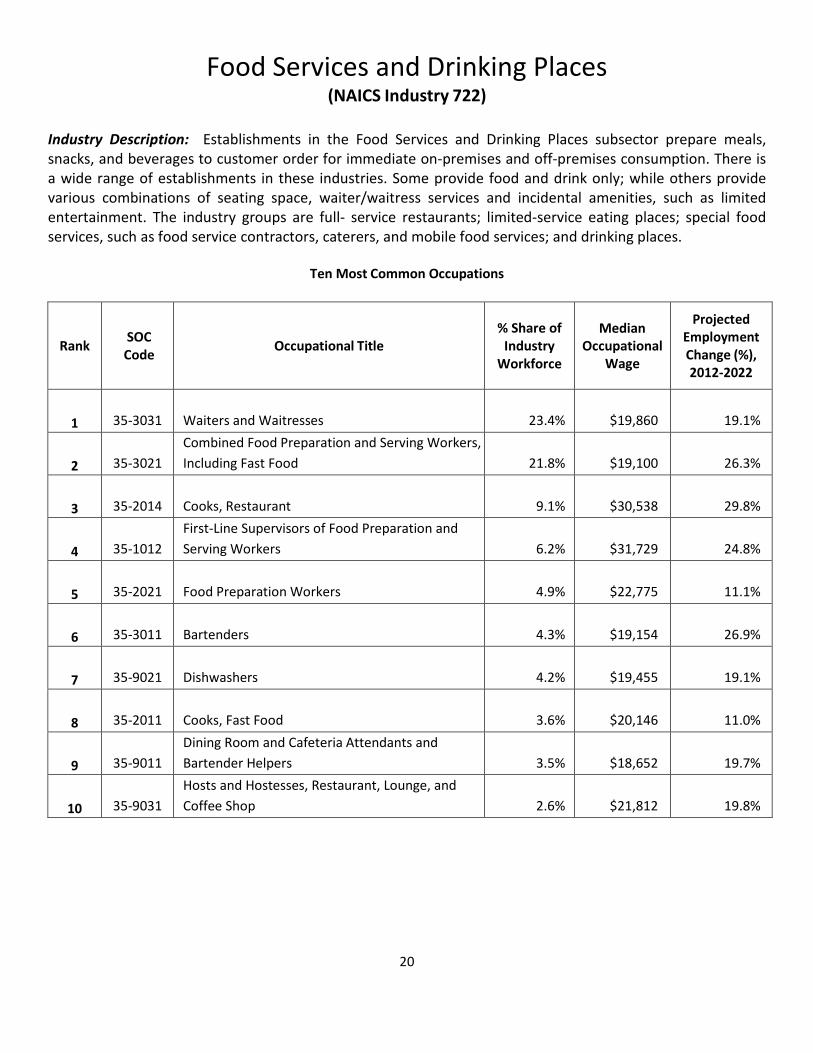
Food Services and Drinking Places (NAICS Industry 722)
Industry Description: Establishments in the Food Services and Drinking Places subsector prepare meals, snacks, and beverages to customer order for immediate on-premises and off-premises consumption. There is a wide range of establishments in these industries. Some provide food and drink only; while others provide various combinations of seating space, waiter/waitress services and incidental amenities, such as limited entertainment. The industry groups are full- service restaurants; limited-service eating places; special food services, such as food service contractors, caterers, and mobile food services; and drinking places.
Ten Most Common Occupations
Rank SOC Code Occupational Title
% Share of Industry
Workforce
Median Occupational
Wage
Projected Employment Change (%), 2012-2022
1 35-3031 Waiters and Waitresses 23.4% $19,860 19.1%
2 35-3021
Combined Food Preparation and Serving Workers, Including Fast Food 21.8% $19,100 26.3%
3 35-2014 Cooks, Restaurant 9.1% $30,538 29.8%
4 35-1012
First-Line Supervisors of Food Preparation and Serving Workers 6.2% $31,729 24.8%
5 35-2021 Food Preparation Workers 4.9% $22,775 11.1%
6 35-3011 Bartenders 4.3% $19,154 26.9%
7 35-9021 Dishwashers 4.2% $19,455 19.1%
8 35-2011 Cooks, Fast Food 3.6% $20,146 11.0%
9 35-9011
Dining Room and Cafeteria Attendants and Bartender Helpers 3.5% $18,652 19.7%
10 35-9031
Hosts and Hostesses, Restaurant, Lounge, and Coffee Shop 2.6% $21,812 19.8%

21
Personal and Laundry Services (NAICS Industry 812)
Industry Description: Industries in the Personal and Laundry Services subsector group establishments that provide personal and laundry services to individuals, households, and businesses. Services performed include: personal care services; death care services; laundry and drycleaning services; and a wide range of other personal services, such as pet care (except veterinary) services, photofinishing services, temporary parking services, and dating services.
Ten Most Common Occupations
Rank SOC Code Occupational Title
% Share of Industry
Workforce
Median Occupational
Wage
Projected Employment Change (%), 2012-2022
1 39-5012 Hairdressers, Hairstylists, and Cosmetologists 19.1% $19,513 12.5%
2 39-5092 Manicurists and Pedicurists 15.6% $19,150 19.0%
3 51-6011 Laundry and Dry-Cleaning Workers 11.2% $20,246 7.6%
4 53-6021 Parking Lot Attendants 5.4% $19,843 8.9%
5 43-4171 Receptionists and Information Clerks 4.3% $23,887 16.9%
6 41-2021 Counter and Rental Clerks 3.5% $20,486 8.7%
7 31-9011 Massage Therapists 3.4% $52,253 23.9%
8 39-2021 Nonfarm Animal Caretakers 3.2% $22,267 14.4%
9 39-1021 First-Line Supervisors of Personal Service Workers 2.3% $45,444 15.3%
10 39-5093 Shampooers 2.3% $19,238 NA
NA- Not Available
This workforce product was funded by a grant awarded by the U.S. Department of Labor's Employment and Training Administration. The product was created by the recipient and does not necessarily reflect the official position of the U.S. Department of Labor. The Department of Labor makes no guarantees, warranties, or assurances of any kind, express or implied, with respect to such information, including any information on linked sites and including, but not limited to, accuracy of the information or its completeness, timeliness, usefulness, adequacy, continued availability, or ownership. This product is copyrighted by the institution that created it. Internal use by an organization and/or personal use by an individual for non-commercial purposes is permissible. All other uses require the prior authorization of the copyright owner.