signal-to-noise ratios for television transmission
TRANSCRIPT

Technical Note
Signal-to-Noise Ratios for Television Transmission
Prepared under Electronic Systems Division Contract AF 19(628)-5167 by
Lincoln Laboratory MASSACHUSETTS INSTITUTE OF TECHNOLOGY
Lexington, Massachusetts
1969-12
L. D. Collins
14 March 1969
AW&

The work reported in this document was performed at Lincoln Laboratory, a center for research operated by Massachusetts Institute of Technology, with the support of the U.S. Air Force under Contract AF 19(628)-5167.
This report may be reproduced to satisfy needs of U.S. Government agencies.
This document has been approved for public release and sale; its distribution is unlimited.

MASSACHUSETTS INSTITUTE OF TECHNOLOGY
LINCOLN LABORATORY
SIGNAL-TO-NOISE RATIOS FOR TELEVISION TRANSMISSION
L. D. COLLINS
Group 67
TECHNICAL NOTE 1969-12
14 MARCH 1969
This document has been approved for public release and sale; its distribution is unlimited.
LEXINGTON MASSACHUSETTS

ABSTRACT
This note is concerned with the effects of random noise interference in
television transmission systems. Such systems are finding increasing application
in surveillance and telefactor systems. Numerous results which have been
scattered throughout the literature are collected and unified. Three topics are
covered:
1. The calculation of the video signal-to-noise ratio for the commonly
used television transmission systems (amplitude and frequency modulation),
2. A summary of the signal-to-noise ratio definitions (including noise
weighting standards) currently in use for video transmission and conversion
between these definitions, and
3. A brief discussion of the subjective evaluation of television picture
quality in terms of signal-to-noise ratio.
Accepted for the Air Force Franklin C. Hudson Chief, Lincoln Laboratory Office
in


Table of Contents
Abstract
Table of Contents
List of Illustrations
List of Tables
I. Video Signal-to-Noise Ratio
1.1 Amplitude Modulation
1. 2 Frequency Modulation
II. TV SNR Definitions
2.1 Amplitude Modulation
2. 2 Frequency Modulation
III. Subjective Evaluation of Picture Quality in Terms of Signal-to-Noise Ratio
IV. Summary
Appendix A - Calculation of Noise Weighting Factors
Appendix B - Vestigial Sideband (VSB) AM Transmission
Appendix C - Conversion of SNR Definitions
Glossary of Abbreviations
References
in
v
vi
vii
2
2
5
9
14
14
16
20
22
27
31
35
36

List of Illustrations
Figure 1 Television Composite Signal Waveform, Amplitude Modulation 3
Figure 2 Television Composite Signal Waveform, Frequency Modulation 8
Figure 3 TV Noise Weighting 12
vi
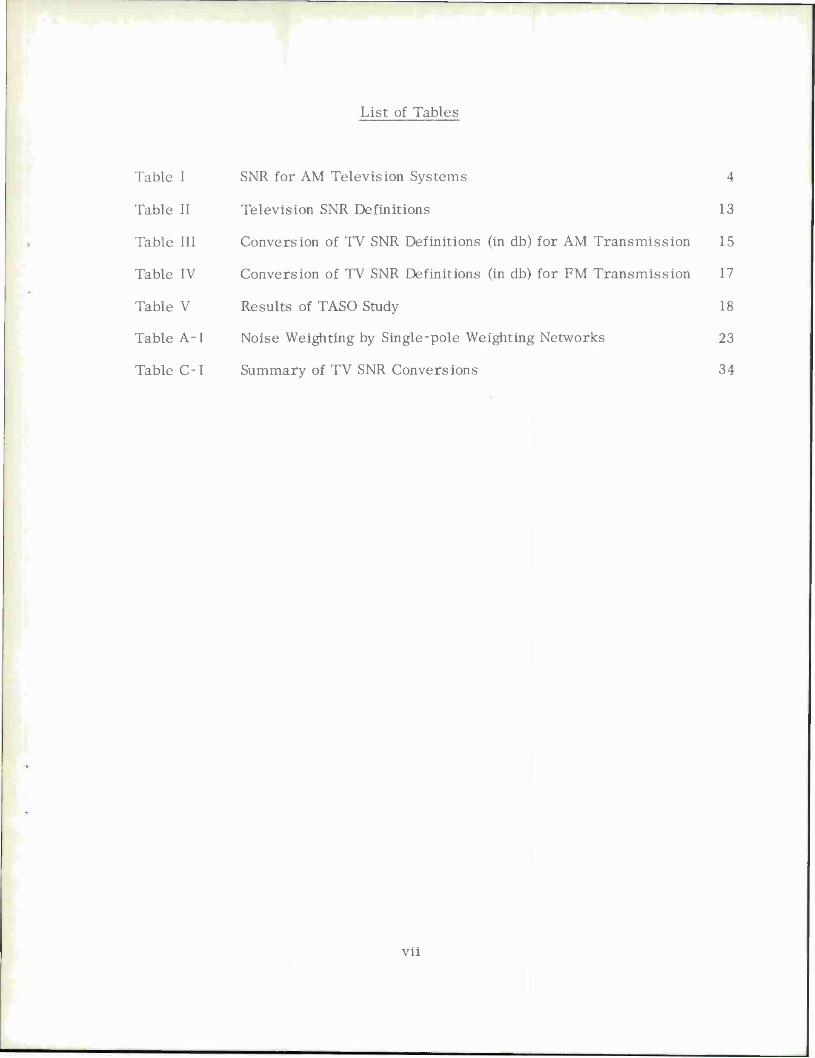
List of Tables
Table I SNR for AM Television Systems 4
Table II Television SNR Definitions 13
Table III Conversion of TV SNR Definitions (in db) for AM Transmission 15
Table IV Conversion of TV SNR Definitions (in db) for FM Transmission 17
Table V Results of TASO Study 18
Table A-1 Noise Weighting by Single-pole Weighting Networks 23
Table C-I Summary of TV SNR Conversions 34
Vll

Signal-to-Noise Ratios for Television Transmissions
The Lincoln Laboratory's long involvement in R&D associated with the
transmission of data and voice signals over communication links of various
sorts has produced a satisfactory understanding of the way in which system
performance for such links can be calculated. For example, the required
minimum signal-power-to-noise-power-density ratio (P /N ) for acceptable
operation of a particular vocoder modem between airplanes in flight via a
UHF satellite transponder is known. Until recently, there had been no strong
necessity to establish at the Laboratory a similar understanding of system-
performance calculation for TV links.
The prospects for operation of TV cameras from drone vehicles
(more generally, as parts of telefactor systems) are sufficiently compelling
that it seems worthwhile to have available a rational process for the calculation
of TV-link performance under rather general assumptions. The subjective
evaluation of picture quality (the ultimate basis for acceptance or rejection
by the potential user) is more difficult to characterize than the rate and error
frequency of a stream of digital data, for example.
The specific requirements of a particular application have led to the
compilation and study of the detector relationships for VSB-AM and FM
transmission as modified by measuring techniques intended to simulate some
of the subjective effects of the human observer. Standards have been pro-
mulgated by many laboratories, associations, and agencies in the past. Those
currently encountered include the International Radio Consultative Committee
(CCIR), Electronics Industries Association (EIA), Television Allocation Study
Organization (TASO), the Bell System, and the Defense Communications Agency
(DCA).

Some contractors calculate link performance one way, some another.
The equivalence transformations among these various possibilities have been
collected in this note. Three topics are covered:
(1) The calculation of the video signal-to-noise ratio for amplitude and
frequency-modulated television transmission,
(2) The definitions currently in use for video transmission, and
(3) A summary of subjective evaluation of picture quality in terms of
signal-to-noise ratio.
I. Video Signal- to -Noise Ratio
1.1 Amplitude Modulation
The most common means of video transmission is amplitude modulation.
A typical video waveform is indicated in Fig. 1, with the vertical axis calibrated
in terms of carrier amplitude. In this note, we consider only black-positive
video signals. For black-negative, interchange the words "black" and "white".
The video signal is clamped so that the transmitter output power is its rated peak
value P on the sync peaks, averaged over a few RF cycles. Then the gain is set
so the white reference level is the appropriate (non-zero) value.
In order to conserve bandwidth, vestigial sideband (VSB) transmission is
used. Such a system has the same noise performance as a double sideband system
(DSB) having the same signal power and noise spectral density, provided the
vestigial sideband filter is properly chosen (see Ref. 2, page 576). However, for
this situation, the input signal-to-noise ratio in the channel bandwidth will be
smaller for the DSB system since its noise bandwidth is larger. The precise
amount of difference depends on the relative bandwidth of the two transmission
systems. This is summarized in Table I.

S(t) INSTANTANEOUS i RF ENVELOPE
WHITE
ZERO * t
NOTE: AMPLITUDES REFER TO VIDEO MODULATING VOLTAGE v(t), IS NOMINALLY 1.0 VOLT PEAK-TO-PEAK
Fig. 1. Television composite signal waveform, amplitude modulation.

TABLE I
SNR for AM Television Systems
Modulation Channel
Bandwidth W
(S/N). in <S/N>out
<S/NW
DSB 2f m P p
N f o m 2
2N f o m
VSB f +A m
P P •♦A m
N (f + A) o m N f
o m
SSB f m
P P 1
N f o m
N f o m
where: m
A
N
= Video bandwidth
= Signal power (peak RF or video power, including the white - level d.c. offset)
= Bandwidth of the vestigial sideband
= Single-sided noise power density
W = Channel bandwidth

These signal-to-noise ratios are for white noise in the appropriate bandwidth.
In Section II we shall relate these results to the weighted noise power measure-
ments incorporated in the video transmission standards currently in use. Also,
we shall discuss other definitions of signal power which are commonly encountered.
1. 2 Frequency Modulation
Frequency modulation is often used for satellite and microwave point-to-
point television transmission. In this section we derive the video signal-to-noise
ratio in terms of the RF carrier-to-noise ratio for such a system.
As our starting point, we cite the standard result for the signal-to-noise
ratio at the output of an FM system operating above threshold with sinusoidal
2 modulation (e.g., Hancock, p. 54ff).
out 2N f Ö o m
where
(S/N) = output signal-to-noise ratio (mean-square signal and noise powers)
P = received signal power
N = (single-sided) noise power spectral density
Af = maximum (one-way"! frequency deviation
f = video bandwidth m
Note that Eq. 1 does not depend explicitly on the bandwidth W. However, the
bandwidth is implicit in (1) in that it must be sufficiently large to pass the signal
p undistorted. Furthermore, T-J—TTT must be sufficiently large that we are operating
o

above threshold. Also note that the signal power in (1) is the mean-square
for a sine-wave. Now we express Eq. 1 in terms of parameters appropriate
to TV transmission.
The usual definition of signal "power" for video signals is the
peak-to-peak voltage squared, rather than any average value, such as the
mean-square. We define
S - (V_ u ♦ J2 • (2) p-p v peak-to-peak' x
The peak levels are constants of the system (see Fig. 1), while averages
depend on the video waveform. Throughout the television industry, oscillo-
scopes are used to measure the video signal levels. Furthermore, the ratio
of peak-to-peak voltage to rms noise voltage may be regarded as the number
of distinguishable amplitude levels which a given system can transmit. Note
that when expressed in decibels, as is the customary practice, this voltage
SNR is equal to the power SNR obtained from (1) and (2).
Since Eq. 1 assumes a sinusoidal modulation,
therefore,
Sp-p =8S <3>
N ^out N f ö
o m
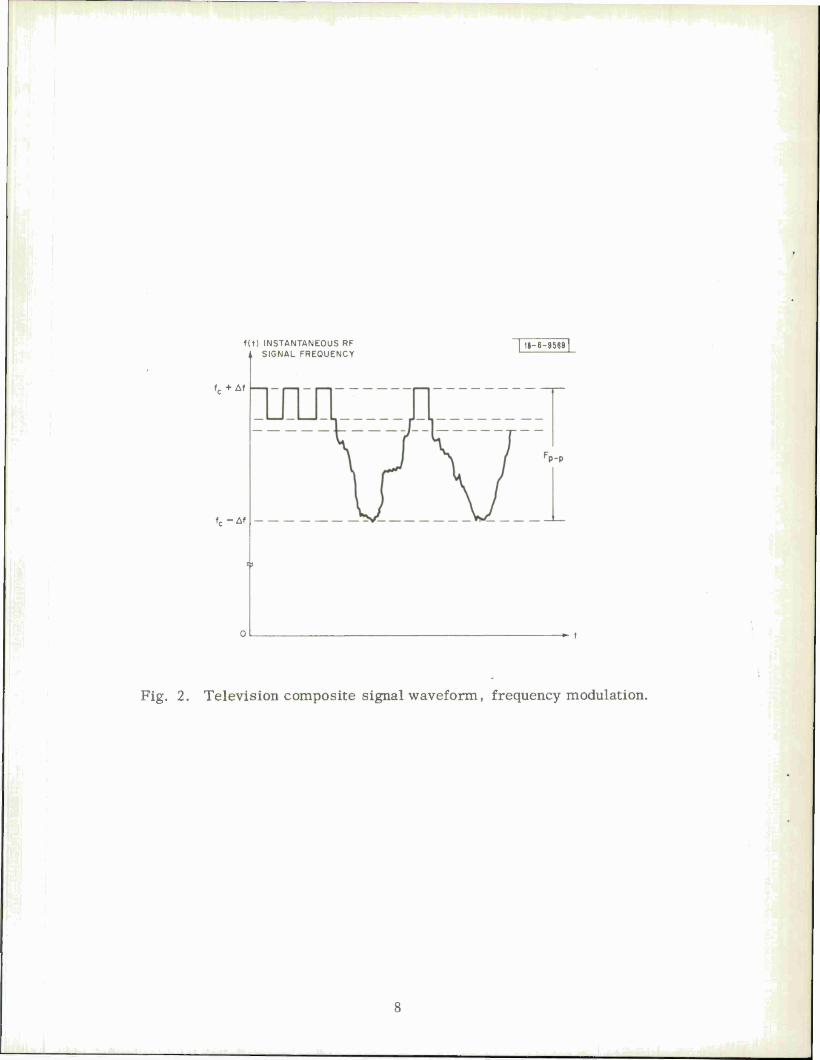
Furthermore, the video signal is clamped so that f = f +Af on the sync pulses.
The frequency deviation is then adjusted so that f = f — Af for a white picture
(see Fig. 2). Then the peak-to-peak frequency deviation F _ (the frequency
swing from white picture to the sync pulse) is

F = 2Af p-p (5)
The minimum bandwidth W required (at IF or RF) assuming large
modulation index m_ = Af/f , is* r m
W ■" 2(Af + f ) = F + 2f = 2f (1 + m.) v m p-p m irr f
Therefore, the input signal-to-noise ratio in the channel bandwidth is
(S/NL, = in N W o
N (F +2f ) ov p-p m'
Substituting (5) and (6) in (4), we have
(6)
out m p-p (7)
Another standard form of this result is expressed in terms of modulation
index m •
m (8)
(V) =24mf3(S/N)in(l+^)
out I (9)
*This approximation is commonly called "Carson's Rule. " Some references instead give W=* 2(Af + 2f ).
f(t) INSTANTANEOUS RF 1 SIGNAL FREQUENCY
18-6-9569
f- -Af
■*- t
Fig. 2. Television composite signal waveform, frequency modulation.

Sometimes the input signal-to-noise ratio is referred to the message
bandwidth rather than to the channel bandwidth. From Eq. 6,
(S/N).n =(mf+l)(S/N)in
message B.W.
(10)
then
C-V) = 24mf2 (S/N)in . (11)
message B.W.
Equation 11 is useful for comparing AM and FM systems (c.f. Schwartz,
p. 303).
The output SNR in Eqs. 7 through 11 are for a peak-to-peak composite
(i.e., one including the sync pulses) video signal and an unweighted, "triangular"
noise spectrum (see p. 14). Notice that they differ by a factor of eight from the
"standard results" quoted in various texts because of the different definition of
signal "power". In Section II we shall discuss the conversion to other definitions.
Further note that the last factor in Eqs. 5 and 7 is often approximated by
unity in the literature. For example, when mf = 5, this factor is less than 1 db.
II. TV SNR Definitions
Over the years, a number of different definitions of the signal-to-noise
ratio for video transmission have evolved. Not only do the definitions differ
from one organization to another, but also they have been changed from time to
time. In this memo we shall present only the current definitions.
One common definition of signal amplitude is the peak-to-peak voltage
4 from the blanking level to the white-signal level. The black-to-white voltage,
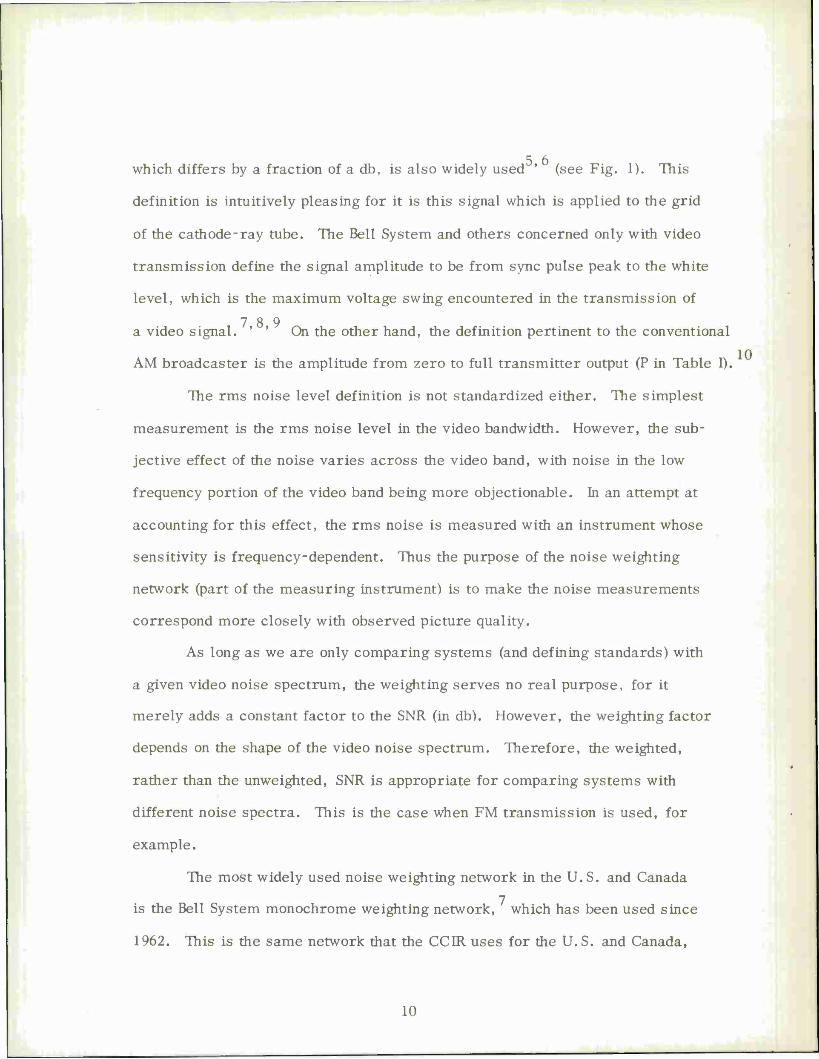
which differs by a fraction of a db, is also widely used • (see Fig. 1). This
definition is intuitively pleasing for it is this signal which is applied to the grid
of the cathode-ray tube. The Bell System and others concerned only with video
transmission define the signal amplitude to be from sync pulse peak to the white
level, which is the maximum voltage swing encountered in the transmission of
7 8 9 a video signal. ' ' On the other hand, the definition pertinent to the conventional
AM broadcaster is the amplitude from zero to full transmitter output (P in Table 1).
The rms noise level definition is not standardized either. The simplest
measurement is the rms noise level in the video bandwidth. However, the sub-
jective effect of the noise varies across the video band, with noise in the low
frequency portion of the video band being more objectionable. In an attempt at
accounting for this effect, the rms noise is measured with an instrument whose
sensitivity is frequency-dependent. Thus the purpose of the noise weighting
network (part of the measuring instrument) is to make the noise measurements
correspond more closely with observed picture quality.
As long as we are only comparing systems (and defining standards) with
a given video noise spectrum, the weighting serves no real purpose, for it
merely adds a constant factor to the SNR (in db). However, the weighting factor
depends on the shape of the video noise spectrum. Therefore, the weighted,
rather than the unweighted, SNR is appropriate for comparing systems with
different noise spectra. This is the case when FM transmission is used, for
example.
The most widely used noise weighting network in the U. S. and Canada
is the Bell System monochrome weighting network, which has been used since
1962. This is the same network that the CCIR uses for the U.S. and Canada,
10

and since mid-1968 the Bell System has used it for color as well. It is widely
5 20 used by other organizations. ' ~ The Bell System color weighting network has
also been widely used since 1962, and this is the noise weighting recommended
by the Electronic Industries Association (EIA). It does not roll off as rapidly as
the monochrome weighting network, and it has a peak in the vicinity of the color
subcarrier frequency. The Defense Communications Agency (DCA) recommends
a single-pole noise weighting network which turns out to have substantially the
same weighting effect as the Bell color/EIA network. The frequency response
for each of these three noise weighting networks is given in Fig. 3. Observe
that although their shapes differ considerably, the effects of the weighting differ
by at most about 3 db. In Section III we shall see that this is probably not enough
difference to make an appreciable difference in subjective viewing evaluations.
Table II provides a summary of the television SNR standards currently
in use. Since the output noise spectrum is not the same in an AM and an FM
system, the noise weighting has a different effect on the SNR for the two types
of modulation. We, therefore, treat them separately. We should point out here
that the noise weighting network, which is part of the noise measuring equipment,
should not be confused with the pre- and de-emphasis networks which (when they
are used) are part of the transmission system.
We observe that phase modulation and single-sideband AM transmission
are not used for television transmission since the video signal has a DC component
and appreciable energy at low frequencies. Therefore, these types of modulation
are not discussed in this note.
11

__^^^ DCA—^
118-6-9570 |
-2
-4 EIA/BELL/"' COLOR
to 2 -6
AT
TE
NU
AT
ION
i
CCIR/BELL ' MONOCHROME
£ -12
< -1 -14 UJ
NOISE REDUCTION BY WEIGHTING -16 INPUT NOISE
SPECTRUM EIA (dB)
DCA (dB)
CCIR (dB)
-18 FLAT 4.0 4.0 6.2 TRIANGULAR 7.0 7.4 10.3
-20
-22 I I I I I I I I I I I I I I I I I I I 1 1 ll 1 II 1 1 0,1 10 100
FREQUENCY (MHz)
Fig. 3. Television noise weighting.
12
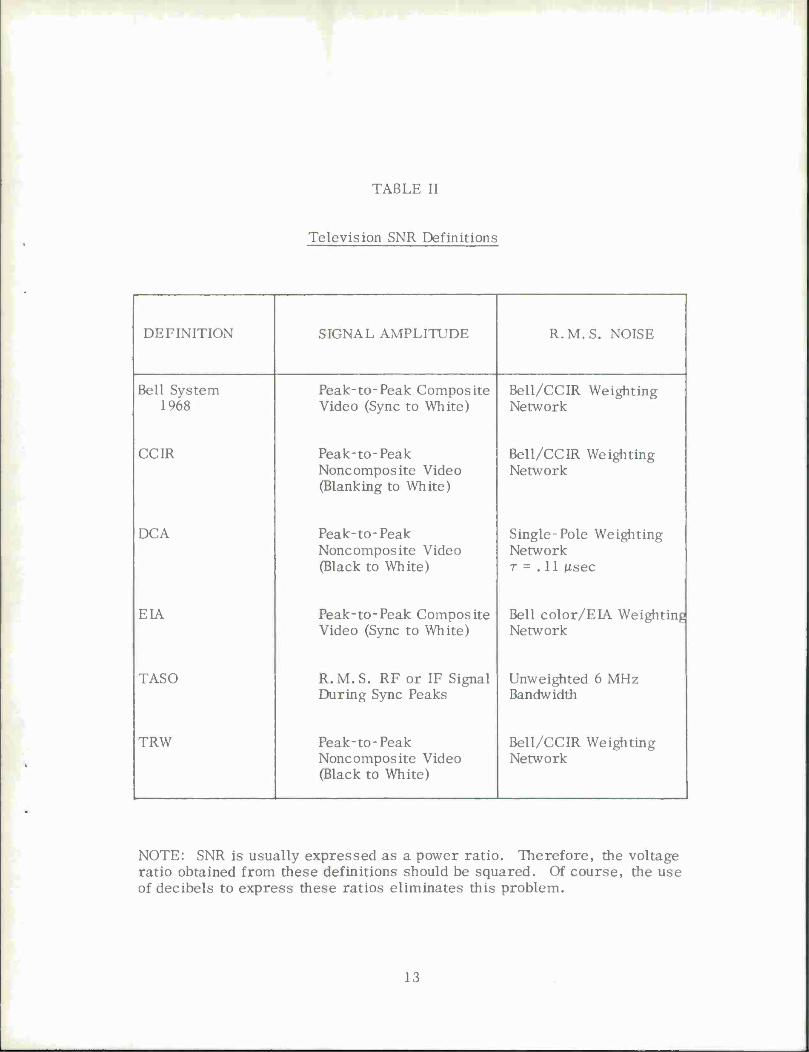
TABLE II
Television SNR Definitions
DEFINITION SIGNAL AMPLITUDE R.M.S. NOISE
Bell System 1968
Peak-to-Peak Composite Video (Sync to White)
Bell/CCIR Weighting Network
CCIR Peak-to-Peak Noncomposite Video (Blanking to White)
Bell/CCIR Weighting Network
DCA Peak-to-Peak Noncomposite Video (Black to White)
Single-Pole Weighting Network T = . 11 /Lisec
EIA Peak-to-Peak Composite Video (Sync to White)
Bell color/EIA Weighting Network
TASO R.M.S. RF or IF Signal During Sync Peaks
Unweighted 6 MHz Bandwidth
TRW Peak-to-Peak Noncomposite Video (Black to White)
Bell/CCIR Weighting Network
NOTE: SNR is usually expressed as a power ratio. Therefore, the voltage ratio obtained from these definitions should be squared. Of course, the use of decibels to express these ratios eliminates this problem.
13

2.1 Amplitude Modulation
Comparing the appropriate entries in Tables I and II, we see that the
definition of SNR in the TASO study is the input SNR for a vestigial sideband
system. In this note we consider a nominal video bandwidth of 4. 2 MHz.
Then f = 4. 2 MHz, A = 1. 8 MHz, and the output SNR is 10 log 1. 43 = 1. 6 db
greater than the input SNR, if we define the output signal amplitude to be that
corresponding to the transition from zero to full transmitter power, as in
Table I.
Table III gives the conversions between the remaining standards.
The details of how the numbers in this table were obtained are relegated to
the Appendices. It should be emphasized that while most of the entries in
Table III are video SNR's appropriate to any AM system, the TASO definition
and P/N W are input SNR's which are only applicable to VSB-AM transmission.
2. 2 Frequency Modulation
The video noise spectrum for an FM system is not white, and therefore
the noise weighting has a different effect than it does for white noise. If
de-emphasis is not used, the video noise amplitude spectrum for the FM
system is "triangular". That is, the video noise power spectral density is
2 proportional to f . When de-emphasis is used, the video noise spectrum is
even more complex. Thus the effect of the weighting networks must be
recomputed for FM transmission. The results are tabulated in Table IV.
14
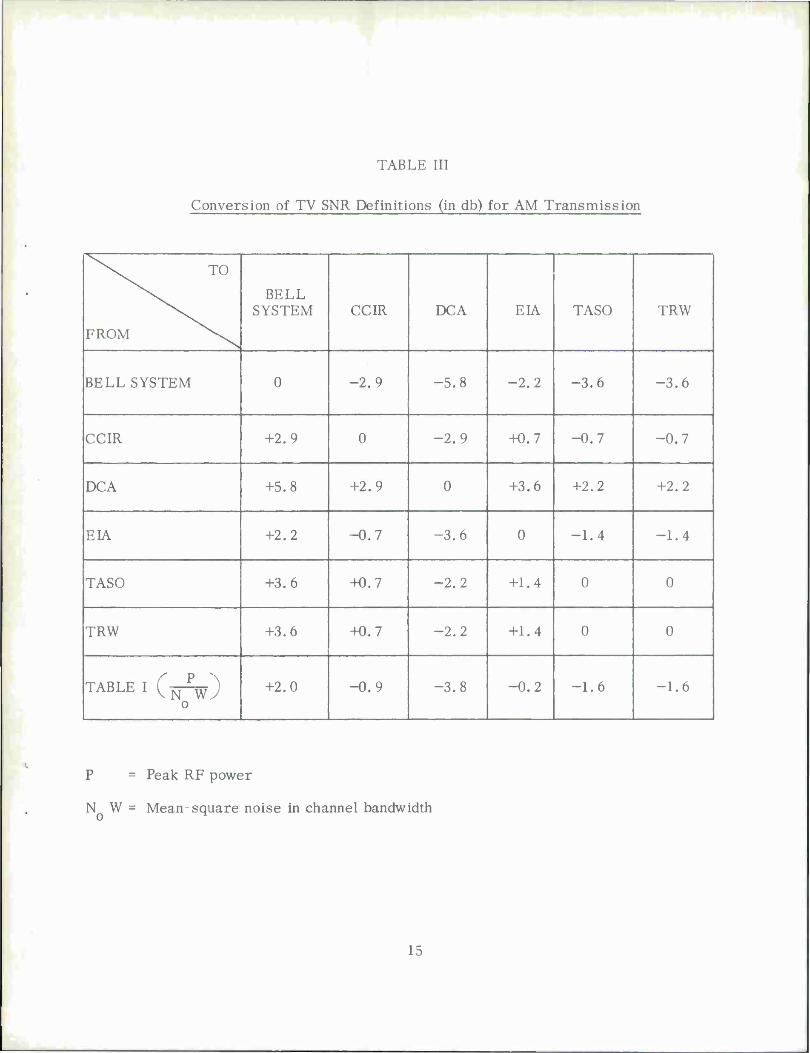
TABLE III
Conversion of TV SNR Definitions (in db) for AM Transmission
^s. TO
FROM \s.
BELL SYSTEM CCIR DCA EIA TASO TRW
BELL SYSTEM 0 -2.9 -5.8 -2.2 -3.6 -3.6
CCIR +2.9 0 -2.9 +0.7 -0.7 -0.7
DCA +5.8 +2.9 0 +3.6 +2.2 +2.2
EIA +2.2 -0.7 -3.6 0 -1.4 -1.4
TASO +3.6 40.7 -2.2 +1.4 0 0
TRW +3.6 +0.7 -2.2 +1.4 0 0
TABLE I (NP
W) 0
+2.0 -0.9 -3.8 -0.2 -1.6 -1.6
P = Peak RF power
N W = Mean-square noise in channel bandwidth
15

III. Subjective Evaluation of Picture Quality In Terms of Signal-to-Noise Ratio
A number of studies ( Refs. 6-8, 10, 12-19) have been made of the
quality of a television picture in terms of signal-to-noise ratio. One of the
more extensive studies, the results of which are readily available and often
quoted, was performed for the Television Allocations Study Organization
(TASO) by Dean. Table V presents some of the results of this study. We
should re-emphasize that the definition of SNR used in the TASO study is
the ratio of average RF power on sync peaks to mean square white noise
power in the channel bandwidth for VSB-AM transmission.
We have discussed in Section II of this note how a meaningful noise
measurement, in terms of the subjective effects of the interference, is one
made with an appropriate noise weighting network. Since the TASO study
assumes a white RF noise spectrum and AM transmission, the video noise
spectrum is also white and the noise weighting merely reduces the noise
power by a constant factor. These factors are calculated in Appendix A,
and were used to obtain Table III. This table can then be used to translate
the results of the TASO study to other definitions of SNR. For example,
75% of the TASO reviewers required an RF SNR of 30 db for a "passable"
picture. This translates to 31 db for the CCIR video SNR definition, and
34 db for that of the Bell System.
16
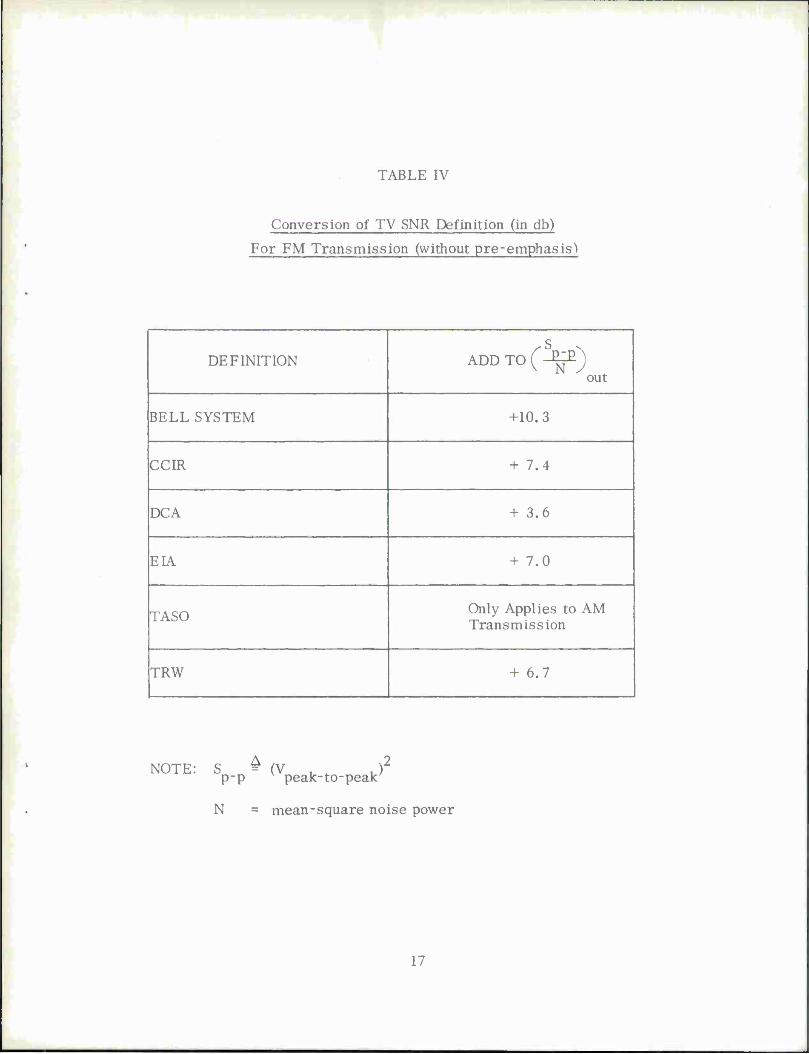
TABLE IV
Conversion of TV SNR Definition (in db)
For FM Transmission (without pre-emphasis'»
DEFINITION ADD TO C V) out
BELL SYSTEM +10.3
CCIR + 7.4
DCA + 3.6
EIA + 7.0
hTASO Only Applies to AM Transmission
TRW + 6.7
NOTE: S = (V . „ J2
p-p v peak-to-peak7
N = mean-square noise power
17
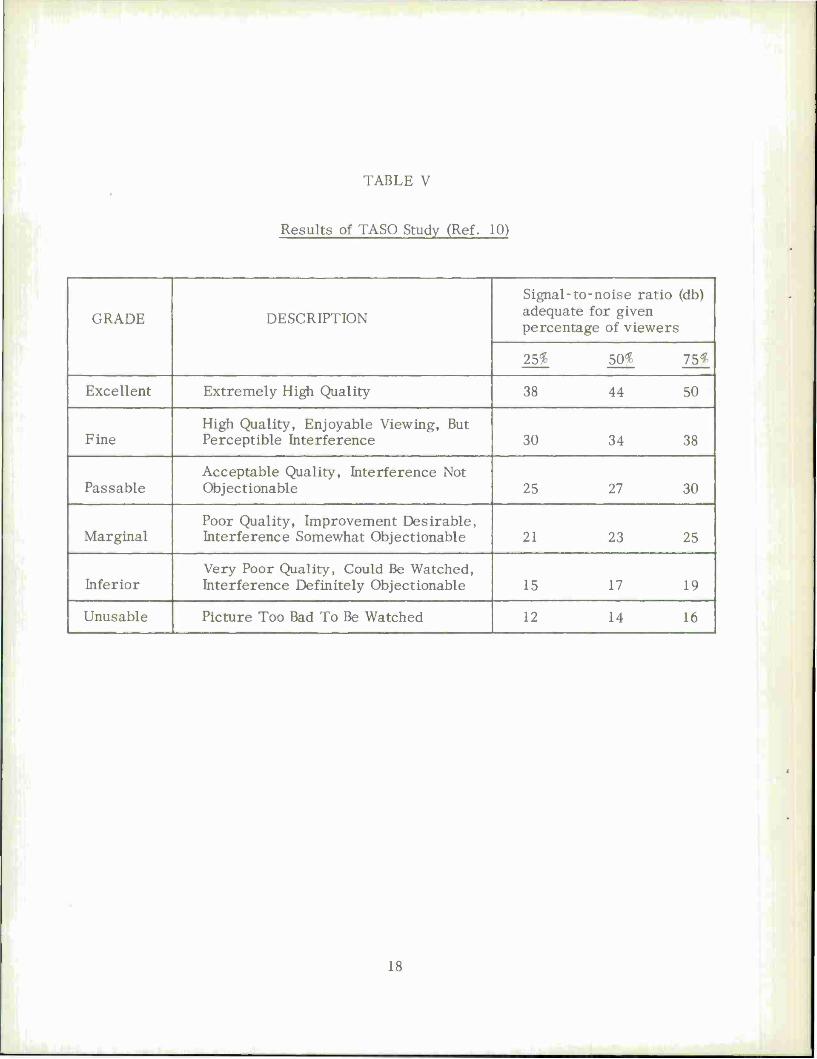
TABLE V
Results of TASO Study (Ref. 10)
GRADE DESCRIPTION
Signal-to-noise ratio (db) adequate for given percentage of viewers
25ff 50^ 75#
Excellent Extremely High Quality 38 44 50
Fine High Quality, Enjoyable Viewing, But Perceptible Interference 30 34 38
Passable Acceptable Quality, Interference Not Objectionable 25 27 30
Marginal Poor Quality, Improvement Desirable, Interference Somewhat Objectionable 21 23 25
Inferior Very Poor Quality, Could Be Watched, Interference Definitely Objectionable 15 17 19
Unusable Picture Too Bad To Be Watched 12 14 16
18

Alternatively, we can proceed in the other direction and interpret other
SNR definitions on the TASO rating scale. The CC1R, for example, recommends
a weighted video SNR of 56 db for network transmission. Referring to Table III,
we see that this is equivalent to 55 db on the TASO scale, which was rated as an
"excellent" picture by more than 75% of the viewers. As another example, the
DC A requires a median SNR of 52 db for a 6000 nautical mile circuit. Again
from Table III, we find this corresponds to 54 db on the TASO scale, which is
practically the same as the CCIR requirement. The motivation for these rather
stringent requirements on the SNR for television relays is so that the random
noise interference will not be visible, and hence any degradation in the picture
quality will come from other parts of the system.
The situation is slightly more complicated for FM transmission, where
the video noise spectrum is not white. In addition, de-emphasis is sometimes
used (its use is recommended by the CCIR) and this makes the video noise
spectrum even more complex. As an example of such a calculation, we consider
a low-power microwave TV link with the following parameters:
N = -198. 5 dbw/Hz (5. 5 db NF)
W = 20 MHz or 73.0 db-Hz
Af = 4 MHz or 66.0 db-Hz
f = 4.3 MHz or 66. 3 db-Hz m
P = -109dbw.
Substituting into Eq. 1, we obtain
(S/N)out = 24.4db
unweighted
or
19
(N) =33-4db
out unweighted
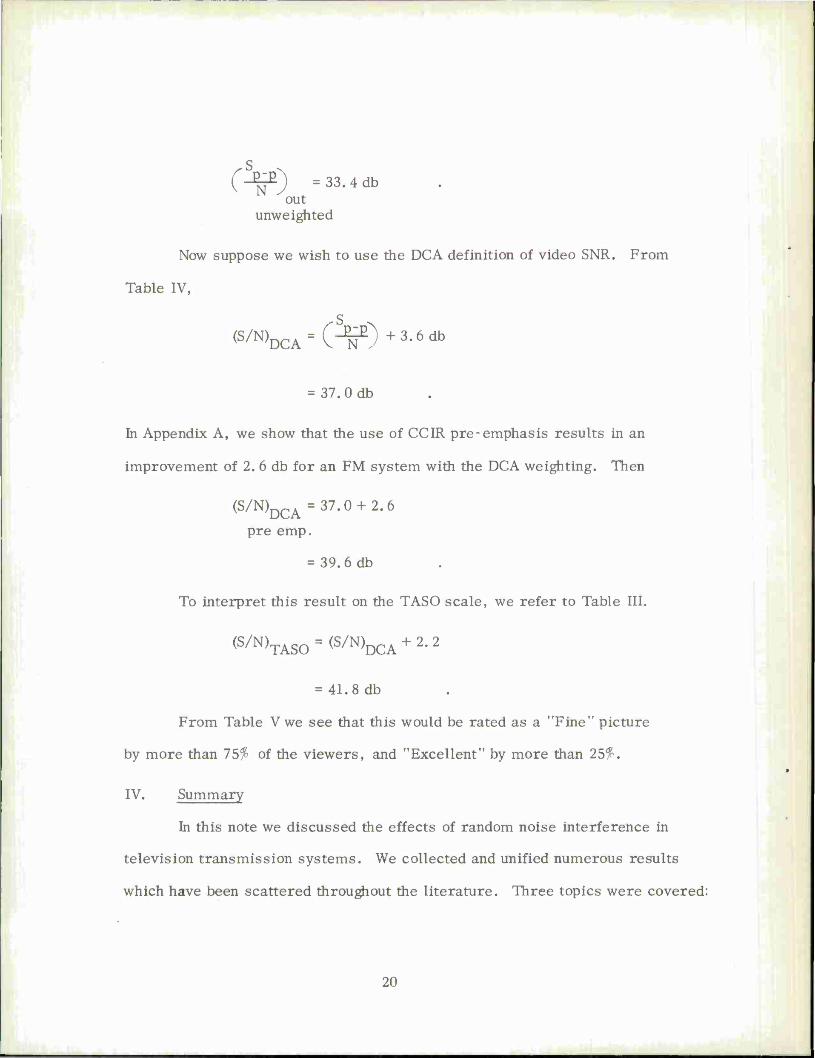
Now suppose we wish to use the DCA definition of video SNR. From
Table IV,
(S/N)DCA=(V)+3'6db
= 37.0db
In Appendix A, we show that the use of CCIR pre-emphasis results in an
improvement of 2. 6 db for an FM system with the DCA weighting. Then
(S/N)DCA = 37.0 + 2.6
pre emp.
= 39.6db
To interpret this result on the TASO scale, we refer to Table III.
(S/N)TASO = (S/N)DCA + 2.2
= 41.8db
From Table V we see that this would be rated as a "Fine" picture
by more than 75% of the viewers, and "Excellent" by more than 25%.
IV. Summary
In this note we discussed the effects of random noise interference in
television transmission systems. We collected and unified numerous results
which have been scattered throughout the literature. Three topics were covered:
20

(1) The calculation of the video signal-to-noise ratio for amplitude
and frequency modulation television transmission systems,
(2) A summary of the signal-to-noise ratio definitions (including
noise weighting standards) currently in use for video transmission
and conversion between these definitions, and
(3) A brief discussion of the subjective evaluation of television picture
quality in terms of signal-to-noise ratio.
21

APPENDIX A
Calculation of Noise Weighting Factors
This Appendix presents the details of the calculation of the noise
weighting factors that were used in obtaining Tables III and IV. We present
the details here so that the interested reader can see how the numerical
values were obtained. Also, these calculations enable us to calculate weighting
factors for a whole family of networks.
A-l Single-pole weighting
4 A single-pole noise weighting network is recommended by the CCIR
for all countries except the U. S. and Canada. It is also used by DCA.
A-l.l White noise
f r m 1 ' 2 df
N i,*«. A ~f 1 + Off f r) weighted . m
white n m P in
arctan (2tr f T) (A-l)
A-l. 2 Triangular noise
m
r m f2
J N .^«. A °-f 1 + (27T f r)2
weighted m v ' , ... —ü"* = j (cont'd)
white « m 9
rdf -f
m
22
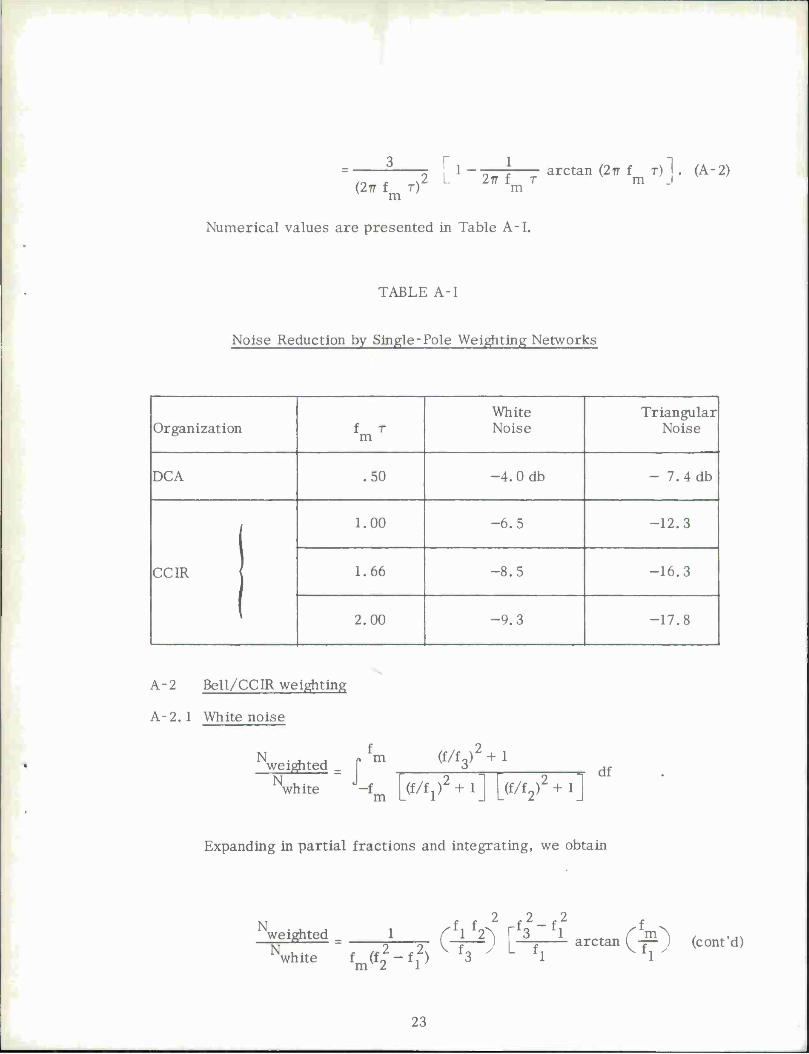
- L1 -2^777 arctan(2,fmr)l. (A-2) (2n f T) v m
m
Numerical values are presented in Table A-1.
TABLE A-1
Noise Reduction by Single-Pole Weighting Networks
Organization f r m
White Noise
Triangular Noise
DCA .50 -4. 0 db - 7.4db
CC1R |
1.00 -6.5 -12.3
1.66 -8.5 -16.3
2.00 -9.3 -17.8
A-2 Bell/CCIR weighting
A-2.1 White noise
N r» m weighted . N
(f/f3) + 1 sighted _ r v/ 3; df
fwhite J-fm [(f/f^ + l] [(f/f2)2 + l"|
Expanding in partial fractions and integrating, we obtain
N 2 2 2
>f, frtv rfo -f, ^ited . — i. Qj^ r VüL arctan r m^ N .. , 7,2 -2v v f y L f, vf, / v
white f if« — f, ) 3 1 1 'm«2-'r>
23

f2-f2 f + JL_JLarctan(_si)] . (A3)
Substituting numerical values,
f x = .27 MHz
f2 = 1.37 MHz
f3 = .39 MHz
we obtain
f =4.2 MHz m
weighted =,6>2db
white
A-2.2 Triangular noise
fm f2[(f/f3)2 + l] p 111 i ^vx/ inf T x j
J-fm [(f/fl)2 + l][(f/f2)2 + i]
df
weighted N u; f
white « m 9
r df
m
2 2 2 = 3 (FT
2) L1 _ T~ C-r—y)arctan (r0 (cont'd)
3 m m f« - f j
24

2 2
- r1 &$>arctan (£) J (A"4) m fJ - f2 2
= -10.3db
A-3 Triangular noise with de-emphasis
We shall consider de-emphasis networks of the form
, (f/f_) +1 |H(f>r=A> % . (A-5)
(f/fl)2 + l
4 The widely used CCIR network is such a network, with
A = 10
f2 = .185 MHz
f2 = .873 MHz
A-3.1 Single-pole weighting
P fm 2 (f/f2)2 + 1
Weighted J A l/f/f )2 + 1l jff/f )2+1] de-emphasis _ m J Lw o'
df
N f unweighted j* m f2 f
-f m
25

where
1 O 2lT T
Notice that we did this same integral in A-2. 2 above, with slightly different
notation.
weighted ff2 f f2-f2 f de-emphasis 0 A f o 1 ^ (". o f 2 o N\ f m\
N—~r = 3AVf-f^ L1 -—^ 72—2;arctan (— unweighted m 2 m f. - f o
2 2
- r- (4—V) arctan (fO" • (A'6) — ^72—ry arctan k 17)
For the DCA noise weighting
f =1.44 MHz o
f =4.5 MHz m
Thus
weighted ^de-emphasis = _100db
unweighted
Comparing this with the weighting factor when pre-emphasis is not
used, Table A-1, we see that the use of pre-emphasis reduces the noise
2. 6 db.
26

APPENDIX B
Vestigial Sideband (VSB) AM Transmission
In this Appendix, we relate the video and RF signal-to-noise ratios
for conventional VSB-AM television transmission. We discuss only one of
several possible definitions of video SNR here. The conversion to other
definitions is given in Table III, and the details of the calculations are
sketched in Appendix C.
The basic transmitter modulation is double-sideband AM:
S(t) =v/5F m(t) cos u t
= /2P ("icT^) cos üc
t (B_1)
where
K = white level offset
v(t) = video waveform, 0 ^ v(t) ^ V of peak-to-peak amplitude V.
The peak envelope transmitter power is therefore P.
For purposes of analysis, we assume a sinusoidal video waveform
v(t) = ■¥ (1 + cos u t) . (B-2) l m
We use a sinusoid because the standard results for detector performance are
2 3 obtained for sinusoids. ' Since it is the peak-to-peak value that is pertinent
to our calculations, our results are independent of the waveform.
27

Substituting and simplifying,
S(t) = /2P (1 + ^Y\?y0 cos U t) cos ü t , (B-3) c K+V/z m c
where
.2 P »»(
K + V/2V
c x v K + v y
is the average carrier power. The modulation index is therefore
K + 2 ma K + V/2
For DSB-AM (from Hancock, 2 p. 41-47)
P m2
N/out = 2N W ' (B"4) Nyout 2N W DSB
Therefore
o C^) = 4f-^--Y-^- <B-5> V N ./out 4 V K + V/ N W lö ^
For VSB-AM, the output noise power is decreased by a factor of two
due to the reduced noise bandwidth. However, the output signal power is
decreased by a factor of four, since the two sidebands add coherently in a
DSB system.
rW) = 2fj^2_£_ (B-6)
V N yout V K + W N W ' K 0)
VSB °
28
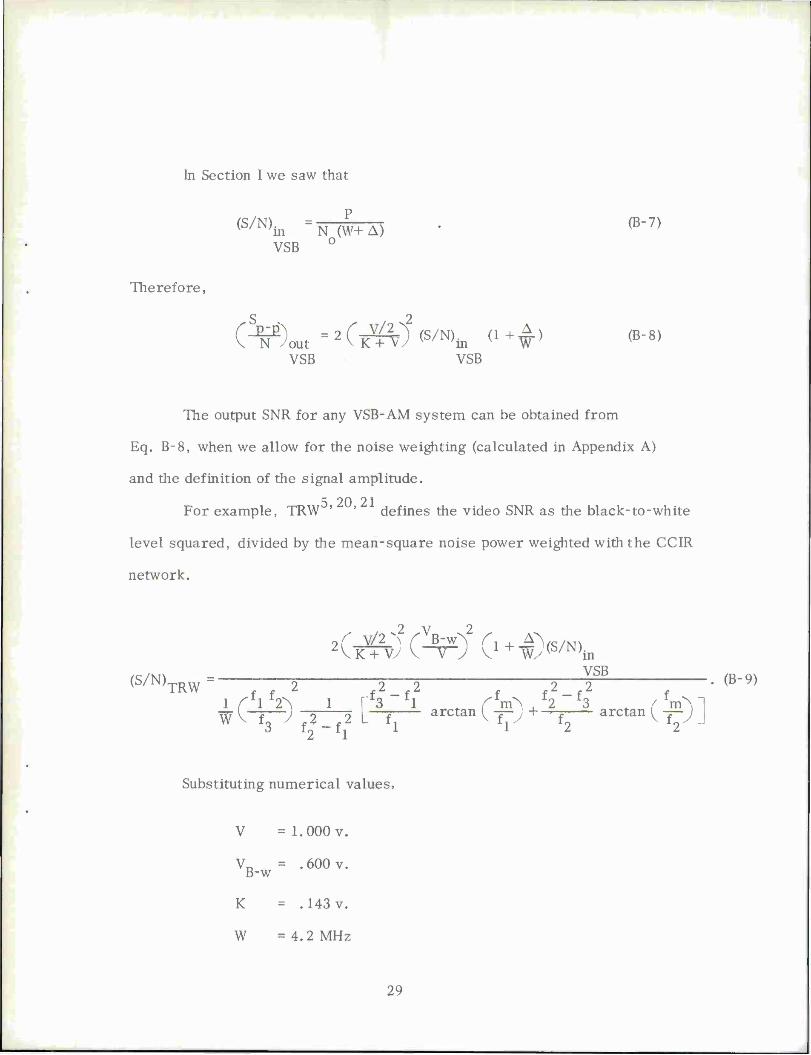
In Section I we saw that
<S/N)in =WWTA) • <e-7>
VSB °
Therefore,
(V)out=2CTÄT)2<S/N>in <1+W> <*« VSB VSB
The output SNR for any VSB-AM system can be obtained from
Eq. B-8, when we allow for the noise weighting (calculated in Appendix A)
and the definition of the signal amplitude.
5 20 21 For example, TRW ' ' defines the video SNR as the black-to-white
level squared, divided by the mean-square noise power weighted with the CCIR
network.
2^K+TfcA~V"7 V1+U^(S/N)in VSR
(S/N)
TRW=—7—2 -Ti—i : 7T—2 :—• <B"9>
\-j—) 75—2 L"i— arctan ^ 77v + ~n.—arctan ^ ~J J W '3 f 2 - f! 1 "V x2 x2
Substituting numerical values,
V =1.000v.
VD = .600v. B-w
K = .143v.
W =4. 2 MHz
29
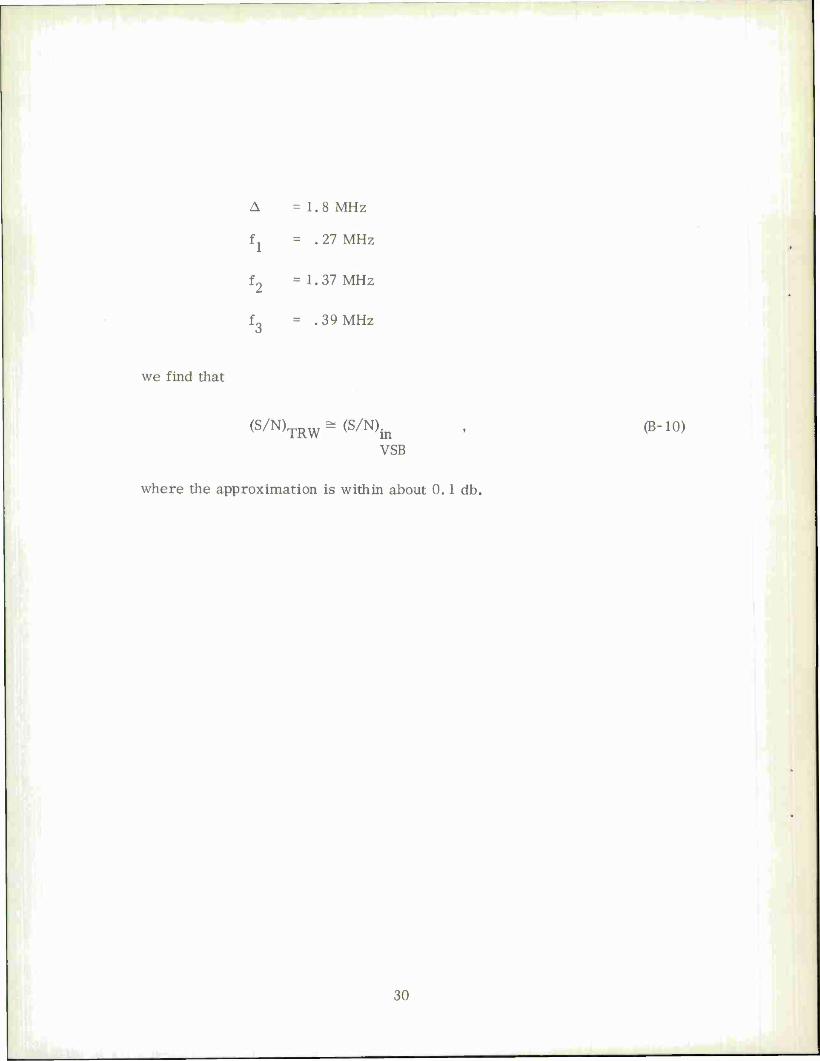
= 1.8 MHz
f = . 27 MHz
f2 =1.37 MHz
f3 = .39 MHz
we find that
(S/N)TRW - (S/N)in ' (B"10)
VSB
where the approximation is within about 0.1 db.
30

APPENDIX C
Conversion of SNR Definitions
There are two factors that enter into our conversion between the
various SNR definitions. The first, which is the definition of signal
amplitude, applies to both AM and FM transmission. However, the
correction for the noise weighting network depends on the video noise
spectrum, and therefore is different for the two types of transmission.
C-l Signal amplitude
The standard signal amplitudes are given in Fig. 1.
S „ .., =1.00v. sync-to-white
Sul ,. ^ ... = ,714v. blanking-to-white
SU1 u * u-+ = -660 v- black-to-white
Expressing the voltage ratios in db, we obtain
S sync-to-white = 9 9 db
blanking- to - wh ite
blanking-to-white n -, ,,
black-to-white
C-2 Weighted noise
The conversion from Bell/CCIR to DCA noise weighting follows immediately
from Appendix A.
31
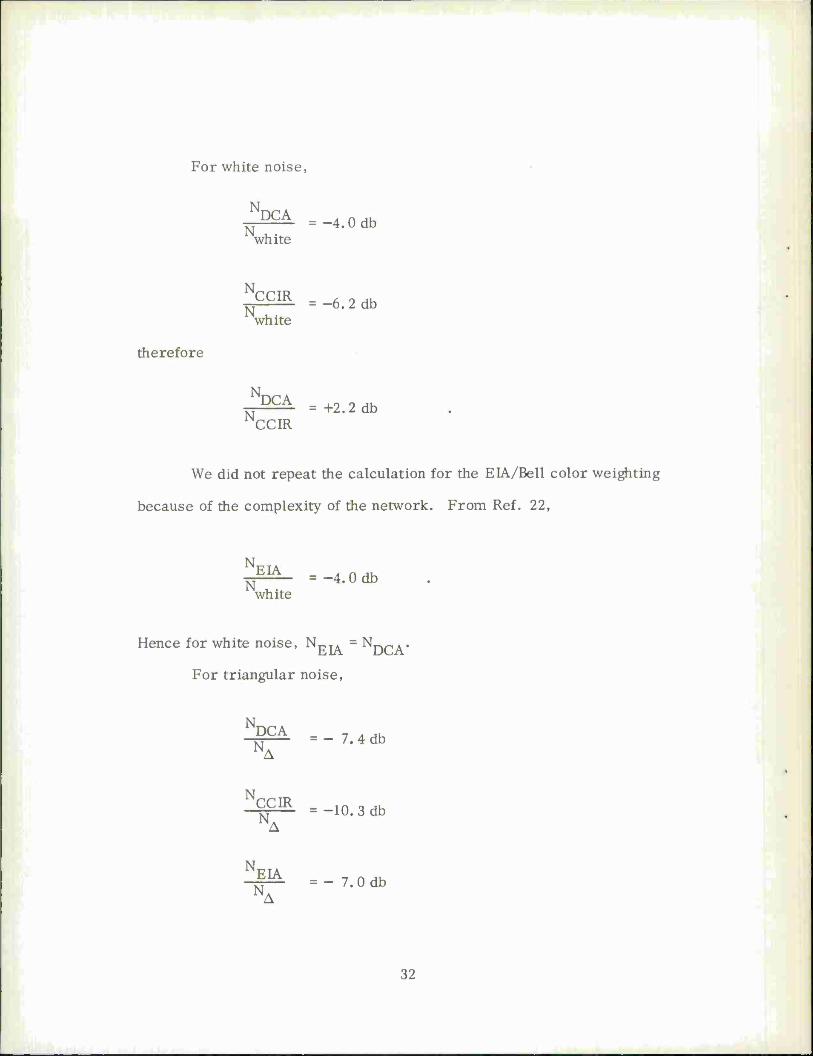
For white noise,
N CA = -4.0 db N
white
therefore
NCCIR =-6.2db white
N )CA = +2.2 db
N iNCCIR
We did not repeat the calculation for the EIA/Bell color weighting
because of the complexity of the network. From Ref. 22,
^- =-4.0db white
Hence for white noise, NßIA = NDCA.
For triangular noise,
N DCA - A -
"N --7.4db
^CIR =-10.3db 1NA
NEIA 7 n ., -jj— - - 7. 0 db
32

thus
NDCA J— = +2.9db NCCIR
NEIA _^ A - ■r: =-K).4 db iNDCA
These results are summarized in Table C-I.
33

TABLE C-l
Summary of TV SNR Conversions
db SNR conversion
^s. Noise \^ Weighting
Signal Amplituctes. Definition ^v^
CCIR/ BELL DCA EIA
1+0.7 db
+2. 9 db
Black to White TRW DCA
Blanking to White CCIR
Sync to White Bell System
EIA
Noise Spectrum
White +2.2 <
db 0. 0 db ^
Triangular +2.5 <
db +0. 4 db z_ _ _. ,
34

AM
CCIR
DCA
DSB
EIA
FM
PM
SNR
SSB
TASO
TRW
VSB
Glossary of Abbreviations
Amplitude modulation
International Radio Consultative Committee
Defense Communications Agency
Double sideband
Electronic Industries Association
Frequency modulation
Phase modulation
Signal-to-noise ratio
Single sideband
Television Allocation Study Organization
TRW Systems
Vestigial sideband
35

REFERENCES
1. Wozencraft, J. and I. Jacobs, Principles of Communication Engineering, (j. Wiley, New York; 1965).
2. Hancock, J.C., An Introduction to the Principles of Communication Theory, (McGraw-Hill, New York; 1961).
3. Schwartz, M., Information Transmission, Modulation, and Noise, (McGraw-Hill, New York).
4. International Radio Consultative Committee (C.C.I.R.), "Documents of the Xlth Plenary Assembly, " Vols. 4 and 5, Oslo, (1966).
5. Booton, R.C. and F.H. Kaufman, "A Preliminary Design of a High Power Direct Broadcast Television Satellite, " TRW Systems, Redondo Beach, California.
6. Defense Communications Agency, "Engineering-Installation Standards Manual, Annex A - Television System and Equipment Standards," (11 April 1967).
7. Barstow, J.M. and H. N. Christopher, "The Measurement of Random Video Interference to Monochrome and Color Television, " AIEE Transactions on Communications and Electronics, No. 63, (November 1962), p. 313-320.
8. Barstow, J.M. and H.N. Christopher, "The Measurement of Random Monochrome Video Interference, " AIEE Transactions on Communications and Electronics, Vol. 73, Part I, (January 1954), p. 735-741.
9. Electronic Industries Association, Standard RS-250-A, "Electrical Performance Standards for Television Relay Facilities, " (February 1967).
10. Dean, C.E. , "Measurements of the Subjective Effects of Interference in Television Reception," Proc. IRE, (June 1960), p. 1035-1049.
11. Williams, A., Bell Telephone Laboratories, Holmdel, New Jersey, telephone conversation on 14 October 1968.
12. Mertz, P., "Data on Random Noise Requirements for Theatre Television, " Journal of the Society of Motion Picture and Television Engineers, Vol. 57, (August 1951), p. 89-107.
13. Jackson, R. N., "Subjective Assessments of Noise in Television Pictures," Mullard Research Labs., Redhill, England, Dept. No. 308, (July 1959).
36

14. Weaver, L.E., "Subjective Impairment of Television Pictures, " Electronic and Radio Engineering, Vol. 36, (May 1959), p. 170-179.
15. Kilvington, T., "Effects of Noise in Television Transmission," J. TVSoc, Vol. 9, (January 1959), p. 26-31.
16. Maurice, R.D. A., et al, "The Visibility of Noise in Television, " BBC Engineering Division Monograph No. 3, Kingswood Warren, Surrey, England, (October 1955).
17. Mertz, P. , et al, "Quality Rating of Television Images, " Proc. IRE, Vol. 38, (November 1950), p. 1269-1283.
18. Reed, O.W.B., Jr. , "Development of Television Service Standards and Application to Design of a Television Broadcast Network, " AIEE Trans- actions, (January 1954).
19. Baldwin, M. W. , Jr., "The Subjective Sharpness of Simulated Television Images," BSTJ Vol. 19, (October 1940), p. 563-586.
20. "Final Report on the Relay I Program, " NASA SP-76, Goddard Space Flight Center, Greenbelt, Maryland.
21. Booton, R.C., TRW Systems, Redondo Beach, California, letter dated 4 November 1968.
37

UNCLASSIFIED Security Classification
DOCUMENT CONTROL DATA - R&D (Security classification of title, body of abstract and indexing annotation must be entered when the overall report ia claaaitied)
I. ORIGINATING ACTIVITY (Corporate author)
Lincoln Laboratory, M.I.T.
2a. REPORT SECURITY CLASSIFICATION
Unclassified 2b. GROUP
None 3. REPORT TITLE
Signal-to-Noise Ratios for Television Transmission
4. DESCRIPTIVE NOTES (Type of report and incluaive datea)
Technical Note
5. AUTHOR(S) (Last name, first name, initial)
Collins, Lewis D.
6. REPORT DATE
14 March 1969
7a. TOTAL NO. OF PAGES
40
76. NO. OF REFS
21
8a. CONTRACT OR GRANT NO.
AF 19(628)-5167 b. PROJECT NO.
649 L
9a. ORIGINATOR'S REPORT NUMBER(S)
TN 1969-12
9b. OTHER REPORT NOIS) (Any other number« that may be assigned this report)
ESD-TR-69-50
10. AVAILABILITY/LIMITATION NOTICES
This document has been approved for public release and sale; its distribution is unlimited.
It. SUPPLEMENTARY NOTES
None
t2. SPONSORING MILITARY ACTIVITY
Air Force Systems Command, USAF
13. ABSTRACT
This note is concerned with the effects of random noise interference in television transmis- sion systems. Such systems are finding increasing application in surveillance and telefactor systems. Numerous results which have been scattered throughout the literature are collected and unified. Three topics are covered:
1. The calculation of the video signal-to-noise ratio for the commonly used television transmission systems (amplitude and frequency modulation),
2. A summary of the signal-to-noise ratio definitions (including noise weighting standards) currently in use for video transmission and con- version between these definitions, and
3. A brief discussion of the subjective evaluation of television picture quality in terms of signal-to-noise ratio.
14. KEY WORDS
signal-to-noise ratios noise interference amplitude modulation frequency modulation
television transmission systems video transmission television picture quality
38 UNCLASSIFIED
Security Classification

