signal analysis - upload.wikimedia.org · audio signal analysis (1a) 26 young won lim 2/15/18 sox...
TRANSCRIPT

Young Won Lim2/15/18
Signal Analysis

Young Won Lim2/15/18
Copyright (c) 2016 – 2018 Young W. Lim.
Permission is granted to copy, distribute and/or modify this document under the terms of the GNU Free Documentation License, Version 1.2 or any later version published by the Free Software Foundation; with no Invariant Sections, no Front-Cover Texts, and no Back-Cover Texts. A copy of the license is included in the section entitled "GNU Free Documentation License".
Please send corrections (or suggestions) to [email protected].
This document was produced by using LibreOffice.
Audio Signal Analysis (1A)
3 Young Won Lim2/15/18
Based on
Signal Processing with Free Software : Practical ExperimentsF. Auger

Audio Signal Analysis (1A)
4 Young Won Lim2/15/18
soxi
soxi s1.mp3soxi s1.mp3 > s1_info.txt
Input File ChannelsSample RatePrecisionDuration File SizBit RateSample Encoding

Audio Signal Analysis (1A)
5 Young Won Lim2/15/18
Generating signals using sox
sox -n s1.mp3 synth 3.5 sine 440sox -n s2.wav synth 90000s sine 660:1000sox -n s3.mp3 synth 1:20 triangle 440sox -n s4.mp3 synth 1:20 trapezium 440 sox -V4 -n s5.mp3 synth 6 square 440 0 0 40 sox -n s6.mp3 synth 5 noise

Audio Signal Analysis (1A)
6 Young Won Lim2/15/18
stat
Sox s1.mp3 -n statSox s1.mp3 -n stat > s1_info_stat.txt
Samples readLength (seconds)Scaled byMaximum amplitudeMinimum amplitudeMidline amplitudeMean normMean amplitudeRMS amplitudeMaximum deltaMinimum deltaMean deltaRMS deltaRough frequencyVolume adjustment

Audio Signal Analysis (1A)
7 Young Won Lim2/15/18
stats
Sox s1.mp3 -n statsSox s1.mp3 -n stats > s1_info_stat.txt
DC OffsetMin levelMax levelPk lev dBRMS lev dBRMS Pk dBRMS Tr dBCrest factorFlat factorPk countBit-depthNum samplesLength sScale maxWindow s

Audio Signal Analysis (1A)
8 Young Won Lim2/15/18
soxi
Sox -n s1a.wav synth 3 sine 660-2640Sox -n s1b.wav synth 3 sine 1320-5280Sox -n s1c.wav synth 3 sine 1980-7920Sox -m s1a.wav s1b.wav s1c.wav s1.wav
sox s1.wav -n spectrogram -o s1_sp1.pngsox s1.wav -n spectrogram -m -o s1_sp2.pngsox s1.wav -n spectrogram -l -o s1_sp3.pngsox s1.wav -n spectrogram –l -m -o s1_sp4.pngsox s1.wav -n spectrogram -l -m -S 0.5 -d 1.3 \
-o s1_sp5.png

Audio Signal Analysis (1A)
9 Young Won Lim2/15/18
sox -m s1a.wav s1b.wav s1c.wav s1.wav – beginning

Audio Signal Analysis (1A)
10 Young Won Lim2/15/18
sox -m s1a.wav s1b.wav s1c.wav s1.wav – ending
Audio Signal Analysis (1A)
11 Young Won Lim2/15/18
soxi
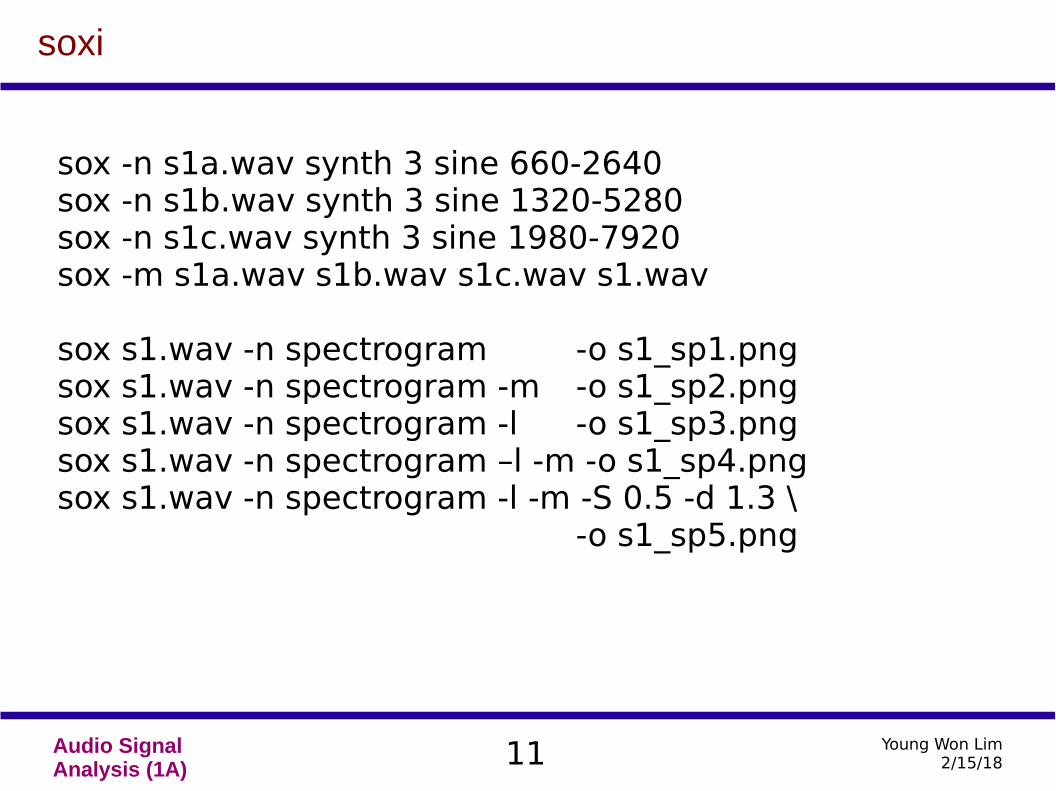
sox -n s1a.wav synth 3 sine 660-2640sox -n s1b.wav synth 3 sine 1320-5280sox -n s1c.wav synth 3 sine 1980-7920sox -m s1a.wav s1b.wav s1c.wav s1.wav
sox s1.wav -n spectrogram -o s1_sp1.pngsox s1.wav -n spectrogram -m -o s1_sp2.pngsox s1.wav -n spectrogram -l -o s1_sp3.pngsox s1.wav -n spectrogram –l -m -o s1_sp4.pngsox s1.wav -n spectrogram -l -m -S 0.5 -d 1.3 \
-o s1_sp5.png

Audio Signal Analysis (1A)
12 Young Won Lim2/15/18
soxi

Audio Signal Analysis (1A)
13 Young Won Lim2/15/18
soxi

Audio Signal Analysis (1A)
14 Young Won Lim2/15/18
soxi
sox -n chirp1.wav synth 3 sine 1000:20000sox -n chirp2.wav synth 3 sine 1000+20000sox -n chirp3.wav synth 3 sine 1000/20000
sox chirp1.wav -n spectrogram -o chirp1_sp.pngsox chirp2.wav -n spectrogram -o chirp2_sp.pngsox chirp3.wav -n spectrogram -o chirp3_sp.png

Audio Signal Analysis (1A)
15 Young Won Lim2/15/18
soxi

Audio Signal Analysis (1A)
16 Young Won Lim2/15/18
Sox remix usage examples
sox input.wav output.wav remix 6 7 8 0
creates an output file with four channelswhere channels 1, 2, and 3 are copies of channels 6, 7, and 8 in the input file, and channel 4 is silent.
sox input.wav output.wav remix 1−3,7 3
the left channel is a mix-down of input channels 1, 2, 3, and 7and the right channel is a copy of input channel 3.when a range of channels is specified the channel numbers to the left and right of the hyphen are optional and default to 1 and to the number of input channels respectively
sox input.wav output.wav remix −
performs a mix-down of all input channels to mono.
http://sox.sourceforge.net/sox.html
Audio Signal Analysis (1A)
17 Young Won Lim2/15/18
Sox trim usage examples
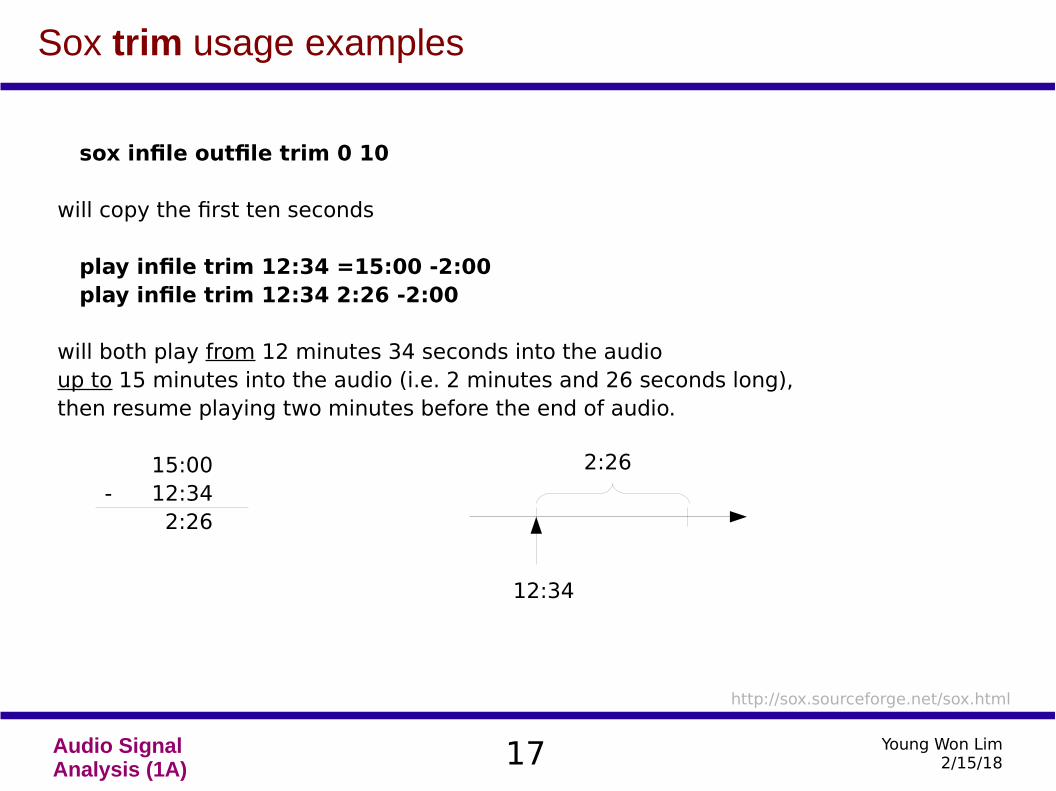
sox infile outfile trim 0 10
will copy the first ten seconds
play infile trim 12:34 =15:00 -2:00 play infile trim 12:34 2:26 -2:00
will both play from 12 minutes 34 seconds into the audio up to 15 minutes into the audio (i.e. 2 minutes and 26 seconds long), then resume playing two minutes before the end of audio.
15:00- 12:34
2:26
http://sox.sourceforge.net/sox.html
12:34
2:26

Audio Signal Analysis (1A)
18 Young Won Lim2/15/18
Sox -b usage examples
For an input file, the most common use for this option is to inform SoX of the number of bits per sample in a ‘raw’ (‘headerless’) audio file.
sox −r 16k −e signed −b 8 input.raw output.wav
converts a particular ‘raw’ file to a self-describing ‘WAV’ file.
For an output file, this option can be used (perhaps along with −e) to set the output encoding size. By default, the output encoding size will be set to the input encoding size. (providing it is supported by the output file type)
sox input.cdda −b 24 output.wav
converts raw CD digital audio (16-bit, signed-integer) to a 24-bit (signed-integer) ‘WAV’ file.
http://sox.sourceforge.net/sox.html

Audio Signal Analysis (1A)
19 Young Won Lim2/15/18
Sox dither usage examples
dither [−S|−s|−f filter] [−a] [−p precision]
Apply dithering to the audio. Dithering deliberately adds a small amount of noise to the signal in order to mask audible quantization effects that can occur if the output sample size is less than 24 bits.
With no options, this effect will add triangular (TPDF) white noise. Noise-shaping (only for certain sample rates) can be selected with −s.
With the −f option, it is possible to select a particular noise-shaping filter from the following list: lipshitz, f-weighted, modified-e-weighted, improved-e-weighted, gesemann, shibata, low-shibata, high-shibata.
Note that most filter types are available only with 44100Hz sample rate. The filter types are distinguished by the following properties: audibility of noise, level of (inaudible, but in some circumstances, otherwise problematic) shaped high frequency noise, and processing speed.
http://sox.sourceforge.net/sox.html

Audio Signal Analysis (1A)
20 Young Won Lim2/15/18
Sox rate usage examples (1)
the following two commands are equivalent:
sox input.wav −r 48k output.wav bass −b 24 sox input.wav output.wav bass −b 24 rate 48k
the rate option is more flexible allows rate’s other options and allows the effects to be ordered arbitrarily
sox input.wav −b 16 output.wav rate −s −a 44100 dither −s
sox input.wav −b 24 output.aiff rate −v −I −b 90 48k
http://sox.sourceforge.net/sox.html

Audio Signal Analysis (1A)
21 Young Won Lim2/15/18
Sox rate usage examples (2)
sox input.wav −b 16 output.wav rate −s −a 44100 dither −s
default (high) quality resampling; overrides: steep filter, allow aliasing; to 44.1kHz sample rate; noise-shaped dither to 16-bit WAV file.
−s ‘steep filter’ changes resampling band-width from the default 95% (based on the 3dB point), to 99%.
−a option is given, then aliasing/imaging above the pass-band is allowed.
http://sox.sourceforge.net/sox.html

Audio Signal Analysis (1A)
22 Young Won Lim2/15/18
Sox rate usage examples (3)
sox input.wav −b 24 output.aiff rate −v −I −b 90 48k
very high quality resampling; overrides: intermediate phase, band-width 90%; to 48k sample rate; store output to 24-bit AIFF file.
−M, −I, or −L option : Minimum, intermediate, or linear phase response −p option : a custom phase response
Note that phase responses between ‘linear’ and ‘maximum’ (greater than 50) are rarely useful.
http://sox.sourceforge.net/sox.html
Audio Signal Analysis (1A)
23 Young Won Lim2/15/18
Sox delay usage examples
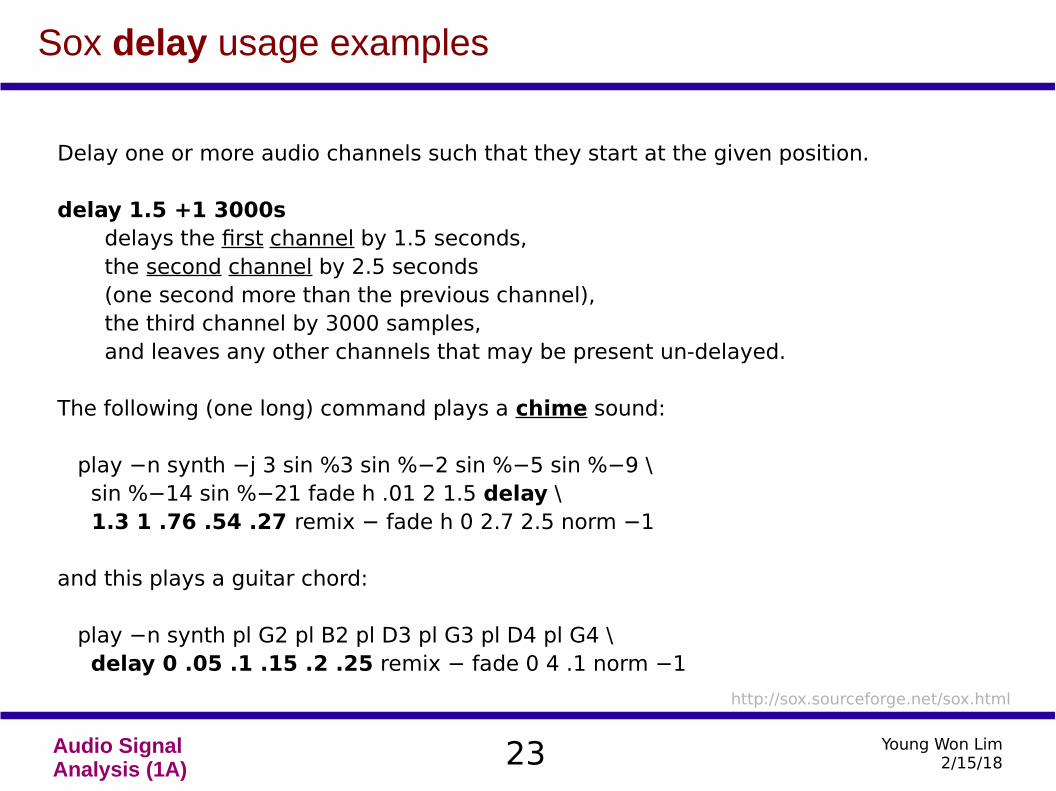
Delay one or more audio channels such that they start at the given position.
delay 1.5 +1 3000s delays the first channel by 1.5 seconds, the second channel by 2.5 seconds (one second more than the previous channel), the third channel by 3000 samples, and leaves any other channels that may be present un-delayed.
The following (one long) command plays a chime sound:
play −n synth −j 3 sin %3 sin %−2 sin %−5 sin %−9 \ sin %−14 sin %−21 fade h .01 2 1.5 delay \ 1.3 1 .76 .54 .27 remix − fade h 0 2.7 2.5 norm −1
and this plays a guitar chord:
play −n synth pl G2 pl B2 pl D3 pl G3 pl D4 pl G4 \ delay 0 .05 .1 .15 .2 .25 remix − fade 0 4 .1 norm −1
http://sox.sourceforge.net/sox.html

Audio Signal Analysis (1A)
24 Young Won Lim2/15/18
Sox stat usage examples (1)
stat [−s scale] [−rms] [−freq] [−v] [−d]
Display time and frequency domain statistical information about the audio. Audio is passed unmodified through the SoX processing chain.
The −s option can be used to scale the input data by a given factor. The default value of scale is 2147483647 (i.e. the maximum value of a 32-bit signed integer). Internal effects always work with signed long PCM data and so the value should relate to this fact.
http://sox.sourceforge.net/sox.html

Audio Signal Analysis (1A)
25 Young Won Lim2/15/18
Sox stat usage examples (2)
stat [−s scale] [−rms] [−freq] [−v] [−d]
The −rms option will convert all output average values to ‘root mean square’ format.
The −v option displays only the ‘Volume Adjustment’ value.
The −freq option calculates the input’s power spectrum (4096 point DFT) instead of the statistics listed above. This should only be used with a single channel audio file.
The −d option displays a hex dump of the 32-bit signed PCM data audio in SoX’s internal buffer. This is mainly used to help track down endian problems that sometimes occur in cross-platform versions of SoX.
http://sox.sourceforge.net/sox.html

Audio Signal Analysis (1A)
26 Young Won Lim2/15/18
Sox stat usage examples (3)
n is the duration of the audio in samples, c is the number of audio channels, r is the audio sample rate, and xk represents the PCM value (in the range −1 to +1 by default)
of each successive sample in the audioNote that the delta measurements are not applicable for multi-channel audio.
http://sox.sourceforge.net/sox.html
Samples read n×cLength (seconds) n/rScaled by max amplitude max( xk)
Scaled by min amplitude min(xk)
Scaled by midline amplitude12
(max(x k)+min(xk ))
mean norm1n
Σ|xk|
mean amplitude1n
Σ xk
RMS amplitude √1n
Σ xk
max delta max (|xk− xk−1|)min delta min(|xk−xk−1|)
mean delta √1n−1
∑ (|xk− xk−1|)
rough frequencyvolum adjustment

Audio Signal Analysis (1A)
27 Young Won Lim2/15/18
Sox stat usage examples (4)
Max amplitude : The maximum samplevalue in the audio; usually this will be a positive number.Min amplitude : The minimum sample value in the audio; usually this will be a negative number.Mean norm : The average of the absolute value of each sample in the audio. Mean amplitude : The average of each samplein the audio. If this figure is non-zero, then it indicatesthe presence of a D.C. offset (which could be removedusing the dcshift effect).RMS amplitude : The level of a D.C. signal that would have the same power as the audio’s average power.Rough frequency : in HzVolume Adjustment : The parameter to the vol effect which would make the audio as loud as possiblewithout clipping. Note: See the discussion on Clippingabove for reasons why it is rarely a good idea actually todo this.
http://sox.sourceforge.net/sox.html
Audio Signal Analysis (1A)
28 Young Won Lim2/15/18
Sox stats usage examples (1)
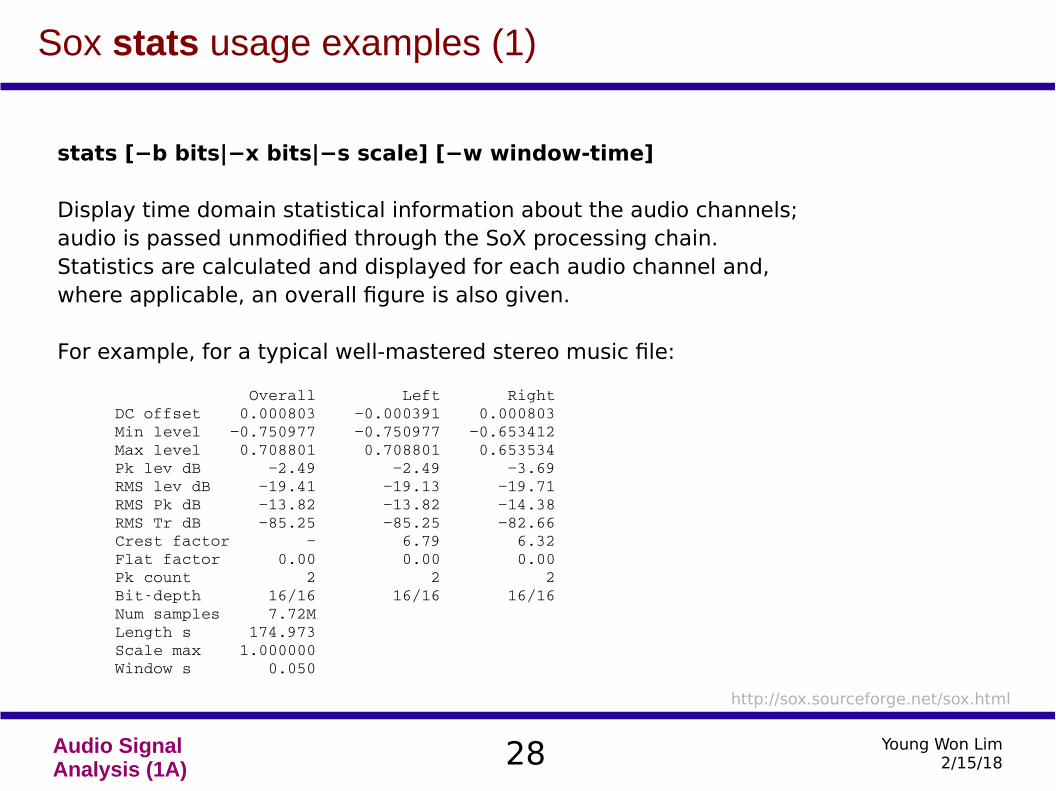
stats [−b bits|−x bits|−s scale] [−w window-time]
Display time domain statistical information about the audio channels; audio is passed unmodified through the SoX processing chain. Statistics are calculated and displayed for each audio channel and, where applicable, an overall figure is also given.
For example, for a typical well-mastered stereo music file:
http://sox.sourceforge.net/sox.html
Overall Left RightDC offset 0.000803 −0.000391 0.000803Min level −0.750977 −0.750977 −0.653412Max level 0.708801 0.708801 0.653534Pk lev dB −2.49 −2.49 −3.69RMS lev dB −19.41 −19.13 −19.71RMS Pk dB −13.82 −13.82 −14.38RMS Tr dB −85.25 −85.25 −82.66Crest factor − 6.79 6.32Flat factor 0.00 0.00 0.00Pk count 2 2 2Bitdepth 16/16 16/16 16/16Num samples 7.72M Length s 174.973Scale max 1.000000 Window s 0.050
Audio Signal Analysis (1A)
29 Young Won Lim2/15/18
Sox stats usage examples (2)
DC offset, Min level, and Max level are shown, by default, in the range ±1. −b (bits) to be scaled to a signed integer with the given number of bits; for example, for 16 bits, the scale would be −32768 to +32767. −x is similar to −b except in hexadecimal −s scales by a given floating-point number.
Pk lev dB and RMS lev dB are standard peak and RMS level measured in dBFS. RMS Pk dB and RMS Tr dB are peak and trough values for RMS level measured over a short window (default 50ms).
Crest factor is the standard ratio of peak to RMS level (note: not in dB).
Flat factor is a measure of the flatness (i.e. consecutive samples with the same value) of the signal at its peak levels (i.e. either Min level, or Max level). Pk count is the number of occasions (not the number of samples) that the signal attained either Min level, or Max level.
http://sox.sourceforge.net/sox.html

Audio Signal Analysis (1A)
30 Young Won Lim2/15/18
Sox stats usage examples (3)
The right-hand Bit-depth figure is the standard definition of bit-depth i.e. bits less significant than the given number are fixed at zero. The left-hand figure is the number of most significant bits that are fixed at zero (or one for negative numbers) subtracted from the right-hand figure (the number subtracted is directly related to Pk lev dB).
http://sox.sourceforge.net/sox.html

Audio Signal Analysis (1A)
31 Young Won Lim2/15/18
Sox stats usage examples (4)
For multi-channel audio, an overall figure for each of the above measurements is given and derived from the channel figures as follows: DC offset: maximum magnitude; Max level, Pk lev dB, RMS Pk dB, Bit-depth: maximum; Min level, RMS Tr dB: minimum; RMS lev dB, Flat factor, Pk count: average; Crest factor: not applicable.
http://sox.sourceforge.net/sox.html

Audio Signal Analysis (1A)
32 Young Won Lim2/15/18
Sox stats usage examples (5)
Length s is the duration in seconds of the audio, and Num samples is equal to the sample-rate multiplied by Length. Scale Max is the scaling applied to the first three measurements; specifically, it is the maximum value that could apply to Max level. Window s is the length of the window used for the peak and trough RMS measurements.
http://sox.sourceforge.net/sox.html

Audio Signal Analysis (1A)
33 Young Won Lim2/15/18
Sox spectrogram
the audio is passed unmodified through the SoX processing chainto create a spectrogram of the audio
the spectrogram is rendered in a PNG file ● time in the X-axis ● frequency in the Y-axis● magnitude in the Z-axis by the colour or the intensity
multiple channels are shown from top to bottom starting from channel 1 (the left channel for stereo audio).
http://sox.sourceforge.net/sox.html

Audio Signal Analysis (1A)
34 Young Won Lim2/15/18
Sox spectrogram usage examples (1)
‘my.wav’ is a stereo file‘spectrogram.png’ is a spectrogram
sox my.wav −n spectrogram
sox my.wav −n remix 2 trim 20 30 spectrogram
sox my.wav −n rate 6k spectrogram
http://sox.sourceforge.net/sox.html

Audio Signal Analysis (1A)
35 Young Won Lim2/15/18
Sox spectrogram usage examples (2)
* to analyze a smaller portion of the audio
sox my.wav −n remix 2 trim 20 30 spectrogram
only from the second (right) channel 2duration of 30 seconds starting from 20 seconds in 20 30
* to analyze a small portion of the frequency domain the rate effect may be used
sox my.wav −n rate 6k spectrogram
detailed analysis of frequencies 6kup to 3kHz (half the sampling rate)
http://sox.sourceforge.net/sox.html

Audio Signal Analysis (1A)
36 Young Won Lim2/15/18
Sox spectrogram usage examples (3)
sox my.wav −n trim 0 10 spectrogram −x 600 −y 200 −z 100
controls the size of the spectrogram’s X, Y, Z axes 600 by 200 pixels in size the Z-axis range will be 100 dB
sox −n −n synth 6 tri 10k:14k spectrogram −z 100 −w kaiser
an analysis ‘window’ with high dynamic range is selected to best display the spectrogram of a swept triangular wave.
http://sox.sourceforge.net/sox.html
Audio Signal Analysis (1A)
37 Young Won Lim2/15/18
Sox spectrogram usage examples (4)
append the following to the ‘chime’ command in the description of the delay effect (above):
rate 2k spectrogram −X 200 −Z −10 −w kaiser
http://sox.sourceforge.net/sox.html

Audio Signal Analysis (1A)
38 Young Won Lim2/15/18
Sox spectrogram usage examples (5)
to control the appearance (colour-set, brightness, contrast, etc.) and filename of the spectrogram; e.g. with
sox my.wav −n spectrogram −m −l −o print.png
a spectrogram is created suitable for printing on a ‘black and white’ printer.
−m : Creates a monochrome spectrogram (the default is colour).−l : Creates a ‘printer friendly’ spectrogram with a light background (the default has a dark background).
http://sox.sourceforge.net/sox.html
Audio Signal Analysis (1A)
39 Young Won Lim2/15/18
Sox spectrogram -d
−d durationsets the X-axis resolution such that audio with the given duration (a time specification) fits the selected (or default) X-axis width.
sox input.mp3 output.wav −n spectrogram −d 1:00 stats
creates a spectrogram showing the first minute of the audio, whilst the stats effect is applied to the entire audio signal.
See also −X for an alternative way of setting the X-axis resolution.
http://sox.sourceforge.net/sox.html

Audio Signal Analysis (1A)
40 Young Won Lim2/15/18
Sox spectrogram -x -X
−x numSets the X-axis size in pixelsChange the (maximum) width (X-axis) of the spectrogram default value of 800 pixels [100 ~ 200000]. See also −X and −d.
−X numX-axis pixels/second; the default is auto-calculated to fit the given or known audio duration to the X-axis size, or 100 otherwise. with −d, this option affects the width of the spectrogram; otherwise, it affects the duration of the spectrogram. [1 ~ 5000] need not be an integer. a slight adjustment for processing quantisation reasons; if so, SoX will report the actual number used (viewable when the SoX global option −V is in effect). See also −x and −d.
http://sox.sourceforge.net/sox.html

Audio Signal Analysis (1A)
41 Young Won Lim2/15/18
Sox spectrogram -y -Y
−y numSets the Y-axis size in pixels (per channel); this is the number of frequency bins used N.B. it can be slow to produce the spectrogram if this number is not one more than a power of two (e.g. 129). By default the Y-axis size is chosen automatically (depending on the number of channels). See −Y for alternative way of setting spectrogram height.
−Y numSets the target total height of the spectrogram(s). The default value is 550 pixels. Using this option (and by default), SoX will choose a height for individual spectrogram channels that is one more than a power of two, so the actual total height may fall short of the given number. However, there is also a minimum height per channel so if there are many channels, the number may be exceeded. See −y for alternative way of setting spectrogram height.
http://sox.sourceforge.net/sox.html

Audio Signal Analysis (1A)
42 Young Won Lim2/15/18
Sox spectrogram -z -Z
−z numZ-axis (colour) range in dB, default 120. This sets the dynamic-range of the spectrogram to be −num dBFS to 0 dBFS. Num may range from 20 to 180. Decreasing dynamic-range effectively increases the ‘contrast’ of the spectrogram display, and vice versa.
−Z numSets the upper limit of the Z-axis in dBFS. A negative num effectively increases the ‘brightness’ of the spectrogram display,
http://sox.sourceforge.net/sox.html

Audio Signal Analysis (1A)
43 Young Won Lim2/15/18
Sox spectrogram -q
−q num
Sets the Z-axis quantisation, i.e. the number of different colours (or intensities) in which to render Z-axis values. A small number (e.g. 4) will give a ‘poster’-like effect making it easier to discern magnitude bands of similar level. Small numbers also usually result in small PNG files. The number given specifies the number of colours to use inside the Z-axis range; two colours are reserved to represent out-of-range values.
http://sox.sourceforge.net/sox.html
Audio Signal Analysis (1A)
44 Young Won Lim2/15/18
Sox spectrogram -w -W
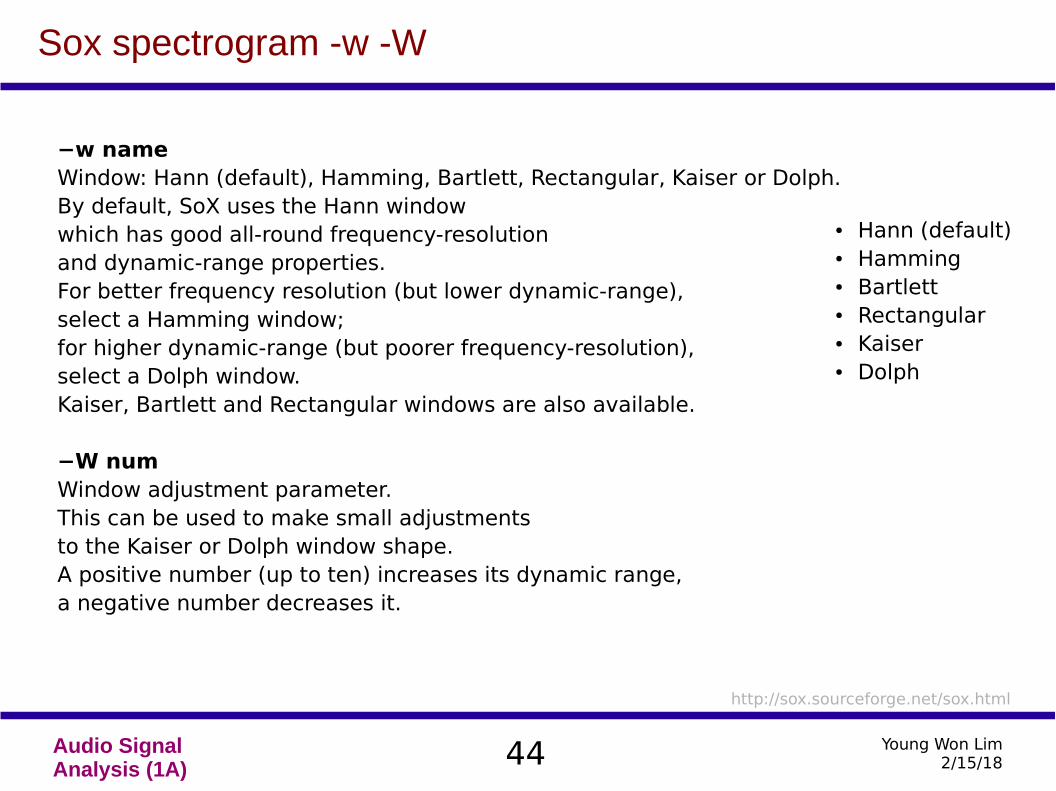
−w nameWindow: Hann (default), Hamming, Bartlett, Rectangular, Kaiser or Dolph. By default, SoX uses the Hann window which has good all-round frequency-resolution and dynamic-range properties. For better frequency resolution (but lower dynamic-range), select a Hamming window; for higher dynamic-range (but poorer frequency-resolution), select a Dolph window. Kaiser, Bartlett and Rectangular windows are also available.
−W numWindow adjustment parameter. This can be used to make small adjustments to the Kaiser or Dolph window shape. A positive number (up to ten) increases its dynamic range, a negative number decreases it.
http://sox.sourceforge.net/sox.html
● Hann (default)● Hamming● Bartlett● Rectangular● Kaiser● Dolph

Audio Signal Analysis (1A)
45 Young Won Lim2/15/18
Sox spectrogram -s, -m, -h
−sAllow slack overlapping of DFT windows. This can, in some cases, increase image sharpness and give greater adherence to the −x value, but at the expense of a little spectral loss.
−mCreates a monochrome spectrogram (the default is colour).
−hSelects a high-colour palette-less visually pleasingthan the default colour palette, but it may make it easier to differentiate different levels. If this option is used in conjunction with −m, the result will be a hybrid monochrome/colour palette.
http://sox.sourceforge.net/sox.html

Audio Signal Analysis (1A)
46 Young Won Lim2/15/18
Sox spectrogram -p -l -a -r
−p numPermute the colours in a colour or hybrid palette. The num parameter, from 1 (the default) to 6, selects the permutation.
−lCreates a ‘printer friendly’ spectrogram with a light background (the default has a dark background).
−aSuppress the display of the axis lines. This is sometimes useful in helping to discern artifacts at the spectrogram edges.
−rRaw spectrogram: suppress the display of axes and legends.
http://sox.sourceforge.net/sox.html

Audio Signal Analysis (1A)
47 Young Won Lim2/15/18
Sox spectrogram -A -t text -c text -o file
−ASelects an alternative, fixed colour-set. This is provided only for compatibility with spectrograms produced by another package. It should not normally be used as it has some problems, not least, a lack of differentiation at the bottom end which results in masking of low-level artifacts.
−t textSet the image title - text to display above the spectrogram.
−c textSet (or clear) the image comment - text to display below and to the left of the spectrogram.
−o fileName of the spectrogram output PNG file, default ‘spectrogram.png’. If ‘-’ is given, the spectrogram will be sent to standard output (stdout).
http://sox.sourceforge.net/sox.html

Audio Signal Analysis (1A)
48 Young Won Lim2/15/18
soxi
sox -n chirp1.wav synth 3 sine 1000:20000sox -n chirp2.wav synth 3 sine 1000+20000sox -n chirp3.wav synth 3 sine 1000/20000
sox chirp1.wav -n spectrogram -o chirp1_sp.pngsox chirp2.wav -n spectrogram -o chirp2_sp.pngsox chirp3.wav -n spectrogram -o chirp3_sp.png
Audio Signal Analysis (1A)
49 Young Won Lim2/15/18
soxi
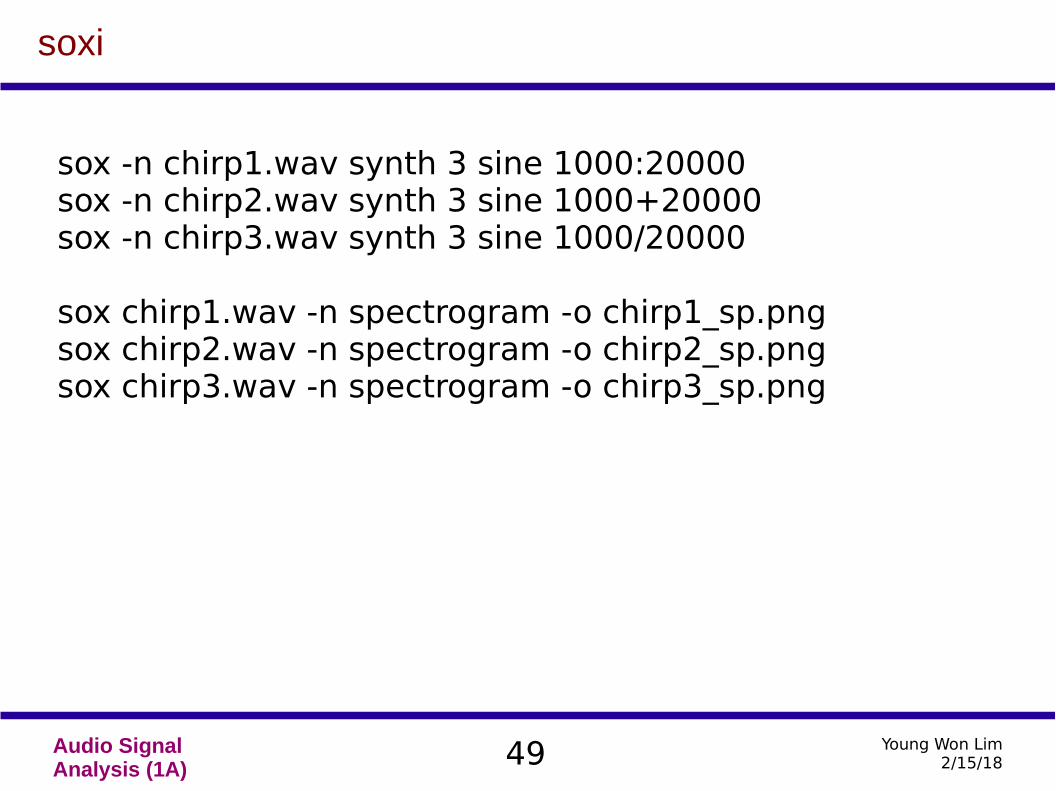
sox -n chirp1.wav synth 3 sine 1000:20000sox -n chirp2.wav synth 3 sine 1000+20000sox -n chirp3.wav synth 3 sine 1000/20000
sox chirp1.wav -n spectrogram -o chirp1_sp.pngsox chirp2.wav -n spectrogram -o chirp2_sp.pngsox chirp3.wav -n spectrogram -o chirp3_sp.png

Young Won Lim2/15/18
References
[1] F. Auger, Signal Processing with Free Software : Practical Experiments