sightlines llc ui itf mi stptti university o maine system ... o maine system presentation ui ifmi i...
TRANSCRIPT

University of HartfordUniversity of Idaho
University of Illinois at ChicagoUniversity of Illinois at Urbana‐Champaign
The University of MaineUniversity of Maine at Augusta
University of Maine at FarmingtonUniversity of Maine at FarmingtonUniversity of Maine at Machias
University of Maine at Presque IsleUniversity of Maine at Fort Kent
University of MarylandUniversity of Massachusetts Amherst
University of Massachusetts Dartmouth
Sightlines LLCU i it f M i S t P t ti
yUniversity of Massachusetts Lowell
University of MichiganUniversity of Minnesota
University of Mississippi Medical CenterUniversity of Missouri
University of Missouri ‐ Kansas CityU i i f Mi i S L iUniversity of Maine System Presentation
FY2011University of Missouri ‐ St. Louis
University of New HampshireUniversity of New HavenUniversity of North TexasUniversity of Notre Dame
University of OregonUniversity of Pennsylvania
January 23, 2012Presented by: Jim Kadamus & Jon King
University of PennsylvaniaUniversity of PortlandUniversity of Redlands
The University of Rhode Island, Narragansett BayThe University of Rhode Island, Feinstein Providence
The University of Rhode Island, KingstonUniversity of RochesterUniversity of San Diego
University of San FranciscoUniversity of St. Thomas (TX)University of Southern Maine
University of Southern MississippiUniversity of the Pacific
University of the Sciences in Philadelphia
1
University of the Sciences in PhiladelphiaUniversity of VermontUpper Iowa University
Utica CollegeVirginia Commonwealth University
Virginia Department of General ServicesWashburn University

Sightlines profileCommon vocabulary, consistent methodology, credibility through benchmarking
• 10 year old company based in Guilford, CT
2
• Common vocabulary and consistent methodology• 95% Annual retention rate
• Tracking $5.9 billion in operations budgets and $4.2 billion in capital projects• Database of 23,500 buildings and 825 million GSF

A vocabulary for measurementThe Return on Physical Assets – ROPASM
Th l Th l t d Th ff ti Th fThe annual investment needed to insure buildings will properly perform and reach
The accumulated backlog of repair and modernization needs and the definition of
The effectiveness of the facilities operating budget, staffing, supervision and
The measure of service process, the maintenance quality of space and systems and the
Annual
perform and reach their useful life “Keep‐Up Costs”
Asset
definition of resource capacity to correct them. “Catch‐Up Costs”
Operational
supervision, and energy management
systems, and the customers opinion of service delivery
Annual Stewardship
Asset Reinvestment
Operational Effectiveness Service
Asset Value Change Operations Success
3

Institution abbreviations and peer systems
State System ComparisonsUniversity of Maine System Institutions: Abbreviation
Mississippi Institutions of Higher Learning
Oregon University System
University of Maine UM
University of Maine at Augusta UMAg y y
Pennsylvania State System of HigherEducation
University of Maine at Farmington UMF
University of Maine at Fort Kent UMFK
University of Alaska System
University of Missouri System
y
University of Maine at Machias UMM
University of Missouri System
University System of New Hampshire
University of Maine at Presque Isle UMPI
University of Southern Maine USM
4

Core Observations
Aging Campus Profile:Although the Maine System has seen some recent new space and major renovations, 69% of System space is over 25 years of age, a time at which critical b ildi d d d i i d dbuilding needs come due and investment is needed.
Historically Low Capital Investment:Annual Stewardship funding has been insufficient to meet SightlinesAnnual Stewardship funding has been insufficient to meet Sightlines recommended investment targets across the System. Furthermore, one‐time infusions of capital have been inadequate to make up the annual shortfall andaddress the growing backlog of needs.address the growing backlog of needs.
Solid Operations Performance:Solid operations metrics, generally satisfied customers, and improving energy p g y p g gymanagement indicate effectiveness of campus facilities staff despite limited funds and generally inadequate service process.
5

Physical Profile
6

C A Di t ib ti ti
UM System age profile – 69% of space over 25 years oldUM System Total GSF: 9.03 Million
29% 30%90%
100%
Campus Age Distribution over time
29% 30% 35%
60%
70%
80%
43% 38% 34%
40%
50%
60%
20%
10% 11% 13%
10%
20%
30%
18% 20% 18%
0%
10%
U Maine System 2006 U Maine System 2009 U Maine System 2011
7
Under 10 10 to 25 25 to 50 Over 50

C A Di t ib ti ti
UM System age profile – 69% of space over 25 years oldUM System Total GSF: 9.03 Million
29% 30%90%
100%
Campus Age Distribution over time
29% 30%
60%
70%
80% Very High Risk
43% 38%
40%
50%
60%
High Risk
20%
10% 11%
10%
20%
30%
Moderate Risk
18% 20%
0%
10%
U Maine System 2006 U Maine System 2009 U Maine System 2011
Low Risk
8
Under 10 10 to 25 25 to 50 Over 50

UM System age profile compared to public universitiesMaine has more space in the over 50 category compared to other public schools
Renovation Age Profile by Category
40%
45%
50%Renovation Age Profile by Category
34% 35%
39%
30%
35%
40%
18%21% 19% 21%
15%
20%
25%
18%
13%
5%
10%
15%
0%Under 10 10 to 25 25 to 50 Over 50
UM System Public University Database Average
9
y y g

Space Per Student vs. Public DatabaseUM has a comparable amount of program space and more residential space per student
Program Space per Student FTE Residential Space per Student FTE
180
200
Program Space per Student FTE
180
200
Residential Space per Student FTE
140
160
t
140
160
100
120
per S
tude
nt
100
120
60
80
GSF p
60
80
20
40
20
40
10
‐Maine Public Average
‐Maine Public Average

Asset Value Change Analysis
11

University of Maine System Investment Profile
System Total Project Spending$292M spent in last 6 years; 44% into existing facilities
$80.0
$90.0
University of Maine System Investment Profile6‐Year Capital Investment
Distribution
$3.4
$5.9
$60.0
$70.0 5%
$44.6
$45.8
$8 9
$1.5
$1.0
$0 8$40.0
$50.0
n Millions UM System Annual Average 2011‐ $48.7M 44%
51%
UM System Annual Average 2010‐ $51.2M
$32 8
$26.0$8.9
$4 9
$18.0
$1.6
$0.8
$20.0
$30.0
$ i
$20.8 $18.5$25.7
$32.8
$14.6 $17.7
$4.9
$0.0
$10.0Significant Projects from FY2011:• AEWC Expansion at UM• Community Arts Center at UMF• Dental Clinic Renovation at UMA Bangor campus
12
2006 2007 2008 2009 2010 2011
Existing Space New Space Non‐Facilities
UMA‐Bangor campus

Investment into existing space system comparisonFY2011 investment the lowest of peer systems and half of the public university average
FY2011 Capital investment into existing space
$6.00
$7.00FY2011 Capital investment into existing space
$5.00
$
Peer Systems Average: $4.19/GSF
$3.00
$4.00
$/GSF
$2.00
$0.00
$1.00
13
Maine B C D E F G
SL Public University FY2011 avg. ‐ $3.86/GSF
Increased 5%+ Decreased 5%+ Stayed within 5%Change from FY10:

Balanced mix of spending into existing spaceIncreased investments in FY 2011 to protect and sustain building systems
UM S t FY2011UM S t FY2006 2010 P bli U i iti FY2006
21%5%
UM System FY2011Investment Mix
13%13%
UM System FY2006‐2010Investment Mix
13%6%
Public Universities FY2006‐2011 Investment Mix
21%
25%
29%
30%
37%12%
29%30% 29%
22%15% 22%
14
FY2011 Stewardship Targets
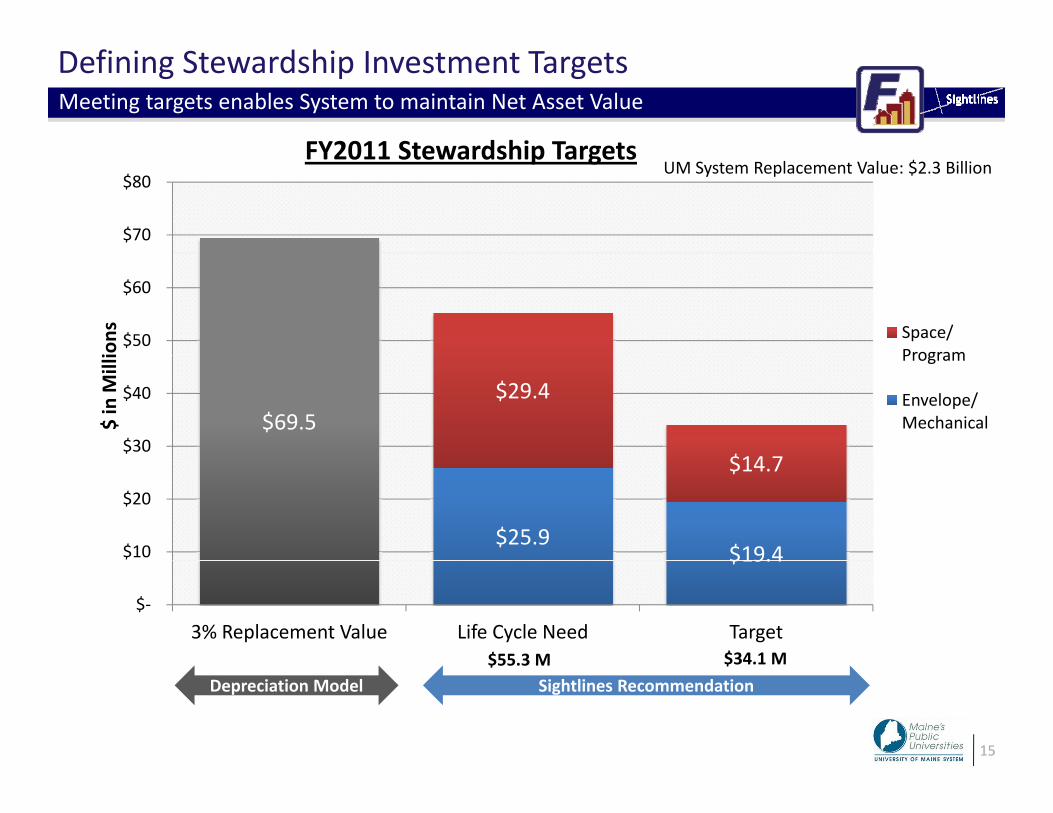
Defining Stewardship Investment TargetsMeeting targets enables System to maintain Net Asset Value
$70
$80 FY2011 Stewardship Targets
UM System Replacement Value: $2.3 Billion
$50
$60
ions Space/
Program
$69.5$29.4
$14 7$30
$40
$ in M
illi Program
Envelope/ Mechanical
$25.9$19.4
$14.7
$10
$20
$19.4
$‐3% Replacement Value Life Cycle Need Target
$55.3 M $34.1 M
15
Depreciation Model Sightlines Recommendation$55.3 M $34.1 M

Total capital investment over time
$
UM System reaching target zone in only one of the last six years
Total Capital Investment FY06‐FY11
$50.0
$55.0
$60.0
Increasing Asset Value
p
$35.0
$40.0
$45.0
ns
Stabilizing Asset Value
$20 0
$25.0
$30.0
$ in M
illion
Declining Asset Value
$10.0
$15.0
$20.0
$0.0
$5.0
FY2006 FY2007 FY2008 FY2009 FY2010 FY2011
16
Recurring Capital One‐Time Capital

Net Asset Value by CampusUM System is below public database; remains above the critical maintenance stage
NAV Index
90%
100%Capital Upkeep Stage: Primarily new or recently renovated buildings w/ sporadic building repair & life cycle needs; “You pick the projects”
NAV Index
UM70%
80%
Public Database Average= 73%Repair and Maintain Stage: Buildings are beginning to show their age and may require more significant investment on a case‐by‐case basis
W i ht d UM i S t A 68%
UMA UMPIUMFK USM UMM UMF
50%
60%
y
Systemic Renovation Stage: Buildings may require more significant repairs ; large‐scale capital infusions/ renovations are inevitable; “The
Weighted UMaine System Average = 68%
30%
40%Critical Maintenance/Gut Renovation Stage: Major buildings
i j d f
renovations are inevitable; The projects pick you”
10%
20%
30%
(Replacement Value Building Needs)
components are in jeopardy of complete failure. Reliability issues are widespread throughout the building.
17
0%
10% (Replacement Value – Building Needs)Replacement ValueNAV=

Asset Reinvestment Backlog EstimationStrategic investments of capital keeps UM System backlog in line with public average
T t l A t R i t t B kl $/GSF M i t R i B kl $/GSF
$80 $88
$60$70 $80 $90 $100
Total Asset Reinvestment Backlog $/GSF Maintenance Repair Backlog $/GSF
$45 $45
$10$20 $30 $40 $50 $60
$0 $10
UM System SL Public University Avg. UM System‐Maint/Repair SL Public University Avg‐Maint/Repair
$120 00Total Asset Reinvestment Backlog $/GSF by Campus
$80.00
$100.00
$120.00 g y p
Campus Backlog $/GSF Range: $67– $98
$20.00
$40.00
$60.00
18
$‐UM USM UMA UMF UMFK UMM UMPI

Campus Operations
19

Facilities Operating BudgetSystem budget higher than Public University Average, but lower than in FY 2010
$8 00 UM System: ‐ Year DistributionFY2011 Facilities Operating Budget
36%
$7.00
$8.00 UM System: ‐ Year Distributionp g g
62%
36%
$
$2.66
$2.22 $5.00
$6.00
2%$0.12 $0.23
$
$4.00 Public Database : 6‐ Year
35%$4.61
$3.98 $2.00
$3.00 Distribution
61%4%$‐
$1.00
20
4%$UM System Public Database
Daily Service Planned Maintenance Utilities

UM System Energy AnalysisUnit costs decreased in FY11, but harsh winter increased consumption
40
System Composite Total Unit Cost120,000
System Composite Energy Consumption
25
30
35
80,000
100,000
15
20
25
$/MMBT
U
40,000
60,000
BTU/G
SF‐
5
10
0
20,000
2006 2007 2008 2009 2010 2011
Fossil $/MMBTU Electricity $/MMBTU
2006 2007 2008 2009 2010 2011
21

Service Process in need of improvement across SystemImproved service process will make facilities operations more proactive and efficient
Service Process Index vs. Peer Systems
90%
100%Service Process Index vs. Peer Systems
70%
80%
40%
50%
60%
20%
30%
40%
0%
10%
20%
22
0%Maine B C D E F G

Service ProcessUnderstanding the effectiveness of a powerful work order system
Service Process
Centralization
Organization
Work Request System
Scheduling
‐ 1.00 2.00 3.00 4.00 5.00
Performance Measurement
Enhancing your Service Process
Install a functioning system
Install a functioning system
Make sure the system provides more than data
Make sure the system provides more than data
Streamline your work‐order process
Streamline your work‐order process
Clearly define who does what
Clearly define who does what
Track and report frequently for reliable data
Track and report frequently for reliable data
Track and report frequently for reliable data
23

Service ProcessUnderstanding the effectiveness of a powerful work order system
Strategic Capital
Decisions
•Assess buildings with largest number of requests
•Assess trades with most requests
Track and report frequently for reliable data
Decisions • Identify potential projects and address with capital funding
Strong Planned Maint.
•Designate PM work orders within system
•Track PM labor and materials costs
•Develop PM schedule throughProgram
Develop PM schedule through standing/recurring work requests
Effective & Efficient Operating
•Regularly assess backlog of work orders
• Identify trades or zones with greatest draw on resources
•Reallocate resources as needed
24
Staff • Improve customer communication

Bringing it all together
25

Concluding CommentsFY2011 Progress & Actions
FY2011 UM S t P dFY2010 UM System Recommendations FY2011 UM System Progress and Recommendations
• FY 2011 data provides evidence that a greater• Develop an annual stewardship investment strategy focused on envelope/mechanical lifecycle replacements.
FY 2011 data provides evidence that a greater percentage of capital funds are being used for envelope/mechanical lifecycle projects. This focus on core existing space issues should be monitored and continued.
• A portion of the annual investment should continue to come from campus operating budgets, possibly supported by increasing efficiencies in daily operations and reducing
• Campus are beginning to make annual stewardship commitments by funding a portion of investment targets. This effort should be
i denergy costs.
• Update/expand the database of deferred maintenance projects.
continued.
• There is still a need to document deferred maintenance projects at the campus and building level as a basis for capital prioritieslevel as a basis for capital priorities.
26
Concluding CommentsFY2011 Progress & Actions
FY2011 UM System Progress andFY2010 UM System Recommendations
• Develop a request for capital funding that targets
FY2011 UM System Progress and Recommendations
• The University is working with Sightlines to identify Develop a request for capital funding that targets priority projects that will raise the overall Net Asset Value (NAV) of campuses in the system as a whole.
the highest need buildings as determined by their NAV as a factor in developing a capital funding request. The current economic environment makes acquiring additional capital challenging.
• Limit funding for new space unless that space is replacing obsolete buildings with significant li bili bl
• Enrollment and space trends support a policy to limit new space investments unless that space is replacing obsolete, low NAV buildings or there is a demonstrated mission related need for the spacereliability problems.
• Modernize the Integrated Work Management
demonstrated mission‐related need for the space.
• Proposals to develop a work management system have been solicited and a decision to move forward will occur in 2012. Having this system in place will • Modernize the Integrated Work Management
System.
• Develop a comprehensive energy plan to identify
g y phelp document high need buildings and set capital priorities.
• FY 2011 report identifies projects at each campus that
27
p p gy p yand implement campus projects that will provide additional energy savings.
have generated energy savings. Opportunities should continue to be identified and pursued.

Questions & Discussion
28