sifma-cerulli project update · project overview. project overview. research findings state of...
TRANSCRIPT

SIFMA-Cerulli Individual Investor Project
June 12, 2020

Project Overview
Research Findings○ State of Market○ Opportunities○ Evolution

• Executive Interviews of SIFMA Stakeholders
• Investor Data on Advisor Relationships and Satisfaction
• Original Market Sizing and Advisor Relationship Model focused on Investors with $100,000 to $1 million of Investable Assets
Project Overview

Project Overview
Research Findings○ State of Market○ Opportunities○ Evolution

Individual Investors* currently hold $6.5 trillion with securities firms, with an average relationship size of $135,000
○ There are over 33 million households with between $100,000 and $1,000,000 in investable assets, representing 26% of the U.S. population
○ These investors control nearly 23% of investable assets in the U.S., over $11 trillion○ 78% report using a professional financial advisor today
Individual Investors are very satisfied with their advisor relationships○ 74% report that they would recommend their advisor, 77% believe their advisor is worth the cost○ Just 1% report being dissatisfied with their advisor○ Trustworthiness, dedicated relationships, personalized advice drive this satisfaction
Individual Investors name retirement planning as the primary service they receive from their advisor
○ Already retired Individual Investors rely on personal investments for nearly two-thirds of their retirement income
○ Retirement income planning and retirement planning are the most common services offered by advisors serving Individual Investors
As digital solutions proliferate, personalized financial planning services will become an important complement in Individual financial relationships
○ 38% of Individual Investors believe they will need more advice in the future○ Advisors serving this segment intend to broaden their offering of financial planning services○ Lack of human interaction is cited as the primary obstacle to digital relationships○ Digital engagement allows for scaling of basic services, and more time for personal interaction
Executive Summary
*For this project Individual Investors are defined as households with $100,000 to $1 million of investable assets.

State of Market
Opportunities
Evolution
7
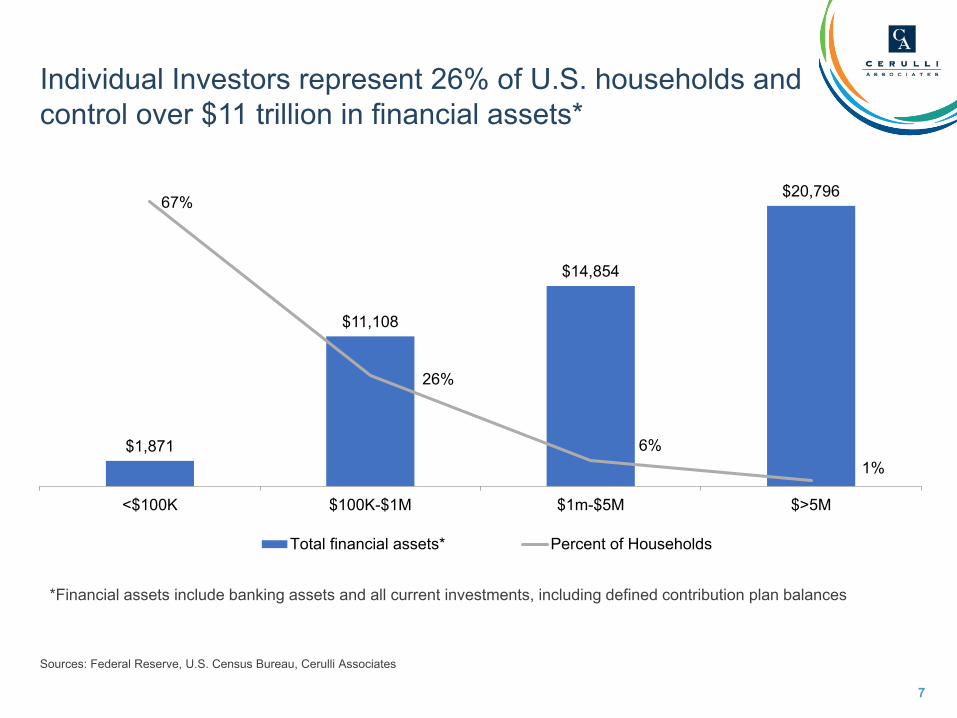
HOUSEHOLD AND ASSET DISTRIBUTION, 2018E (BILLIONS)
Individual Investors represent 26% of U.S. households and control over $11 trillion in financial assets*
Sources: Federal Reserve, U.S. Census Bureau, Cerulli Associates
$1,871
$11,108
$14,854
$20,79667%
26%
6%1%
<$100K $100K-$1M $1m-$5M $>5M
Total financial assets* Percent of Households
*Financial assets include banking assets and all current investments, including defined contribution plan balances

● Individual Investors hold $6.5 trillion* in assets with securities firms, with an average relationship size of $135,509
● These investors have a total of 48 million relationships with securities firms, an average of just under 1½ relationships per household
Sources: Cerulli Associates
Investable Asset Tiers
InvestorHouseholds
Advisor Relationships
Assets (billions)*
Average # of Relationships
Average Relationship
Size
Less than $100,000 85,774,598 10,765,313 $82 0.1 $7,585
$100K-$1m 33,016,239 48,132,791 $6,513 1.5 $135,309
$1m-$5m 7,351,642 14,823,293 $12,091 2.0 $815,672
More than $5m 1,608,505 6,055,322 $9,911 3.8 $1,636,821
SIFMA Wealth Management Market Dashboard
*These assets include all retail investor brokerage and advisory assets, but not active qualified retirement plan assets

9
Private Bank / Bank Trust Wirehouse National and
Regional B/D IBD Independent RIA
Hybrid RIA
Insurance B/D
Retail Bank B/D Direct* Total
Less than $100,000 $2.2 $2.6 $6.1 $7.8 $2.5 $1.5 $3.4 $2.8 $52.9 $81.7
$100K-$1m $77.5 $754.7 $1,025.0 $953.9 $567.7 $246.6 $311.1 $353.9 $2,222.4 $6,512.8
$1m-$5m $1,048.7 $2,203.3 $1,568.4 $1,282.0 $1,087.9 $441.0 $337.7 $325.7 $3,796.2 $12,091.0
More than $5m $2,597.6 $3,011.0 $350.9 $299.3 $940.2 $1,010.8 $88.1 $535.6 $1,078.0 $9,911.5
Total $3,726.0 $5,971.6 $2,950.2 $2,543.0 $2,598.3 $1,700.0 $740.3 $1,218.0 $7,149.4 $28,596.9
Private Bank / Bank Trust Wirehouse National and
regional B/D IBD Independent RIA
Hybrid RIA
Insurance B/D
Retail Bank B/D Direct* Total
Less than $100,000 202,734 178,574 595,248 900,783 155,585 107,284 2,235,317 882,588 5,507,199 10,765,313
$100K-$1m 364,423 2,585,258 5,231,994 5,901,062 1,754,037 883,977 12,105,421 6,239,714 13,066,906 48,132,791
$1m-$5m 1,052,508 1,600,810 1,722,670 1,697,513 761,695 348,431 2,415,662 1,061,848 4,162,156 14,823,293
More than $5m 597,254 748,553 551,606 515,455 254,497 123,121 861,446 459,701 1,943,688 6,055,322
Total 2,216,919 5,113,195 8,101,519 9,014,813 2,925,814 1,462,813 17,617,846 8,643,852 24,679,948 79,776,720
SIFMA Wealth Management Market Dashboard
ASSETS BY CHANNEL AND INVESTOR WEALTH, 2018 ($ BILLIONS)
RELATIONSHIPS BY CHANNEL AND INVESTOR WEALTH, 2018
* Direct platforms are those where client acquisition is primarily driven at the firm level rather than by individual advisors, examples include Fidelity and Charles Schwab.

10
● “We help investors identify, prioritize and pursue financial goals. Clients don't know where to start – we do.”
● “We help prepare them for what might go wrong”
● “Our goal is to demystify and simplify the path to clients’ financial goals.”
● “We ask clients, ‘What are you doing to be ready for tomorrow?’ Then provide human-centered complete wealth management.”
● “We navigate challenging times for clients and help them feel understood.”
● We “help investors balance today and the future”
● We are “Super focused on making sure that we get tech right. We can’t replace that human centered connection, but it can be a bridge for an advisor to have a deeper relationship.”
SIFMA STAKEHOLDER VERBATIMS
How do advisors help Individual Investors?

● Over three-quarters of Individual Investors report using a professional financial advisor
● These investors rely more heavily on the advice of their advisor than their wealthier peers
Household Investable Assets
Uses a Professional Advisor
<$100K $100K-$1m
$1m-$5m >$5m All
Households
Yes 59% 78% 83% 83% 79%
No 41% 22% 17% 17% 21%
Sources: Phoenix Marketing International, Cerulli Associates
Approach to Investment Advice <$100K $100K-
$1m$1m-$5m >$5m All
Households
Self-directed 45% 35% 33% 33% 35%
Advice for Special Events 28% 25% 27% 30% 26%
Advisor-assisted 9% 15% 19% 23% 16%
Advisor-directed 18% 25% 21% 14% 23%
Advisor Use by Investable Assets, 2019

● Individual Investors express satisfaction with their advisor on par with wealthier investors
● Under 1% of Individual Investors reported being dissatisfied with their advisors
● Top Reasons for Individual Satisfaction:
○ Trustworthiness, honesty, dependability (19%)
○ Overall relationship (16%)
○ Knowledge, quality of advice (13%)
Advisor Use by Investable Assets, 3Q 2019
5.8
6.1
6.26.2
6.1
<$100K $100K-$1m $1m-$5m >$5m All Households
Analyst Note: Investors were asked to rate their advisor on a 1 to 7 scale, with 7 being the highest
Sources: Phoenix Marketing International, Cerulli Associates

Individual Investors are just as likely to recommend their advisors as wealthier investors
INVESTORS LIKELY TO RECOMMEND THEIR ADVISORS, 3Q 2019
60%
74% 77% 80%75%
<$100K $100K-$1m $1m-$5m >$5m All Households
Sources: Phoenix Marketing International, Cerulli Associates

14
● Over three-quarters of Individual Investors believe their advisor is worth the cost
● Investors who are more reliant on their advisor are more likely to believe they are worth the expense—Individual Investors are more reliant on their advisors
Value of Advisor Being Worth the Expense by Investable Assets & Advice Orientation, 2019
60%
77% 79% 78% 77%
<$100K $100K-$1m $1m-$5m >$5m All Households
60%69%
88% 86%77%
Self-Directed Advice for SpecialEvents
Advisor-Assisted Advisor-Directed All Households
Sources: Phoenix Marketing International, Cerulli Associates

15
Household Investable Assets
Top 3 Most Appealing Features for Traditional Wealth Management <$100K $100K-
$1m$1m-$5m >$5m All Households
Dedicated advisor 47% 48% 54% 13% 48%
Face-to-face advisor meetings are available 39% 45% 49% 74% 47%
Full range of investment choices 37% 49% 39% 46% 46%
Comprehensive wealth planning services 31% 32% 30% 37% 32%
Active management of investments (goal is to out-perform the market average) 27% 30% 31% 13% 29%
Different types of accounts are available (e.g., brokerage, managed accounts) 25% 30% 24% 13% 28%
I trust traditional wealth management firms 12% 19% 27% 12% 20%
Asset allocation services 12% 9% 15% 1% 10%
Other 10% 4% 5% 10% 5%
TOP-3 APPEALS OF TRADITIONAL WEALTH MANAGEMENT BY INVESTABLE ASSETS, 3Q 2019
Individual Investors value having a dedicated advisor, face-to-face meetings, and comprehensive services
Sources: Phoenix Marketing International, Cerulli Associates

State of Market
Opportunities
Evolution

17
HOUSEHOLDS' MOST IMPORTANT FINANCIAL GOALS BY INVESTABLE ASSETS, 2018
Planning for retirement is the most important goal for Individual Investors, followed by protecting their wealth
Household Investable Assets
Most Important Goal <$100K $100K-$1m $1m-$5m >=$5m All Households
Assure comfortable standard of living in retirement 29% 49% 46% 36% 47%
Protect current level of wealth 7% 17% 26% 30% 20%
Improve household cash flow 37% 11% 6% 2% 11%
Aggressively grow wealth 12% 8% 6% 5% 8%
College education financing 10% 5% 2% 2% 4%
Leave an estate for heirs 1% 4% 5% 8% 4%
Better manage market risk 2% 3% 4% 3% 3%
Minimize income and capital gains taxes 1% 2% 3% 8% 3%
Charitable giving 1% 1% 2% 6% 1%
Sources: Phoenix Marketing International, Cerulli Associates

18
RETIREMENT HOUSEHOLDS' INCOME SOURCES BY INVESTABLE ASSETS, 2018
Individual Investors report receiving approximately half of their retirement income from investments
Household Investable Assets
Source of Income $100K-$1m $1m-$5m >$5m All Retired Households
Social Security payments 31% 20% 9% 27%
401(k), company pension plan or other employer-sponsored savings account 23% 22% 10% 22%
Individual Retirement Accounts 14% 17% 11% 15%
Other 14% 12% 5% 13%
Stocks and bonds 6% 16% 51% 11%
Annuities 8% 6% 2% 7%
Part- or full-time employment 2% 3% 0% 2%
Real estate investments 1% 2% 8% 2%
Personal trust(s) 1% 2% 3% 1%
Family business 0% 1% 0% 0%
Sources: Phoenix Marketing International, Cerulli Associates

19
Household Investable Assets
I find that I need more advice than I have in the past
<$100K $100K-$1m
$1m-$5m >$5m All
Households
Strongly Disagree 4% 8% 12% 13% 9%
Disagree 14% 22% 26% 30% 23%
Neither Disagree nor Agree 35% 33% 29% 31% 32%
Agree 31% 25% 21% 17% 24%
Strongly Agree 15% 13% 12% 9% 13%
Total Agree 47% 38% 33% 26% 37%
Less affluent investors are more likely to report needing more financial advice and getting help with new investments than HNW segments
Household Investable Assets
It is important to me to get help exploring new investment opportunities
<$100K $100K-$1m
$1m-$5m >$5m All
Households
Strongly Disagree 4% 5% 7% 9% 6%
Disagree 6% 11% 12% 13% 12%
Neither Disagree nor Agree 34% 28% 25% 36% 28%
Agree 38% 38% 37% 23% 37%
Strongly Agree 19% 17% 18% 19% 18%
Total Agree 56% 55% 55% 42% 55%
NEED MORE FINANCIAL ADVICE THAN IN THE PAST BY INVESTABLE ASSETS, Q3 2019
Sources: Phoenix Marketing International, Cerulli Associates

State of Market
Opportunities
Evolution

21
INVESTOR-REPORTED FEE STRUCTURE, 2011–2Q 2019
Investors are becoming more informed about of the costs of investing contributing to fee compression in asset and wealth management
Sources: Phoenix Marketing International, Cerulli Associates
Investor-Reported Fee Structure 2011 2012 2013 2014 2015 2016 2017 2018 2Q 2019
Commission only 18% 20% 16% 23% 22% 21% 20% 22% 20%
Fee only 10% 10% 20% 24% 25% 29% 34% 34% 31%
Fee-and-commission mix 7% 10% 1% 1% 2% 6% 8% 3% 3%
Complimentary/Do not pay for services 33% 29% 28% 26% 27% 23% 19% 23% 23%
Not sure 31% 31% 34% 25% 24% 21% 19% 20% 22%

22
GROWTH OF ASSET-BASED FEE RELATIONSHIPS, 2007-2018 ($ BILLIONS)
Retail assets continue to shift towards goals-based advisory relationships.
Source: Cerulli Associates
$12.5$9.9
$11.0$12.0 $12.4
$13.4$15.3
$16.6 $16.7$18.0
$20.3 $19.9
$3.5$2.6 $3.3 $3.9 $4.1 $4.6
$5.6 $6.3 $6.6 $7.5$9.1 $9.3
28% 26%30% 32% 33%
34%36% 38%
40%41%
45% 46%
2007 2008 2009 2010 2011 2012 2013 2014 2015 2016 2017 2018
Total advisor industry Total asset-based fee relationships Percent asset-based fee relationships

● Lower costs
● Ease of use
● Low minimum investment requirements
● Automated portfolio rebalancing
● Fully automated investment service (passive investing in ETFs)
23
● No human interaction
● Lack of personalized service
● Don’t trust an automated service
● Does not take complete financial picture into account
● Does not handle complex finances
TOP-5 APPEAL OF DIGITAL WEALTH MANAGEMENT, 3Q 2019
TOP-5 DRAWBACKS OF DIGITAL WEALTH MANAGEMENT, 3Q 2019
Comprehensiveness, personalized advice distinguishes full-service wealth management from digital options

24
PREFERENCE FOR HUMAN INTERACTION BY INVESTABLE ASSETS, 3Q 2019
Two-thirds of Individual Investors prefer human interactions
Sources: Phoenix Marketing International, Cerulli Associates
Household Investable Assets
I prefer to interact with a human rather than use the latest technology tools <$100K $100K-
$1m$1m-$5m >$5m All
Households
Strongly disagree 6% 3% 3% 1% 3%
Disagree 14% 8% 7% 11% 8%
Neither disagree nor agree 33% 23% 20% 18% 22%
Agree 29% 30% 30% 31% 30%
Strongly agree 18% 36% 41% 39% 36%
Total Agree 47% 66% 71% 70% 66%

25
● What value do humans add?○ Trust/asset gathering
○ Emotional aspects of wealth management (e.g., empathy)
○ Where do tradeoffs need to be made?
Automation is a complement to—not a replacement for—humans
Traditional Advice Robo-Advisor

26
FINANCIAL PLAN OWNERSHIP BY INVESTABLE ASSETS, 3Q 2019
● Half of Individual Investors believe it is important to have a written financial plan
● Individual Investors are more likely to want a written financial plan than HNW (>$5 million) investors
Increasingly responsible for their own retirement, just a third of Individual Investors have a financial plan
Household Investable AssetsDo You Have a Written Financial Plan
<$100K $100K-$1m
$1m-$5m >$5m All
Households
Yes 14% 35% 47% 45% 37%
No 86% 65% 53% 55% 63%
37%47% 49%
43% 47%
<$100K $100K-$1m $1m-$5m >$5m All Households
Sources: Phoenix Marketing International, Cerulli Associates
IMPORTANCE OF HAVING A FINANCIAL PLAN BY INVESTABLE ASSETS, 3Q 2019

27
● Cerulli expects that financial planning services will increase as investments become commoditized and technology increases the importance of more personalized services
● Advisors anticipate that they will significantly increase the percentage of their clients receiving financial planning services in the next two years within Individual segment
Financial Planning Clients by Core Market, 2019 vs. 2021E
Sources: Cerulli Associates, in partnership with the Investments & Wealth Institute (formerly IMCA) and The Financial Planning Association® (FPA®)
41%
23%
35%
49%
26% 26%
Comprehensive ongoing planning advice Targeted planning to address a specific clientneed
No financial planning services
Current 2021E
CORE MARKET: $100K TO $500K

28
● Advisors working with Individual Investors on average offer the same amount of financial planning services as those working with wealthier investors
● The most common services offered by advisors working with the Individual are retirement income planning and retirement planning
● Advisors working with wealthier clients focus on services, such as charitable giving planning and estate planning
Average Number of Financial Planning Services Offered by Core Market, 2019
Sources: Cerulli Associates, in partnership with the Investments & Wealth Institute (formerly IMCA) and The Financial Planning Association® (FPA®)
4.4
4.7
4.9
4.8
4.5
4.7
<$100K $100K to<$500K
$500K to<$2m
$2m to<$5m
≥$5m All Advisors

29
ONLINE SERVICES AND FEATURES CURRENTLY AND WOULD LIKE TO USE, 2Q 2019
Sources: Phoenix Marketing International, Cerulli Associates
Despite preferring human interaction, digital experience is increasingly an expectation of financial relationships
Online Services Currently Use Would Like To Use Likely Expected Use
View investment holdings and performance 63% 14% 77%
View my tax information 46% 20% 66%
View and update my financial plan 40% 19% 59%
Updates on trends in financial markets 30% 22% 52%
Advice tools (e.g. income calculator, etc.) 25% 22% 48%
Trade in my portfolio 34% 13% 48%
Mobile apps to access your accounts 33% 10% 43%
Education center/online seminars/webcasts 17% 19% 36%
Online budgeting tool 18% 17% 35%
Appointment scheduler or calendar of upcoming events 17% 14% 31%
ATM/Branch finder 20% 8% 28%
Video chat/conference 8% 8% 16%
Average number of online services 3.5 1.9 5.4

Individual Investors* currently hold $6.5 trillion with securities firms, with an average relationship size of $135,000
○ There are over 33 million households with between $100,000 and $1,000,000 in investable assets, representing more than 25% of the U.S. population
○ These investors control nearly 23% of investable assets in the U.S., over $11 trillion○ 78% report using a professional financial advisor today
Individual Investors are very satisfied with their advisor relationships○ 74% report that they would recommend their advisor, 77% believe their advisor is worth the cost○ Just 1% report being dissatisfied with their advisor○ Trustworthiness, dedicated relationships, personalized advice drive this satisfaction
Individual Investors name retirement planning as the primary service they receive from their advisor
○ Already retired Individual Investors rely on personal investments for nearly two-thirds of their retirement income
○ Retirement income planning and retirement planning are the most common services offered by advisors serving Individual advisors
As digital solutions proliferate, personalized financial planning services will become an important complement in Individual financial relationships
○ 38% of Individual Investors believe they will need more advice in the future○ Advisors serving this segment intend to broaden their offering of financial planning services○ Lack of human interaction is cited as the primary obstacle to digital relationships○ Digital engagement allows for scaling of basic services, and more time for personal interaction
Executive Summary
*For this project Individual Investors are defined as households with $100,000 to $1 million of investable assets.

Bing WaldertManaging Director, U.S. Research
(617) [email protected]
www.cerulli.com
699 Boylston StreetBoston, MA 02116
31
Scott SmithDirector, Advice Relationships
(617) [email protected]

Appendix

33
● Survey of Consumer Finances is released one year after survey data collection by the Federal Reserve. To make estimates for the current year, Cerulli projects assets by applying the growth or decline of values for each individual asset and debt category for each household within the survey. In addition, Cerulli adjusts the number of households to reflect the growth of the U.S. population and new household creation.
● Phoenix Marketing International Affluent Study is the largest affluent study in the United States, completing online surveys of over 10,000 households throughout the year. Starting in 2017, affluent households maintain more than $250,000 in investable assets, whereas near-affluent households have no minimum asset requirement but are required to have more than $125,000 in household income and be no older than 45 years old.
● Market Sizing Methodology: Cerulli’s annual sizing of retail-focused, U.S.- based financial advisor marketplace provides assets under management and advisor headcounts by channel for retail advisors located in the U.S., allowing a long-term analysis of growth or decline in marketshare among advisory channels and individual firms. Retail financial advisors are defined by Cerulli as those advisors who offer financial advice to retail clients and who seek to manage an entire asset allocation strategy for their clients, excluding registered personnel such as wholesalers and home-office staff who are not addressable for custodians, broker/dealers (B/Ds), or asset managers, but who are commonly included in other attempts at sizing the advisor marketplace.
Cerulli Methodology Notes

34
Defining the retail advisor market
Two key elements define a financial advisor:
● Primarily serves retail investors
● Seeks to manage client’s entire portfolio
983Retail B/Ds
4,000+Broker/Dealers
304,241Financial Advisors
600,000+Registered
Reps
17,107Independent RIAs
30,000+RIAs
898Trust Banks
10,000+Banks

35
Channel Definition Characteristics Advisor Recruiting Advisor Employment Advisor Products and Services
AdvisorPayout Example Firms
Wirehouse
Four national B/Ds with a large Wall Street investment banking and institutional presence and strong penetration in urban money centers
Four firms with large national advisor and branch advisor networksLarge investment banking and institutional presenceStrong metropolitan presenceControl largest percentage of industry assets and advisors operate at highest level of productivity
Recruitment of established advisors emphasizes large advisors with lucrative recruiting dealsCentralized home-office training programs recruit and train rookie advisors and groom rookies inside established teams
Employees of the B/D
Full range of investment services and productsAccess to retail and commercial banking productsEmphasize fee-based pricing through managed accounts
30% to 50%
Bank of America/Merrill LynchMorgan Stanley Wealth ManagementUBSWells Fargo Advisors
National and regional B/D
National and regional investment banks with retail financial advisorforces, national B/Ds targeting clients with moderate wealth, and boutique firms with a localized presence
Wide range of firms from small boutiques to 1,000+ advisorsOften have strong regional and community tiesVaried institutional and investment banking services depending on firmFew or no proprietary products
Primarily recruit experienced advisorsFor large firms, centralized home-office training programs recruit and train rookie advisors
Employees of the B/D
Full range of investment services and productsOffer a full range of investment services
40% to 60%
RBC Wealth ManagementEdward JonesRobert W. BairdStifelRaymond James & Associates
Independent B/D (IBD)
Advisors own and operate independent businesses and affiliate with a B/D as an independent contractor
Advisor assumes cost of running their practice in return for a higher payoutFragmented advisor field with small branches of one to five advisorsConsolidation has shifted greater advisor and asset marketshare to the largest firms
Primarily recruit established advisors from other IBDs and employee-based channelsRecruiting of rookie and established advisors occurs at the individual practice level
Independent business owner with a variety of ownership structures (e.g., sole proprietor, LLC, S Corp.)Classified as an independent contractor of a B/D rather than as an employee
Heavy emphasis on packaged products, mutual funds, and annuitiesHighest percent of financial planners
70% to 100%
LPL Financial Ameriprise FGRaymond James FinancialCommonwealth Financial Network
Hybrid RIA
Independent practices with both a registered investment advisor (RIA) and an affiliation with a B/D
The practice's RIA is independently owned and operated by the advisor and not the B/D RIA assets are typically held at an RIA custodian, but advisors now have the option to custody assets with or through traditional IBDsA growing number of IBDs have launched RIA platforms to attract and retain large independent practicesDoes not include registered representatives who are investment advisor representatives of a B/D's corporate RIA and do not maintain an independent RIA
Recruiting of rookie and established advisors occurs at the individual practice levelThe dually registered model allows advisors to recruit or acquire advisors from both B/D and RIA models
Independent business owner with a variety of ownership structures (e.g., sole proprietor, LLC, S Corporation)
Classified as an independent contractor of a B/D rather than as an employee
Products and services begin to mirror RIA channelOften choose dual registration to maintain access to products typically available on a commission basis, including alternatives and variable productsNearly all are fee-based or primarily fee
100%
RIA custodians:Schwab InstitutionalFidelity Institutional Wealth ServicesB/D RIA platforms:LPL Hybrid RIA modelRaymond James Hybrid RIA affiliation
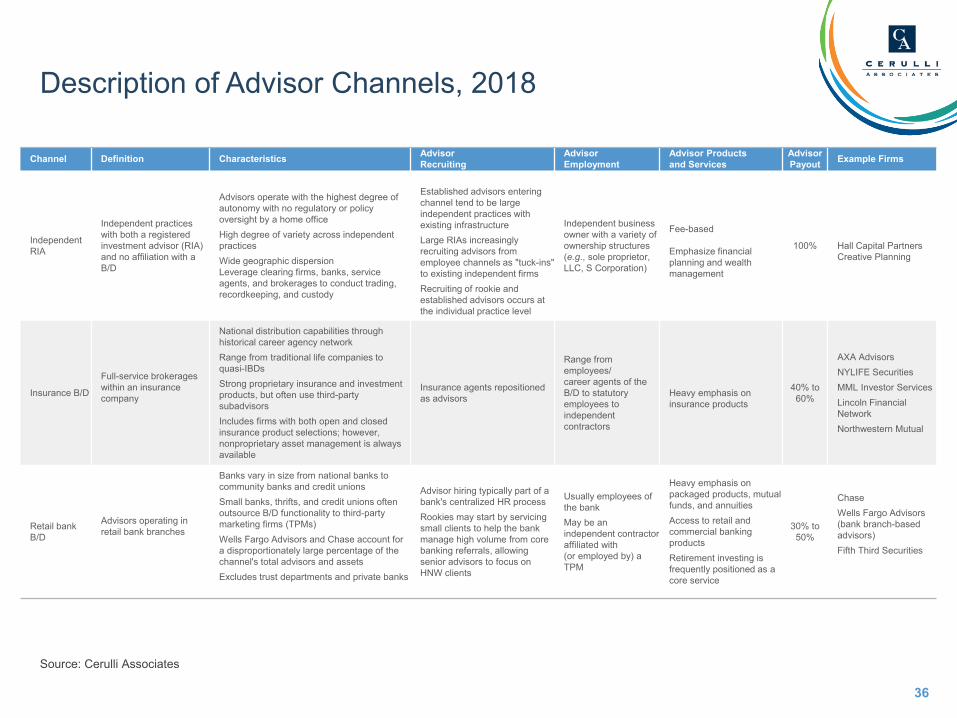
Description of Advisor Channels, 2018
Source: Cerulli Associates
36
Channel Definition Characteristics AdvisorRecruiting
AdvisorEmployment
Advisor Products and Services
AdvisorPayout Example Firms
Independent RIA
Independent practices with both a registered investment advisor (RIA) and no affiliation with a B/D
Advisors operate with the highest degree of autonomy with no regulatory or policy oversight by a home officeHigh degree of variety across independent practicesWide geographic dispersionLeverage clearing firms, banks, service agents, and brokerages to conduct trading, recordkeeping, and custody
Established advisors entering channel tend to be large independent practices with existing infrastructureLarge RIAs increasingly recruiting advisors from employee channels as "tuck-ins" to existing independent firmsRecruiting of rookie and established advisors occurs at the individual practice level
Independent business owner with a variety of ownership structures (e.g., sole proprietor, LLC, S Corporation)
Fee-based
Emphasize financial planning and wealth management
100% Hall Capital PartnersCreative Planning
Insurance B/D
Full-service brokerages within an insurance company
National distribution capabilities through historical career agency networkRange from traditional life companies to quasi-IBDsStrong proprietary insurance and investment products, but often use third-party subadvisorsIncludes firms with both open and closed insurance product selections; however, nonproprietary asset management is always available
Insurance agents repositioned as advisors
Range from employees/career agents of the B/D to statutory employees to independent contractors
Heavy emphasis on insurance products
40% to 60%
AXA AdvisorsNYLIFE SecuritiesMML Investor ServicesLincoln Financial NetworkNorthwestern Mutual
Retail bank B/D
Advisors operating in retail bank branches
Banks vary in size from national banks to community banks and credit unionsSmall banks, thrifts, and credit unions often outsource B/D functionality to third-party marketing firms (TPMs)Wells Fargo Advisors and Chase account for a disproportionately large percentage of the channel's total advisors and assetsExcludes trust departments and private banks
Advisor hiring typically part of a bank's centralized HR processRookies may start by servicing small clients to help the bank manage high volume from core banking referrals, allowing senior advisors to focus on HNW clients
Usually employees of the bankMay be an independent contractor affiliated with (or employed by) a TPM
Heavy emphasis on packaged products, mutual funds, and annuitiesAccess to retail and commercial banking productsRetirement investing is frequently positioned as a core service
30% to 50%
ChaseWells Fargo Advisors (bank branch-based advisors)Fifth Third Securities
Description of Advisor Channels, 2018
Source: Cerulli Associates

37
Advice Orientation Description
Self-directed Households that use a variety of information sources to make their own investment decisions.
Advice for special eventsHouseholds that use a variety of information sources to make their own investment decisions, but also consult an investment professional or advisor for specialized needs (e.g., alternative investments or tax advice).
Advisor-assisted Households that regularly consult with an investment professional or advisor, but also obtain additional information on their own and make most of their own final decisions.
Advisor-directed Households that rely on an investment professional or advisor to make most or all of their investment decisions.
Advice Orientation Descriptions
Source: Phoenix Marketing International, Cerulli Associates