sierra leone secondary grade learning assessment 2018
TRANSCRIPT

Leh Wi LanSierra Leone Secondary Grade Learning Assessment 2018
Sierra Leone Secondary Grade Learning Assessment 2018Technical Annexes – December 2018
Phot
o cr
edit:
Sou
rovi
De

i
Sierra Leone Secondary Grade Learning Assessment 2018– Technical Annexes
Contents
Tables ............................................................................................................................................................................ ii
Abbreviations ............................................................................................................................................................... iii
Annex A: Survey design ............................................................................................................................................... 2
A.1 Instruments used for the survey ................................................................................................................ 2
A.2 Sample size and coverage ........................................................................................................................ 3
A.3 Data collection, cleaning and analysis ..................................................................................................... 5
A.4 School, teacher and pupil replacements ................................................................................................... 5
A.5 Dealing with sensitive research topics ...................................................................................................... 6
A.5.1 Girls’ safety and sexual harassment ......................................................................................................... 6
A.5.2 Experience of schooling as a pupil with disability .................................................................................... 6
Annex B: Sampling design and weighting procedures .............................................................................................. 8
B.1 Samplingframeandstratification ............................................................................................................. 8
B.2 Sample size and allocation ...................................................................................................................... 10
B.3 Sample selection procedures .................................................................................................................. 14
B.4 Weighting procedures ............................................................................................................................. 15
B.4.1 Self-representingschools(selectedwithaprobabilityof1atthefirststage) .....................................15
B.4.2 Non-self-representingschools(selectedwithPPSatthefirststage) ..................................................16
B.5 Calculation of sampling errors ................................................................................................................ 18
Annex C: Learning assessment design ....................................................................................................................20
C.1 Purpose of the pupil learning assessment test ...................................................................................... 20
C.2 Development of the test construct .......................................................................................................... 20
C.3 Test administration .................................................................................................................................. 20
C.4 Test forms ................................................................................................................................................ 21
C.5 Vertical linking .......................................................................................................................................... 21
C.6 Test reliability and person separation ..................................................................................................... 21
C.7 Test development ..................................................................................................................................... 22
C.8 English construct ...................................................................................................................................... 22
C.9 Mathematics construct ........................................................................................................................... 23
Annex D: Household asset index ..............................................................................................................................26
Annex E: School Leadership and Management (SLM) index ..................................................................................28
ii
Sierra Leone Secondary Grade Learning Assessment 2018– Technical Annexes
Tables
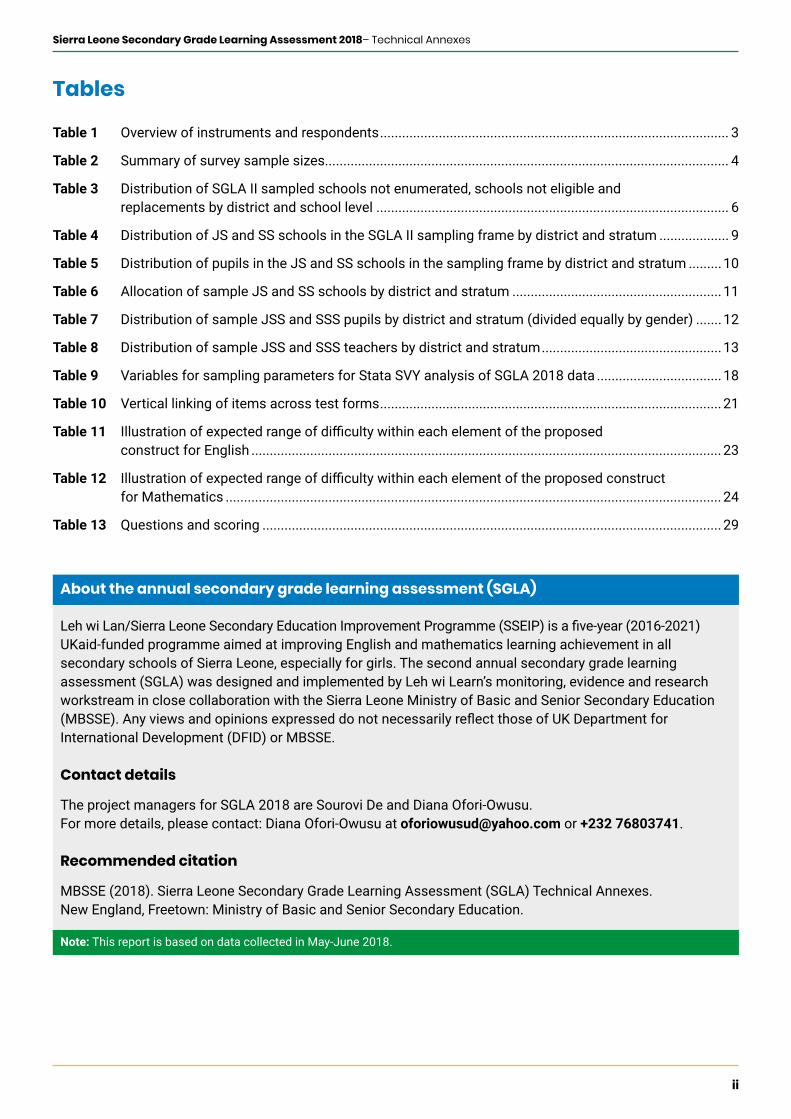
Table 1 Overview of instruments and respondents ............................................................................................... 3
Table 2 Summary of survey sample sizes.............................................................................................................. 4
Table 3 Distribution of SGLA II sampled schools not enumerated, schools not eligible and replacements by district and school level ................................................................................................ 6
Table 4 Distribution of JS and SS schools in the SGLA II sampling frame by district and stratum ................... 9
Table 5 Distribution of pupils in the JS and SS schools in the sampling frame by district and stratum .........10
Table 6 Allocation of sample JS and SS schools by district and stratum .........................................................11
Table 7 DistributionofsampleJSSandSSSpupilsbydistrictandstratum(dividedequallybygender) .......12
Table 8 Distribution of sample JSS and SSS teachers by district and stratum .................................................13
Table 9 Variables for sampling parameters for Stata SVY analysis of SGLA 2018 data ..................................18
Table 10 Vertical linking of items across test forms ............................................................................................. 21
Table 11 Illustrationofexpectedrangeofdifficultywithineachelementoftheproposed construct for English ................................................................................................................................ 23
Table 12 Illustrationofexpectedrangeofdifficultywithineachelementoftheproposedconstruct for Mathematics ....................................................................................................................................... 24
Table 13 Questions and scoring ............................................................................................................................. 29
About the annual secondary grade learning assessment (SGLA)
LehwiLan/SierraLeoneSecondaryEducationImprovementProgramme(SSEIP)isafive-year(2016-2021)UKaid-funded programme aimed at improving English and mathematics learning achievement in all secondary schools of Sierra Leone, especially for girls. The second annual secondary grade learning assessment(SGLA)wasdesignedandimplementedbyLehwiLearn’smonitoring,evidenceandresearchworkstream in close collaboration with the Sierra Leone Ministry of Basic and Senior Secondary Education (MBSSE).AnyviewsandopinionsexpresseddonotnecessarilyreflectthoseofUKDepartmentforInternationalDevelopment(DFID)orMBSSE.
Contact details
The project managers for SGLA 2018 are Sourovi De and Diana Ofori-Owusu. For more details, please contact: Diana Ofori-Owusu at [email protected] or +232 76803741.
Recommended citation
MBSSE(2018).SierraLeoneSecondaryGradeLearningAssessment(SGLA)TechnicalAnnexes. New England, Freetown: Ministry of Basic and Senior Secondary Education.
Note: This report is based on data collected in May-June 2018.

iii
Sierra Leone Secondary Grade Learning Assessment 2018– Technical Annexes
AbbreviationsBECE BasicEducationCertificateExamination
CAPI Computer-Assisted Personal Interviewing
DFID UK Department of International Development
EGMA Early Grade Mathematics Assessment
EGRA Early Grade Reading Assessment
EMIS Education Management Information System
ICF WorldHealthOrganisation’sInternationalClassificationofFunctioning,Disability,andHealth
JSS Junior Secondary School
MBSSE Ministry of Basic and Senior Secondary
N Number of observations
NPSE National Primary School Examination
P Primarygrade(e.g.primarygrade2orP2)
PTA/CTA Parent-teacher or Community-teacher Associations
SGLA Secondary Grade Learning Assessment
SSEIP Sierra Leone Secondary Education Improvement Programme
SSS Senior Secondary School
WASSCE WestAfricanSecondarySchoolCertificateExamination
WGDS Washington Group on Disability Statistics

Annex A: Survey designPh
oto
cred
it: Z
ara
Dur
rani

2
Sierra Leone Secondary Grade Learning Assessment 2018– Technical Annexes
Annex A: Survey design
A.1 Instruments used for the survey
The SGLA II administered four instruments in the 700 sampled schools:
• Learning assessments for JSS2 and SSS2 grades, in English and maths, administered to 5,600 pupils;
• Teacher’s questionnaire, including topics like usage of lesson plans, administered to 2,800 teachers;
• Principal’s questionnaire administered to 700 principals, covering topics like provision of supportive supervision for teachers; and
• School observation questionnaire, compiled by enumerators during schools visits for 700 schools.
Pupil learning assessments were conducted in JSS2 and SSS2 grades. Five test forms were developed and used for this based on pupils’ abilities. Each test form contained approximately 40 questions covering both English and maths, and some background questions (e.g. pupil age, main language spoken at home, household assets,etc.).Pupilswereautomaticallyroutedtotheappropriatetestformsbasedontheirperformanceonaninitialfilterform.Testswereadministeredone-on-onebyenumeratorstoindividualpupilswithoralassentofthepupils–thispreventsanymalpractices(e.g.cheating),allowsadaptivetestingasperpupils’abilities,aswellasallowsthetesttoassessskills(e.g.reading)whicharenotpossibleinself-administeredwhole-classtests. Pupils did their working in colour-printed test workbooks while enumerators concurrently recorded their responses on CAPI. Each pupil assessment took approximately 45 minutes to complete.
PrincipalsandfourEnglishand/ormathsteachers(perschool)teachingatJSS/SSSlevelwerealsoadministered background questionnaires. Principals were asked in particular about provision of supportive supervision for teachers. Teachers were interviewed about their teaching practices, usage of MBSSE lesson plans, and about aspects of girls’ safety in school and the schooling experience of pupils with disabilities. Principals’ and teachers’ interviews were conducted in English. The principal’s interview included a written consent for his/her school to take part in the survey, and his/her permission to assess pupils. Teachers gave verbal consent before the interview. The school observation instrument complemented the principal interview and contained information on timetable, break times, school opening time and presence or absence of pupils and teachers.
To ensure consistency in administering various interviews and tests, rigorous, continous and uniform trainingwasconductedforallenumeratorsandsupervisors,usingdetailedfieldworkmanualsasreferencematerial.1 The table below lists the instruments and respondents for each instrument as well as provides brief descriptions of their contents.
1 One or two page ‘cheat-sheets’ for key instruments and sampling processes were also provided as easy access, hands-on support material for data collectors while in school.

3
Sierra Leone Secondary Grade Learning Assessment 2018– Technical Annexes
Table 1: Overview of instruments and respondents
Instrument description Respondent per school
Pupil Learning Assessment in English and maths
Pupil gender, age, language and grade
Eight randomly sampled JSS2/SSS2 pupilsIndicators of disability (extent to which the child can hear, speak,seeandwrite)
English and maths skills at JSS2 and SSS2 levels
Pupil’s background and asset index
Principal Interview
Principal’s background characteristics (gender, age, years ofexperience,qualifications)
Principal(oneperschool)
School background characteristics (type of school, CTA/PTA)
Frequency/type of interaction with and supervision of teachers (lesson observation practices, meetings, external supervision,teachersabsenteeism)
Schoolrecords(enrolment,numberofteachers)
Teacher Interview
Teacher’s background characteristics (gender, age, years ofexperience,qualifications)
Four sampled English and/or maths teachers
Current teaching practices (instructional time and disruptions, teacher absenteeism, levels and subjects taught)
Interaction with and supervision by principal
Teaching aids and guides, particulary the use and perceptions of MBSSE Lesson Plans
Girls’ safety in school
Schooling experience for pupils with health impairments or disability
School observation instrument
School breaks and opening timeOne observation per schoolSchool timetable, total number of classrooms, empty
classrooms
Note: SGLA team.
A.2 Sample size and coverage
The SGLA II targeted a total sample of 700 JSS and SSS schools among the 16 districts. Smaller districts had 24 JSS and 24 SSS schools randomly sampled; large districts had 30 JSS and 30 SSS schools randomly sampled and the largest district, Western Urban, had 36 JSS and 36 SSS schools randomly sampled. Some districts and levels had less than the target number of sample schools in the frame, especially for SSS, in which case all the schools in the frame were selected.

4
Sierra Leone Secondary Grade Learning Assessment 2018– Technical Annexes
Within each school, the data-collection teams interviewed the principal, four teachers who teach maths and/or English and eight pupils. Unless the total number of teachers teaching maths and/or English was four or less, data collectors randomly selected only four of them for teacher’s interview using the staff attendance register. In all-boys and all-girls schools, all the eight pupils assessed were boys or girls while in mixed gender schools, four boys and four girls from JSS2/SSS2 were randomly selected from those present in school on the day and interviewed. Both the teacher and pupil randomisation was done through pre-programmed rosters on enumerators’ handheld tablet devices.
The actual sample coverage, by district, is given in the table below.
Table 2: Summary of survey sample sizes
Sample coverage
Region Sample schools
Schools completed
Principals Teachers School Observation
Pupils
Number of schools and respondents covered
East 145 144 131 425 144 1,102
North 144 143 125 417 143 1,126
South 157 157 129 441 157 1,126
North-West
122 119 103 333 119 911
West 132 132 128 407 132 1,018
Total 700 695 616 2023 695 5383
Sample coverage (% of targeted sample size)
East 145 99 90 73 98 95
North 144 99 87 72 99 98
South 157 100 82 70 100 90
North-West
122 98 84 68 98 93
West 132 100 97 77 100 96
Total 700 99% 88% 71% 99% 96%
The coverage rate for principals is lower than 100 per cent because some of the schools either did not have principals or any other staff in a senior leadership/administerative position on the day of the interview or because principals in these schools did not give consent to be interviewed. Moreover, 78 of the principals interviewed were heading both the JSS and SSS streams in one sample school. Such principals were interviewed only once. However, the questionnaire was designed to capture information on both the JSS and SSS streams of the school in one interview. The number of maths and English teachers interviewed was 71 per cent of the targeted sample size. It points to the fact that not all the schools visited had four or more teachers who taught English and/or maths present on that day. It was particularly true for rural areas where maths teachers moved from school to school to teach, and were thus shared across multiple schools. Around 96 per cent of the intended sample of pupils were interviewed because in several schools less than a total of 8 boys and girls were present on the day of the survey in JSS2/SSS2.

5
Sierra Leone Secondary Grade Learning Assessment 2018– Technical Annexes
A.3 Data collection, cleaning and analysis
Thefieldteamscollecteddatafrom15thMayto27thJune2018andcomprisedfivefieldteams,oneforeachofthefiveprovincesandmanagedbyaprovincialcoordinatorperprovince.Withineachofthefiveprovinceteamswerefivetosixteams,eachcomprisingafieldsupervisorandtwoenumerators.Theenumeratorsprimarilyassessedpupilswhilethefieldsupervisorinterviewedtheprincipalsandtheteachers.Theprovincialcoordinatorsworkedcloselywiththefieldsupervisorsandensuredthatdatawascollectedandsenttothecentral database on a daily basis.
Multiple levels of validation were programmed in CAPI to ensure that the data collected was of the highest standards. There were built-in automatic checks in the CAPI programming while the enumerator was punching thedatainthefield.Forexample,CAPIdidnotallowtheenumeratortoenterageofrespondentoutsideacertain reasonable range. Moreover, data managers also programmed checks for internal consistency of respondent’s answers. For example, a respondent could not have more years of experience than his/her age above the minimum.
Thesecondlayerofdatacleaninghappenedatthecentraloffice.Whenthedatacameineverydayfromthefield,thedatamanagercheckedalltheobservationsofthedayforcompletion,anderrorsoroutliersandcorrectedthedataaftercontactingthefieldsupervisorsandenumerators.Afterthedatacollectionwascompleted, a team of analysts further cleaned the data using STATA. Data cleaning at this stage looked for incompleteandinconsistentresponses,creatingnewvariablesandfinallyanalysingthedatausingSTATA.
A.4 School, teacher and pupil replacements
Given the changes in some sample schools since the time the EMIS sampling frame was compiled, they were no longer eligible for the survey; also, it was found that a few sample schools had been used for the pilot survey. In order to maintain the effective sample size for the survey, it was decided to substitute such schools with a replacement school selected randomly with PPS from the same stratum and district.
Alistofreplacementschoolsbydistrictandschoollevel(JSSorSSS)wasalsopreparedbeforethefieldworkstarted so that if a sample school was not accessible, it would be replaced by another school from the same district and same level. The schools were replaced for one or more of the following reasons:
• The school does not exist on the ground, or there is no school with the name given in the area;
• The school is closed for the duration of the survey team’s stay in the district for whatever reason;
• Theschooldoesnothavetherequiredgrade(JSS2/SSS2);and
• There are security concerns about visiting the school.
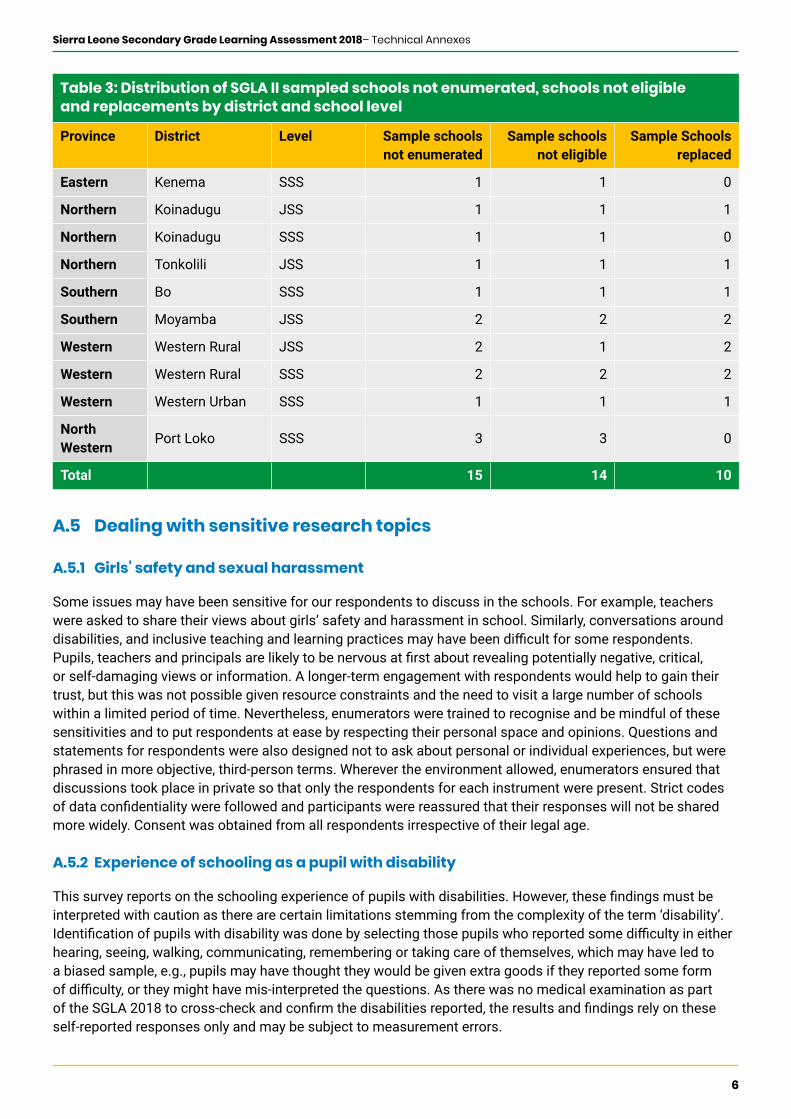
Intotal,10schoolsendedupbeingreplaced.Thesereplacementschoolsdonotaffecttheanalysisorfindingsin any way since sample weights were adjusted based on the actual number of schools replaced. The number of replacements by province is listed in the table below.
6
Sierra Leone Secondary Grade Learning Assessment 2018– Technical Annexes
Table 3: Distribution of SGLA II sampled schools not enumerated, schools not eligible and replacements by district and school level
Province District Level Sample schools not enumerated
Sample schools not eligible
Sample Schools replaced
Eastern Kenema SSS 1 1 0
Northern Koinadugu JSS 1 1 1
Northern Koinadugu SSS 1 1 0
Northern Tonkolili JSS 1 1 1
Southern Bo SSS 1 1 1
Southern Moyamba JSS 2 2 2
Western Western Rural JSS 2 1 2
Western Western Rural SSS 2 2 2
Western Western Urban SSS 1 1 1
North Western
Port Loko SSS 3 3 0
Total 15 14 10
A.5 Dealing with sensitive research topics
A.5.1 Girls’ safety and sexual harassment
Some issues may have been sensitive for our respondents to discuss in the schools. For example, teachers were asked to share their views about girls’ safety and harassment in school. Similarly, conversations around disabilities,andinclusiveteachingandlearningpracticesmayhavebeendifficultforsomerespondents.Pupils,teachersandprincipalsarelikelytobenervousatfirstaboutrevealingpotentiallynegative,critical,or self-damaging views or information. A longer-term engagement with respondents would help to gain their trust, but this was not possible given resource constraints and the need to visit a large number of schools within a limited period of time. Nevertheless, enumerators were trained to recognise and be mindful of these sensitivities and to put respondents at ease by respecting their personal space and opinions. Questions and statements for respondents were also designed not to ask about personal or individual experiences, but were phrased in more objective, third-person terms. Wherever the environment allowed, enumerators ensured that discussions took place in private so that only the respondents for each instrument were present. Strict codes ofdataconfidentialitywerefollowedandparticipantswerereassuredthattheirresponseswillnotbesharedmore widely. Consent was obtained from all respondents irrespective of their legal age.
A.5.2 Experience of schooling as a pupil with disability
Thissurveyreportsontheschoolingexperienceofpupilswithdisabilities.However,thesefindingsmustbeinterpreted with caution as there are certain limitations stemming from the complexity of the term ‘disability’. Identificationofpupilswithdisabilitywasdonebyselectingthosepupilswhoreportedsomedifficultyineitherhearing, seeing, walking, communicating, remembering or taking care of themselves, which may have led to a biased sample, e.g., pupils may have thought they would be given extra goods if they reported some form ofdifficulty,ortheymighthavemis-interpretedthequestions.Astherewasnomedicalexaminationaspart oftheSGLA2018tocross-checkandconfirmthedisabilitiesreported,theresultsandfindingsrelyontheseself-reported responses only and may be subject to measurement errors.

Annex B: Sampling design and weighting procedures
Phot
o cr
edit:
Sac
coh
Man
sara
y

8
Sierra Leone Secondary Grade Learning Assessment 2018– Technical Annexes
Annex B: Sampling design and weighting procedures
B.1 Samplingframeandstratification
SierraLeoneisdividedintofiveprovinces(Eastern,Northern,North-Western,SouthernandWestern),whichare further divided into districts. There are 16 districts in total. Since it was planned to obtain indicators of educational achievement for pupils and teachers at the district level, it was decided to design the sample for reliable indicators at the district level. Given the emphasis of the programme on the educational progress for girls, it was also important to have a separate disaggregation of the indicators by gender.
Thegradelevelschosenfortheachievementtestsarethesecondlevelofthejuniorsecondaryschools(JSS2)andthesecondleveloftheseniorsecondaryschools(SSS2).Astratifiedtwo-stagesampledesignwasusedforthemidlinesurvey,withasampleofJSandSSschoolsselectedwithineachdistrictatthefirststage,anda sample of pupils and teachers in these schools selected at the second stage to be tested. The pupils were selectedfromtheenrolledpupilswhowerepresentatthetimeofthesurveyinthetwospecificclassesofthesample schools, while the teachers were selected from all of the teachers present in the schools on the day of the survey and teaching English and/or maths in JS and SS grades in the sample schools.
An updated database with all JS and SS schools in Sierra Leone in 2017 was obtained from the Education ManagementInformationSystem(EMIS)oftheMinistryofEducation,ScienceandTechnology(MBSSE).Thisframe contained information on the name of the school; province, district, local council, chiefdom and town; educationlevel(JSSorSSS);schoolgendercomposition(co-ed,all-girls,all-boys);managementofschool(community,government,mission,privateandother);andthenumberofstudentsbygrade(1to4)andgender.This database was used to examine the distribution of JS and SS schools by district and stratum. Given that student indicators will be tabulated by gender, an equal number of female and male students were selected for all the tests. In Sierra Leone most of the JS and SS schools are co-ed, but there are also all-girls and all-boys schools which were assigned to individual strata within each province.
ThestratificationoftheframeofJSandSSschoolswasbasedontheobjectivesofthesurveyintermsofthedomainsofanalysis(district,educationlevel,gender),aswellasconsiderationsforsamplingeffectiveness.Initiallyweconsideredtakingintoaccountcollocationinthestratification,giventhelogisticadvantageofhaving part of the sample JS and SS schools at the same location. However, upon further consideration it was determined that selecting collocated schools directly may introduce a bias since these schools may be found in larger urban areas and may therefore have different characteristics from the non-collocated schools. As a resultcollocationwasnotincludedinthestratificationoftheframeofJSandSSschools.Withineachdistrict,the schools in the frame were divided into the following six strata:
1. JSS Co-ed
2. JSS All-Boys
3. JSS All-Girls
4. SSS Co-ed
5. SSS All-Boys
6. SSS All-Girls
Theschoolsinthesamplingframeforeachofthe16districtswerestratifiedbythesesixcategories,foratotalof 96 strata at the national level. Within each stratum the schools were sorted by local council, chiefdom and town,inordertoprovidefurtherimplicitgeographicstratification.

9
Sierra Leone Secondary Grade Learning Assessment 2018– Technical Annexes
The sampling frame included a total of 1,616 JS and SS schools. The distribution of the sampling frame of schools in Sierra Leone by province and stratum is shown in the table below. It can be seen that the number of secondary schools varies by district, from 18 schools for Falaba to 323 schools for Western Urban.
Table 4: Distribution of JS and SS schools in the SGLA II sampling frame by district and stratum
Province District Stratum Total
JSS coed
JSS all-boys
JSS all-girls
SSS coed
SSS all-boys
SSS all-girls
Eastern
Kailahun 44 0 0 16 0 0 60
Kenema 88 2 1 19 2 1 113
Kono 86 3 3 29 1 3 125
Northern
Bombali 97 1 1 23 0 0 122
Koinadugu 33 0 1 8 0 0 42
Tonkolili 67 1 3 15 1 1 88
Falaba 15 0 0 3 0 0 18
Southern
Bo 99 4 6 31 3 1 144
Bonthe 29 0 0 11 0 0 40
Moyamba 62 2 5 8 2 2 81
Pujehun 19 1 1 3 1 1 26
Western
Western Rural
100 0 3 47 0 0 150
Western Urban
186 5 9 111 5 7 323
North Western
Kambia 66 0 3 9 0 0 78
Port Loko 134 1 2 29 0 2 168
Karene 32 0 0 6 0 0 38
Total 1,157 20 38 368 15 18 1,616
The sampling frame based on the Sierra Leone EMIS included information on the number of teachers and pupilsbygender.Inordertoimprovetheefficiencyofthesampledesign,theschoolswithineachstratumwereselectedatthefirststagewithprobabilityproportionaltosize(PPS),wherethemeasureofsizewasbasedon the number of pupils in each school from the sampling frame. In the case of the SSEIP baseline survey the measure of size for the PPS selection was based on the number of teachers. Actually the number of teachers andthenumberofstudentsarehighlycorrelated,andthemeasureofsizeisonlyusedtodeterminethefirststage probability of selection for the schools. Therefore this use of different measures of size for the selection of schools in the baseline and second round of the SSEIP Survey does not present a problem of comparability of the results from each round.

10
Sierra Leone Secondary Grade Learning Assessment 2018– Technical Annexes
The table below shows the distribution of pupils in the JS and SS schools in the sampling frame by district and stratum.
Table 5: Distribution of pupils in the JS and SS schools in the sampling frame by district and stratum
Province District Stratum Total
JSS coed
JSS all-boys
JSS all-girls
SSS coed
SSS all-boys
SSS all-girls
Eastern
Kailahun 4,113 0 0 1,370 0 0 5,483
Kenema 7,939 834 360 3,094 723 242 13,192
Kono 6,643 462 635 3,199 58 120 11,117
Northern
Bombali 7,087 421 205 4,081 0 0 11,794
Koinadugu 3,017 0 44 1,620 0 0 4,681
Tonkolili 5,778 229 304 2,446 211 238 9,206
Falaba 1,097 0 0 143 0 0 1,240
Southern
Bo 8,136 1,174 1,139 3,922 424 34 14,829
Bonthe 2,272 0 0 861 0 0 3,133
Moyamba 4,583 360 280 487 150 168 6,028
Pujehun 1962 202 225 250 144 138 2,921
Western
Western Rural
6,996 0 253 3,874 0 0 11,123
Western Urban
15,618 1,619 2,415 11,414 1,421 1,954 34,441
North Western
Kambia 5,185 0 164 1,307 0 0 6,656
Port Loko 8,462 168 157 2,816 0 146 11,749
Karene 2,735 0 0 506 0 0 3,241
Total 91,623 5,469 6,181 41,390 3,131 3,040 150,834
B.2 Sample size and allocation
The sample size was determined taking into account logistical and budget considerations as well as the need for statistical precision in the estimates of key indicators of educational achievement for JSS2 and SSS2 students by gender and teachers at the district level. Based on these considerations, it was decided to select 8studentsperschoolforeachlevel(JSS2andSSS2).Inadditiontobeingoperationallyeffective,thisnumberof sample students per school will keep the design effects related to intraclass correlation (which affects the levelofprecision)toanacceptablelevel.Thedesigneffectisarelativemeasureoftheefficiencyofthesampledesign. Given the potential similarity of some characteristics of students within the sample schools, selecting additional sample students per school would increase the design effects. In the case of co-ed schools, 4 male and 4 female students will be selected per school for each level, and in the case of all-girl or all-boy schools, 8 students of the same gender will be selected. This implies that the same number of all-boys and all-girls schools have to be selected within each district. Based on similar considerations, it was decided to select 4 teachers per JS or SS sample school. This is consistent with the sampling approach used for the baseline survey.

11
Sierra Leone Secondary Grade Learning Assessment 2018– Technical Annexes
Once the number of sample students and teachers per school was determined, the total sample size depends on thenumberofsampleschoolstobeselectedineachprovince.Inordertoprovideasufficientlevelofprecisionfor the teacher and student indicators at the district level, it was decided to have a target of 24 JS and 24 SS sample schools for the smaller districts, and 30 sample schools each for the larger districts. In the case of the largest district of Western Urban, given the large number and variability of schools, the target number of sample schools was increased to 36 JSS and 36 SSS. Some districts and levels had less than the target number of sample schools in the frame, especially for SSS, in which case all the schools in the frame were selected for the corresponding stratum. Within each district and level the target number of sample schools was allocated to the strata(coed,all-boysandall-girls)inproportionthetotalnumberofJSS2orSSS2studentsinthestratum,withthe constraint that the number of sample all-boys and all-girls schools in each district and level should be equal. Thissamplingstrategyresultedinatotalsamplesizeof700schools(420JSSand280SSS).
The table below shows the resulting allocation of the sample schools by district and stratum.
Table 6: Allocation of sample JS and SS schools by district and stratum
Province District Stratum Total
JSS coed
JSS all-boys
JSS all-girls
SSS coed
SSS all-boys
SSS all-girls
Eastern
Kailahun 24 0 0 16 0 0 40
Kenema 28 1 1 19 1 1 51
Kono 26 2 2 22 1 1 54
Northern
Bombali 28 1 1 23 0 0 53
Koinadugu 24 0 0 8 0 0 32
Tonkolili 22 1 1 15 1 1 41
Falaba 15 0 0 3 0 0 18
Southern
Bo 24 3 3 28 1 1 60
Bonthe 24 0 0 11 0 0 35
Moyamba 20 2 2 8 2 2 36
Pujehun 19 1 1 3 1 1 26
Western
Western Rural
30 0 0 30 0 0 60
Western Urban
30 3 3 30 3 3 72
North Western
Kambia 24 0 0 9 0 0 33
Port Loko 28 1 1 29 0 0 59
Karene 24 0 0 6 0 0 30
Total 390 15 15 260 10 10 700

12
Sierra Leone Secondary Grade Learning Assessment 2018– Technical Annexes
The table below presents the corresponding distribution of sample pupils
Table 7: Distribution of sample JSS and SSS pupils by district and stratum (divided equally by gender)
Province District Stratum Total
JSS coed
JSS all-boys
JSS all-girls
SSS coed
SSS all-boys
SSS all-girls
Eastern
Kailahun 192 0 0 128 0 0 320
Kenema 224 8 8 152 8 8 408
Kono 208 16 16 176 8 8 432
Northern
Bombali 224 8 8 184 0 0 424
Koinadugu 192 0 0 64 0 0 256
Tonkolili 176 8 8 120 8 8 328
Falaba 120 0 0 24 0 0 144
Southern
Bo 192 24 24 224 8 8 480
Bonthe 192 0 0 88 0 0 280
Moyamba 160 16 16 64 16 16 288
Pujehun 152 8 8 24 8 8 208
Western
Western Rural
240 0 0 240 0 0 480
Western Urban
240 24 24 240 24 24 576
North Western
Kambia 192 0 0 72 0 0 264
Port Loko 224 8 8 232 0 0 472
Karene 192 0 0 48 0 0 240
Total 3,120 120 120 2,080 80 80 5,600
13
Sierra Leone Secondary Grade Learning Assessment 2018– Technical Annexes
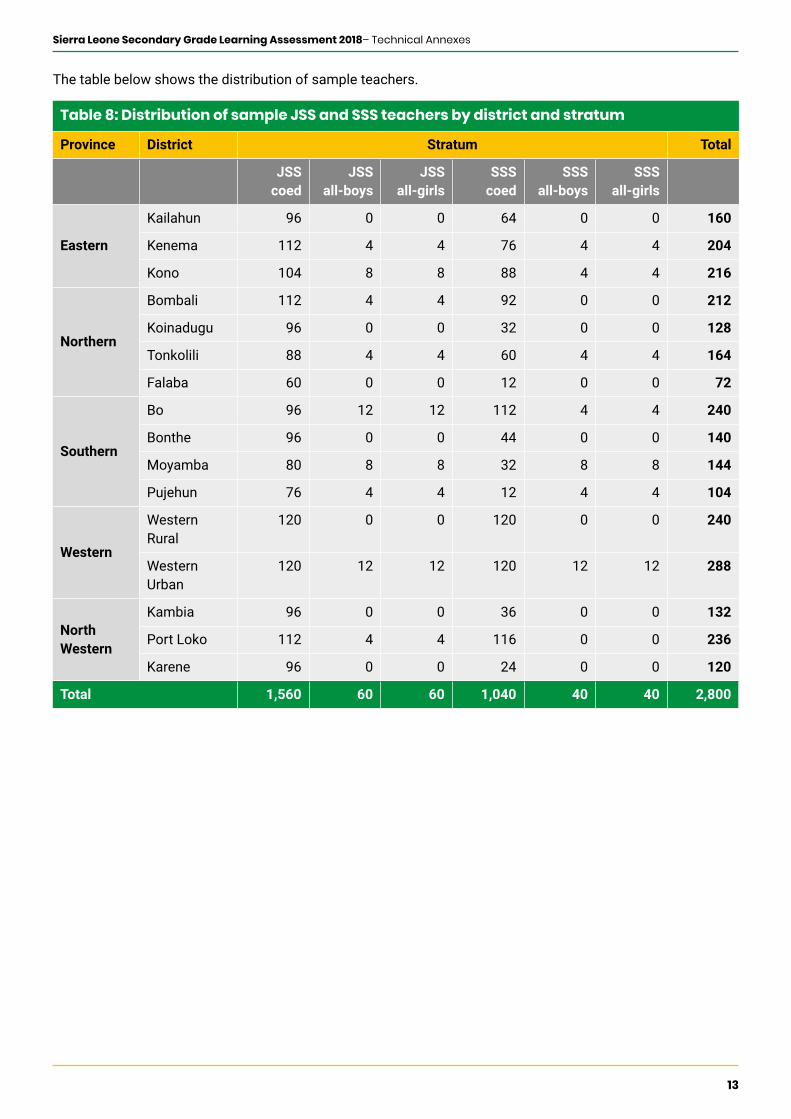
The table below shows the distribution of sample teachers.
Table 8: Distribution of sample JSS and SSS teachers by district and stratum
Province District Stratum Total
JSS coed
JSS all-boys
JSS all-girls
SSS coed
SSS all-boys
SSS all-girls
Eastern
Kailahun 96 0 0 64 0 0 160
Kenema 112 4 4 76 4 4 204
Kono 104 8 8 88 4 4 216
Northern
Bombali 112 4 4 92 0 0 212
Koinadugu 96 0 0 32 0 0 128
Tonkolili 88 4 4 60 4 4 164
Falaba 60 0 0 12 0 0 72
Southern
Bo 96 12 12 112 4 4 240
Bonthe 96 0 0 44 0 0 140
Moyamba 80 8 8 32 8 8 144
Pujehun 76 4 4 12 4 4 104
Western
Western Rural
120 0 0 120 0 0 240
Western Urban
120 12 12 120 12 12 288
North Western
Kambia 96 0 0 36 0 0 132
Port Loko 112 4 4 116 0 0 236
Karene 96 0 0 24 0 0 120
Total 1,560 60 60 1,040 40 40 2,800

14
Sierra Leone Secondary Grade Learning Assessment 2018– Technical Annexes
B.3 Sample selection procedures
Sincetheschoolswithineachstratumvaryconsiderablyinsize(numberofteachersandstudents),atthefirstsampling stage the schools within each stratum were selected systematically with probability proportional tosize(PPS),wherethemeasureofsizewasthenumberofJSS2orSSS2studentsineachschoolbasedonthe data in the frame. Within each stratum the schools in the frame were sorted by local council, chiefdom andtown,inordertoprovidefurtherimplicitgeographicstratification.Thiswillensureageographicallyrepresentative sample of schools within each district and stratum. Given the relatively small size of the frame at the district level, some strata had schools with a measure of size that was larger than the sampling interval for the stratum, in which case these large schools were selected with a probability of 1. The sampling interval isequaltothetotalnumberofJSS2orSSS2studentsinthestratum(thatis,thecumulatedmeasureofsize)divided by the number of sample schools to be selected in the stratum. In the case of a systematic PPS selectionoftheschoolswithineachstratum,thefirststageprobabilityofselectionforeachschoolisequal tothemeasureofsize(numberofJSS2orSSS2studentsintheschoolfromtheframe)dividedbythesampling interval.
Therefore any school with a measure of size larger than the sampling interval will be selected in the sample withcertainty.Consequentlythefirststepwastocalculatetheinitialsamplingintervalandidentifyalltheschools which had a total number of JSS2 or SSS2 students in the frame greater than the sampling interval forthestratum.Alltheseself-representing(SR)schoolsweretreatedasseparatestrataforaone-stageselection of students and teachers. The remaining sample schools in each stratum were selected from thesmallernon-self-representing(NSR)schoolsintheframesystematicallywithPPS,afteradjustingthesampling interval for the remaining NSR schools in the frame.
Within each sample school, it was necessary to compile a list of all of the eligible enrolled female and male studentsfortherelevantgrade(JSS2andSSS2)whowerepresentonthedayofthetests.Thenarandomsystematic sample of 4 female and 4 male students were selected from the corresponding lists for the sample co-ed schools. For each sample all-girls and all-boys school, 8 students of the same gender were selected. In the case of teachers, a list of all the eligible JSS or SSS teachers (i.e. present on the day of the survey andteachingEnglishormathematicsinthesegrades)wasusedtoselectasystematicrandomsample of 4 teachers. If less than 4 teachers were present, then all were selected to be interviewed.
Itshouldbepointedoutthatthesamplingframehas44schoolswithnoJSS2orSSS2studentsspecified. Of these schools 11 are included in the sample because they are in small districts where all the schools in the stratum were selected with certainty. Since the NSR schools were selected with PPS based on the number of JSS2 or SSS2 students, the 33 NSR schools in the frame with zero students were effectively excluded from the frame.
In addition to the smaller districts where all of the schools were selected, there were also larger schools in most other districts selected with certainty because of their relatively large size. Because of the district-level allocation of the sample schools for the second round of the SSEIP Survey and the corresponding larger number of sample schools compared to the baseline survey, the proportion of SR schools in the second round sampleisalsohigher.Overallthesamplehas356SRschools(295JSSand125SSS)and344NSRschools(295JSSand29SSS).AlthoughtherearelessSSSinthesample,theyaremostlySR,inwhichcasethereis a one-stage sample of teachers and students within each of these schools. This will probably result in design effects lower than 1 for the SSS teacher and student indicators for these districts, and the corresponding level of precision for these indicators should be good.
15
Sierra Leone Secondary Grade Learning Assessment 2018– Technical Annexes
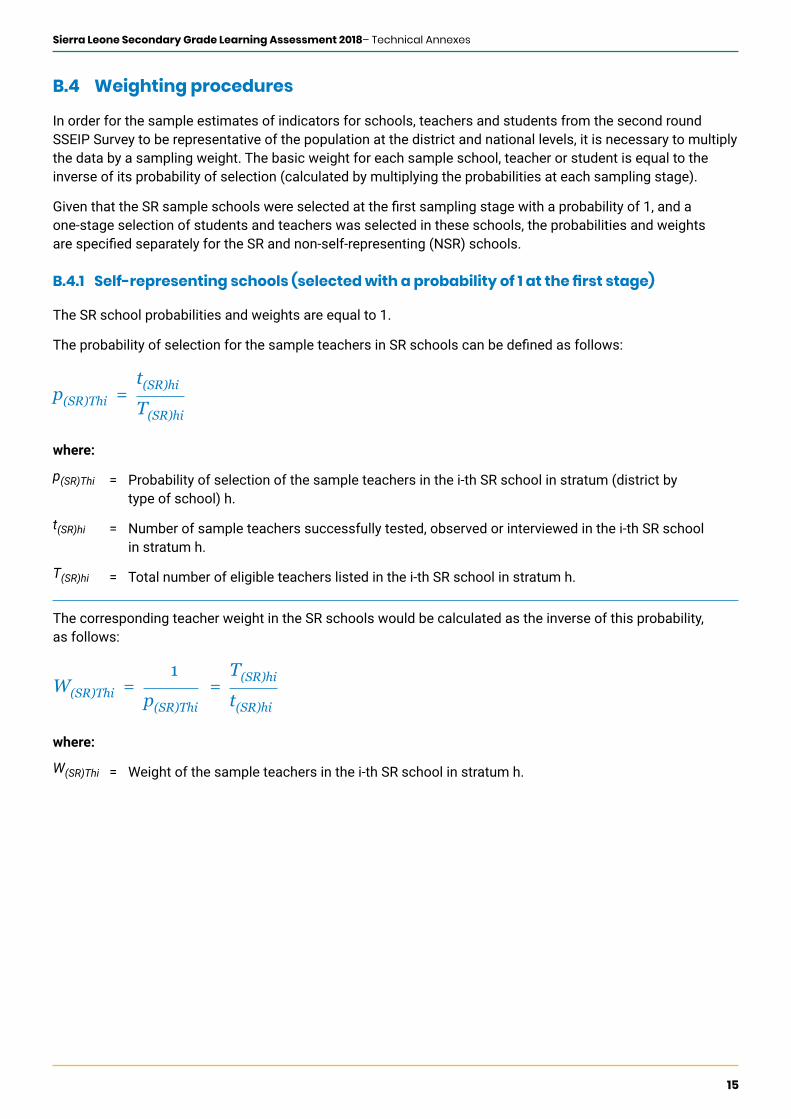
B.4 Weighting procedures
In order for the sample estimates of indicators for schools, teachers and students from the second round SSEIP Survey to be representative of the population at the district and national levels, it is necessary to multiply the data by a sampling weight. The basic weight for each sample school, teacher or student is equal to the inverseofitsprobabilityofselection(calculatedbymultiplyingtheprobabilitiesateachsamplingstage).
GiventhattheSRsampleschoolswereselectedatthefirstsamplingstagewithaprobabilityof1,anda one-stage selection of students and teachers was selected in these schools, the probabilities and weights arespecifiedseparatelyfortheSRandnon-self-representing(NSR)schools.
B.4.1 Self-representingschools(selectedwithaprobabilityof1atthefirststage)
The SR school probabilities and weights are equal to 1.
TheprobabilityofselectionforthesampleteachersinSRschoolscanbedefinedasfollows:
p(SR)Thi = t(SR)hi
T(SR)hi
where:
p(SR)Thi = Probability of selection of the sample teachers in the i-th SR school in stratum (district by typeofschool)h.
t(SR)hi = Number of sample teachers successfully tested, observed or interviewed in the i-th SR school in stratum h.
T(SR)hi = Total number of eligible teachers listed in the i-th SR school in stratum h.
The corresponding teacher weight in the SR schools would be calculated as the inverse of this probability, as follows:
W(SR)Thi = 1
=
p(SR)Thi
T(SR)hi
t(SR)hi
where:
W(SR)Thi = Weight of the sample teachers in the i-th SR school in stratum h.

16
Sierra Leone Secondary Grade Learning Assessment 2018– Technical Annexes
The probability of selection for the sample pupils in SR schools and the corresponding weight are calculated separately by gender as follows:
p(SR)Shig = s(SR)hig
S(SR)higW(SR)Thig =
S(SR)hig
s(SR)higand
where:
p(SR)Shig = Probabilityofselectionofthesamplepupilsofgenderg(male,female)inthei-thSRschoolinstratum h.
s(SR)hig = Number of sample pupils of gender g successfully tested in the i-th SR school in stratum h.
S(SR)hig = Total number of eligible pupils of gender g in the i-th SR school in stratum h.
W(SR)Shig = Weight for the sample pupils of gender g in the i-th SR school in stratum h.
B.4.2 Non-self-representingschools(selectedwithPPSatthefirststage)
Thenon-self-representing(NSR)schoolsareselectedatthefirstsamplingstagewithPPS,basedonthenumber of JSS2 or SSS2 students in the frame for each school. Therefore the probability of selection for the NSR sample schools can be calculated as follows:
p(NSR)hi = n(NSR)h x
S(NSR)h
S(NSR)hi
where:
p(NSR)hi = Probability of selection of the i-th sample NSR school in stratum h.
n(NSR)h = Number of sample NSR schools selected in stratum h.
S(NSR)hi = Total number of JSS2 or SSS2 stuents in the frame for the i-th sample NSR school in stratum h.
S(NSR)h = Total number of JSS2 or SSS2 students in the frame for all NSR schools in stratum h.
ForthesampleNSRschoolsthatwerereplaced,themeasureofsize(S(NSR)hi)ofthereplacementschoolwasused for calculating the weight instead of that of the original sample school, since the replacements were also selected with PPS within the corresponding strata. In the case of NSR sample schools that were found to be ineligible, it was necessary to subtract the number of grade 2 students in the frame for these schools from thecorrespondingoriginalvalueofthetotalnumberofstudentsintheframeforthestratum(S(NSR)h).
The corresponding weight for the NSR schools would be calculated as the inverse of this probability, as follows:
n(NSR)h x S(NSR)hiW(NSR)hi =
1 =
p(NSR)hi
S(NSR)hi
where:
W(NSR)hi = Weight for the i-th NSR sample school in stratum h.
17
Sierra Leone Secondary Grade Learning Assessment 2018– Technical Annexes
In the NSR sample schools the teachers are selected from the list of eligible teachers in the sample school with equal probability. The overall probability of selection and weight for the sample teachers in the NSR sample schools would be calculated as follows:
andp(NSR)Thi = n(NSR)h x
S(NSR)h
S(NSR)hi t(NSR)hi
T(NSR)hix W(NSR)hi =
S(NSR)h T(NSR)hi
t(NSR)hix
n(NSR)h x S(NSR)hi
where:
p(NSR)Thi = Probability of selection of the sample teachers in the i-th NSR sample school in stratum h.
t(NSR)hi = Number of sample teachers successfully tested, observed or interviewed in the i-th sample NSR school in stratum h.
T(NSR)hi = Total number of eligible teachers listed in the i-th sample NSR school in stratum h.
At the second stage the sample pupils are selected separately by gender within each NSR sample school. Therefore the overall probability of selection and corresponding weight for the sample pupils in the NSR sample schools can be expressed as follows:
andp(NSR)Shig = n(NSR)h x
S(NSR)h
S(NSR)hi s(NSR)hig
S’(NSR)higx W(NSR)hig =
S(NSR)h S’(NSR)hig
s(NSR)higx
n(NSR)h x S(NSR)hi
where:
p(NSR)Shig = Probabilityofselectionofthesamplepupilsofgenderg(male,female)inthei-thNSRsampleschool in stratum h.
s(NSR)hig = Number of sample pupils of gender g successfully tested in the i-th NSR sample school in stratum h.
S’(NSR)hig = Total number of eligible pupils of gender g listed in the i-th NSR school in stratum h.
W(NSR)Shig = Weight for the sample pupils of gender g in the i-th NSR sample school in stratum h.

18
Sierra Leone Secondary Grade Learning Assessment 2018– Technical Annexes
B.5 Calculation of sampling errors
IncalculatingthesamplingerrorsforkeyindicatorsusingStata,itisimportanttocorrectlyreflectalltheaspectsofthestratificationandclusteringinthesampledesignintheStatasvyapplication,andensurethatappropriate codes are generated for identifying the strata, PSUs and weights.
Asmentionedpreviously,theself-representing(SR)sampleschoolsshouldbetreatedasindividualstrata,andthe teachers and students within each SR school are individual PSUs. In the case of the NSR sample schools, thestrataaredefinedbythe6categoriesfortypesofschoolwithindistrict,andthePSUsarethesampleschools.
Given the relatively small size of the frame of schools in most strata, it is important to take into account the finitepopulationcorrection(fpc)factor,basedonthefirststageprobabilityofselection.Inthecaseofthe NSRsampleschoolsthatwereselectedwithPPS,theaverageofthefirststage(sampleschool)probabilitieswithineachstratumcanbeusedfordeterminingthefpcparameter.Aspecificationstablewasdevelopedwhichcanbeusedasareferencefordefiningthestrata,PSUsandfpcparametersfortheStatasvyanalysis. Thesespecificationsareshowninthetablebelow.
Table 9: Variables for sampling parameters for Stata SVY analysis of SGLA 2018 data
Level of indicator Type of school Stratum code PSU code FPC value
School and principal
SR schools 999 School ID 1
NSR schoolsSampling_stratum2 + ‘0’
School IDAveragefirststage(school)probability for stratum
Pupils
SR schools
Boys: School ID + ‘1’
Boy IDBoys within-school probability
Girls: School ID + ‘2’
Girl IDGirls within-school probability
NSR schoolsSampling_stratum2 + ‘0’
School IDAveragefirststage(school)probability for stratum
Teachers
SR schools School ID + ‘0’ Teacher IDTeachers within-school probability
NSR schoolsSampling_stratum2 + ‘0’
School IDAveragefirststage(school)probability for stratum
Teachers and teaching principals
SR schools999 for principal/teacher; school ID + ‘0’ for teachers
School ID for principal; teacher ID
1 for principal; teachers within-school probability
NSR schoolsSampling_stratum2 + ‘0’
School IDAveragefirststage(school)probability for stratum

Annex C: Learning assessment design
Phot
o cr
edit:
Sou
rovi
De

20
Sierra Leone Secondary Grade Learning Assessment 2018– Technical Annexes
Annex C: Learning assessment design
C.1 Purpose of the pupil learning assessment test
The purpose of the pupil test was to annually track learning outcomes, assessing students’ abilities in English and mathematics across time and grades. The test is to provide information complementary to information derived from Sierra Leone’s extensive examination system. The test will therefore focus more on providing information about learning outcomes linked to the curriculum, rather than on curriculum content coverage.
The purpose of the pupil test was to gather information about students’ learning outcomes. This meant that the range of items and test forms had to be aligned with a wide range of student abilities and skills. This range wassufficientlywidethatseveraltestformswererequired.
Atthestartoftheadministrationofthetestform,enumeratorsusedfilterquestionstodeterminetheappropriatetest form and record any indicators of disabilities that may affect students’ test responses as well as administer a module to know what assets the student or his/her family possessed.
C.2 Development of the test construct
Thedevelopmentofthetestconstruct(i.e.theskillsthetestistomeasure)areinlinewiththeP4-6,JSS and SSS curriculum and take into account:
• Everyday reading skills: extracting and using information from written English text found in everyday Sierra Leone contexts;
• Everyday mathematics skills: using operations, mathematical reasoning in everyday Sierra Leone contexts;
• SkillsrequiredinEnglishatschool(‘schoolEnglishitems’);
• Skillsrequiredinmathematicsatschool(‘schoolmathsitems’);
• TherelationshipbetweenoralfluencyandexpressionwhenreadingEnglishandeverydayreadingskills;and
• Differences in urban and rural contexts.
The test construct also took into account the importance of aligning any content assumptions with the curriculum relevant to the youngest students who took a particular test form. Some assumptions about content are inevitable in any item – for example, the formula for the area of a circle may be assumed or it may be given in the item. Since any given test form may be administered to students from a range of grades (e.g.JSS2andSSS2),itwasensuredthatanycontentassumptionswerenomorethanthoseexpectedby the curriculum for grades 5, 6, JSS1 and JSS2.
C.3 Test administration
The test was administered one-on-one by enumerators to individual students. It is the only method that allows us to test the full range of skills in literacy – speaking, reading, writing and listening. It is also an appropriate method when we cannot rely on all learners being able to read questions in the language of the test. The results of early reading assessments suggest, for example, that by the end of primary Grade 3, the majority ofchildrenhavenotmasteredthealphabetandshowgreatdifficultyinreadingsimplewords.
As the language of instruction is English, local languages can be used by enumerators for instructions and for mathematics items that are orally administered.

21
Sierra Leone Secondary Grade Learning Assessment 2018– Technical Annexes
C.4 Test forms
TherewerefivetestformstocoverJSS2andSS2.Thesealignwithgrades8and11althoughtheagerangewithinagrademaybewide.Therewere40itemspertestform(mathsandEnglish)plusfilterquestionstoguide the choice of the appropriate form for an individual student. Testing took about 45 minutes per pupil. OntheassumptionthattherewillbeasufficientrelationshipofabilityinmathematicsandEnglish,there werefivebooklets,oneforeachtestform(ratherthanhavingseparateEnglishandmathematicsbooklets).
SchoolmathsandschoolEnglishwerethefocusoffivetosixitemspertestform.
Multiple choice items were 36 of 40 items per test form.
To allow for longer passages in stimulus material while reducing the total number of words a student must read,atestformhaduptofiveorsixtestlets(asetofitemsaroundasinglestimulus).
Where required, stimulus material included colour.
C.5 Vertical linking
Toputresultsonthefivetestformsontoacommonscalesomeitemswerecommonacrosstheforms.
The following table shows the expected pattern of these links.
Table 10: Vertical linking of items across test forms
Test form level 1 Test form level 2 Test form level 3 Test form level 4 Test form level 5
30 items plus 10 link
10 link from lower level plus 20 plus 10 link to next test
10 link from lower level plus 20 plus 10 link to next test
10 link from lower level plus 20 plus 10 link to next test
10 link from lower level plus 30 items
Thismeansthefinaltestrequired160itemsplusabout12filterquestions–172itemsintotal.Thetestwillbeused for several years but this does not mean a requirement to change items from year to year. It is assumed that there is only a low chance of the same student being sampled and administered the same test form in successive years.
C.6 Test reliability and person separation
The length of the test, the sampling scheme and the requirement for meaningful disaggregated data place a value on higher reliability/person separation that is in tension with the need for validity in the test construct.2 Forresource(timeandbudget)reasons,thetestdevelopmentprocesscollapsedtheitemfieldtrialsand pilot testing phases and there were smaller than desirable numbers of students involved in the pilot tests (totalstudentscoveredinpilot=500).
2 Thesefactorsallinterrelate.Thesmallerthesamplewithineachdisaggregationgroupthegreateristhereliability(personseparationinIRTterms)required.Shorter tests are more likely to have lower reliability than longer tests. The shorter the test, the lower the validity in terms of sampling a complex domain.

22
Sierra Leone Secondary Grade Learning Assessment 2018– Technical Annexes
C.7 Test development
Sierra Leonean secondary grade teachers provided some qualitative feedback about the contextual and cultural appropriateness of draft items during the item development phase. The pilot test forms were taken by a total of 500 students. This means creating 7 pilot test forms (two at test levels 3 and 4, one at each of levels 1,2and5)withatleastfivecommonitemsacrosseachpairofpilottestforms–henceabout230itemsintotalplusvariationsinfilterquestions.About280draftitemsweredevelopedfromwhichtochoosethese.Each pilot test was taken by at least 70 students – 500 in total. The pilots administered using CAPI. There was qualitative feedback from the enumerators administering the pilot forms.
A key aspect of effective test development is having a clear statement of the underlying construct or skill that is to be assessed. The SGLA test construct is based on:
• A review of available curriculum documents (including accelerated teaching syllabi and draft JSS English curriculum,aversionofWASSCEEnglishsyllabus);
• A review of examples of English examination papers – NPSE, BECE, WASSCE; and
• AwebreviewofmaterialabouteverydaylifeinSierraLeone,afilmaboutthedailylifeofateenagerfromlessaffluenturbanareaattendingsecondaryschool;textbasedmaterialaboutgenderdifferencesinparticipation; newspapers and blogs; and Sierra Leone poetry.
The likely impact on teaching practice of the NPSE and BECE examinations (success in these examinations is normallyrequiredifastudentistocontinuetothenextstageofschooling)meansthatwemayassumethatstudents are familiar with these sorts of questions, although the high rates of low scores in these exams meant that we also planned for a wide range of familiarity with the language, content and skills required by these examinations.
The likely difference for many students, especially for those with rural and urban disadvantaged backgrounds, between their daily environment and the language and content of school meant that the construction of test items made only very limited demands on assumed knowledge about weights, lengths and distances and only very limited demands on assumed knowledge about the calendar (although the primary school curriculum is explicit about using “units of time to estimate and measure the duration of an event; determine the number ofmonths,weeks,days,hoursandminutesbetweentwoeventsincludinginwordproblems”).Mapsappear in the junior secondary curriculum but the extent to which north, south etc. are part of everyday life, especially in rural areas, is uncertain and therefore general care was taken with the assumed knowledge required.
Thediversityofstudents’dailycontexts(e.g.betweenvillageandurbanlife)suggestedthepotentialvalue of noting when item contexts are urban, rural or school-based.
Curriculumstatementsrefertotheimportanceofstudents’developingfluentandconfidentuseofSierraLeone’sofficiallanguage(English)forofficialbusinessandcommunicatingwiththerestoftheworldandas the foundation for becoming fully functional members of society and the world community. Curriculum statements refer to the importance of mathematics in solving problems in everyday life.
C.8 English construct
Students are able to:
• Understand, use and interpret continuous and non-continuous English texts;
• Use spelling and punctuation conventions; and
• Use conventions of English grammar.
Examples of continuous texts include sentences, paragraphs and stories. Examples of non-continuous texts include lists, public notices, advertisements and tables.

23
Sierra Leone Secondary Grade Learning Assessment 2018– Technical Annexes
C.9 Mathematics construct
Students should be able to:
• Extract, interpret and use mathematical information from text, barcharts, pictures, diagrams, maps and graphs; and
• Use basic arithmetical operations on integers, decimals and fractions in a school context.
Thefollowingtableshowstheanticipatedrangeofthelevelofdemand/difficultyforeachofthekeyelementsin this construct in the context of the intended test forms covering the ranges of abilities expected in grades JSS2andSSS2.Therequirementsoftestlengthandcoherencerequiredsamplingfromthedomaindefined by the construct rather than a test where all aspects are equally present.
Atestlet(groupofitemswithacommonstimulusmaterial)containedamixtureofitems,somefocusedon the English construct and some on the mathematics construct.
Someitemsintheformsatthelowestlevelofdifficultywereadministeredorally.
Table11:Illustrationofexpectedrangeofdifficultywithineachelementoftheproposedconstruct for English
Element of construct
Approx. items
Expected lower level of demand/difficulty
Medium level of demand/difficulty
Expected highest level of demand/difficulty
Understand, use and interpret continuous English texts
10-12
• Meanings of words in the context of a sentence
• Retrieve information from a short passage
• Meanings of phrases in the context of a passage of three paragraphs
• Retrieve information by relating two sentences from a passage
• Identify overall meaning of a short passage
• Integrate an understanding of two passages
• Read two simple sentences aloud withfluencyandexpression
• Read a paragraph about Sierra Leone aloud with fluencyandexpression
• Read a poem (rhyme andmetre)aloudwithfluencyandexpression
Understand, use and interpret non-continuous English texts
3-5
• Extract information from a short warning notice
• Find information from a table to complete information required by a form
• Relate different aspects of a complex webpage – e.g. a government webpage
Use spelling and punctuation conventions
1-2
• Choose the correct spelling of a common word
• Identify the correctly punctuated version of a short sentence
• Choose the correct contractiontofillinasentence
• Identify the correct combination of spelling and punctuation in a sentence from alternatives correct in other contexts
Use conventions of English grammar
1-2
• Choose correct Subject-verb agreement present tense
• Identify correct preposition
• Choose adverb or adjective to complete a sentence
• Pronoun agreement
• Choose correct version of a sentence in the present to put it into past or future

24
Sierra Leone Secondary Grade Learning Assessment 2018– Technical Annexes
Table12:Illustrationofexpectedrangeofdifficultywithineachelementoftheproposedconstruct for Mathematics
Element of construct
Approx. items
Expected lower level of demand/difficulty
Medium level of demand/difficulty
Expected highest level of demand/difficulty
Arithmetical operations in school context
1-2
• Add/subtract two digit numbers with/without regrouping
• Add/subtract four digit numbers with/without regrouping
1-2
• Multiply/divide (exact)2digitby1 digit
• Multiply/divide four digit numbers by two-digit number(exact)
• Multiply/divide with decimal numbers set in context of percentages, ratios/rates, proportions, VAT(15%)
1-2
• Fractions in numbers and picture representation
• Proper fractions (add/subtract/multiply/divide)
• Improper fractions
• Solution of simple linear equations by inspection
Extract, interpret and use mathematical information from text, barcharts, pictures, diagrams, maps and graphs
15
• Read values from a bar chart
• Identify largest/smallest value in a table
• Name idealised geometric object (e.g.circle)bestmatching a picture of a real object
• Draw conclusions from information presented in a bar chart
• Calculate an average from information presented in text
• Interpolate values presented in a non-linear graph
• Estimate areas of simple figures
• Extract information about a negative trend from a complex barchart and estimate an extrapolation
• Rearrange and apply a linear formula in a real-world context
• Reason about the perimeter of a non-rectangular parallelogram
• Estimate the number of people who can fitintoarectangulararena
• Apply assumed knowledge about areas of simple figures(e.g.circle) to estimate volumes of simple objects (e.g.cylinder)

Annex D: Household asset index Ph
oto
cred
it: A
mne
sty
Inte
rnat
iona
l USA

26
Sierra Leone Secondary Grade Learning Assessment 2018– Technical Annexes
Annex D: Household asset index Collecting data on socioeconomic status of the households and communities of pupils in the sample will allow the learning assessment data to answer wider questions about inequalities in learning outcomes and pupils’ socioeconomic status. Precedents for such instruments include the Trends in International Mathematics and ScienceStudy(TIMSS),andYoungLives.Sampledpupilswerebeaskedthefollowingquestionsaboutassetsowned by their families, mostly taken from the Sierra Leone Living Standards Measurement Survey (Statistics SierraLeone,2011).3
Does your family have the following items in your home? Please look at the pictures on this card one by one and tell me if your family has any of these items in your home.
Bed Television
Mobile phone Fan
Chair Radio
Bench Truck
Sewing machine Bicycle
Culture stove Sofa(set)
Computer Modernstove(gas/Afrigas)
Electric iron Stool
Refrigerator/freezer Air conditioner
Boat Mattress(grass)
Car Mattress(foam)
Generator Mat
Motorcycle Table
Charcoal iron/coal goose
AcompositehouseholdassetindexwasconstructedusingPrincipalComponentAnalysis(PCA),byretainingthefirstprincipalcomponent.
3 Thesefactorsallinterrelate.Thesmallerthesamplewithineachdisaggregationgroupthegreateristhereliability(personseparationinIRTterms)required.Shorter tests are more likely to have lower reliability than longer tests. The shorter the test, the lower the validity in terms of sampling a complex domain.
Annex E: School Leadership and Management (SLM) index
Phot
o cr
edit:
Zar
a D
urra
ni

28
Sierra Leone Secondary Grade Learning Assessment 2018– Technical Annexes
Annex E: School Leadership and Management (SLM) indexLeh wi Lan plans to introduce training and support for secondary school principals in Sierra Leone to improve theirschoolleadershipandmanagement(SLM).Forthisreason,andtoprovideusefulinformationgenerally on SLM for policy makers and Ministry of Education staff, a number of indicators relating to SLM have been added to the SGLA for its midline round. An SLM index has been constructed based on these indicators.
TheproposedindexgivesequalweighttofiveareasofSLM:
1. Leading teaching: The extent to which the principal, and other staff who manage the school, lead the development of teaching through training, observation, and monitoring (This includes people management butalsowhatcomesunder‘leanoperations’intheWMSframework);
2. Administration and planning: The administrative processes that the school has in place to keep lessons onschedule,ensurecurriculumcoverage,andfinancetheschool(ThisissomewhatsimilartooperationsmanagementintheWMSframework);
3. Interaction with the community: This refers to the quantity and quality of interaction between the school, parents, other members of the community, and other local organisations;
4. The inclusiveness of the school to children whose performance is weaker or who come from marginalised groups; and
5. Positive learning environment: The extent to which the school is a positive learning environment where school staff, as well as students, share common values and vision, and can discuss their progress and issues, and learn from each other (This section combines aspects of the instructional leadership construct usedinTALIS,aswellasaspectsoftheLeadershipforLearningconcept).
Four types of question are used to measure these constructs:
1. The principal is asked about the frequency of certain practices and to provide evidence for them;
2.Theprincipalisaskedabouthowoftenheorshehasundertakenaspecificsetofactivitiesinthepastterm;
3. The principal’s attitudes are examined through his or her agreement with a number of statements; and
4. Teachers in the school are asked about the frequency of certain activities and this information is aggregated at the school level. This data triangulates the information provided by the principal him or herself and is hoped to reduce the desirability bias which would arise from basing scores purely on the principal’s own answers.

29
Sierra Leone Secondary Grade Learning Assessment 2018– Technical Annexes
Thefivecategoriesandthesurveyindicatorsassociatedwitheacharelistedinthetablebelow.
Table 13: Questions and scoring
Questions Scoring
Community involvement
DoestheschoolhaveanyCommunity-TeacherAssociations(CTAs)orParent-TeacherAssociations(PTAs)?(and follow-up questions)[ctapta]
0 – no CTA or PTA; 1 – CTA or PTA exists but has not met lately; 2 – CTA or PTA exists and met recently
Doyouhaveaschooldevelopmentplanoraschoolactionplan? Who was involved in developing the School Development Plan or SchoolActionPlan?[sdpsap]
0 – no SDP or SAP; 1 – there is an SDP or SAP but parents, religious authorities, students, CTA/PTA, or Village Development Committee were not involved in developing it; 2 – there is an SDP or SAP and at least one of the above were involved
Activity F: I provided parents or guardians with information on the school and student performance.
0 – never, 1 – sometimes; 2 – often; 3 – very often
Activity M: I talked to the parents or guardians about the development of the school.
0 – never; 1 – sometimes; 2 – often; 3 – very often
Activity N: I talked to local religious authorities about the school. 0 – never; 1 – sometimes; 2 – often; 3 – very often
Activity O: I talked to community leaders or the Village Development Committee about the development of the school.
0 – never; 1 – sometimes; 2 – often; 3 – very often
Activity P: I talked to the Community Teacher Association or Parent Teacher Association about the development of the school.
0 – never; 1 – sometimes; 2 – often; 3 – very often
Perception C: There is a low level of cooperation between the school and the community.
0 – strongly agree; 1 – agree; 2 – disagree; 3 – strongly disagree
Leading teaching
Do you or someone else in the school conduct lesson observation asastandardpractice?(and follow-up questions)[lessonobs]
0 – no one observes lessons; 1 – someone observes lessons but no documentation; 2 – someone observes lessons and there is a schedule of it as documentation
(Fromteacherquestionnaire)Howmanytimeswereyourlessonsobserved in total by someone from this school in the second term (January-April2018)?[lo_avg]
0-15 times (averaged at school level)
(Fromteacherquestionnaire)Haveyoureceivedanyfeedbackfromthe observer or another senior member of staff based on the lesson observations?[lo_feedback_avg]
0 – no; 1 – yes (aggregated as a proportion of teachers who said yesineachschool)

30
Sierra Leone Secondary Grade Learning Assessment 2018– Technical Annexes
Table 13: Questions and scoring (continued)
Questions Scoring
Leading teaching (continued)
How many times did you or another senior member of staff hold staffmeetingsinthesecondterm(January-April2018)? (and follow up questions)[staffmeet]
0 – no staff meetings were held; 1 – 1-2 staff meetings but no documentation; 2 – 1-2 staff meetings with documentation (meetingnotes/attendance); 3 – 3 or more staff meetings but no documentation; 4 – 3 or more staff meetings with documentation
(Fromteacherquestionnaire)Howmanystaffmeetingsdidyouattendinthesecondterm(January-April2018)?[staffmeet_t]
0-15 times
(Fromteacherquestionnaire)Didyouhaveanyformalone-on-onemeetings with the Principal/HOD in the second term (January-April 2018)?Howmanytimesdidyouhavetheseformalone-on-onemeetingsinthesecondterm(January-April,2018)?[meeting_1o1]
0-15 times
Have you taken any action to provide training and support to teachers inthisschoolinthecurrentschoolyear?(and follow up question)[teachsup]
0 – no teacher support provided, or cannot name any type of teacher support provided; 1 – teacher support provided and can name at least one type of support
Have you done anything to improve teacher attendance during the secondterm(January-April2018)?(with preceding question about issues with teacher attendance and follow-up question about what action was taken)[teachatt]
0 – there were issues with teacher attendance but no action was taken/respondent cannot name anyspecificaction;1–therewerereportedly no issues with teacher attendance; 2 – there were issues with teacher attendance and one ormorespecificactionsweretaken
Activity B: I collaborated with teachers to solve classroom discipline problems.
0 – never; 1 – sometimes; 2 – often; 3 – very often
Activity C: I took action to support co-operation among teachers to develop new teaching practises.
0 – never; 1 – sometimes; 2 – often; 3 – very often
Activity D: I took action to ensure that teachers take responsibility to improve their teaching skills
0 – never; 1 – sometimes; 2 – often; 3 – very often
Activity E: I took action to ensure that teachers feel responsible for their students’ learning outcomes.
0 – never; 1 – sometimes; 2 – often; 3 – very often
Activity J: I discussed measures to address weakness in teaching with a teacher.
0 – never; 1 – sometimes; 2 – often; 3 – very often
Activity K: I contacted the higher authority about the performance of one or more teachers.
0 – never; 1 – sometimes; 2 – often; 3 – very often
Activity L: I adjusted a teacher’s work responsibilities to try and improve his or her performance.
0 – never; 1 – sometimes; 2 – often; 3 – very often

31
Sierra Leone Secondary Grade Learning Assessment 2018– Technical Annexes
Table 13: Questions and scoring (continued)
Questions Scoring
Inclusiveness
Have you done anything in the school to support students who are weakintheirstudiesduringthesecondterm(January-April2018)?(and follow up question)[schinc_w]
0 – Principal did nothing to support weak students, or did something but cannot name any activity; 1 – Principal did something to support weak students and can name at least one activity
(Fromtheteacherquestionnaireandaveragedattheschoollevel) Didyoutakeanyactiontosupportthestudent(s)whowereweak intheirstudiesinyourclasslastterm?[schinc_w_t]
0 – Teacher reports no students were struggling or did not take any action, or cannot name any action; 1 – Teacher took action and can name the action taken
Have you done anything in the school to support marginalised studentsduringthesecondterm(January-April2018)?
Marginalised students can include girls, students with physical or learning impairments and students from low-income families. (and follow up question)[schinc_m]
0 – Principal did nothing to support marginalized students or did something but cannot name any action; 1 – Principal did something to support marginalized students and can name at least one action
Administration and planning
Do you have a schedule or scheme of work for maths and/or English forthisschoolyearorterm?(and follow up question)[schwk]
0 – no scheme of work; 1 – respondent says there is a scheme of work but not seen; 2 – scheme of work seen
Do you have a cash book to record school income and expenditure forthecurrentschoolyear?(and follow up question)[cashb]
0 – no cashbook, 1 – respondent says there is a cashbook but not seen, 2 – cashbook seen
Doesyourschoolhaveatimetable?(Data collectors also checked whether they could see a timetable)[timetable]
0 – the school does not have a timetable or it was not observed; 1 – timetable seen
Observation of school breaks 0 – no break observed; 1 – at least 1 break observed
Activity G: I checked for mistakes and errors in school administrative procedures and reports.
0 – never; 1 – sometimes; 2 – often; 3 – very often
Activity H: I resolved problems with the lesson timetable in this school.
0 – never; 1 – sometimes; 2 – often; 3 – very often

32
Sierra Leone Secondary Grade Learning Assessment 2018– Technical Annexes
Table 13: Questions and scoring (continued)
Questions Scoring
Learning environment
Perception B: The school staff share a common set of beliefs about schooling/learning
0 – strongly disagree; 1 – disagree; 2 – agree; 3 – strongly agree
Perception D: The relationships between teachers and students are good.
0 – strongly disagree; 1 – disagree; 2 – agree; 3 – strongly agree
Perception E: Teachers do not encourage students to be responsible for their own learning in school.
0 – strongly agree; 1 – agree; 2 – disagree; 3 – strongly disagree
Perception F: Teachers do not have freedom to exercise their professional judgment in classroom teaching.
0 – strongly agree; 1 – agree; 2 – disagree; 3 – strongly disagree
Perception G: Change in classroom practise is viewed positively by teachers.
0 – strongly disagree; 1 – disagree; 2 – agree; 3 – strongly agree
Perception H: School staff share common values. 0 – strongly disagree; 1 – disagree; 2 – agree; 3 – strongly agree
Perception I: The school staff do not share my vision of where the school is going.
0 – strongly agree; 1 – agree; 2 – disagree; 3 – strongly disagree
Perception J: Students are told how well they have done in relation to their own previous achievement.
0 – strongly disagree; 1 – disagree; 2 – agree; 3 – strongly agree
Perception K: Teachers do not help students to understand the learning objectives of each lesson.
0 – strongly agree; 1 – agree; 2 – disagree; 3 – strongly disagree
Perception L: School staff cannot have an open discussion about difficulties.
0 – strongly agree; 1 – agree; 2 – disagree; 3 – strongly disagree
Perception M: There is mutual respect for colleagues’ ideas. 0 – strongly disagree; 1 – disagree; 2 – agree; 3 – strongly agree
Activity R: The school did something to recognise the success of a student.
0 – never; 1 – sometimes; 2 – often; 3 – very often
Activity questions were a set of activities introduced with the following instruction
I will now ask you about how often you engage in different types of activities. I am going to read you some statements, and I would like you to point on the card in front of you how often you engaged in each of the activities during the last 12 months.
Percpetion questions were a set of statements introduced with the following instruction
I will now ask you how strongly you agree or disagree with the statements I will read to you. These are related to how you manage your school. I am going to read you some statements, and I would like you to point at one of the circles in front of you to guide me on how strongly do you agree or disagree, with each one. You can also tell me if you do not understand any statement.

33
Sierra Leone Secondary Grade Learning Assessment 2018– Technical Annexes
TheSLMnormativeindexconstructedforSGLAIIgivesequalweighttothefivecategoriesdetailedabove and has the following properties:
• Awell-definedandmeaningfulminimumandmaximum;
• A scale that can be measured repeatedly across rounds of data collection;
• Easy to understand and interpret;
• Easy to break down into constituent components based on the normative concepts listed above (Leading teaching,workingwithcommunity,administrationandplanning,inclusion,andlearningenvironment).
• Gives equal weight to each of these components;
• Easy to understand how a change in one aspect of school functioning would alter the overall index; and
• Should retain validity while relationships among the survey variables may change e.g. due to training that encouragesspecificmanagementpractices
Simplesummativescalesfitthesecriteriawell.Wecreatesummativescalesbyre-scalingeachitemin table 13 so that it lies on a scale from 0 to 1, and then calculating the arithmetic mean of the items under each category.

REPUBLIC OF SIERRA LEONE
MINISTRY OF BASIC AND SENIOR SECONDARY EDUCATION
Contact us:
Diana Ofori-Owusu Monitoring, Research and Learning Lead Leh wi Lan Programme Ministry of Basic and Senior Secondary Education New England Ville, Freetown, Sierra Leone
Email: [email protected] Email: [email protected]
Phot
o cr
edit:
Abd
ul P
aul S
affa