sierra leone: 2013 article iv consultation and request for a - imf
TRANSCRIPT

© 2013 International Monetary Fund
IMF Country Report No. 13/330
SIERRA LEONE 2013 ARTICLE IV CONSULTATION AND REQUEST FOR A THREE-YEAR ARRANGEMENT UNDER THE EXTENDED CREDIT FACILITY In the context of the 2013 Article IV Consultation and Request for a Three-Year Arrangement Under the Extended Credit Facility, the following documents have been released and are included in this package:
The publication policy for staff reports and other documents allows for the deletion of market-sensitive information.
Copies of this report are available to the public from
International Monetary Fund Publication Services 700 19th Street, N.W. Washington, D.C. 20431
Telephone: (202) 623-7430 Telefax: (202) 623-7201 E-mail: [email protected] Internet: http://www.imf.org
Price: $18.00 a copy
International Monetary Fund Washington, D.C.
The Staff Report prepared by a staff team of the IMF for the Executive Board’s consideration on October 21, 2013, following discussions that ended on September 12, 2013, with the officials of Sierra Leone on economic developments and policies. Based on information available at the time of these discussions, the staff report was completed on October 7, 2013.
An Informational Annex prepared by the IMF. A Debt Sustainability Analysis prepared by the staffs of the IMF and the World Bank. A Press Release including a statement by the Chair of the Executive Board, and summarizing the views of the Executive Board as expressed during its October 21, 2013 consideration of the staff report on issues related to the Article IV Consultation and the IMF arrangement. A Statement by the Executive Director for Sierra Leone.
The documents listed below have been or will be separately released.
Letter of Intent* sent to the IMF by the authorities of Sierra Leone Memorandum of Economic and Financial Policies* by the authorities of Sierra Leone Techincal Memorandum of Understanding* *Also included in the Staff Report.
November 2013

SIERRA LEONE
STAFF REPORT FOR THE 2013 ARTICLE IV CONSULTATION AND REQUEST FOR A THREE-YEAR ARRANGEMENT UNDER THE EXTENDED CREDIT FACILITY
KEY ISSUES Context. Against the background of challenging economic and social conditions, Sierra Leone has been making progress since the end of the civil conflict in 2002. The economy has been growing at a solid pace, inflation has been trending down, and socio-political stability is taking hold. Going forward, the authorities need to strengthen policy implementation particularly in the fiscal area to entrench macroeconomic stability, support private sector development and job creation, and develop social policies to protect the most vulnerable groups in the population.
Consultation focus. Policy discussions focused on fiscal consolidation and public financial management reforms; monetary policy and price stability; borrowing policies and long-term debt sustainability; private sector development and structural reforms to enhance inclusive growth.
Staff views. Staff recommends the approval of the authorities’ request for a three-year arrangement under the Extended Credit Facility (ECF) in an amount of SDR 62.22 million (60 percent of quota). In May 2013, the authorities decided to cancel the three-year ECF arrangement approved by the Board in June 2010 because key objectives under the program supported by the arrangement were no longer achievable. The new arrangement is aimed at supporting the authorities’ efforts to consolidate macroeconomic stability, strengthen the fiscal position, build external buffers, and promote broad-based economic growth in the context of their new Poverty Reduction Strategy (PRS).
Safeguards assessment. The latest safeguards assessment was updated in 2010. The next update will be completed by the time of the first review of the proposed ECF arrangement.
The new Poverty Reduction Strategy. The Joint IMF-World Bank Staff Advisory Note on the new PRS will be circulated to the Board in early November.
October 7, 2013

SIERRA LEONE
2 INTERNATIONAL MONETARY FUND
Approved By Michel Lazare (AFR) and Dhaneshwar Ghura (SPR)
Discussions took place in Freetown during September 29–October 3, 2012; May 8–21 and September 3–12, 2013. The team comprised Ms. Kabedi-Mbuyi (head), Messrs. Palmason, Orav, Zhdankin (all AFR), Ms. Parulian (SPR–September 2012 mission), and Mr. Kumah (Resident Representative). Mr. Tucker (OED) participated in policy discussions.
CONTENTS BACKGROUND: TAKING STOCK __________________________________________________________________ 4
RECENT ECONOMIC DEVELOPMENTS AND SHORT-TERM OUTLOOK __________________________ 8
MEDIUM-TERM FRAMEWORK ____________________________________________________________________ 9
POLICY DISCUSSIONS _____________________________________________________________________________ 10
A. Fiscal Policy and Reforms _______________________________________________________________________ 10
B. Monetary Policy and Financial Sector Issues ____________________________________________________ 14
C. Supporting Long-Term Debt Sustainability _____________________________________________________ 15
D. Enhancing Competitiveness and External Stability ______________________________________________ 16
E. Promoting Inclusive Growth _____________________________________________________________________ 17
F. Other Surveillance Issues _______________________________________________________________________ 18
PROGRAM ISSUES _________________________________________________________________________________ 19
STAFF APPRAISAL _________________________________________________________________________________ 20
BOXES
1. Response to Fund Advice from the 2010 Article IV Consultation _______________________________ 6
2. Budget Execution Under Severe Resource Constraints _________________________________________ 7
3. Public Financial Management Reform Strategy for 2014–17 ____________________________________ 13
FIGURES
1. Development Indicators ________________________________________________________________________ 22
2. Recent Economic Developments and Medium-Term Outlook, 2007–17 ________________________ 23
3. Real and External Sectors, 2008–June 2013 _____________________________________________________ 24
4. Fiscal Sector, 2008–12 __________________________________________________________________________ 25
5. Monetary and Financial Sector Indicators, 2008–13 ____________________________________________ 26

SIERRA LEONE
INTERNATIONAL MONETARY FUND 3
6. Medium-Term Fiscal Outlook, 2013–18 _________________________________________________________ 27
7. Selected Indicators on Financial Sector Depth and Inclusiveness _______________________________ 28
8. Indicators of Public and Publicly-Guaranteed External Debt Under Alternative Scenarios, 2013–33 ______________________________________________________________ 29
9. Business Environment Indicators ________________________________________________________________ 30
10. Progress Towards the MDGs, 1990–2015 _______________________________________________________ 31
TABLES
1. Selected Economic Indicators, 2010–18 _________________________________________________________ 32
2a. Fiscal Operations of the Central Government, (Billions of leone), 2010–18 _____________________ 33
2b. Fiscal Operations of the Central Government (Percent of Non-Iron Ore GDP), 2010–18 _______ 34
3. Statement of Government Operations (GFSM 2001), 2010–18 __________________________________ 35
4. Monetary Accounts, 2010–18 ___________________________________________________________________ 36
5. Balance of Payments, 2010–18 __________________________________________________________________ 37
6. Indicators of Capacity to Repay the Fund, 2010–24 _____________________________________________ 38
7. Actual and Proposed Disbursements Under the ECF Arrangement, 2013–16 ___________________ 39
8. Millennium Development Goals, 1990–2010 ____________________________________________________ 40
9. Financial Soundness Indicators of the Banking System, 2005–13 _______________________________ 41
10. External Financing Requirements and Sources, 2013–16________________________________________ 42
11. Risk Assessment Matrix (RAM) __________________________________________________________________ 43
APPENDIXES
I. Letter of Intent __________________________________________________________________________________ 44 Supplemental Letter of Intent ___________________________________________________________________ 47
Attachment 1. Memorandum of Economic and Financial Policies for 2013–16 ____________ 48
Attachment 2. Technical Memorandum of Understanding ________________________________ 67
ANNEXES
I. Competitiveness and External Stability Assessment ____________________________________________ 74
II. Financial Sector Development Issues ___________________________________________________________ 78
III. In Search of Inclusive Growth—Key Lessons from the Literature _______________________________ 86

SIERRA LEONE
4 INTERNATIONAL MONETARY FUND
BACKGROUND: TAKING STOCK
A Decade of Peace—Progress and Remaining Challenges
1. Sierra Leone has made important strides in economic reconstruction and macroeconomic as well as political stability since the end of the civil conflict in 2002. Economic growth has been sustained and has strengthened in the last two years with the coming on stream of iron ore production and increased infrastructure investment. Per capita GDP growth was slightly above the 2.4 percent Sub-Saharan Africa average for 2003–11. Inflation, fuelled by expansionary monetary and fiscal policies, currency depreciation, and global price shocks, has been in the double-digits for most of the past decade. However, tighter monetary policy stance and increased food supply in the last two years have helped contain inflationary pressures. The external current account deficit deteriorated sharply in 2010–11 mainly because of the surge in FDI-financed imports associated with iron ore investment; it narrowed in 2012 with the onset of iron ore exports (Text Table 1). Since the end of the civil conflict, the socio-political situation has been stable, and three peaceful rounds of elections have been held.
2. While recent progress is laudable, fostering broad-based growth and reducing poverty remain daunting challenges. Although in decline, the poverty headcount is above 50 percent. Unemployment and underemployment are also high, and social indicators are weak by regional standards. There are large infrastructure gaps, particularly for roads, energy, and access to safe water and sanitation (Figure 1). Progress in institution building has been uneven, and administrative capacity constraints remain important.
3. The authorities have been addressing Sierra Leone’s developmental challenges within the framework of poverty reduction strategies with donor support. They implemented two generations of Poverty Reduction Strategies (PRS) during 2005–12, and have recently adopted a new PRS, which aims to consolidate past progress and advance social and economic development in 2013–18. Donors have supported the authorities’ efforts through budget aid and technical assistance (TA). In addition to TA, the IMF also provided policy advice and funding under
Text Table 1. Sierra Leone: Recent Economic Developments, 2003–12(In percent of non-iron ore GDP, unless otherwise indicated)
2003 2004 2005 2006 2007 2008 2009 2010 2011 2012
GDP at constant prices (percent change) 9.3 6.6 4.5 4.2 8.0 5.2 3.2 5.3 6.0 15.2Excluding Iron ore 9.3 6.6 4.5 4.2 8.0 5.2 3.2 5.3 5.8 5.3
Consumer prices (end-of-period, percent change) 11.3 14.4 13.1 8.3 13.8 12.2 10.8 18.4 16.9 12.0
Gross international reserves in months of imports 2.2 3.3 4.5 4.6 4.3 4.4 4.1 3.4 2.8 3.1(Excluding iron ore related imports)
Current account balance -3.5 -4.3 -5.2 -4.2 -4.2 -8.9 -6.3 -19.7 -45.0 -39.4(Including official grants)
External public debt 118.7 119.0 106.4 82.9 24.5 24.2 28.2 30.4 32.6 27.8
Domestic primary balance -5.9 -4.8 -4.3 -3.4 -2.4 -3.0 -4.0 -5.9 -3.8 -3.8
Sources: Sierra Leonean authorities; and Fund staff estimates and projections.
( p )

SIERRA LEONE
INTERNATIONAL MONETARY FUND 5
ECF-supported programs. The authorities have generally been responsive to IMF policy advice and built on TA recommendations to advance structural reforms and improve policy formulation (Box 1).
Lessons from the Last ECF-Supported Program
4. Performance under the previous ECF-supported program (June 2010–June 2013) was mixed. Macroeconomic stability improved, economic growth accelerated, and inflation declined (Figure 2). Comprehensive structural and institutional reforms were completed to enhance revenue collection as well as expenditure and treasury cash flow management, improve monetary operations and banking sector supervision, and enhance the management of natural resources. However, progress was limited in the fiscal area: the fiscal position weakened over time due to tension between available resources and the scaling-up of infrastructure investment. While revenue performance was in line with program objectives, expenditure overruns marked the three program years (Box 2). The larger-than programmed deficits were financed with: (i) direct financing from the Bank of Sierra Leone (BoSL) in 2010; (ii) unpaid bills to domestic suppliers in 2011 and; (iii) over-borrowing from the government securities market, as well as accumulation of significant unpaid bills to domestic suppliers in 2012. Corrective measures to reduce fiscal dominance and address the slippages had a limited impact in the face of persistent weaknesses in public financial management. The latter included: (i) weak coordination for budget preparation and low forecast capacity; (ii) accommodation of in-year requests for additional spending; (iii) disaggregated government accounts as well as low coordination between agencies and; (iv) absence of a public investment plan integrated with a medium-term expenditure framework (MEFP ¶ 9–15).

SIERRA LEONE
6 INTERNATIONAL MONETARY FUND
Box 1. Sierra Leone: Response to Fund Advice from the 2010 Article IV Consultation
Fund Advice Response
Enhance the efficiency of revenue collecting agencies and broaden the tax base in order to create fiscal space for infrastructure investment and social services.
The authorities introduced structural reforms that have strengthened efficiency at the National Revenue Agency (NRA). Key measures include the setting up of: a Domestic Tax Department, the Large Taxpayer office, the Medium Taxpayer office; and the increase in penalties for noncompliance with tax obligations. They also overhauled the tax system for the mining sector.
Contain non-priority spending while striking a balance between spending on infrastructure and social services.
The authorities tightened expenditure commitment procedures to improve non-priority spending monitoring and contain them to budgeted levels. In this context, they set up a high-level inter-agency Cash Management Committee; adopted regulations to guide public investment execution, and prioritized spending on roads.
Eliminate fuel subsidies.
The authorities took action to substantially reduce implicit fuel subsides in the form of foregone excises and road user charges. In this context, they introduced a new fuel pricing mechanism.
Foster budget credibility and predictability by strengthening the medium-term expenditure framework.
The preparation of a medium-term expenditure framework has enhanced budget credibility, while the wider rollout of the Integrated Financial Management Information System (IFMIS) has strengthened the infrastructure for budget execution. The introduction of a multi-year pay reform plan has set the stage for increasing capacity in the civil service. Amendments to the Government Budgeting and Accountability Act have helped clarify that only viable capital projects should enter into the budget.
Limit monetization of the fiscal deficit.
The Bank of Sierra Leone (BoSL) Act was amended to cap direct credit to government at 5 percent of previous year’s revenue. The authorities have complied with this measure since its introduction in 2011.
Increase effectiveness of monetary policy and develop a yield curve.
The BoSL adopted the reverse repo rate as the benchmark interest rate, which is announced regularly by the Monetary Policy Committee.
Enhance the supervisory role of BoSL and improve regulation and supervision.
New off-site guidelines for surveillance were adopted and revised prudential guidelines were issued.
Improve the information flow on creditors and creditworthiness.
The authorities established a Credit Reference Bureau to provide banks with information on the creditworthiness of prospective customers.

SIERRA LEONE
INTERNATIONAL MONETARY FUND 7
Box 2. Sierra Leone: Budget Execution Under Severe Resource Constraints
Budget execution has faced important challenges in recent years. Contributing factors are limited resources in the face of expenditure pressures and weak public financial management. As a result, spending in goods and services, domestically financed investment and wages and salaries have been systematically higher than budgeted, compromising fiscal performance under the previous ECF-supported program.
Low revenue base and declining budget support. Limited gains on revenue performance set the stage for a tight fiscal envelope in recent years, with revenue mobilization overly dependent on exceptional collection from the mining sector (iron ore) and oil exploration licenses. In addition, declining budget support partially rooted in Sierra Leone’s graduation from a post-conflict status added to the resource constraints.
Limited access to domestic financing. Borrowing from the government securities market is constrained by the narrow investors’ base, its high cost (the 91-day interest rate was 24.5 percent in 2010), and prospects for crowding out credit to the private sector. In addition, overdraft financing from the BoSL was significantly reduced when the central bank act was adopted by parliament in late 2011, limiting government financing from BoSL to 5 percent of revenue in the preceding year. This implied maximum financing from BoSL equivalent to about 0.5 percent of GDP in fiscal year 2011 while actual BoSL financing reached 2.9 percent of GDP in 2010.
Weak public financial management (PFM). Against the background of administrative capacity constraints, in-year requests for additional spending were not adequately curbed in recent years, resulting in overspending. Although the IFMIS supports expenditure controls for most line ministries, lack of clarity under the Government Budget and Accountability Act (2005) led to accommodation of expenditures deemed to be of high urgency, particularly for roads and other infrastructure projects.
Expenditure overruns and high cost of domestic debt. In 2010–12, on average, domestically financed investment, expenditure on goods and service, wages and salaries to a lesser extent, were above the program targets by 55 percent, 20 percent, and 5 percent respectively. Key contributing factors were: (i) higher than anticipated cost of running national elections in 2012; (ii) higher than projected cost of the pay reform and the need to hire additional teachers, nurses, and police officers; and (iii) faster execution rate for domestically financed investment that led to accelerated payment to projects contractors. Financing the higher than budgeted fiscal deficit from the securities market has increased the domestic debt burden with interest charges increasing from Le 142 billion (1.4 percent of non-iron ore GDP in 2010) to Le 256 billion (1.7 percent of non-iron ore GDP) in 2012.
0
0.5
1
1.5
2
2.5
3
3.5
4
2006 2007 2008 2009 2010 2011 2012
program actual
Domestic Capital Spending(In percent of GDP)
0
0.5
1
1.5
2
2.5
3
3.5
4
4.5
2006 2007 2008 2009 2010 2011 2012
program actual
Goods and Services(In percent of GDP)
0
1
2
3
4
5
6
7
2006 2007 2008 2009 2010 2011 2012
program actual
Wages and Salaries(In percent of GDP)
SIERRA LEONE
8 INTERNATIONAL MONETARY FUND
RECENT ECONOMIC DEVELOPMENTS AND SHORT-TERM OUTLOOK 5. Economic growth surged in 2012 as large-scale iron ore mining production started (Figure 3 and Table 1). The onset of iron ore production at two mines, and a strong performance in agriculture, services, and construction boosted GDP growth to 15.2 percent in 2012, up from 6 percent in 2011. Growth is projected to average 13.7 percent in 2013–14, supported by the same drivers and continued high public investment (MEFP ¶ 4).
6. Inflationary pressures declined in 2012 and prospects for 2013 are encouraging. The inflation rate stood at 12.1 percent (year-on-year) in 2012 (16.9 percent in 2011), supported by a tight monetary policy stance, stability in the exchange rate, and increased food supply. The declining trend in inflation has continued in 2013 as the authorities are restraining fiscal policy, and monetary policy conditions have remained tight. The inflation rate (year-on-year) stood at 9.5 percent in July, which augurs well for the end-year target (MEFP ¶ 5).
7. The 2012 fiscal position was worse than anticipated (Tables 2a, 2b; and Figure 4). The domestic primary deficit reached 3.8 percent of non-iron ore GDP, compared with 1.8 percent budgeted, because of expenditure overruns. While revenue collection was slightly higher than expected, expenditure was well above appropriation levels, mostly on account of spending related to the November elections, and the authorities’ continued efforts to scale-up infrastructure investment. The higher-than-budgeted deficit was partially financed with over-borrowing from the government securities market and an accumulation of unpaid bills at the end of the year (MEFP ¶ 8).
8. The external position improved in 2012 and is expected to strengthen further in 2013 (See Figure 3 and Table 5). The current account deficit dropped from 45 percent of non-iron ore GDP in 2011 to 39.4 percent in 2012. The improvement reflects the sharp decline in investment-led imports related to iron ore projects, the commencement of iron ore export, and favorable terms of trade. Although the latter are expected to deteriorate in 2013, the current account deficit would narrow further on account of the expected strong export performance. Sierra Leone’s reserve coverage rose from 2.8 months of imports (excluding iron ore-related imports) in 2011 to 3.1 months in 2012. It is expected to stabilize around this level in 2013 (MEFP ¶ 6).
9. Monetary and banking sector developments were broadly satisfactory in 2012, as risks to financial sector stability appeared contained (Figure 5 and Tables 4 and 9). Broad money (M2) grew by 23.1 percent, slightly faster than nominal non-iron ore GDP; and credit to the private sector expanded by 6.3 percent, down from 21.8 percent in 2011, partly reflecting the impact of enhanced banking supervision, and some crowding out from a sharp rise in government borrowing from the securities market in 2012. Financial soundness indicators show that banks are generally well capitalized, profitable, and in compliance with prudential regulations. They also point to an increase in nonperforming loans, partly due to the high level of government unpaid bills to the private sector at end-2012 (MEFP ¶ 7).

SIERRA LEONE
INTERNATIONAL MONETARY FUND 9
MEDIUM-TERM FRAMEWORK 10. Reducing poverty and creating employment opportunities through sustained and inclusive growth are two key objectives of the authorities’ medium-term policy framework. Under their new development strategy for 2013–18, the authorities aim to reach these objectives by strengthening the fiscal position, ensuring that economic policies support macroeconomic stability; that structural reforms are put in place to improve the business environment; and that social protection systems are developed for the most vulnerable groups of the population.
11. The medium-term macroeconomic framework underpinning the ECF-supported program being requested by the authorities is consistent with the new PRS. It points to a favorable outlook with sustained growth, low inflation, and improving fiscal and external positions (MEFP ¶ 27–30).
Growth prospects for 2014–18 are dominated by developments in the iron ore sector. Baseline projections show that growth is expected to accelerate at a double-digit rate in the next two years, and decelerate to 7.7 percent in 2016, consistent with the current iron ore production profile (Text Table 2). Growth in the non-iron ore economy would remain robust (above 6 percent), supported by continued strong performance in agriculture. Mining activity is expected to spillover into construction, manufacturing, and services—mainly trade and transport. Staff stressed that continued infrastructure investment, and structural reforms to improve the business environment will be needed to further enhance medium-term growth prospects in the non-mineral economy.
The declining trend in inflation is expected to continue as the authorities are taking action to
improve the fiscal position and maintain a tight monetary policy stance. Measures taken by the
2013 2014 2015 2016 2017 2018
Gross Domestic Product 13.3 14.0 12.4 7.7 5.2 5.3Excluding Iron ore 6.0 6.3 6.6 6.6 7.0 7.0
Agriculture, Forestry and Fishing 4.5 4.8 4.8 5.6 5.6 5.6Agriculture 5.0 5.5 5.5 6.5 6.5 6.5
Industry 53.8 42.2 28.1 9.6 2.3 2.2Mining and Quarrying 71.9 49.2 30.9 9.1 0.6 0.3
Of which Iron ore 90.3 59.0 34.7 11.1 0.0 0.0Manufacturing and Handicrafts 6.0 10.0 10.0 10.0 10.0 10.0Electricity and Water Supply -5.9 13.2 13.3 13.5 13.6 13.7Construction 10.0 15.0 15.0 15.0 15.0 15.0
Services 6.0 6.8 7.8 8.2 8.0 8.2Sources: Sierra Leonean authorities; and Fund staff estimates and projections.
Proj.
Text Table 2. Sierra Leone: National Accounts, Growth by Sectors, 2013–18(Percent change)

SIERRA LEONE
10 INTERNATIONAL MONETARY FUND
authorities in recent years to support agricultural production would also help contain food inflation. The year-on-year inflation rate is forecast to be below 6 percent by 2016.
The external position would improve further in the medium term. The external current account deficit is projected to narrow from 10.5 percent of non-iron ore GDP in 2014 to 7.2 percent in 2016, mostly because of strong export performance; helping improve the reserve coverage to 3.9 months of imports.
12. The economic outlook is subject to downside risks. Domestically, there are uncertainties regarding iron ore production, as the largest mine had a difficult start in 2012, with actual production much lower than anticipated. Key external risk factors include a potential slowdown in global demand for Sierra Leone’s main exports, adverse terms of trade shocks, and a shortfall in projected budget aid. Lower exports as well as higher cost for imported fuel would heighten vulnerabilities for the government budget and for the balance of payments. Similarly, a shortfall in budget aid would hinder budget execution and may lead to excessive borrowing from the securities market (Table 11—Risk Assessment Matrix).
POLICY DISCUSSIONS 13. Policy discussions focused on: improving the fiscal position, reducing inflation to single-digits, maintaining prudent borrowing policies, promoting private sector development, and supporting growth inclusiveness.
A. Fiscal Policy and Reforms
14. The authorities’ medium-term fiscal strategy aims to improve the fiscal position to support macroeconomic stability and long-term debt sustainability (MEFP ¶ 31–37). To this effect, the authorities plan to:
Strengthen revenue mobilization. Key measures include: (i) improve IT systems at the NRA to increase auditing capacity and enhance monitor for compliance with tax obligations; (ii) set up a specialized unit for taxation of extractive industries; (iii) implement the small-taxpayer regime; and (iv) review and rationalize the tax exemption system.
Enhance natural resource revenue management. The authorities have prepared, with support from the IMF Fiscal Affairs Department (FAD) TA, a new fiscal regime for the resource sector (Extractive Industries Revenue Imposition Act) that will be introduced in parliament before the end of the year. The new regime would bring under one legal instrument tax and non-tax rules for the extractive industries, and introduce a resource rent tax levied against windfall profits.
Restrain expenditure and improve spending commitment controls. After several years of expenditure overruns, the authorities are taking steps to restore fiscal discipline and tighten expenditure commitment controls. They are preparing a medium-term expenditure framework (MTEF) incorporating a three-year rolling public investment program starting in 2014, to guide the implementation of the new PRS. Infrastructure investment and other pro-poor spending will

SIERRA LEONE
INTERNATIONAL MONETARY FUND 11
remain important priorities, while growth in spending in goods and services, as well as wages and salaries will decelerate in the medium term. In particular, the implementation of the pay reform plan will be better controlled with improved forecasting capacity for the wage bill, resulting in an average increase of 16 percent for wages and salaries during 2013–16, well below the 26 percent rise in 2011–12. Staff stressed that continued expenditure restraint is warranted because of the low revenue base and continued financing constraints.
Reduce domestic debt. Following a significant build-up in domestic debt in recent years, partly to finance infrastructure projects, the medium-term fiscal strategy anticipates a decline in the stock of domestic debt over time, and a lengthening of maturity starting in 2013, in line with the Medium-Term Debt Management Strategy. On this basis, interests on domestic debt are projected to decline from 1.7 percent of non-iron ore GDP in 2012 to 1.4 percent in 2016.
Accelerate PFM reforms. The authorities agreed with staff that addressing weaknesses in budget processes and expenditure management was critically important for the programmed fiscal objectives. They have prepared a medium-term PFM reform strategy to be adopted by Cabinet in the coming weeks, focusing on budget comprehensiveness and credibility, accountability, and revenue mobilization (Box 3). Staff encouraged the authorities to prepare an action plan for the implementation of the strategy, and stressed that actions taken in 2012 to enhance coordination between fiscal and monetary policies through the operations of the Cash Management Committee have been productive and should be enhanced further with the participation of all stakeholders.
15. The authorities expect that implementation of the measures presented above will improve the fiscal position over the medium term. Revenue is projected to increase from 12.4 percent of non-iron ore GDP in 2014 to almost 13.4 percent in 2016, while expenditure would stabilize around 20.5 percent of non-iron ore GDP during the same period, with an increase in pro-poor and capital spending. Hence, after an initial increase to 2.3 percent of non-iron ore GDP in 2014 on account of a pick-up in domestically financed investment, the domestic primary deficit would narrow to 1.9 percent of non-iron ore GDP by 2016 (Figure 6). Building on recommendations from FAD TA, the authorities are preparing a PFM bill for the adoption of a fiscal rule based on a non-resource fiscal balance (MEFP ¶ 38). Staff noted that progress in this area will help the authorities prepare for the advent of increased revenue from iron ore in the medium to long term.
16. The revised 2013 budget approved by parliament in July calls for a significant tightening of fiscal policy. The domestic primary deficit is projected to drop from 3.8 percent of non-iron ore GDP in 2012 to 1.8 percent (see Table 2b). Although revenue collection efforts will be intensified, total revenue would increase only marginally. Hence, the anticipated fiscal consolidation efforts rest on expenditure restraint. Current expenditure and domestically financed investment combined are projected to decline by almost 2 percentage points of non-iron ore GDP compared with 2012, reflecting the unwinding of one-off election-related outlays, and the authorities’ decision to limit domestically financed investment to ongoing projects.
17. The 2013 fiscal program is fully financed, and financing prospects for the remainder of the program period are positive. The main financing sources are: external budget aid, bonds and

SIERRA LEONE
12 INTERNATIONAL MONETARY FUND
T-bills issuance in the securities market, and statutory overdraft facility at BoSL, which is limited at 5 percent of previous year’s government revenue. Fiscal policy would be anchored by a level of bank and nonbank financing not exceeding 2 percent of non-iron ore GDP, with the aim of achieving a reduction in the ratio of domestic debt to non-iron ore GDP over the medium term. Staff stressed that achieving the 2013 fiscal targets would require that fiscal discipline be restored to avoid any accumulation of unpaid bills in 2013, and enhance fiscal policy credibility. In this context, there was an agreement that domestically financed investment be scaled back in the event of revenue shortfall, or if expected donor support should be lower than the expected 1.8 percent of non-iron ore GDP (MEFP ¶ 33).
18. The authorities stressed that restoring fiscal discipline is their most important goal for 2013. While agreeing with staff that there are important challenges for fiscal policy implementation, they indicated that measures taken in early 2013, including enhanced review of spending in line ministries, improved monitoring of NRA revenue transit accounts in commercial banks, and a better follow up on collection of taxes on petroleum products would support the attainment of programmed fiscal objectives. The authorities indicated that to avoid over spending, they have decided to limit investment projects execution in 2013 to ongoing projects initiated in 2012, and to complete all expenditure commitments earlier than in previous years (MEFP ¶ 36).

SIERRA LEONE
INTERNATIONAL MONETARY FUND 13
Box 3. Sierra Leone: Public Financial Management Reform Strategy for 2014–17
The authorities’ medium term strategy to advance Public Financial Management (PFM) reforms focuses on budget planning, comprehensiveness and credibility (including at the local level), financial accountability, service delivery and oversight, and revenue mobilization. The strategy stresses that enhanced revenue mobilization and effective investment spending controls are essential for the efficient implementation of the new PRS. Key structural measures under the strategy, some of which are part of structural reforms under the economic program for 2013–14 are presented below.
A new PFM Bill. Submit to parliament the new PFM Bill that includes amendments and clarifications on supplementary budgets and contingency funds.
Extend the use of IFMIS. Set up an Integrated Financial Management Information System (IFMIS) performance budgeting module to ensure that all fiscal operations and public accounts are covered under IFMIS and implement IFMIS functionality for all expenditure commitment and control; activate commitment accounting under IFMIS as part of a comprehensive plan to improve forecasting and procedures for budget adjustments within the year; and complete the roll-out of IFMIS to all major spending line ministries. These measures would facilitate timely and high-quality fiscal accounting, reporting, and audits.
Build administrative capacity. Expand revenue and expenditure forecasting capacity at all levels.
Enhance cash management. Establish a Treasury Single Account (TSA), and streamline NRA’s transition accounts held in deposit money banks (DMBs) for revenue collection. In this context, the National Revenue Authority (NRA) signed a memorandum of understanding with DMBs setting up time limit for the transfer of collected revenue to the Treasury’s account at the Bank of Sierra Leone.
Improve capital spending management. Complete a three-year Public Investment Plan (PIP), fully integrated with the budget process and the revised Medium Term Expenditure Framework for 2015–18, and set up a PIP unit at the Ministry of Finance and Economic Development (MoFED).
Strengthen public procurement. Adopt the New Public Procurement Act, harmonized with the Procurement Manual, and establish a Directorate for procurement at the MoFED.
Adopt a new tax regime for the mining sector. Submit to parliament the Extractive Industries Revenue Bill; including a resource rent tax and a resource revenue administration unit at NRA.

SIERRA LEONE
14 INTERNATIONAL MONETARY FUND
B. Monetary Policy and Financial Sector Issues
19. Monetary policy should continue to support a decline in inflation. In the first half of 2013, the Monetary Policy Committee (MPC) reduced the monetary policy rate (MPR) twice, to realign it with lower interest rates in the government securities market. Although price pressures eased further during the same period, staff took the view that BoSL should maintain a tight monetary policy stance through the use of the MPR to contain liquidity in line with the programmed single-digit inflation target for 2013. Hence, the MPC should stand ready to raise the MPR to mop up excess liquidity should inflationary pressures reemerge. The BoSL will continue to develop its monetary policy tools and liquidity forecasting capacity to be more active in the money market and use repo instruments to achieve liquidity targets, while contributing to the development of the securities market. Staff stressed that continued information sharing between the BoSL and the Ministry of Finance remains critically important, notably for liquidity forecasting purposes (MEFP ¶ 39–40).
20. The BoSL concurred with staff that although trending down, inflation remained elevated. Therefore, easing monetary policy conditions would not be appropriate. In this regard, the BoSL noted that the MPR had started to be an efficient signaling tool for monetary policy stance. It also noted that the recent conversion of non-marketable and non-interest bearing securities into marketable instruments had strengthened its ability to mop up liquidity, should the need arise. The BoSL indicated that supply shocks play an important role in price pressures. Therefore, prospects for good harvests in 2013 would help in reducing food inflation further. BoSL reaffirmed commitment to complying with the statutory limit on budget financing by the central bank to 5 percent of the previous year’s revenue.
21. Sierra Leone’s financial sector has expanded significantly in recent years, but it remains relatively small (Annex II). It comprises deposit money banks, insurance companies, a pension fund, and a stock exchange. Banks represent over 80 percent of the financial system, with the two largest ones accounting for 38 percent of assets and about 46.5 percent of credit to the economy. The number of banks increased from 8 in 2006 to 13 in 2012, and their networks have also expanded.
22. Despite the fast growth in the banking system, access to financial services remains limited (Figure 7). Financial intermediation has grown steadily since the end of the civil conflict. However, it is building from a low base, and the financial sector development lags peer countries. World Bank data indicates that there are roughly three bank branches per 100,000 persons; only 19 percent of the population holds a bank account; and only 1 percent of the population holds a loan from the banking system. Key factors hindering access to financial services include: lack of sound collateral, weaknesses in the legal system, the low level of household income, and the short term nature of banks’ liabilities.
23. Financial soundness indicators suggest that the banking sector is generally well capitalized and liquid, with limited vulnerabilities. Capital adequacy ratios are generally well above the statutory limit for most banks. Credit quality has improved as NPLs halved since 2007, but their level remains elevated at 14.7 percent at end-2012 (see Table 9). Banks’ income has increased

SIERRA LEONE
INTERNATIONAL MONETARY FUND 15
in recent years, although it is increasingly dependent on the spread between deposits and government securities. Liquidity ratios are generally high as private sector lending remains limited.
24. BoSL has made good progress toward building supervisory capacity and putting in place the necessary components of a modern financial system. A Financial Sector Development Plan was adopted in 2009 and is being implemented; the BoSL and Banking Acts have been revised to strengthen compliance with the aim of eventually adopting Basel Core Principles; prudential bank guidelines have been drafted; a benchmark policy rate has been introduced to improve monetary policy signaling; and a credit reference bureau was established in 2011. While welcoming these improvements, staff encouraged BoSL to continue building on TA recommendations to address remaining gaps in banking supervision, monetary and foreign exchange operations, and administrative capacity.
25. BoSL continues to give a special emphasis on access to finance. It is actively supporting initiatives to encourage the development of microfinance in rural areas and credit facilities for small- and medium-sized enterprises, with support from donors. It is also developing a financial literacy campaign.
C. Supporting Long-Term Debt Sustainability
26. The updated Debt Sustainability Analysis (DSA) indicates that Sierra Leone remains at a moderate risk of debt distress (Figure 8).1 Under the baseline scenario, all debt indicators are expected to remain below their policy-dependent indicative thresholds during the projection period (2013–33). However, stress tests point to vulnerability to adverse shocks affecting key macroeconomic indicators. Staff reiterated that to contain the risk of debt distress and support long-term debt sustainability, it was critical for the authorities to: (i) maintain prudent borrowing policies, seeking mainly grants and concessional loans; (ii) sustain fiscal consolidation efforts; (iii) continue implementation of growth-enhancing structural reforms; and (iv) promote economic diversification.
27. Staff also called for strengthened debt management capacity. It welcomed progress in the preparation of the Medium-Term Debt Strategy (MTDS), scheduled for Cabinet adoption by end-December 2013 (MEFP ¶ 45, 46). Staff stressed that improving debt management capacity is increasingly critical in light of the country’s access to nonconcessional borrowing (see below).
28. The proposed ECF-supported program provides for non concessional borrowing (NCB). The projected stock of external debt under the DSA includes US$30 million (0.6 percent of GDP), per year, during the program period, that could be contracted on nonconcessional terms. Staff stressed that borrowing on nonconcessional terms should be considered after ensuring that: (i) all avenues for mobilizing concessional financing have been exhausted; (ii) the new nonconcessional borrowing should not increase Sierra Leone’s risk of debt distress; and (iii) the selected projects are 1 The last Debt Sustainability Analysis produced jointly by the IMF and World Bank staffs was presented to the Board in September 2012 (IMF Country Report No. 12/115).

SIERRA LEONE
16 INTERNATIONAL MONETARY FUND
integrated in a three-year public investment program aligned with the new PRS, and assessed by a reputable third party as being economically viable. For the first program year (2013–14), the NCB would cover the construction of two mini hydroelectric dams in rural areas (MEFP ¶ 45).
29. Staff advised the authorities to ensure that projects assessed as economically viable should be financed to the maximum extent possible through concessional resources. It insisted that prior to contracting external loans, associated projects should be included in the rolling three-year Public Investment Plan, well prioritized to take into account financing constraints, and assessed as economically and financially viable. On the specific case of the new airport project (See below ¶ 38), staff advised that the authorities carry out a feasibility study, with support from the World Bank, and assess the project’s macroeconomic impact. Staff also recommended that the authorities evaluate financing options and seek to secure concessional financing for the airport. The authorities agreed to provide staff with available documentation on the airport and other large infrastructure projects under consideration, to inform staff analysis on their macroeconomic impact.
30. The authorities appreciated the added flexibility on external borrowing terms. They stressed that increased difficulty in obtaining improvement in proposed loan terms to meet the 35 percent concessionality threshold for external borrowing specified in the program hampered the implementation of some economically viable and socially important projects, and partially led to increased borrowing in the securities market in the last few years. They agreed with staff, however, that in view of the economy’s vulnerability to terms of trade and other exogenous shocks, and the narrow export base, they will continue to seek mainly grants and concessional loans, and limit nonconcessional borrowing to economically viable projects for which softer loan terms could not be secured.
D. Enhancing Competitiveness and External Stability
31. Sierra Leone’s exchange rate system is classified as floating, with the value of the leone determined by the market. The central bank’s interventions are limited and aimed at smoothing volatility in the market. Building on TA recommendations from MCM, Staff urged BoSL to introduce a wholesale foreign exchange auction system to replace the current retail auction system available to some importers. The new system will be introduced in mid-2014 (MEFP ¶ 41). The authorities are working on an amendment to the Foreign Exchange Act, which aims to update existing legislation, building on TA recommendations from IMF staff.
32. Staff estimates that Sierra Leone’s real effective exchange rate (REER) is broadly in line with macroeconomic fundamentals. While the nominal effective exchange rate was relatively stable during 2010–12, the REER appreciated by about 9 percent reflecting inflation differential with Sierra Leone’s major trading partners. Results from the standard Consultative Group on Exchange Rate (CGER) methodologies suggest that there was no significant misalignment. The external sustainability approach points to 3.5 percent overvaluation, while the macroeconomic balance and the equilibrium exchange rate approaches indicate an undervaluation in the range of 4–6 percent (Annex I).

SIERRA LEONE
INTERNATIONAL MONETARY FUND 17
33. Increasing reserve coverage should remain a priority for the medium term, in light of Sierra Leone’s vulnerability to shocks. At end-2012, international reserves stood at 3.1 months of imports,2 lower than the average for SSA countries under ECF-supported programs. Staff analysis indicates that an optimal level of reserve coverage for Sierra Leone would be in the 3–6 months of imports range, taking into account that Sierra Leone is a small open-economy susceptible to external shocks (See Annex I). However, staff argued that given the country’s large need for infrastructure investment, the opportunity cost of holding reserves is relatively high for Sierra Leone, supporting a target level of reserves closer to 4 months of prospective imports.
34. Important structural factors continue to hinder competitiveness despite some progress in recent years. Sierra Leone improved its position on the Ease of Doing Business indicators, and its ranking in 2013 advanced by ten places (Figure 9). However, further structural reforms are needed to address key structural factors contributing to high transactions costs in Sierra Leone, including inadequate infrastructure, limited availability of skilled labor force, insufficient energy supply and high transportation and communication costs. Therefore, staff welcomed the authorities’ resolve to accelerate structural reforms to address these impediments to private sector development (MEFP ¶ 47). It also encouraged them to strengthen the framework for Anti-Money Laundering and Financing of Terrorism (AML/CFT), notably through the setting up of an independent Financial Intelligence Unit in line with recommendations from the Intergovernmental Action Group against Money Laundering in West Africa.
35. The authorities agreed with staff’s external stability assessment for Sierra Leone. They noted that there was a marginal appreciation of the REER in 2012, but agreed there was no evidence of exchange rate misalignment that could result in future external instability. On reserve adequacy, the BoSL did not see the need for higher international reserve accumulation at this time. They emphasized that a temporary increase in mining-related imports had driven the decline in gross reserves, which will reverse as the mining projects begin to generate foreign exchange inflows. Nonetheless, the authorities are aware of the risk of Dutch disease for Sierra Leone over the medium term, with the expected expansion in the mining sector. Therefore, they have identified economic diversification as one of the key objectives under the new PRS (MEFP ¶ 16–18). They also plan to intensify initiatives aimed at supporting agricultural development, through inputs provision, improved extension services, and skills development through the setting up of new Agricultural Business Centers.
E. Promoting Inclusive Growth
36. The authorities have reviewed policy performance relative to the objectives set out in the previous PRS in preparing key pillars of the new strategy. They recognize that progress in attaining the Millennium Development Goals, particularly in health and education has been sluggish (Figure 10). At the same time, taming unemployment and reducing income inequality continue to feature prominently among the government’s developmental priorities. Hence the new PRS recently
2 Excluding iron ore-related imports that were financed by foreign direct investment.

SIERRA LEONE
18 INTERNATIONAL MONETARY FUND
launched by the government focuses on eight key pillars—(i) economic diversification and inclusive growth; (ii) managing natural resource wealth; (iii) accelerating human development; (iv) improving competitiveness; (v) employment and labor strategy; (vi) social protection; (vii) governance and public sector reform; and (viii) gender and women empowerment (MEFP ¶ 16–26).
37. The authorities recognized the challenges in making progress towards inclusive growth in a stable macroeconomic environment. Under the new PRS, they plan to focus on measures to advance economic diversification, improve access to education and health services, strengthen social protection, empower women, and increase employment opportunities (Annex III).
38. To achieve the economic transformation expected from the new PRS, the authorities plan to implement a number of large-scale projects in agriculture, energy and transportation. The envisaged projects include irrigation and rice production to continue supporting agricultural supply and employment, the construction of hydro electric plants to increase power production by an estimated 475 Mega Watts, and the construction of a new airport in the mainland. The cost of the airport project is estimated at US$312 million (6.6 percent of 2013 GDP); the authorities informed staff that preparatory work to identify financing has already started (MEFP ¶ 21).
39. The authorities concurred with staff’s analysis and policy recommendations on inclusive growth. They explained that addressing infrastructure gaps in energy, telecommunication, and water supply are key priorities for poverty reduction under the new PRS. The authorities view the implementation of the Agenda for Prosperity as the main organizing principle for discussions of medium-term fiscal sustainability. They see the transition to a resource dependent economy as a prerequisite for economic and social progress. However, they expressed concerns about the financing of the new PRS, notably for large-scale infrastructure projects in the energy and transportation sectors.
F. Other Surveillance Issues
40. Data provision quality. Data provision is adequate for surveillance purposes despite shortcomings. There has been some progress in data quality and timeliness in the last few years, partly thanks to technical assistance from the IMF and other donors. Further improvements are needed for balance of payments and international investment position statistics, government finance statistics, and social indicators. In addition, with the advent of iron ore production, it has become urgent to develop adequate statistical tools for the proper accounting of activities in the natural resources sector.
41. Extractive Industries Transparency Initiative (EITI). While some progress has been made in recent years, Sierra Leone has yet to achieve EITI-compliant status. Its candidacy was accepted in February 2008 and renewed in July 2011. It is currently on hold as the authorities are working towards the conclusion of the validation exercise aimed at addressing discrepancies uncovered by successive reconciliation reports.

SIERRA LEONE
INTERNATIONAL MONETARY FUND 19
PROGRAM ISSUES 42. The authorities decided to cancel the ECF arrangement approved by the Board in June 2010, and to request a new IMF-supported program. Following four successful reviews, the authorities believed that key objectives under the program, particularly in the fiscal area, were no longer realistic or achievable. In late May, they informed staff of their decision to request a new medium-term arrangement that would provide a sounder framework for the implementation of needed reforms. They are, therefore, requesting a new ECF arrangement for 2013–16, to consolidate recent progress in macroeconomic stabilization, strengthen the fiscal position and the management of public resources, build external buffers, and advance structural reforms to boost inclusive growth, in line with key objectives under the new PRS.
43. Staff proposes an access level equivalent to 60 percent of quota (SDR 62.22 million). This level is based on the strength of the adjustment under the proposed program, and the country’s vulnerabilities. As a small open economy driven by exports of minerals and dependent on oil and food imports, Sierra Leone is vulnerable to fluctuations in global commodity and food prices, which generate protracted balance of payments needs. Fund disbursements under the proposed program will help cover financing requirements for 2013–16 and improve the reserve coverage from 3.1 months of imports in 2012, to 3.9 months in 2016. It will also play an important catalytic role for much needed donor support for Sierra Leone. Total Fund credit will amount to 103 percent of quota at the end of the proposed program period. Donors have committed to continue supporting reform implementation in Sierra Leone, with a focus on public financial management, tax administration, and management of natural resources. Their financial support is projected at US$264 million for 2013–16 (Tables 9 and 10).
44. Sierra Leone’s capacity to meet its obligations to the Fund is adequate. Debt service to the Fund is projected to increase from 0.4 percent of exports of goods and services in 2014 to 0.6 percent at the end of the arrangement; and from 1.5 percent of gross international reserves to 2.7 percent during the same period (See Table 9). In addition, Sierra Leone has established a good record of timely payment of external debt obligations, including to the Fund. The strong level of donor support combined with Sierra Leone’s favorable medium-term export prospects would also strengthen Sierra Leone’s capacity to discharge its external debt obligations, including to the Fund.
45. Consistent with IMF policy on lending into arrears, Staff has determined that the proposed ECF-supported program will provide an essential support to the implementation of Sierra Leone’s economic and financial program for 2013–16, as discussed above, including for the resolution of arrears to private creditors, accumulated before and during the civil war, totaling US$221 million at end–2012. The government has maintained prudent borrowing policies, and has not accumulated arrears on external debt since the beginning of engagement with the IMF under ECF-supported programs. In addition, it has been making good faith efforts to reach collaborative agreement with its creditors, including goodwill payments to avoid litigation, and working with the World Bank to access the IDA debt-buy-back program. A road map to fast track the process has been agreed upon and preparatory work would be initiated in coming months.

SIERRA LEONE
20 INTERNATIONAL MONETARY FUND
46. Program performance will be assessed through semi-annual reviews. The reviews will be based on macro-critical prior actions for the first year of the program; quantitative performance criteria, indicative targets, and structural benchmarks. For the purpose of these reviews, the program sets quantitative performance criteria for end-December 2013, end-June 2014 and end-December 2014; and indicative targets for end-March and end-September 2014. The first and second reviews will assess program performance at end-December 2013 and end-June 2014 respectively, and the third review will cover performance at end-December 2014. To set fiscal policy implementation on a sound footing and prevent the reoccurrence of slippages, the program sets two prior actions: (i) the submission to parliament of a supplementary budget consistent with program objectives; and (ii) the preparation of a budget execution report on capital expenditure at end-June 2013. This, combined with other programmed PFM measures aimed at controlling spending commitments, would help the authorities ensure that capital expenditure execution is consistent with budgetary appropriations.
47. An update safeguards assessment of the BoSL will be carried out by the first ECF review. The latest safeguards assessment was completed on November 24, 2010. It concluded that the BoSL continues to maintain important elements of the safeguards framework. Since the assessment, BoSL has been addressing identified weaknesses in internal audit through training and recruitment.
48. Program implementation is subject to downside risks. Key risks to the economic outlook discussed in paragraph 12 above would also adversely affect program performance if they materialize. In addition, the authorities’ ability to restore fiscal discipline and break away from past practices in budget execution will be critically important for the achievement of programmed fiscal targets.
49. Policy coordination needs further improvement. The close monitoring of fiscal operations under the Cash Management Committee has been instrumental in addressing past fiscal slippages and improving coordination between fiscal and monetary policy. Staff urged the authorities to enhance policy coordination further through capacity building initiatives, including training, further TA, and enhanced information sharing among government agencies. The successful implementation of the program would also depend on progress in this area.
STAFF APPRAISAL 50. Sierra Leone achieved strong macroeconomic gains in the last decade. Agriculture, construction, services, and iron ore more recently, have been the main contributors to sustained economic growth. Large-scale FDI inflows in the mining sector added a temporary growth surge in construction and other services; while the scaling-up of infrastructure investment in the last three years supported economic activity in the non-mining economy. The medium-term outlook is positive with continued strong growth, declining inflation and robust external position.
51. Staff urges the authorities to strengthen fiscal discipline. Staff welcomes the authorities’ efforts to boost revenue mobilization and create fiscal space for priority spending, and encourages them to increase efficiency in revenue collecting agencies through administrative measures, and to broaden the tax base to reach the revenue targets. Staff urges the authorities to strengthen budget execution procedures, particularly for the monitoring of spending commitments and for the

SIERRA LEONE
INTERNATIONAL MONETARY FUND 21
management of capital expenditure, in the context of their medium-term PFM reform strategy. Staff believes that PFM reforms planned for 2014–17 are appropriately ambitious given existing administrative capacity constraints. It stresses the need for an efficient and timely implementation of envisioned reforms to enhance fiscal policy credibility and support macroeconomic stability.
52. Staff believes that a continued tight monetary policy stance is needed to lower inflation expectations further. The trend decline in inflation since mid-2011 is starting to form inflation expectations and should be supported by continued tight monetary policy to support the single-digit inflation target. Staff encourages the BoSL to continue its ongoing efforts to improve liquidity forecasting and enhance monetary operations.
53. The debt sustainability analysis (DSA) shows that the risk of debt distress remains moderate. All debt indicators remain below the policy-dependent thresholds under the baseline scenario. The debt outlook is, however, vulnerable to shocks affecting revenue and export, as well as unfavorable borrowing conditions. The DSA also indicates that limited external borrowing on nonconcessional terms for priority investment in infrastructure is consistent with the medium- to long-term debt sustainability. However, staff recommends that the authorities continue to cover financing needs mostly with grants and concessional loans, particularly for large-scale infrastructure projects under the new PRS (Agenda for Prosperity). Staff urges the authorities to ensure that before proceeding with such projects, they are well prioritized, assessed as economically viable, and consistent with external debt sustainability.
54. Staff supports the authorities request for a three-year arrangement under the ECF, with access level of 60 percent of quota. The new program will help the authorities enhance macroeconomic stability and growth prospects. The program is appropriately ambitious, particularly in the fiscal area. This, combined with Sierra Leone’s balance of payments needs and its adequate capacity to discharge external debt obligations, justifies the proposed access level.
55. Staff recommends that the next Article IV consultation with Sierra Leone takes place in accordance with the 2010 Decision on consultation cycles for program countries.

SIERRA LEONE
22 INTERNATIONAL MONETARY FUND
Figure 1. Sierra Leone: Development Indicators
05
101520253035404550
LIC (Non-Fragile) LIC (Fragile) Sierra Leone
Power Outages(Days per year, 2011)
Source: Government of Sierra Leone, Millennium Challenge Corporation
0
5
10
15
20
25
30
35
LIC (Non-Fragile) LIC (Fragile) Sierra Leone
Access to Electricity(Percentage of Population, 2011)
Sources: Government of Sierra Leone, Millennium Challenge Corporation
0 20 40 60 80 100
Sierra Leone
LIC Average
Liberia
Côte d'Ivoire
Access to an Improved Water Source(Percentage of Population, 2010)
Sources: World Bank Development Indicators0 5 10 15 20 25 30
Sierra Leone
Liberia
Côte d'Ivoire
LIC Average
Access to Improved Sanitation Facilities(Percentage of Population, 2010)
Sources: World Bank Development Indicators
2.42.52.62.82.93.13.2
3.43.94.1
4.55.0
0 1 2 3 4 5 6
MozambiqueMadagascarBurkina FasoSierra Leone
UgandaBenin
TanzaniaMalawi
KenyaEthiopia
Gambia, TheRwanda
Quality of Roads(Higher number corresponds to a better score)
Sources: World Economic Forum Global Competitiveness Report, 2013
LICs = 3.4
2.12.12.22.22.32.32.4
2.62.6
3.13.2
3.6
0 1 2 3 4
Sierra LeoneMadagascarBurkina Faso
MalawiUganda
TanzaniaMozambique
BeninEthiopia
KenyaRwanda
Gambia, The
Overall Infrastructure Score(Higher number corresponds to a better score)
Sources: World Economic Forum Global Competitiveness Report, 2013
LICs = 2.6
Key development indicators, including supply of electricity, access to water and sanitation, and quality of infrastructure, remain weak while trailing behind regional averages.

SIERRA LEONE
INTERNATIONAL MONETARY FUND 23
0
2
4
6
8
10
12
14
16Real GDP Growth
Non-Iron Ore Real GDP Growth
Gross Domestic Product Growth(Percent)
-15
-10
-5
0
5
10
15
20
25Total Revenue Total Expenditure Overall balance
Fiscal Position(Percentage of non-iron ore GDP)
0 1 2 3 4 5
20072008200920102011201220132014201520162017
Foreign Currency Reserves(In months of imports)
02468
101214161820
Growth in consumer price index, 1992=100 (12-month, eop)
Inflation(Percent)
0123456789
Credit to the Private Sector(Percentage of non-iron ore GDP)
0
5
10
15
20
25
30
35External debt Domestic debt
Debt Profile(Percentage of non-iron ore GDP)
Source: IMF staff calculations.
Figure 2. Sierra Leone: Recent Economic Developments andMedium-Term Outlook, 2007–17

SIERRA LEONE
24 INTERNATIONAL MONETARY FUND
0
1
2
3
4
5
6
7
8
9
10
2008 2009 2010 2011 2012
Sierra Leone SSA
Real non-iron ore GDP Growth (Percent)
-2500
-2000
-1500
-1000
-500
0
500
1000
1500
2000
2500
3000
2008 2009 2010 2011 2012
Trade balance
Exports of goods
Imports of goods
Trade Balance(MIllions of U.S. dollars)
2900
3100
3300
3500
3700
3900
4100
4300
4500
Jun
20
08
Se
p 2
00
8D
ec
20
08
Ma
r 2
00
9Ju
n 2
00
9S
ep
20
09
De
c 2
00
9M
ar
20
10
Jun
20
10
Se
p 2
01
0D
ec
20
10
Ma
r 2
011
Jun
20
11S
ep
20
11D
ec
20
11M
ar
20
12
Jun
20
12
Se
p 2
01
2D
ec
20
12
Ma
r 2
01
3Ju
n 2
01
3
Leones/US$,Jan. 2008-Jun. 2013('000 of Leones)
Growth has remained robust through global headwinds.
The trade balance widened in 2010–12 due to FDI-related imports.
The nominal exchange rate was stable in 2012–June 2013
-5
0
5
10
15
20
25
30
35
Jun
20
08
Se
p 2
00
8D
ec
20
08
Ma
r 2
00
9Ju
n 2
00
9S
ep
20
09
De
c 2
00
9M
ar
20
10
Jun
20
10
Se
p 2
01
0D
ec
20
10
Ma
r 2
011
Jun
20
11S
ep
20
11D
ec
20
11M
ar
20
12
Jun
20
12
Se
p 2
01
2D
ec
20
12
Ma
r 2
01
3Ju
n 2
01
3
Overall CPIFood CPINon Food CPI
Inflation, Jun. 2008-Jun. 2013(Year-on-year percent change)
Inflation has trended down since 2011, given the tight monetary policy stance.
0
50
100
150
200
250
300
350
400
450
2008 2009 2010 2011 2012
Gross Official Reserves(Millions of U.S. dollars)
Reserve coverage improved aided by FDI inflows.
60
80
100
120
140
160
180
200
De
c 2
00
8
Ap
r 20
09
Au
g 2
00
9
De
c 2
00
9
Ap
r 20
10
Au
g 2
01
0
De
c 2
01
0
Ap
r 20
11
Au
g 2
011
De
c 2
011
Ap
r 20
12
Au
g 2
01
2
De
c 2
01
2
Ap
r 20
13
NEER
REER
… and the real effective exchange rate appreciated.
Nominal and Real Effective Exchange RatesDec. 2008-Dec. 2012(Index 2005=100)
Sources: Sierra Leonean authorities; and IMF staff estimates and projections.
Figure 3. Sierra Leone: Real and External Sectors, 2008–June 2013

SIERRA LEONE
INTERNATIONAL MONETARY FUND 25
-12
-10
-8
-6
-4
-2
0
0
5
10
15
20
25
30
2008 2009 2010 2011 2012
Total Revenue
Total expenditure and lending minus repaymentsOverall fiscal balance, excl. grants (right scale)
0
5
10
15
20
25
2008 2009 2010 2011 2012
Current Expenditure
Capital Expenditure
0
2
4
6
8
10
12
14
16
2008 2009 2010 2011 2012
Taxes on income, profits, and capital gains
Domestic taxes on goods and services
Customs and other import duties
Other taxes (royalties, licenses)
y p y
0 10 20 30 40 50
Congo, Rep. of
Ethiopia
Sierra Leone
Uganda
Burundi
Burkina Faso
CIV
Mauritius
Guinea
Senegal
Mozambique
Liberia
Botswana
Kenya
South Africa
Namibia
Angola
Figure 4. Sierra Leone: Fiscal Sector, 2008–12(Percent of Non-Iron Ore GDP)
Sources: Sierra Leonean authorities; and staff estimates and projections.
…as total spending increased.
SSA - Selected Tax Revenue, 2012(Percent of GDP)
The fiscal deficit has remained relatively stable since 2010...
...and revenue collection strengthened......although tax revenue remains low by regional standards.

SIERRA LEONE
26 INTERNATIONAL MONETARY FUND
Figure 5. Sierra Leone: Monetary and Financial Sector Indicators, 2008–13
-10
0
10
20
30
40
50
Jun
20
08
Se
p 2
00
8D
ec
20
08
Ma
r 2
00
9Ju
n 2
00
9S
ep
20
09
De
c 2
00
9M
ar
20
10
Jun
20
10
Se
p 2
01
0D
ec
20
10
Ma
r 2
011
Jun
20
11S
ep
20
11D
ec
20
11M
ar
20
12
Jun
20
12
Se
p 2
01
2D
ec
20
12
Ma
r 2
01
3Ju
n 2
01
3
Broad Money Liabilities (M3)
Monetary Base
Money growth accelerated in the secondhalf of 2012...
Broad Money and Reserves Money, (Year-on-year percent changes)
-40
-20
0
20
40
60
80
100
Jun
20
08
Se
p 2
00
8D
ec 2
00
8M
ar
200
9Ju
n 2
00
9S
ep
20
09
Dec
20
09
Ma
r 2
010
Jun
20
10
Se
p 2
01
0D
ec 2
01
0M
ar
20
11Ju
n 2
011
Se
p 2
011
De
c 2
011
Ma
r 2
012
Jun
20
12
Se
p 2
01
2D
ec 2
01
2M
ar
201
3Ju
n 2
01
3
...partly reflecting rising government securities issuance.
Commercial Bank Claims on government (Year-on-year percent changes)
0
5
10
15
20
25
30
35
40
200
8
200
9
201
0
201
1
201
2
Sierra Leone
Sub-saharan African LICs
Non-performing loans remain elevatedby regional standards.
Nonperforming loans to gross loans
Sources: Sierra Leonean authorities; and IMF staff estimates and projections.
0 10 20 30 40 50
ChadEquatorial Guinea
Sierra LeoneEthiopiaGuinea
RwandaMalawi
NigerGhana
Burkina FasoGambia, TheCôte d'Ivoire
LiberiaSwaziland
AngolaMozambique
SenegalKenya
Selected SSA PrivateSector Credit, 2012(Percent of GDP)
... but financial intermediation remains low.
Agric, Forestry &
Fishing7%
Mining & Quarrying
2%
Manufac-turing14%
Construction18%
Electricity,Gas & Water
1%Commerce & Finance
30%
Trans., Storage & Communi-
cation9%
Transportand
communi-cations
10%
Miscellaneous2%
Sectoral Distribution of Credit (Percent, year-end 2012)
0
5
10
15
20
25
30
2008 2009 2010 2011 2012
Deposits
Credit to Private Sector
Deposits and Credit to Private Sector(Percent of non-iron ore GDP)
Deposits have been increasing...
Trade, services,and construction have the largest share of private credit.

SIERRA LEONE
INTERNATIONAL MONETARY FUND 27
Figure 6. Sierra Leone: Medium-Term Fiscal Outlook, 2013–18(In Percentage of Non-Iron Ore GDP, Unless Otherwise Indicated)
Source: IMF Staff Calculations
-2.5
-2
-1.5
-1
-0.5
0
2013 2014 2015 2016 2017 2018
Domestic Primary Balance
0
5
10
15
20
25
30
35
2013 2014 2015 2016 2017 2018
Sierra LeoneCôte d'IvoireLiberiaLICs Average
Revenue Performance(Excluding grants)
0
1000
2000
3000
4000
5000
6000
7000
8000
2013 2014 2015 2016 2017 2018
Capital expenditure
Current expenditure
Expenditure Composition(In Billions of Leones)
0
2
4
6
8
10
12
2013 2014 2015 2016 2017 2018
Sierra Leone Côte d'Ivoire
Liberia LIC Average
Public Expenditure on Wages
0
10
20
30
40
50
60
70
80
90
2013 2014 2015 2016 2017 2018
Loans GrantsBudget Support(In Millions of USD)
0
0.5
1
1.5
2
2.5
3
3.5
4
2013 2014 2015 2016 2017 2018
Domestically Financed Investment

SIERRA LEONE
28 INTERNATIONAL MONETARY FUND
Figure 7. Sierra Leone: Selected Indicators on Financial Sector Depth and Inclusiveness
Broad money has grown relative to GDP…
…but transformation remains low…
Continued development should be encouraged by expanding networks…
… with a growing deposit base…
... and the role of credit in the economy is small.
… and more widespread use of bank accounts.
Sources: Regional Economic Outlook, World Development Indicators, and IMF staff estimates 1 Regional data for 2012 was unavailable at the time of publication.
0
10
20
30
40
50
60
2004 2005 2006 2007 2008 2009 2010 2011 2012
perc
ent o
f GD
P
Broad money
Sierra Leone Fragile Countries Sub-saharan Africa
0
20
40
60
80
2004 2005 2006 2007 2008 2009 2010 2011 2012perc
ent o
f bro
ad m
oney
(M
3)
Claims on Nonfinancial Private Sector
Sierra Leone Fragile Countries Sub-saharan Africa
0
1
2
3
4
5
2004 2005 2006 2007 2008 2009 2010 2011
Number of branches per 100,000 adults
Sierra LeoneSub-saharn Africa (developing only)Low income countries
0
10
20
30
2000
2001
2002
2003
2004
2005
2006
2007
2008
2009
2010
2011
2012
perc
ent
Deposits to GDP1
Sierra Leone
Low income countries
Sub-saharan Africa (developing only)
0
20
40
60
1984
1986
1988
1990
1992
1994
1996
1998
2000
2002
2004
2006
2008
2010
2012
perc
ent o
f GD
P
Private sector credit
Sierra Leone
Low income countries
Sub-saharan Africa (developing only)
0
50
100
150
200
2004 2005 2006 2007 2008 2009 2010 2011
Bank accounts per 1000 adults
Sierra Leone
Low income countries
Sub-sharan Africa (developing only)

SIERRA LEONE
INTERNATIONAL MONETARY FUND 29
Sources: Country authorities; and staff estimates and projections.1/ The most extreme stress test is the test that yields the highest ratio in 2023. In figure b. it corresponds to a Exports shock; in c. to a Exports shock; in d. to a Exports shock; in e. to a Exports shock and in figure f. to a One-time depreciation shock
0
5
10
15
20
25
2013 2018 2023 2028 2033
Baseline Historical scenario Most extreme shock 1/ Threshold
f.Debt service-to-revenue ratio
46
47
48
49
50
51
52
53
0.00.51.01.52.02.53.03.54.04.55.0
2013 2018 2023 2028 2033Rate of Debt Accumulation
Grant-equivalent financing (% of GDP)
Grant element of new borrowing (% right scale)
a. Debt Accumulation
0
5
10
15
20
25
30
35
40
45
2013 2018 2023 2028 2033
b.PV of debt-to GDP ratio
0
20
40
60
80
100
120
140
160
2013 2018 2023 2028 2033
c.PV of debt-to-exports ratio
0
50
100
150
200
250
300
2013 2018 2023 2028 2033
d.PV of debt-to-revenue ratio
0
5
10
15
20
25
2013 2018 2023 2028 2033
e.Debt service-to-exports ratio
Figure 8. Sierra Leone: Indicators of Public and Publicly Guaranteed ExternalDebt under Alternative Scenarios, 2013–331

Figure 9. Sierra Leone: Business Environment Indicators1
0 50 100 150 200
Côte d'Ivoire
Niger
Malawi
Sierra Leone
Mozambique
Tanzania
Uganda
Rwanda
LICs: Ease of Doing Business, 2013(Lower number corresponds to a higher ranking)
Source: World Bank Ease of Doing Business Indicators, 2013
LICs Average = 139
0
0 .1
0 .2
0 .3
0 .4
0 .5
0 .6
0 .7
0 .8
0 .9
Starting a Business (69)Dealing with
Construction Permits (171)
Getting Electricity (176)
Registering Property (170)
Getting Credit (127)
Protecting Investors (29)
Paying Taxes (110)
Trading Across Borders (132)
Enforcing Contracts (145)
Resolving Insolvency (157)
LIC Average
Sierra Leone
Sierra Leone: Ease of Doing Business Indicators, 2013(Figures in brackets represent the rank of Sierra Leone)
Source: World Bank Ease of Doing Business Indicators, 2013
00.5
11.5
22.5
33.5
44.5
5
Macroeconomic management rating
Business regulatory environment ratingLICs: CPIA, 2012(1=low to 6=high)
Source: World Bank Country Policy and Institutional Assessment (CPIA), 20120 10 20 30 40 50 60
Rwanda
Burkina Faso
Benin
Gambia
Niger
Mozambique
Côte d´Ivoire
Kenya
LICs: Corruption Perception Index, 2012(Smaller number represents lower perceived corruption level)
LICs Average = 34.5
Source: Transparency International, Corruption Perception Index, 2012
1 As pointed out in an independent evaluation of the Doing Business survey (see www.worldbank.org/ieg/doingbusiness), care shouldbe exercised when interpreting these indicators given subjective interpretation, limited coverage of business constraints, and a small number of informants which tend to overstate the indicators' coverage and explanatory power.
SIERRA LEON
E
30 INTERN
ATION
AL MO
NETARY FU
ND

SIERRA LEONE
INTERNATIONAL MONETARY FUND 31
Figure 10. Sierra Leone: Progress Towards the MDGs, 1990–2015

SIERRA LEONE
32 INTERNATIONAL MONETARY FUND
Table 1. Sierra Leone: Selected Economic Indicators, 2010–18
2010 2011 2014 2015 2016 2017 2018Prel.
National account and pricesGDP at constant prices 5.3 6.0 15.2 13.3 14.0 12.4 7.7 5.2 5.3
Excluding Iron ore 5.3 5.8 5.3 6.0 6.3 6.6 6.6 7.0 7.0GDP deflator 17.2 17.3 12.1 9.1 6.5 5.9 5.1 4.9 4.7
Excluding Iron ore 17.2 17.3 14.3 8.8 10.6 9.5 6.7 4.8 4.5Consumer prices (end-of-period) 18.4 16.9 12.0 9.0 7.5 6.0 5.4 5.4 5.4Consumer prices (average) 17.8 18.5 13.8 10.3 7.7 6.7 5.7 5.4 5.4
External sector Terms of trade (deterioration -) 6.8 -0.7 4.9 -1.6 -4.9 -0.6 -0.2 0.3 0.1Exports of goods (US$) 33.9 6.2 147.3 56.9 29.9 22.0 12.2 4.5 0.2Imports of goods (US$) 92.3 85.2 -3.6 18.6 5.8 3.5 4.5 7.0 6.9Average exchange rate (leone per US$) 3,978 4,349 4,344 … … … … … …Nominal effective exchange rate change (depreciation -) -8.2 -4.1 1.0 … … … … … …Real effective exchange rate (depreciation -) 11.5 8.7 14.7 … … … … … …Gross international reserves, months of imports 2/ 2.0 1.8 2.0 2.1 2.2 2.4 2.6 2.8 3.1
Excluding iron ore related imports, months of imports 3/ 3.4 2.8 3.1 3.2 3.4 3.6 3.9 4.1 4.4
Money and creditDomestic credit to the private sector 31.5 21.8 6.3 10.8 11.0 12.6 12.1 11.9 11.8Base money 34.6 13.0 18.5 14.2 17.1 15.2 13.8 12.0 11.3M2 21.8 20.0 23.1 14.8 18.8 16.5 15.0 13.3 11.991-day treasury bill rate (in percent) 24.5 23.4 19.0 … … … … … …
National accountsGross capital formation 31.1 42.2 28.6 18.2 19.1 19.3 19.3 19.3 19.3
Government 7.7 9.0 8.2 7.2 8.1 8.3 8.3 8.3 8.3Private 23.4 33.1 20.3 11.0 11.0 11.0 11.0 11.0 11.0
National savings 11.4 -2.8 -10.8 -0.8 8.6 11.7 12.2 12.4 13.8
External sectorCurrent account balance
(including official grants) -19.7 -45.0 -39.4 -19.1 -10.5 -7.7 -7.2 -7.0 -6.2(excluding official grants) -26.0 -48.8 -41.2 -20.6 -11.9 -9.1 -8.6 -8.4 -7.6
External public debt (including IMF) 30.4 32.6 27.8 27.3 27.4 27.3 27.6 27.7 27.9
Central government budgetDomestic primary balance 4/ -5.9 -3.8 -3.8 -1.8 -2.3 -2.1 -1.9 -1.6 -1.3Overall balance -5.0 -4.6 -5.6 -3.1 -4.5 -4.3 -4.2 -3.7 -3.4
(excluding grants) -10.3 -10.1 -9.7 -6.6 -7.6 -7.4 -7.1 -6.7 -6.2Revenue 9.9 11.5 12.2 12.4 12.4 13.1 13.4 13.9 14.2Grants 5.3 5.6 4.1 3.6 3.1 3.1 2.9 2.9 2.9Total expenditure and net lending 20.2 21.6 21.9 19.1 20.0 20.5 20.5 20.6 20.4
Memorandum item:
GDP at market prices (billions of Leone) 5/ 10,256 12,755 16,459 20,357 24,713 29,421 33,298 36,752 40,535 Excluding iron ore 10,256 12,725 15,330 17,673 20,775 24,248 27,571 30,903 34,563 Excluding iron ore in millions of US$ 2,578 2,926 3,529 4,000 4,531 5,112 5,637 6,134 6,661
Per capita GDP (US$) 441 489 615 729 832 933 998 1,042 1,088
Sources: Sierra Leonean authorities; and Fund staff estimates and projections.
1/ The commencement of iron ore mining causes a structural break in key macroeconomic variables in 2012.
2/ Refers to reserves in current year and imports in following year.
3/ Excludes import of capital goods and service related to the iron ore project that is externally financed.
4/ Revenue less expenditures and net lending adjusted for interest payments.
5/ Statistics Sierra Leone revised the National Accounts Statistics, based on IMF TA recommendations.
This resulted in approximately a 30 percent increase in nominal GDP for the period 2001-11.
2012 1/ 2013
(Annual percent change, unless otherwise indicated)
(Percent of non-iron ore GDP, unless otherwise indicated)

SIERRA LEONE
INTERNATIONAL MONETARY FUND 33
Table 2a. Sierra Leone: Fiscal Operations of the Central Government, 2010–18(Billions of leone)
2010 2011 2014 2015 2016 2017 2018Budget Prel.
Total revenue and grants 1,561 2,171 2,526 2,506 2,827 3,220 3,944 4,493 5,198 5,897Revenue 1,017 1,462 1,826 1,874 2,197 2,581 3,188 3,681 4,300 4,906
Tax revenue 925 1,383 1,746 1,767 2,013 2,360 2,938 3,413 4,015 4,605Personal Income Tax 204 393 689 571 547 643 750 880 1,018 1,142Corporate Income Tax 88 73 71 203 227 260 370 449 549 666Goods and Services Tax 246 351 410 419 458 523 635 750 887 1,061Excises 143 55 3 99 276 335 378 409 433 459Import duties 190 282 271 237 267 299 360 424 526 648Mining royalties and license 24 202 278 222 217 261 400 450 547 567Other taxes 31 24 24 18 21 40 45 50 56 62
Non-tax 92 80 80 106 184 220 250 268 285 302Grants 544 709 701 633 630 640 756 812 898 991
Budget support 244 220 196 204 181 185 229 261 292 327Project grants 277 428 348 302 417 422 495 551 606 664Other 22 61 156 126 32 32 32 0 0 0
Expenditures and net lending 2,074 2,752 2,812 3,360 3,368 4,151 4,981 5,641 6,356 7,064Current expenditures 1,286 1,603 1,926 2,097 2,180 2,514 3,013 3,397 3,784 4,188
Wages and salaries 536 681 878 936 1,058 1,229 1,455 1,654 1,854 2,074Goods and services 426 396 356 464 487 569 679 772 865 968Subsides and transfers 1/ 165 275 418 406 302 376 475 532 586 646Interest 159 250 274 291 333 340 404 438 478 500
Domestic 142 226 247 256 293 301 364 391 427 442Foreign 17 24 27 35 40 39 40 47 50 58
Capital Expenditure 787 1,149 981 1,263 1,281 1,683 2,013 2,288 2,565 2,869Foreign financed 432 787 683 799 818 1,056 1,237 1,379 1,514 1,659Domestic financed 355 362 298 464 463 626 776 910 1,051 1,210
Net lending 2/ 0 0 -95 0 -99 -52 -52 -52 0 0Contingent expenditure 3/ 0 0 0 0 5 6 7 7 8 8
Domestic primary balance 4/ -607 -479 -277 -589 -313 -476 -516 -534 -492 -441Overall balance including grants -513 -581 -286 -854 -541 -931 -1,037 -1,148 -1,158 -1,167Overall balance excluding grants -1,057 -1,290 -986 -1,487 -1,172 -1,571 -1,793 -1,960 -2,056 -2,158
Financing 513 581 286 854 541 931 1,037 1,148 1,158 1,167External financing (net) 162 305 346 523 454 590 668 756 843 917
Borrowing 222 359 438 601 541 694 789 876 959 1,047Projects 155 359 335 497 401 634 742 827 909 995Budget 67 0 104 104 141 61 47 49 50 52
Amortization -61 -54 -92 -77 -88 -104 -121 -120 -116 -130Domestic financing (net) 357 274 -61 339 87 341 368 392 316 250
Bank 413 67 133 222 246 245 219 180 175 81Central bank 298 10 -14 -94 46 16 19 30 25 31
Ways and means … … … … 46 16 19 30 25 31Drawing … … … … 94 110 129 159 184 215Repayment … … … … 48 94 110 129 159 184
Commercial banks 116 57 146 316 200 229 200 150 150 50Nonbank -56 208 -194 117 -158 96 149 212 141 169
Non bank financial institutions 30 54 33 125 91 67 149 212 141 169Privatization proceeds 0 34 35 9 14 44 0 0 0 0Change in arrears -94 -47 -78 -84 -22 -14 0 0 0 0Float (checks payable) 8 167 -183 68 -241 0 0 0 0 0
o/w accumulated 0 183 0 251 0 0 0 0 0 0o/w repaid 0 … -183 -183 -241 0 0 0 0 0
Errors and omissions/financing gap -6 2 0 -8 0 0 0 0 0 0
Memorandum item:
Total poverty expenditures 275 538 570 869 1,063 1,155 1,376 1,595 1,824 2,081Public domestic debt 5/ 1,519 1,482 1,596 1,786 2,241 2,552 2,920 3,312 3,628 3,878Bank and non-bank financing 443 121 166 347 337 312 368 392 316 250
Sources: Sierra Leonean authorities; and Fund staff estimates and projections.1/ Includes foreign financed election spending in 2012, Le 177.5 billion (1.2 percent of non-iron ore GDP)2/ Transfer to the budget from a maturing EU grant onlent to Sierra Rutile 3/ Contingent expenditure introduced in the budget process in 20134/ Revenue less expenditures and net lending adjusted for foreign interest payments and foreign financed capital spending.5/ Public domestic debt includes marketable treasury instruments and ways and means, excludes accounts payable.
2012 2013

SIERRA LEONE
34 INTERNATIONAL MONETARY FUND
Table 2b. Sierra Leone: Fiscal Operations of the Central Government, 2010–18(Percent of Non-Iron Ore GDP)
2010 2011 2014 2015 2016 2017 2018Budget Prel.
Total revenue and grants 15.2 17.1 16.5 16.3 16.0 15.5 16.3 16.3 16.8 17.1Revenue 9.9 11.5 11.9 12.2 12.4 12.4 13.1 13.4 13.9 14.2
Tax revenue 9.0 10.9 11.4 11.5 11.4 11.4 12.1 12.4 13.0 13.3Personal Income Tax 2.0 3.1 4.5 3.7 3.1 3.1 3.1 3.2 3.3 3.3Corporate Income Tax 0.9 0.6 0.5 1.3 1.3 1.2 1.5 1.6 1.8 1.9Goods and Services Tax 2.4 2.8 2.7 2.7 2.6 2.5 2.6 2.7 2.9 3.1Excises 1.4 0.4 0.0 0.6 1.6 1.6 1.6 1.5 1.4 1.3Import duties 1.9 2.2 1.8 1.5 1.5 1.4 1.5 1.5 1.7 1.9Mining royalties and license 0.2 1.6 1.8 1.4 1.2 1.3 1.6 1.6 1.8 1.6Other taxes 0.3 0.2 0.2 0.1 0.1 0.2 0.2 0.2 0.2 0.2
Non-tax 0.9 0.6 0.5 0.7 1.0 1.1 1.0 1.0 0.9 0.9Grants 5.3 5.6 4.6 4.1 3.6 3.1 3.1 2.9 2.9 2.9
Budget support 2.4 1.7 1.3 1.3 1.0 0.9 0.9 0.9 0.9 0.9Project grants 2.7 3.4 2.3 2.0 2.4 2.0 2.0 2.0 2.0 1.9Other 0.2 0.5 1.0 0.8 0.2 0.2 0.1 0.0 0.0 0.0
Expenditures and net lending 20.2 21.6 18.3 21.9 19.1 20.0 20.5 20.5 20.6 20.4Current expenditures 12.5 12.6 12.6 13.7 12.3 12.1 12.4 12.3 12.2 12.1
Wages and salaries 5.2 5.4 5.7 6.1 6.0 5.9 6.0 6.0 6.0 6.0Goods and services 4.2 3.1 2.3 3.0 2.8 2.7 2.8 2.8 2.8 2.8Subsides and transfer 1/ 1.6 2.2 2.7 2.6 1.7 1.8 2.0 1.9 1.9 1.9Interest 1.6 2.0 1.8 1.9 1.9 1.6 1.7 1.6 1.5 1.4
Domestic 1.4 1.8 1.6 1.7 1.7 1.4 1.5 1.4 1.4 1.3Foreign 0.2 0.2 0.2 0.2 0.2 0.2 0.2 0.2 0.2 0.2
Capital Expenditure 7.7 9.0 6.4 8.2 7.2 8.1 8.3 8.3 8.3 8.3Foreign financed 4.2 6.2 4.5 5.2 4.6 5.1 5.1 5.0 4.9 4.8Domestic financed 3.5 2.8 1.9 3.0 2.6 3.0 3.2 3.3 3.4 3.5
Net lending 2/ 0.0 0.0 -0.6 0.0 -0.6 -0.2 -0.2 -0.2 0.0 0.0Contingent expenditure 3/ 0.0 0.0 0.0 0.0 0.0 0.0 0.0 0.0 0.0 0.0
Domestic primary balance 4/ -5.9 -3.8 -1.8 -3.8 -1.8 -2.3 -2.1 -1.9 -1.6 -1.3Overall balance including grants -5.0 -4.6 -1.9 -5.6 -3.1 -4.5 -4.3 -4.2 -3.7 -3.4Overall balance excluding grants -10.3 -10.1 -6.4 -9.7 -6.6 -7.6 -7.4 -7.1 -6.7 -6.2
Financing 5.0 4.6 1.9 5.6 3.1 4.5 4.3 4.2 3.7 3.4External financing (net) 1.6 2.4 2.3 3.4 2.6 2.8 2.8 2.7 2.7 2.7
Borrowing 2.2 2.8 2.9 3.9 3.1 3.3 3.3 3.2 3.1 3.0Project 1.5 2.8 2.2 3.2 2.3 3.1 3.1 3.0 2.9 2.9Budget 0.7 0.0 0.7 0.7 0.8 0.3 0.2 0.2 0.2 0.2
Amortization -0.6 -0.4 -0.6 -0.5 -0.5 -0.5 -0.5 -0.4 -0.4 -0.4Domestic financing (net) 3.5 2.2 -0.4 2.2 0.5 1.6 1.5 1.4 1.0 0.7
Bank 4.0 0.5 0.9 1.4 1.4 1.2 0.9 0.7 0.6 0.2Central bank 2.9 0.1 -0.1 -0.6 0.3 0.1 0.1 0.1 0.1 0.1Commercial banks 1.1 0.4 1.0 2.1 1.1 1.1 0.8 0.5 0.5 0.1
Nonbank -0.5 1.6 -1.3 0.8 -0.9 0.5 0.6 0.8 0.5 0.5Non bank financial institutions 0.3 0.4 0.2 0.8 0.5 0.3 0.6 0.8 0.5 0.5Privatization proceeds 0.0 0.3 0.2 0.1 0.1 0.2 0.0 0.0 0.0 0.0Change in arrears -0.9 -0.4 -0.5 -0.5 -0.1 -0.1 0.0 0.0 0.0 0.0Float (checks payable) 0.1 1.3 -1.2 0.4 -1.4 0.0 0.0 0.0 0.0 0.0
o/w accumulated 0.0 1.4 0.0 1.6 0.0 0.0 0.0 0.0 0.0 0.0o/w repaid 0.0 … -1.2 -1.2 -1.4 0.0 0.0 0.0 0.0 0.0
Errors and omissions/financing gap -0.1 0.0 0.0 -0.1 0.0 0.0 0.0 0.0 0.0 0.0
Memorandum item:
Total poverty expenditures 2.7 4.2 3.7 5.7 6.0 5.6 5.7 5.8 5.9 6.0Public domestic debt 5/ 14.8 11.6 10.4 11.6 12.7 12.3 12.0 12.0 11.7 11.2External public debt (including IMF) 30.4 32.6 28.3 27.8 27.3 27.4 27.3 27.6 27.7 27.9Bank and non-bank financing 4.3 0.9 1.1 2.3 1.9 1.5 1.5 1.4 1.0 0.7Non-iron ore GDP ( Le billions) 10,256 12,725 15,330 15,330 17,673 20,775 24,248 27,571 30,903 34,563
Sources: Sierra Leonean authorities; and Fund staff estimates and projections.1/ Includes foreign financed election spending in 2012, Le 177.5 billion (1.2 percent of non-iron ore GDP)2/ Transfer to the budget from a maturing EU grant onlent to Sierra Rutile 3/ Contingent expenditure introduced in the budget process in 20134/ Revenue less expenditures and net lending adjusted for foreign interest payments and foreign financed capital spending.5/ Public domestic debt includes marketable treasury instruments and ways and means, excludes accounts payable
2012 2013

SIERRA LEONE
INTERNATIONAL MONETARY FUND 35
Table 3. Sierra Leone: Statement of Government Operations (GFSM 2001), 2010–18(Billions of leone)
2010 2011 2012 2013 2014 2015 2016 2017 2018
Transactions affecting net worth:Revenue 1,561 2,171 2,506 2,827 3,220 3,944 4,493 5,198 5,897Taxes 889 1,168 1,536 1,786 2,084 2,520 2,941 3,445 4,012
Taxes on income, profits, and capital gains 303 473 778 779 910 1,130 1,339 1,579 1,821Taxes on goods and services 396 413 521 740 875 1,030 1,177 1,341 1,543Taxes on international trade and transactions 190 282 237 267 299 360 424 526 648
Grants 544 709 633 630 640 756 812 898 991Other revenue 1/ 128 294 337 411 497 668 740 854 895
Expense 1,286 1,603 2,097 2,186 2,520 3,020 3,404 3,791 4,195Non-interest expenditure 1,127 1,353 1,807 1,852 2,181 2,616 2,966 3,313 3,695Interest payment 159 250 291 333 340 404 438 478 500
Domestic 142 226 256 293 301 364 391 427 442External 17 24 35 40 39 40 47 50 58
Gross operating balance 274 568 409 641 700 924 1,089 1,407 1,702
Transactions in nonfinancial assets:Net acquisitions of nonfinancial assets 787 1,149 1,263 1,281 1,683 2,013 2,288 2,565 2,869
Net lending(+)/borrowing(-) -513 -581 -854 -640 -983 -1,088 -1,199 -1,158 -1,167
Transactions in financial assets and liabilities:Net acquisition of financial assets 0 -34 -9 -14 -44 0 0 0 0
Domestic 0 -34 -9 -14 -44 0 0 0 0
Net incurrence of liabilities 513 547 846 626 939 1,088 1,199 1,158 1,167Domestic 357 274 339 87 341 368 392 316 250Foreign 162 305 523 454 590 668 756 843 917
Statistical discrepancies 0 0 0 0 0 0 0 0 0
Transactions affecting net worth:Revenue 15.2 17.1 14.2 13.6 13.3 14.3 14.5 15.0 15.5
Taxes 8.7 9.2 8.7 8.6 8.6 9.1 9.5 10.0 10.5Taxes on income, profits, and capital gains 3.0 3.7 4.4 3.7 3.8 4.1 4.3 4.6 4.8Taxes on property 0.0 0.0 0.0 0.0 0.0 0.0 0.0 0.0 0.0Taxes on goods and services 3.9 3.2 2.9 3.6 3.6 3.7 3.8 3.9 4.0Taxes on international trade and transactions 1.9 2.2 1.3 1.3 1.2 1.3 1.4 1.5 1.7
Grants 5.3 5.6 3.6 3.0 2.6 2.7 2.6 2.6 2.6Other revenue 1.3 2.3 1.9 2.0 2.0 2.4 2.4 2.5 2.3
Expense 12.5 12.6 11.9 10.5 10.4 11.0 11.0 11.0 11.0Non-interest expenditure 11.0 10.6 10.2 8.9 9.0 9.5 9.6 9.6 9.7Interest payment 1.6 2.0 1.6 1.6 1.4 1.5 1.4 1.4 1.3
Domestic 1.4 1.8 1.4 1.4 1.2 1.3 1.3 1.2 1.2External 0.2 0.2 0.2 0.2 0.2 0.1 0.2 0.1 0
Gross operating balance 2.7 4.5 2.3 3.1 2.9 3.4 3.5 4.1 4.5
Transactions in nonfinancial assetsNet acquisitions of nonfinancial assets 0.0 -0.3 0.0 -0.1 -0.2 0.0 0.0 0.0 0.0
Net lending(+)/borrowing(-) -5.0 -4.6 -4.8 -3.1 -4.1 -3.9 -3.9 -3.4 -3.1
Transactions in financial assets and liabilitiesNet acquisition of financial assets 0.0 -0.3 0.0 -0.1 -0.2 0.0 0.0 0.0 0.0
Domestic 0.0 -0.3 0.0 -0.1 -0.2 0.0 0.0 0.0 0.0
Net incurrence of liabilities 5.0 4.3 4.8 3.0 3.9 3.9 3.9 3.4 3.1Domestic 3.5 2.2 1.9 0.4 1.4 1.3 1.3 0.9 0.7Foreign 1.6 2.4 3.0 2.2 2.4 2.4 2.4 2.4 2.2
Statistical discrepancies 0.0 0.0 0.0 0.0 0.0 0.0 0.0 0.0 0.0
Sources: Sierra Leone authorities; and IMF staff estimates and projections.1/ includes mining royalties
(In percent of non-iron ore GDP)

SIERRA LEONE
36 INTERNATIONAL MONETARY FUND
Table 4. Sierra Leone: Monetary Accounts, 2010–181
(Billions of leone, unless otherwise indicated)
2010 2011 2014 2015 2016 2017 2018Prel.
Net foreign assets 1,645 2,053 2,485 2,657 3,087 3,612 4,154 4,684 5,304
Net domestic assets 769 905 1,138 1,505 1,813 2,095 2,412 2,752 3,017Domestic credit 1,938 2,190 2,505 2,878 3,248 3,625 3,976 4,339 4,630
Claims on central government (net) 1,067 1,134 1,356 1,601 1,846 2,065 2,246 2,420 2,501Claims on other public sector 2/ 54 54 75 70 70 70 70 70 70Claims on private sector 790 963 1,023 1,134 1,259 1,417 1,588 1,776 1,986
Other items (net) 3/ -1,169 -1,285 -1,367 -1,374 -1,435 -1,530 -1,565 -1,587 -1,613
Money and quasi-money (M3) 2,414 2,958 3,623 4,161 4,900 5,707 6,566 7,436 8,322Broad money (M2) 1,755 2,107 2,594 2,979 3,539 4,122 4,742 5,371 6,010Foreign exchange deposits 659 851 1,029 1,182 1,361 1,585 1,824 2,066 2,311
Net foreign assets 4/ 959 1,118 1,303 1,396 1,658 1,964 2,330 2,631 2,993
Net domestic assets -198 -258 -284 -232 -295 -394 -544 -630 -765Claims on other depository corporations 22 6 14 -3 -82 -200 -381 -491 -657Claims on central government (net) 591 601 507 552 568 587 618 642 673Claims on other public sector 2/ 0 0 0 0 0 0 0 0 0Claims on private sector 7 7 9 16 16 16 16 16 16Other items (net) 3/ -822 -877 -817 -803 -803 -803 -803 -803 -803
Reserve money 761 860 1,019 1,164 1,363 1,570 1,786 2,001 2,227Currency in circulation 632 708 903 931 1,077 1,240 1,411 1,581 1,760Commercial bank deposits 91 109 94 188 202 238 278 318 359Other deposits 39 43 22 45 84 91 97 102 109
Memorandum items:
Base money 34.6 13.0 18.5 14.2 17.1 15.2 13.8 12.0 11.3M3 28.5 22.6 22.5 14.8 17.8 16.5 15.0 13.3 11.9Credit to the private sector 31.5 21.8 6.3 10.8 11.0 12.6 12.1 11.9 11.8Velocity (GDP/M3) 4.2 4.3 4.2 4.2 4.2 4.2 4.2 4.2 4.2Money multiplier (M3/base money) 3.2 3.4 3.6 3.6 3.6 3.6 3.7 3.7 3.7Credit to the private sector (in percent of non iron ore GDP) 7.7 7.6 6.7 6.4 6.1 5.8 5.8 5.7 5.7Gross Reserves (in US$ millions) 345 382 420 452 505 563 639 732 835Program exchange rate (Leones/US$) 4,198 4,378 4,334 … … … … … …
Sources: Sierra Leonean authorities; and Fund staff estimates and projections. 01/ End of period2/ Include public enterprises and the local government.3/ Including valuation.4/ Net foreign assets are presented at program exchange rates
2012 2013
II. Bank of Sierra Leone
(Annual percent change unless otherwise indicated)
I. Monetary Survey

SIERRA LEONE
INTERNATIONAL MONETARY FUND 37
Table 5. Sierra Leone: Balance of Payments, 2010–18(Millions of U.S. dollars, unless otherwise indicated)
2010 2011 2014 2015 2016 2017 2018Prel.
Current account -507.0 -1,315.4 -1,388.8 -764.9 -477.5 -392.1 -408.2 -431.8 -411.3
Trade balance -517.7 -1,245.5 -619.5 -368.6 -30.0 328.1 525.3 495.5 344.8
Exports, f.o.b. 363.1 385.6 953.4 1,496.4 1,943.5 2,371.2 2,659.6 2,779.1 2,785.8Of which: diamonds 127.5 154.1 161.7 211.1 238.6 262.0 235.0 252.3 263.5
iron ore 0.0 0.0 417.3 854.6 1,174.6 1,524.4 1,662.3 1,662.3 1,662.3
Imports, f.o.b -880.7 -1,631.1 -1,572.9 -1,865.0 -1,973.5 -2,043.1 -2,134.2 -2,283.6 -2,441.0Of which: oil -127.7 -214.5 -283.4 -313.5 -341.8 -365.3 -377.9 -385.8 -397.2
Services (net) -150.4 -283.2 -850.2 -544.8 -387.8 -429.1 -404.8 -356.8 -376.9
Income (net) -49.1 -35.3 -138.6 -89.7 -323.1 -589.9 -853.9 -918.3 -751.4
Of which: interest on public debt -4.3 -5.5 -7.9 -9.3 -9.0 -9.2 -10.9 -11.6 -13.4
Transfers 210.2 248.6 219.5 238.2 263.4 298.9 325.1 347.8 372.2Official transfers 162.9 112.8 66.4 59.8 60.7 70.9 78.1 85.4 93.4Other transfers 47.2 135.8 153.2 178.5 202.8 228.0 247.0 262.4 278.8
Capital and financial account 439.0 1,352.8 1,437.6 789.8 515.9 438.3 474.1 543.5 534.7
Capital account 97.3 127.0 98.9 96.5 94.4 111.7 120.4 128.2 136.2Of which: project support grants 69.7 98.5 69.5 94.4 92.1 104.3 112.7 120.2 127.9
Financial account 341.6 1,225.8 1,338.8 693.3 421.4 326.5 353.7 415.2 398.5Foreign direct and portfolio investment 335.0 1,073.9 1,175.2 602.6 311.7 223.9 227.6 285.9 259.1Other investment 6.6 152.0 163.6 90.7 109.8 102.6 126.0 129.3 139.4
Public sector (net) 40.3 72.5 119.2 97.7 136.1 138.5 151.4 163.5 176.7Disbursements 55.6 84.9 137.0 125.0 160.2 166.4 179.1 190.3 201.8Amortization -23.0 -11.6 -17.7 -27.2 -24.1 -27.9 -27.8 -26.9 -25.1
Monetary authorities 0.0 0.0 0.0 0.0 0.0 0.0 0.0 0.0 0.0Change in net foreign assets of comm. banks -24.1 -50.3 -59.2 -7.1 -26.3 -35.9 -25.3 -34.2 -37.4Other sectors net -12.3 3.2 0.0 0.0 0.0 0.0 0.0 0.0 0.0Short-term 0.0 0.0 0.0 0.0 0.0 0.0 0.0 0.0 0.0
Errors and omissions 42.4 -9.4 -13.5 0.0 0.0 0.0 0.0 0.0 0.0
Overall balance -25.7 28.0 35.4 24.9 38.4 46.2 65.9 111.7 123.4
FinancingCentral bank net reserves (- increase) 25.7 -28.0 -35.4 -24.9 -38.4 -46.2 -65.9 -111.7 -123.4
Gross reserve change -8.4 -36.9 -38.7 -31.5 -53.3 -58.4 -75.2 -93.1 -103.4Use of Fund loans 34.1 8.9 3.3 6.6 14.8 12.2 9.4 -18.6 -20.0
Purchases 36.3 14.0 6.8 13.7 27.3 27.3 27.3 0.0 0.0Repurchases -2.1 -5.2 -3.5 -7.1 -12.5 -15.2 -17.9 -18.6 -20.0
Exceptional financing 0.0 0.0 0.0 0.0 0.0 0.0 0.0 0.0 0.0
Financing gap 0.0 0.0 0.0 0.0 0.0 0.0 0.0 0.0 0.0
Memorandum items:
Current account -19.7 -45.0 -39.4 -19.1 -10.5 -7.7 -7.2 -7.0 -6.2Trade Balance -20.1 -42.6 -17.6 -9.2 -0.7 6.4 9.3 8.1 5.2Capital and Financial Account 17.0 46.2 40.7 19.7 11.4 8.6 8.4 8.9 8.0Overall Balance -1.0 1.0 1.0 0.6 0.8 0.9 1.2 1.8 1.9Official aid (grants and loans) 7.0 3.9 2.6 1.9 1.3 1.2 1.2 1.3 1.3
Budget support in US$ (grants and loans) 179.7 115.3 90.4 74.3 56.7 62.9 70.2 77.4 85.4
Gross International ReservesUS$ millions 345 382 420 452 505 563 639 732 835Months of imports 2.0 1.8 2.0 2.1 2.2 2.4 2.6 2.8 3.1
Excluding iron ore, months of imports 3.4 2.8 3.1 3.2 3.4 3.6 3.9 4.1 4.4
National currency per US dollar (average) 3,978 4,357 4,344 … … … … … …
Sources: Sierra Leonean authorities; and Fund staff estimates and projections.
2012 2013
(Percent of non-iron ore GDP unless otherwise indicated)

SIERRA LEON
E
38 INTERN
ATION
AL MO
NETARY FU
ND
Table 6. Sierra Leone: Indicators of Capacity to Repay the Fund, 2010–24
2010 2011 2012 2013 2014 2015 2016 2017 2018 2019 2020 2021 2022 2023 2024
Fund obligations based on existing credit(in millions of SDRs)Principal 1.4 1.9 2.3 4.6 8.1 9.9 11.7 12.1 13.0 9.5 6.4 2.7 0.9 0.0 0.0Charges and interest 0.0 0.0 0.0 0.0 0.0 0.2 0.1 0.1 0.1 0.0 0.0 0.0 0.0 0.0 0.0
Fund obligations based on existing and prospective credit(in millions of SDRs)Principal 1.4 1.9 2.3 4.6 8.1 9.9 11.7 12.1 13.0 12.2 12.6 12.4 13.3 12.4 9.8Charges and interest 0.0 0.0 0.0 0.0 0.0 0.2 0.3 0.3 0.2 0.2 0.2 0.1 0.1 0.1 0.0
Total obligations based on existing and prospective creditIn millions of SDRs 1.4 1.9 2.3 4.6 8.1 10.1 11.9 12.4 13.2 12.4 12.7 12.6 13.4 12.5 9.8In millions of US$ 2.1 3.0 3.5 7.0 12.3 15.4 18.3 19.1 20.5 19.1 19.7 19.5 20.8 19.4 15.2In percent of exports of goods and services 0.5 0.5 0.3 0.4 0.6 0.6 0.6 0.6 0.7 0.6 0.6 0.6 0.6 0.5 0.4In percent of debt service 1/ 7.3 13.3 12.1 16.0 27.0 29.5 32.3 33.4 35.0 32.5 32.1 30.7 30.7 29.1 20.9In percent of GDP 0.1 0.1 0.1 0.2 0.2 0.2 0.3 0.3 0.3 0.2 0.2 0.2 0.2 0.2 0.1In percent of Gross International Reserves 0.6 0.8 0.8 1.5 2.4 2.7 2.9 2.6 2.5 2.1 2.0 1.8 1.7 1.4 1.0In percent of quota 1.4 1.8 2.2 4.5 7.8 9.7 11.5 11.9 12.7 11.9 12.3 12.1 13.0 12.1 9.5
Outstanding Fund creditIn millions of SDRs 73.4 79.0 78.8 83.1 92.7 100.6 106.7 94.6 81.6 69.5 56.9 44.4 31.1 18.7 8.9In millions of US$ 111.9 124.7 120.7 125.5 140.6 153.5 163.7 145.9 126.5 107.6 88.1 68.9 48.2 28.9 13.8In percent of exports of goods and services 26.5 22.9 11.0 7.5 6.6 5.9 5.6 4.8 4.1 3.5 2.7 2.1 1.4 0.8 0.4In percent of debt service 380.9 560.5 413.2 288.2 308.4 293.6 289.3 255.5 216.5 182.8 143.1 108.7 71.1 43.4 18.9In percent of GDP 4.3 4.3 3.2 2.7 2.6 2.5 2.4 2.0 1.6 1.3 1.0 0.7 0.5 0.3 0.1In percent of Gross International Reserves 32.5 32.7 28.7 27.8 27.8 27.2 25.6 19.9 15.1 11.8 8.8 6.3 4.0 2.1 0.9In percent of quota 70.7 76.2 76.0 80.1 89.4 97.0 102.9 91.2 78.7 67.0 54.9 42.9 30.0 18.0 8.6
Net use of Fund credit (in millions of SDRs) 22.4 5.6 2.1 4.3 9.8 8.0 6.1 -12.1 -12.9 -11.2 -10.4 -9.1 -9.1 -6.5 -4.1Disbursements 23.8 8.9 4.4 9.0 18.0 17.9 17.8 0.0 0.0 0.0 0.0 0.0 0.0 0.0 0.0Repayments 1.4 3.3 2.3 4.7 8.2 9.9 11.7 12.1 12.9 11.2 10.4 9.1 9.1 6.5 4.1
Memorandum items:Exports of goods and services (in millions of US$) 423 546 1,099 1,670 2,147 2,605 2,916 3,054 3,080 3,118 3,208 3,328 3,439 3,556 3,692Debt service (in millions of US$) 29 22 29 44 46 52 57 57 58 59 62 63 68 67 73Nominal GDP (in millions of US$) 2,578 2,933 3,789 4,607 5,390 6,203 6,808 7,295 7,812 8,313 8,852 9,433 10,058 10,730 11,453Gross International Reserves (in millions of US$) 345 382 420 452 505 563 639 732 835 913 999 1,100 1,217 1,348 1,493Quota (millions of SDRs) 104 104 104 104 104 104 104 104 104 104 104 104 104 104 104
Source: IMF staff estimates and projections.
1/ Total debt service includes IMF repayments.
Projection

INTERN
ATION
AL MO
NETARY FU
ND
39
SIERRA LEON
E
Availability Disbursements Conditions for DisbursementIn millions In percent
of SDRs of quota
October 21, 2013 8.89 8.57 Effectiveness of the three-year ECF arrangement
June 15, 2014 8.89 8.57 Board completion of the first review based on observanceof performance criteria for December 31, 2013
December 15, 2014 8.89 8.57 Board complettion of the second review based on observanceof performance criteria for June 30, 2014
June 15, 2015 8.89 8.57 Board completion of the third review based on observanceof performance criteria for December 31, 2014
December 15, 2015 8.89 8.57 Board completion of the fourth review based on observanceof performance criteria for June 30, 2015
June 15, 2016 8.89 8.57 Board completion of the fifth review based on observanceof performance criteria for December 31, 2015
September 10, 2016 8.88 8.56 Board completion of the sixth review based on observanceof performance criteria for June 30, 2016
Total disbursements 62.22 60.00
Table 7. Sierra Leone: Actual and Proposed Disbursements Under the ECF Arrangement, 2013–16

SIERRA LEONE
40 INTERNATIONAL MONETARY FUND
Table 8. Sierra Leone: Millennium Development Goals, 1990–2010
1990 1995 2000 2005 2010Goal 1: Eradicate extreme poverty and hungerEmployment to population ratio, 15+, total (%) 64 64 63 65 65Employment to population ratio, ages 15-24, total (%) 39 38 39 42 42GDP per person employed (constant 1990 PPP $) .. .. .. .. ..Income share held by lowest 20% .. .. .. 6 ..Malnutrition prevalence, weight for age (% of children under 5) 25 .. 25 28 21Poverty gap at $1.25 a day (PPP) (%) 45 .. .. 20 ..Poverty headcount ratio at $1.25 a day (PPP) (% of population) 63 .. .. 53 ..Vulnerable employment, total (% of total employment) .. .. .. 92 ..
Goal 2: Achieve universal primary educationLiteracy rate, youth female (% of females ages 15-24) .. .. .. 37 48Literacy rate, youth male (% of males ages 15-24) .. .. .. 60 68Persistence to last grade of primary, total (% of cohort) .. .. .. .. ..Primary completion rate, total (% of relevant age group) .. .. .. .. 74Total enrollment, primary (% net) .. .. .. .. ..
Goal 3: Promote gender equality and empower womenProportion of seats held by women in national parliaments (%) .. 6 9 15 13Ratio of female to male primary enrollment (%) 66 .. 67 .. 93Ratio of female to male secondary enrollment (%) 49 .. 68 .. ..Ratio of female to male tertiary enrollment (%) .. .. 78 .. ..Share of women employed in the nonagricultural sector (% of total nonagricultural employment) .. .. .. 23.2 ..
Goal 4: Reduce child mortalityImmunization, measles (% of children ages 12-23 months) .. .. 37 71 82Mortality rate, infant (per 1,000 live births) 162 159 142 128 114Mortality rate, under-5 (per 1,000 live births) 276 271 233 202 174
Goal 5: Improve maternal healthAdolescent fertility rate (births per 1,000 women ages 15-19) .. 151 146 144 120Births attended by skilled health staff (% of total) .. .. 42 43 42Contraceptive prevalence (% of women ages 15-49) 3 .. 4 5 8Maternal mortality ratio (modeled estimate, per 100,000 live births) 1300 1300 1300 1000 890Pregnant women receiving prenatal care (%) .. .. 68 81 87Unmet need for contraception (% of married women ages 15-49) .. .. .. .. 28
Goal 6: Combat HIV/AIDS, malaria, and other diseasesChildren with fever receiving antimalarial drugs (% of children under age 5 with fever) .. .. 61 52 30Condom use, population ages 15-24, female (% of females ages 15-24) .. .. .. .. 5Condom use, population ages 15-24, male (% of males ages 15-24) .. .. .. .. 18Incidence of tuberculosis (per 100,000 people) 207 279 377 509 682Prevalence of HIV, female (% ages 15-24) .. .. .. .. 1.5Prevalence of HIV, male (% ages 15-24) .. .. .. .. 0.6Prevalence of HIV, total (% of population ages 15-49) 0.1 0.2 0.9 1.5 1.6Tuberculosis case detection rate (%, all forms) 8 18 24 26 32
Goal 7: Ensure environmental sustainabilityCO2 emissions (kg per PPP $ of GDP) 0 0 0 0 0CO2 emissions (metric tons per capita) 0 0 0 0 0Forest area (% of land area) 43.5 .. 40.8 39.4 38.1Improved sanitation facilities (% of population with access) 11 11 11 12 13Improved water source (% of population with access) 38 42 46 51 55Marine protected areas (% of territorial waters) 0 0 0 0 0Net ODA received per capita (current US$) 15 54 44 66 80
Goal 8: Develop a global partnership for developmentDebt service (PPG and IMF only, % of exports, excluding workers' remittances) 10 62 46 9 4Internet users (per 100 people) 0 0 0.1 0.2 0.3Mobile cellular subscriptions (per 100 people) 0 0 0 14 34Telephone lines (per 100 people) 0 0 0 1 0Fertility rate, total (births per woman) 6 6 6 5 5
OtherGNI per capita, Atlas method (current US$) 200 200 150 230 340GNI, Atlas method (current US$) (billions) 0.8 0.8 0.6 1.2 2Gross capital formation (% of GDP) 10 5.6 6.9 17 15.8Life expectancy at birth, total (years) 39 37 40 44 47Literacy rate, adult total (% of people ages 15 and above) .. .. .. 35 41Population, total (millions) 4.0 3.9 4.1 5.1 5.8Trade (% of GDP) 46.2 45.1 57.4 60.1 46.6
Source: World Development Indicators

SIERRA LEON
E
INTERN
ATION
AL MO
NETARY FU
ND
41
Table 9. Sierra Leone: Financial Soundness Indicators of the Banking System, 2005–13
2005 2006 2007 2009 2010 2011 2012Mar
Capital adequacyRegulatory capital ratio 1/ 35.7 33.3 35.0 43.5 34.0 30.7 27.0 27.7 31.8 Regulatory tier 1 capital ratio 2/ 10.3 17.0 16.7 18.7 18.8 17.5 14.0 12.5 14.1
Asset qualityNonperforming loans to total gross loans … … 31.7 23.4 16.5 15.6 15.1 14.7 17.6 Nonperforming loans (net of provisions) to regulatory capital … … 35.5 26.8 22.4 13.1 19.6 19.2 23.1
Earnings and profitabilityReturn on assets 8.1 5.8 3.1 2.2 1.6 3.4 3.8 3.4 1.3 Return on equity 28.0 17.0 10.3 7.2 4.0 12.1 15.6 16.1 6.0
LiquidityRatio of net loans to total deposits 27.5 26.5 27.7 33.9 41.5 42.8 41.3 33.9 33.3 Liquidity ratio 3/ 53.0 58.9 53.3 62.0 53.4 54.1 54.6 40.7 64.1 Statutory minimum liquidity ratio 3/ 4/ 34.0 28.5 25.7 25.0 29.0 41.5 29.7 54.9 52.5 Share of foreign exchange deposits in total deposits 30.7 32.4 36.5 32.2 34.5 40.4 41.5 40.8 38.7
Prudential ratios at year-end Capital adequacy 0 0 0 0 1 0 2 0 …Minimum liquidity ratio 0 0 0 0 1 1 3 0 …Minimum capital 0 1 1 1 2 0 4 1 …Limit of single large exposure 5/ 0 2 1 2 4 5 3 5 …
Memorandum Item: Number of banks 7 8 10 13 14 13 13 13 13
Source: Bank of Sierra Leone.
1/ Capital requirement over risk-weighted assets (solvency ratio).
2/ Core capital (Tier I) over total assets.
3/ Calculated taking into account both domestic currency and foreign currency deposits. Liquid assets include domestic currency cash in vault,
claims on the BSL, claims on discount houses, and government securities.
4/ Effective November 2007, minimum liquidity includes 40 percent of demand deposits and 20 percent of quasi-money to be held in either
cash or treasury bills.
5/ A single large exposure of an institution is any exposure that is 2 percent or more of its capital base.
2008
(Percent, end of period, unless otherwise indicated)
(Number of banks not complying)
2013

SIERRA LEONE
42 INTERNATIONAL MONETARY FUND
Table 10. Sierra Leone: External Financing Requirements and Sources, 2013–16(Millions of U.S. dollars, unless otherwise indicated)
2013 2014 2015 2016 1. Gross financing requirements 877.5 634.0 579.8 611.9
Current account deficit (excluding grants) 806.7 520.2 445.0 468.4Debt amortization 27.2 24.1 27.9 27.8Gross reserve accumulation 31.5 53.3 58.4 75.2Fund repayments 7.1 12.5 15.2 17.9Other flows 5.0 24.0 33.4 22.5
2. Available financing 863.8 606.7 552.5 584.5
Foreign direct investment, net 602.6 311.7 223.9 227.6
Identified disbursements 261.2 295.0 328.6 356.9
Grants 136.2 134.8 162.1 177.8
Project 94.4 92.1 109.2 117.7
Program 41.8 42.7 52.9 60.2
United Kingdom 23.3 24.2 28.2 32.1
European Union 18.5 18.5 21.6 24.6
African Development Bank 0.0 0.0 3.1 3.5
Loans 125.0 160.2 166.4 179.1
Project 92.5 146.2 156.4 169.1
Program 32.5 14.0 10.0 10.0
World Bank/IDA 32.5 14.0 10.0 10.0
3. Financing gap 13.7 27.3 27.3 27.3
4. Possible financing 0.0 0.0 0.0 0.0
5. Residual financing 13.7 27.3 27.3 27.3
Of which: Proposed ECF disbursements 13.7 27.3 27.3 27.3
Sources: Sierra Leonean authorities and Fund staff estimates and projections.

SIERRA LEONE
INTERNATIONAL MONETARY FUND 43
Table 11. Sierra Leone: Risk Assessment Matrix (RAM)1
Source of Risks
Relative Likelihood
Impact and Policy Response
Sustained decline in commodity prices.
Low Low to Medium A sustained decline in commodity prices would result in a higher external current account deficit and a shortfall in government revenue from the mining sector. It could also delay expected investment in iron ore production expansion. Policy response: Delay scaling up of public investment and strengthen efficiency in non-resource revenue mobilization.
Uncertain forecast for iron ore production volume.
Medium Low to Medium A lower-than projected iron ore production would result in a shortfall in revenue from iron ore royalties, lower growth, and higher external current account. Policy response: Same as for a “sustained decline in commodity prices.”
Global oil price shock triggered by geopolitical events.
Low Medium As was the case in 2011–12, a sharp rise in the world oil price is not likely to be passed through to domestic consumers, as Sierra Leone lacks social safety nets to mitigate the impact of higher prices on vulnerable groups. The budget would absorb the cost, likely resulting in lower domestic investment or higher borrowing from the securities market. Policy response: Gradual pass-through of higher global prices combined with social safety nets measures for the most vulnerable groups; and lower domestically-financed investment.
Aid shortfall. Medium Medium A shortfall in aid would compromise the anticipated fiscal consolidation efforts. It may result in postponement of domestic investment, and lead to increased borrowing from the securities market that could potentially crowd out of private sector borrowing. Policy response: Ensure strong implementation of donors’ disbursement conditions for committed aid, and scale back domestically financed investment.
Poor implementation of fiscal policy.
Medium Medium A higher than anticipated fiscal deficit would lead to increased borrowing from the securities market and an accumulation of domestic arrears, with adverse impact for the monetary program and the financial sector. Policy response: Continue close monitoring of budget execution, and stop nonwage expenditure commitments two months prior to the end of the fiscal year.
1 The RAM shows events that could materially alter the baseline path—the scenario most likely to materialize in staff’s view.
SIERRA LEONE
44 INTERNATIONAL MONETARY FUND
Appendix I. Letter of Intent
October 1, 2013 Madame Christine Lagarde Managing Director International Monetary Fund Washington, D.C. 20431 USA Dear Madame Lagarde: 1. On behalf of the government of Sierra Leone, I am pleased to submit herewith a Memorandum of Economic and Financial Policies (MEFP) for which Sierra Leone is requesting a three-year arrangement with the International Monetary Fund (IMF) under the Extended Credit Facility (ECF) for the period 2013–16. The objectives of the program and measures envisaged for achieving them are described in the memorandum. Reflecting the government’s poverty reduction and growth objectives, the program focuses on (i) consolidating the gains from the previous ECF-supported program, including macroeconomic stability supported by prudent fiscal and monetary policies; (ii) strengthening revenue performance and improving public financial management to efficiently channel adequate resources to infrastructure and poverty-reducing spending; and (iii) stepping up financial sector reforms to support financial deepening and economic growth.
2. The government requests that the MEFP be supported under a three-year arrangement under the ECF in an amount equivalent to SDR 62.22 million (or 60 percent of quota). We also request that the first disbursement, in an amount equivalent to SDR 8.89 million, be made available after approval of the ECF arrangement by the Executive Board of the IMF. To monitor progress in implementing our reform agenda, the program includes a set of quantitative criteria, indicative targets, and structural benchmarks outlined in the MEFP and the Technical Memorandum of Understanding (TMU).
3. Sierra Leone’s new poverty reduction strategy for 2013–18 (PRSP III) launched in July this year—The Agenda for Prosperity—focuses on addressing the infrastructure deficit and growing the private sector to support inclusive growth, enhancing the efficiency and access to social services to support human development, and improving governance and transparency to support effective public service delivery. Development partners, in accordance with the Busan principles of aid effectiveness, have pledged to assist the government to attain these broad objectives.
4. To help achieve the objectives of the Agenda for Prosperity, the government plans to implement a number of transformational investment projects, including a new airport on the mainland, hydro electric dams, and agriculture irrigation projects. The government will seek concessional borrowing for these transformational projects. The government believes, in particular, that the construction of a new airport will support private sector development and economic growth, increase tourism, and generate new sources of revenue for the government budget. The government

SIERRA LEONE
INTERNATIONAL MONETARY FUND 45
will pursue the project if it is economically viable. It will work closely with Sierra Leone’s development partners, notably the World Bank on the project’s feasibility and with IMF staff on its macroeconomic and program implications.
5. The government of Sierra Leone has made substantial progress during 2001–13 in laying the foundations for macroeconomic stability, sustained economic growth, and financial sector expansion in the context of three previous programs. The previous ECF-supported program for 2010–13 had to be cancelled to enable the newly elected government to take stock of progress in strengthening institutions, including procedures for public financial management, and to transition to a new economic program that would support the Agenda for Prosperity. Nonetheless, reform measures and policies put in place have helped improve macroeconomic stability, advance social policies, and enhance prospects for broad-based and inclusive economic growth. This progress demonstrates the government’s commitment to meet performance criteria and structural benchmarks set for 2013–14 (MEFP, Tables 1–2).
6. The economic outlook for the rest of this year and over the medium term remains favorable. We expect to use prudent fiscal and monetary policies to dampen inflationary pressures—consumer price inflation fell to 9.5 percent (year-on-year) at end-July, the first time since the onset of the global financial crisis, and interest rates on government securities declined considerably, from 19–26 percent at end-2012 to 3–9 percent in late August, reflecting tight expenditure management in the first half of the year, with limited issuance of short-term securities. As a result, the Monetary Policy Committee of the Bank of Sierra Leone (BoSL) reduced the monetary policy interest rate. Going forward, any further declines in the monetary policy rate (MPR) would be carefully calibrated in line with the use of other monetary instruments to support the single-digit inflation target while encouraging financial intermediation. We expect a careful execution of government spending, in the context of the cash management committee and envisaged further improvements in public financial management, to help alleviate infrastructure bottlenecks, enhance the business environment for job creation, and maintain macroeconomic stability. Nonetheless, the global economic outlook presents risks to the economic outlook that call for vigilance in policy implementation. We stand ready to take corrective measures should adverse shocks materialize and compromise the attainment of programmed objectives.
7. Sierra Leone believes that the policies set forth in the attached Memorandum of Economic and Financial Policies are adequate to achieve the objectives of the program, but will take any further measures that may become appropriate for this purpose. Sierra Leone will consult with the IMF on the adoption of these measures in advance to the revisions to the policies contained in the Memorandum of Economic and Financial Policies in accordance with IMF policies in such consultation. Further, and in line with its commitment to transparency and accountability, the government authorizes the IMF to publish this letter, its attachments, and related staff report, including placement of these on the IMF website in accordance with Fund procedures, following the IMF Executive Board’s approval of the request.

SIERRA LEONE
46 INTERNATIONAL MONETARY FUND
Very truly yours,
/s/ /s/ ______________________________________________ _________________________________________
Kaifala Marah Sheku S. Sesay Minister of Finance and Economic Development Governor of Bank of Sierra Leone
Attachments: Memorandum of Economic and Financial Policies Technical Memorandum of Understanding

SIERRA LEONE
INTERNATIONAL MONETARY FUND 47
Supplemental Letter of Intent
October 17, 2013 Madame Christine Lagarde Managing Director International Monetary Fund Washington, DC, 20431 USA Dear Madame Lagarde:
On behalf of the government of Sierra Leone, it is our pleasure to send you this supplement to the
Letter of Intent (LOI) dated October 1, 2013, to welcome the change in the policy on discount rate
approved by the Executive Boards of the International Monetary Fund (IMF) and the World Bank on
October 11, 2013. We note that under the new policy, a unified 5 percent discount rate will be used
for the calculation of the present value of external debt in the Debt Sustainability Framework for Low
Income Countries and for the assessment of the concessionality of individual loans. To reflect this
change, and in consultation with IMF staff, we have revised paragraph 13 of the Technical
Memorandum of Understanding attached to the LOI signed on October 1, 2013.
Very truly yours,
____________/s/________________________ __________/s/_____________________
Kaifala Marah Sheku S. Sesay
Minister of Finance and Economic Development Governor of Bank of Sierra Leone

SIERRA LEONE
48 INTERNATIONAL MONETARY FUND
Attachment 1. Memorandum of Economic and Financial Policies for 2013–16
Freetown, October 1, 2013
Introduction
1. The government of Sierra Leone implemented in 2010–13 an economic and financial
program supported by the International Monetary Fund (IMF) under the Extended Credit Facility
(ECF). Progress on policy implementation, combined with support from Sierra Leone’s other
development partners helped strengthen macroeconomic stability, advance structural reforms in key
areas, and achieve important objectives under the second-generation Poverty Reduction Strategy
(PRS), The Agenda for Change. To consolidate these gains and address remaining developmental
challenges for Sierra Leone, the government has prepared a new medium-term economic program
for the period 2013–16.
2. This Memorandum presents the economic and financial policies that the government intends
to implement under the new program, to achieve key objectives under The Agenda for Prosperity, its
new PRS, communicated to the IMF and World Bank on July 15.
3. Under the new ECF-supported program, the government’s overarching objective is to
accelerate economic growth and reduce poverty further, under policies that are environmentally,
socially, and economically sustainable. This calls for scaling up infrastructure and energy investment;
providing adequate social services; and managing renewable and nonrenewable natural resources
efficiently. Hence, policies under the program will be geared toward creating fiscal space for
improving basic infrastructure and social services while maintaining macroeconomic stability;
strengthening revenue performance and improving public financial management (PFM) systems;
effectively managing the fiscal regime for extractive industries; and supporting private sector
development.
Recent Economic Developments and Short-Term Outlook
4. Economic growth accelerated and inflation declined in 2012. Real GDP growth is estimated
at 15.2 percent, reflecting increased iron ore production, from 137,000 tons in 2011 to 6.6 million
tons in 2012. Non-iron ore growth is estimated at 5.3 percent (5.8 percent in 2011), driven by output
expansion in agriculture, manufacturing, construction, and services. In agriculture growth has been
sustained since 2010 with the introduction of the government and donor-supported Small Holder
Commercialization Program (SHCP), which encourages small holder farmers to work under organized

SIERRA LEONE
INTERNATIONAL MONETARY FUND 49
Agriculture Business Centers. With support from the government and development partners, the
SHCP provides improved inputs, tractors, and processing equipment. Projections for 2013 indicate
that real GDP growth would reach about 13.3 percent, driven by increasing value-added from iron
ore production, but also a healthy 6 percent growth in the non-iron ore economy, with key
contributions from other minerals, agriculture, services, tourism, and sustained investment in
infrastructure.
5. Good progress has been made in containing consumer price inflation, and price pressures
have eased during 2012–July 2013. The inflation rate declined from 16.9 percent at end-2011 to
12 percent at end-2012, and 9.5 percent at end-July 2013. Key contributing factors include
moderation of food inflation, a tight monetary policy stance, and a stable exchange rate.
6. The external position improved in 2012. A significant increase in FDI flows during 2011 and
2012 has led to a surge in investment-driven imports, and helped finance the resultant current
account deficit. FDI flows moderated in 2012, as the new iron ore projects shifted from the
investment to the export phase, contributing to an improving trade balance and a decline in the
current account deficit. The overall balance of payments recorded a surplus, thus contributing to
reserve accumulation, with coverage of about 3 months of imports (excluding imports related to
iron ore).
7. Broad money (M2) accelerated by 23.1 percent in 2012, up from 20 percent in 2011. Private
sector credit growth decelerated in 2012 reflecting some crowding out from significantly higher
government borrowing from commercial banks in the securities market, as well as the impact of the
newly established credit reference bureau, which now provides commercial banks a facility to better
establish creditworthiness. Interest rates were relatively stable throughout much of 2012; the
Monetary Policy Rate remained at 20 percent while the average rate on savings stood at 6.5 percent
and lending rates at 20–30 percent. During the same period, the one-year Treasury bond rate was
unchanged at 20 percent and the 91-day Treasury bill rate remained around 23 percent for much of
the year. These rates dropped to 6 percent and 3.2 percent respectively in late August 2013
reflecting the sharp slowdown in government borrowing from the securities market.
8. Fiscal policy implementation was challenging in 2012 because of the elections. Revenue
collection reached 12.2 percent of non-iron ore GDP compared with 11.5 percent in 2011 reflecting
higher than anticipated taxes from the extractive sector that helped compensate for weak
performance in other tax categories, particularly the windfall in signature bonuses from petroleum
exploration, the one-off payments of advanced payroll tax by one of the iron ore mining companies
and the sale of government shares (in lieu of personal income tax) held in Sierra Rutile Limited.

SIERRA LEONE
50 INTERNATIONAL MONETARY FUND
Expenditure stabilized at about 22 percent of non-iron ore GDP, partly reflecting a decline in
foreign-funded capital expenditure that compensated a one percentage point increase in current
spending to 13.7 percent of non-iron ore GDP. The increase in current expenditure was partly due to
spending related to the November elections. The wage bill increased from 5.4 percent of non-iron
ore GDP in 2011 to 6.1 percent in 2012, driven by the hiring of 1,589 teachers, and health workers;
partly financed through savings from the retirement of senior staff under the pay reform plan.
Domestically financed capital spending increased from 2.8 percent of non-iron ore GDP in 2011 to
3 percent in 2012, covering mostly infrastructure projects. The overall budget deficit (including
grants) reached Le 854 billion (5.6 percent of non-iron ore GDP), up from 581 billion in 2011
(4.6 percent of non-iron ore GDP). It was mostly financed with project and program loans and
issuance of domestic securities. The latter reached 2.3 percent of non-iron ore GDP, up from
0.9 percent in 2011.
Program Implementation—Taking Stock
9. Significant progress was made in the implementation of the ECF-supported program that
was cancelled prior to its expiration at end-June. Reform measures and policies put in place have
helped improve macroeconomic stability, advance social policies, and enhance prospects for broad
and inclusive growth.
10. The program was broadly successful in facilitating growth and macroeconomic stability while
reducing inflation. The advent of large-scale iron-ore mining boosted private sector development
and revenue performance. Overall fiscal performance, however, was challenging, as gaps in budget
execution resulted in recurrent end-year fiscal expenditure overruns. In response, in 2011, corrective
measures were taken to limit by law the Treasury’s access to credit from BoSL to 5 percent of
previous year’s revenue at any time, and eliminate BoSL participation in the primary securities’
market. Subsequently, in 2012, the government established a Cash Management Committee to
improve Treasury cash management and enhance coordination between fiscal and monetary
policies.
11. While the fiscal position was relatively robust at the outset of the program it weakened over
time due to expenditure overruns and excessive borrowing from the securities market. Expenditure
rose from 17.7 percent of non-iron ore GDP in 2009 to almost 22 percent in 2012 with current
expenditure and domestically-financed investment consistently above the budgeted level. In
2010–12, on average, spending on wages and salaries exceeded program targets by about 5 percent,
goods and services by about 20 percent, and domestically financed capital spending by 56 percent.
While one-off revenue from mining and oil exploration helped finance the additional expenditure,

SIERRA LEONE
INTERNATIONAL MONETARY FUND 51
higher-than-budgeted spending was met with a build-up of unpaid bills and domestic debt. This led
to mixed results on fiscal performance, highlighting important challenges to efficient PFM.
12. Monetary and exchange rate policies were consistent with program’s objectives. Monetary
policy was tightened in mid-2011, which, combined with stability in the exchange rate contributed to
decelerating inflation. Increased foreign exchange inflows supported the stability of the leone
against other currencies, and the flexible exchange rate regime was preserved. The Bank of
Sierra Leone’s interventions in the market were limited to smoothing volatility in the market.
13. On external debt, although higher borrowing for investment in infrastructure added to the
debt stock, the results of the Debt Sustainability Analysis (DSA) showed that the risk of debt distress
remained moderate. However, stress test results from the DSA showed that it was crucial to sustain
fiscal consolidation efforts, promote growth-enhancing policies, and maintain prudent borrowing
policies in view of the Sierra Leone’s vulnerability to exogenous shocks. While the government did
not accumulate arrears on external debt obligations under the program, it contracted some loans on
non-concessional terms breaching a quantitative performance criterion under the program; waivers
were granted by the IMF Executive Board in the context of program reviews.
14. An extensive structural reforms agenda was pursued under the program. Most objectives
were met, albeit with delays in some instances. A review of petroleum pricing was carried out to
restore taxes on retail sales of petroleum products; the Domestic Tax Department (DTD) was created;
GST administration was integrated within the Large Taxpayer Office; amendments to the
Government Budget and Accountability Act and the Financial Management Regulation were
submitted to parliament to ensure that only viable capital projects enter into the budget; a pay
reform plan for public servants was put in place; all eligible taxpayers were transferred to the
Medium Taxpayer Office (MTO); regulations to implement a Public Investment Plan, fully integrated
with the budget process, were published; a high-level cash management committee was established;
BSL credit to government was formally capped at 5 percent of previous years’ revenue to reduce
fiscal dominance; regulation and supervision of the financial sector improved and central bank
independence increased under amendments to the BSL and Banking Acts adopted by parliament in
late 2011; the government’s shares in Rokel Commercial Bank were offered for sale through the
stock exchange; BoSL prepared revised prudential guidelines consistent with the Banking Act; and a
credit reference bureau was set up.
15. In spite of progress discussed above, important challenges remain. Poverty, unemployment,
and underemployment are high, and access to public and social services is limited. In addition,

SIERRA LEONE
52 INTERNATIONAL MONETARY FUND
growth prospects are hindered by numerous obstacles, including insufficient power supply and road
networks, and limited access to financial services.
Agenda for Prosperity
16. Although significant progress has been made since the end of the civil conflict toward social
stability and a sustainable macroeconomic position, more durable poverty reduction and growth
efforts are needed in conjunction with sound macroeconomic management. Building on recent
progress, the government intends to address remaining challenges and accelerate Sierra Leone’s
development through steadfast implementation of the PRS, the Agenda for Prosperity (AfP). It is
recognized under the AfP that economic growth is fundamentally important for poverty reduction
and that growth-promoting policies must be environmentally, socially, and economically,
sustainable. Moreover, it is hoped that effective management of natural resources holds the key to
unlocking wide-ranging environmental and socio-economic benefits to the population at large. A
key objective of the PRS is inclusive, diversified, and sustainable, economic growth, which goes hand
in hand with employment generation and income equality. The ECF-supported program seeks to
underpin this effort by facilitating high quality public investment and growth enhancing reforms in
the context macroeconomic stability. In addition to addressing the efficiency of public investment,
the structural benchmarks under the program focus on Public Financial Management Reforms and
the legal and operational infrastructure for effective revenue mobilization, particularly as it relates to
natural resource revenue. Gaps in private sector development and financial sector development are
addressed in parallel. An indicative floor on social spending under the program ensures consistency
with poverty reduction and growth objectives.
17. The AfP defines the development path for the country for the period 2013–18. The Agenda
comprises eight sectoral pillars: (i) economic diversification to promote inclusive growth; (ii) natural
resources management; (iii) human development; (iv) competitiveness; (v) labor and employment;
(vi) social protection systems; (vii) governance and public sector reforms; and (viii) gender equality
and women’s empowerment.
18. Economic diversification to promote inclusive growth. The long term economic growth
target is annual GNI growth of 6.7 percent, and GNI per capita growth of 4.8 percent. Private
sector-led growth and diversification across several competitive sectors would increase value-added
and generate gender-equitable employment. Policy measures in the agriculture sector, historically
the largest sector of the economy, would address smallholder commercialization and larger-scale
agro-based production. A number of regulatory, educational, and investment related sector-specific
measures will be taken to improve the conditions for growth in fisheries, manufacturing, and

SIERRA LEONE
INTERNATIONAL MONETARY FUND 53
tourism, all of which currently perform below potential. The ECF-supported program seeks
specifically to support private sector development of small- and medium-sized enterprises in the
sectors and reduce transaction costs with respect to trade.
19. Managing natural resources. Natural resources revenue from both renewable and
non-renewable sources would contribute significantly to growth and poverty reduction. Strong
coordination across-sectors and among agencies and actors within sectors would be essential.
Resource sector activities include mineral resources, fisheries and marine resources, water resources,
land management, forestry management, and oil and gas development. The government would
channel natural resource revenues to transformation activities and to sustain inclusive economic
development. The ECF-supported program seeks to advance the fiscal regime for extractive
industries particularly with respect to the legislative framework and revenue mobilization and
management. A Transformation Development Fund would be established under the umbrella of a
broader Natural Resource Revenue Fund. Strategies are being devised with respect to the
management of key resource categories, including:
Mineral resources. The National Minerals Agency will lead in implementing detailed sector
strategies to ensure that Sierra Leone benefits from minerals exploitation and that negative
externalities are minimized. In addition to regulating larger-scale mines, strategies focus on
regulation and efficiency of artisanal mines. Community Development Agreements will facilitate
improved welfare in mining communities.
Marine Resources. Priority areas include the reduction of over-fishing, which will be addressed
by taking action against illegal fishing, and the slowing of coastal erosion that will be addressed
in consultation with relevant stakeholders.
Water resource management. Given ample water resources but an underdeveloped
distribution system, the government would take action to develop water resources, responding
sustainably to the needs of society and the economy.
Land management. Key priorities include a legal framework for land ownership, developing
land-use planning, creating sustainable infrastructure for social improvement and economic
growth, and training farmers in sustainable land and water practices.
Forests. Redesigned institutional and policy frameworks will coordinate the forestry sector to
address competing demands. Sustainable management would seek to address a broad range of
objectives: forest conservation, watershed regulation, traditional exploitation, economic
development and job creation, eco-tourism, biodiversity and climate change.

SIERRA LEONE
54 INTERNATIONAL MONETARY FUND
Oil and Gas. Oil exploration has yielded promising results and commercial production could be
developed shortly. The government is putting in place an institutional and fiscal framework to
regulate the industry and ensure that Sierra Leone benefits from oil and gas in a transparent
manner.
Electromagnetic Spectrum. Future potential in this sector will be explored.
20. Accelerating human development. Human development would be accelerated through
improving education quality and access, providing extensive health services, controlling HIV/AIDS,
providing safe water and improved sanitation, population policy, including reducing migration to the
cities and slowing fertility and teenage pregnancy, and mainstreaming gender parity. Education
access, equity, and quality, would be improved at all levels, achieving high literacy, and developing a
labor force with the skills demanded by the employment-generating sectors of the economy. Health
care will build on the free health care initiative, scaled-up nutrition programs, expanding
immunization, and increased access to water and sanitation.
21. Promoting competitiveness. Economic growth will be determined by the success of
Sierra Leone’s companies and industries, enabled by a supportive business environment, including
an institutional framework conducive to private sector development, adequate infrastructure, access
to credit, and availability of skilled labor. Infrastructure investment would have to increase in the
areas of transportation, power, water, ICT, and financial services. Competitiveness will require
partnership between public and private sectors, and coordination among MDAs and development
partners. Government is giving priority to removing the wide range of identified constraints to
private sector development, and to building the necessary supportive environment and
infrastructure. Agriculture, energy and transportation are being given priority in the implementation
of the AfP. Hence, key transformational projects under the AfP would include agriculture irrigation
projects, hydro electric dams, and a new airport on the mainland. The government believes, in
particular, that the construction of a new airport will alleviate the high cost, both time and financial,
and help circumvent the risks in travelling across the Rokel Bay to and from the current airport
(Lungi International Airport). In doing so, it would facilitate unhindered access to the capital city and
the interior of the country. Furthermore, the new airport will help promote regional integration,
increase freight and passenger traffic, enhance government revenue, employment, and other
linkages with the rest of the economy. Also, given Sierra Leone’s geographical location, the new
airport has the potential to serve as a regional hub between Africa and North and South America.
Preliminary estimates put the cost of the project at US$312 million (6.6 percent of 2013 GDP). The
government is looking into options for its financing from its creditors, notably Exim Bank China,
under the Chinese Preferential Concessional Loan Facility. The government is aware of the large

SIERRA LEONE
INTERNATIONAL MONETARY FUND 55
magnitude of the project cost, and its potential implications for government finances. It will,
therefore, seek to obtain concessional terms for the selected financing option, to ensure consistency
with policy commitments under the ECF-supported program being requested from the IMF. The
government will pursue the project if it is economically viable. It will work closely with Sierra Leone’s
development partners, including the World Bank to assess the project’s economic feasibility, and
with IMF staff on the project’s macroeconomic impact, particularly for external debt and fiscal
sustainability. To facilitate these assessments all documentation, including agreements related to the
airport as well as other large infrastructure projects and their financing will be made available before
they are finalized and prior to the execution of the projects.
22. Labor and employment. Unemployment and under-employment are high, especially
among youth and women and much of the labor force has little training or education. Informal
employment remains pre-dominant and growing but quality and productivity of informal work is
low. Training and education, small-enterprise development, and access to credit, are seen as
potential drivers of progress while employment quality is crucial for pro-poor growth. The AfP
strategy is to encourage all economic actors to provide productive and adequately remunerative
employment opportunities, for all who are willing to work, including vulnerable groups, while
improving working conditions.
23. Strengthen social protection. Over half the population lives in poverty and 45 percent of
households are food insecure. Inequity based on gender, age, location, education and income are
commonplace. Malnutrition is widespread. Barriers to female education include high teenage
pregnancy and early marriage. Social protection services are fragmented and inadequate in coverage
and targeting. The AfP stresses implementation of the 2011 National Social Protection Policy, to
complement the positive and general benefit of economic growth. Strategies to develop social
protection policies and increase capacity are under discussion. The aim is to extend social insurance
interventions, provide basic social protection packages for the vulnerable, and strengthen support
for nutrition, health care, education, and housing.
24. Governance and public sector reforms. Key reforms measures are focused on developing a
capable and transparent public service with an appropriate skills mix underpinned by public sector
pay reform, the development of agencies, institutions, policies, and data systems. Extensive PFM
measures at the central and local government levels address budgeting, expenditure management,
revenue mobilization, auditing, public procurement, and fiscal decentralization.

SIERRA LEONE
56 INTERNATIONAL MONETARY FUND
25. Gender equality and women’s empowerment. The government has committed to gender
equality and women’s empowerment, signing a range of policy declarations and enacting legislation.
A number of specific measures are being developed.
26. The cost of implementing the AfP. Over the implementation period 2013–18, the cost is
estimated at around US$5.7 billion of which US$3.2 billion are identified partner commitments and
US$0.5 billion government allocations. The funding gap remaining is approximately US$2 billion. A
consultative group meeting to raise funds for the strategy is being planned. The government will
explore the potential for attracting both traditional and non-traditional sources of funding through
the following initiatives:
Intensify domestic revenue mobilization. In addition to raising new mining revenue, domestic
revenue mobilization will entail improving the efficiency of tax and non-tax collection and
enforcing compliance. The NRA will continue to implement its modernization plan and improve
on field audits, collection of tax arrears and curbing smuggling activities. The implementation of
GST will be strengthened, and investment incentives streamlined and better applied.
Broaden and deepen development partner support. To facilitate increased support from
traditional donors, the government will work toward further improving its Country Policy and
Institutional Assessment (CPIA) score.
Access funding through the Millennium Challenge Corporation (MCC). MCC offers a way to
fight poverty through economic growth and good governance.
Prioritize Public-Private Partnerships (PPP). Private sector participation in the funding and
implementation of key projects, particularly in power, water, roads, ports, airports, and telecom,
will be maximized through PPPs.
Explore carbon trading. Government will explore the carbon trading potential.
Explore issuance of Diaspora bonds. Such bonds would finance large scale infrastructure
development projects.
Intensify and broaden corporate social responsibility. Corporate social responsibility would
provide fiscal space for government to pursue certain programs.
Access to international capital markets. The government is working with partners to obtain a
sovereign credit rating.

SIERRA LEONE
INTERNATIONAL MONETARY FUND 57
Medium-Term Macroeconomic Framework
27. Medium-term objectives are to: (i) achieve a real GDP growth (excluding iron ore) of
7 percent by 2017; (ii) reduce inflation from 12 percent in 2012 to about 5.4 percent by 2017; and
(iii) improve gross reserve coverage to about 4 months of non iron-ore related imports by the end of
the program period.
28. Economic growth (excluding iron ore) is projected to reach 7 percent in 2017, up from
6 percent in 2013, due to continued public investment scaling up, increased productivity, notably in
agriculture, and sustained activity in construction and services. Non-iron ore activity will also benefit
from upstream activity in iron ore mining where production (under phase I of the largest mine) is
expected to increase through 2015, and level off starting in 2016. Consequently, total real GDP
growth is forecast to rise from 13.3 percent in 2013 to 14 percent in 2014 and decelerate to
12.4 percent in 2015 and 5.2 percent by 2017.
29. Inflation is projected to decline from 9 percent in 2013 to 5.4 percent in 2017, on account of
continued prudent monetary and exchange rate policies. It is also expected that government-
supported programs in agriculture would contribute to increased supply of rice and other key food
crops, and help dampen food inflation. In addition, monetary policy would be adequately calibrated
to contain inflationary pressures, and macro-prudential measures would be geared towards a
healthy expansion of private credit.
30. In the external sector, the current account deficit would narrow from about 20 percent of
non-iron ore GDP in 2013 to around 7 percent by 2017 as exports are projected to increase, notably
in mining and agriculture, while imports would moderate over the medium term, partly reflecting
lower FDI flows than in 2011–12. The improvement in the external current account, combined with
sustained capital inflows is expected to increase gross international reserves from 3.2 months of
imports (excluding iron-ore related imports) in 2013, to 4.1 months by 2017.
31. The government’s medium-term fiscal strategy aims to strengthen revenue collection,
improve expenditure management, and reduce domestic debt. The revenue efforts will focus on:
(i) broadening the tax base; (ii) reducing customs and GST duty waivers; (iii) combating tax evasion;
and (iv) strengthening the National Revenue Administration through administrative reforms and
increased use of Information Technology. The projected expansion in economic activity and
increased iron ore exports will also support the government’s revenue mobilization efforts. On this
basis, revenue is projected to increase from 12.4 percent of non-iron ore GDP in 2013, to
13.5 percent in 2017; with revenue from mining rising from 1.2 percent of non-iron ore GDP to

SIERRA LEONE
58 INTERNATIONAL MONETARY FUND
1.8 percent for the period. Total expenditure will decline from 21.9 percent of non-iron ore GDP in
2012 to 19.7 percent in 2013, which reflects the unwinding of one-off expenditure related to
elections and emergency programs. Total expenditure is projected to average about 20.5 percent of
non-iron ore GDP for 2014–17, with more resources channeled to investment. It is projected that
wages and salaries will stabilize at 6 percent of non-iron ore GDP under the ongoing pay reform.
Under this strategy, domestic borrowing would gradually decline, allowing the stock of public
domestic debt to decline from 12.7 percent of non-iron ore GDP in 2013, to 11.2 by 2018.
32. The government has initiated a long-term PFM Reform Strategy and begun the process of
modernizing the PFM system. The 2014–17 phase of the strategy will target improvements in the
quality of public financial management to bolster fiscal discipline, the strategic allocation of
resources, and the efficiency of public service delivery. The necessity of addressing these weaknesses
and establishing a tightly controlled fiscal environment is made much more urgent by the need to
manage the substantial streams of revenue expected by 2015. Revenue mobilization and rigorous
planning and control of investment spending are needed to achieve the transformation aimed for
under the Agenda for Prosperity.
Policies and Reforms for 2013–14
A. Fiscal Policy and Public Financial Management Reforms
33. Fiscal consolidation efforts will continue through enhanced revenue mobilization and
expenditure controls. For 2013, the revised budget, tabled in parliament in early July (Prior Action),
aims to enhance fiscal consolidation efforts As revenue mobilization actions are intensified and
expenditure controls are strengthened through public financial management measures, the overall
deficit (excluding grants) is budgeted at Le 1,172 billion, down from Le 1,487 in 2012. To meet the
fiscal program targets, expenditure on goods and services, transfers and domestically financed
investment will be scaled back in 2013 and domestic bank and nonbank financing will decline from
2.3 percent of non-iron ore GDP in 2012, to 1.9 percent. For 2014, the overall deficit is projected to
increase to Le 1,571 billion. In both years, however, domestic financing is expected to decline from
Le 347 billion in 2012 to Le 337 billion in 2013 and Le 311 billion in 2014. Other sources of financing
include privatization receipts, net external borrowing, and external budget support. In the event of a
shortfall in expected domestic revenue, the government will take corrective measures, including
scaling back non-priority spending and domestically financed investment in order to avoid a buildup
of unpaid bills and domestic debt.

SIERRA LEONE
INTERNATIONAL MONETARY FUND 59
34. Revenue is projected at Le 2,197 billion and Le 2,581 for 2013 and 2014 respectively.
Revenue performance will be supported by continuing sustained economic activity in the non-iron
ore economy, and the projected increase in royalties from the mineral sector. Specific measures to
support the revenue target include: (i) the strengthening of the system for collecting taxes on
petroleum products to increase efficiency, and curb fraud. To this end, special NRA accounts will be
opened at the commercial banks for effective monitoring of collections; (ii) the reduction of duty
waivers, with a revenue impact of Le 16.9 billion; (iii) strengthening of Information Technology
systems at the National Revenue Authority (NRA) to increase audit capacity and enhance monitoring
of payments for the goods and services tax; and (iv) the setting up of a resource revenue
administration unit at NRA (structural benchmark).
35. Total expenditure is budgeted at Le 3,368 billion for 2013, compared with Le 3,360 billion in
2012. This marginal decline reflects the net impact of: (i) the unwinding of expenditure executed in
2012 for the general elections; (ii) the 12 percent wage increase that took effect in June, in the
context of the civil service pay reform including teachers, police and the military personnel, and
planned recruitment in priority sectors estimated at 280 people; and (iii) higher interest payments on
domestic debt due to the conversion of the existing stock of non-negotiable non-interest bearing
bonds (NNIB) held by BoSL into marketable instruments for the conduct of monetary policy. After
the significant increase in 2012, domestically financed investment will stabilize at Le 463 billion, with
the focus on completing ongoing infrastructure projects. It is projected to increase by 35 percent in
2014, as implementation of programs under the Agenda for Prosperity begins.
36. Measures introduced in 2012 to enhance expenditure and Treasury cash flow management
will be maintained and enhanced in 2013 to consolidate progress in monitoring budget execution
processes, align expenditure commitments with available resources, and continue supporting
coordination between fiscal and monetary policy. Consequently, a rolling treasury cash flow table
has been prepared monthly since the approval of the revised 2013 budget by parliament in July.
New measures were also taken in early 2013 to improve budget execution and enhance fiscal
discipline: (i) a memorandum of understanding was signed with commercial banks to reduce delays
in transferring balance on NRA transit accounts to the Treasury account at the BoSL; and (ii) the 2013
expenditure commitments and issuance of payment orders will be stopped at end-October and
end-November respectively. The government is confident that with these measures float
transactions will be limited.
37. The government will continue implementing measures needed to improve public financial
management. In this context: (i) the budget preparation process will be strengthened to ensure its
timely transmittal to parliament; (ii) budget execution will be improved to avoid accumulation of

SIERRA LEONE
60 INTERNATIONAL MONETARY FUND
float transactions and accumulation of arrears at the end of the year, as well as extrabudgetary
spending. The government has taken actions in 2013 to streamline NRA’s transition accounts,
establish a Treasury Single Account (structural benchmark) for end-June 2014), and enhance the
functioning of the Cash Management Committee. In addition, a new PFM bill will be introduced in
parliament by June 2014 (structural benchmark), notably to clarify provisions on supplementary
budgets and contingency funds needed to avoid extrabudgetary spending. The new PFM bill will
also introduce provisions for the establishment of a Natural Resource Revenue Fund; (iii) the
preparation and execution of the public investment program will be enhanced to ensure that
selected projects are consistent with priorities in the Agenda for Prosperity, and that adequate
feasibility studies as well as realistic costing of projects are carried out before execution. A survey of
ongoing public investment projects was carried out in early 2013, and its results will be used to
enhance the predictability of expected payments on ongoing projects, and enhance project
preparation to contain budget overruns. To strengthen the monitoring of public capital expenditure
execution, bi-annual reports will be prepared to provide information on expenditure commitments,
payments and remaining balances compared with budgetary appropriations. The first report was
prepared for budget execution at end-June 2013 (Prior Action). In 2013–14, the government plans
to take the following measures, all structural benchmarks under the IMF-supported program:
Submit to parliament the Extractive Industries Revenue Bill, including a resource rent tax
(December 2013);
Implement the small taxpayer regime (December 2013), to improve voluntary compliance and
broaden the tax base;
Introduce a new Tax Administration Act to harmonize and clarify tax procedures, particularly with
regard to extractive industries (December 2014);
Establish and staff an operative public investment program unit in the Ministry of Finance and
Economic Development.
Set up of a transparent Natural Resource Revenue Fund sub-account under the Treasury Single
Account (TSA) to support transparent management of expected higher resource revenue
(June 2014); and
Complete a three-year public investment plan (PIP), fully integrated with the budget process and
the revised MTEF for 2014–18, to be submitted to parliament with the 2015 budget, to support
the implementation of the new PRSP, and enhance selectivity in public investments.

SIERRA LEONE
INTERNATIONAL MONETARY FUND 61
38. In preparation for higher mining revenue, the government is working towards a medium-
term framework that will anchor domestic fiscal balance around a sustainable level. In line with best
practice modalities for managing planned budget surpluses, a counter-cyclical fiscal rule has been
devised with technical assistance from the IMF Fiscal Affairs Department, based on a non-resource
fiscal balance. The GBAA would be amended to incorporate the fiscal rule, the stabilization and
savings structures for natural resource revenues, and the use of resource revenues within the budget.
These amendments will be part of the abovementioned new PFM law.
B. Monetary and Exchange Rate Policies and Financial Sector Issues
39. Monetary policy will continue to target price stability over the medium term. Although price
pressures have been declining since mid-2011, reaching and maintaining single-digit inflation levels
will require a continuing tight monetary policy stance to enhance policy credibility and anchor
inflation expectations. Consistent with this objective, reserve money growth is projected to decline to
14.2 percent in 2013 (18.5 percent in 2012).
40. The Bank of Sierra Leone (BoSL) and the Ministry of Finance and Economic Development will
undertake steps to improve the efficiency of the government securities market and foster the
development of the money market. The BoSL will finalize guidelines for a primary dealer system for
government securities by June 2014 (structural benchmark). This will facilitate market efficiency by
making government securities easier to buy and sell, encourage secondary market trading, promote
demand for government securities (including for new types of securities, such as longer-term
bonds), and facilitate efficient liquidity management through open market operations. An issuance
calendar for government securities is also being prepared. By announcing a plan in advance for all
maturities and having fewer but larger issues, market participants will be able to plan for and market
these issues, which will enhance the success of issues and encourage more active liquidity
management by the banks.
41. The BoSL will maintain the flexible exchange rate regime. Interventions in the foreign
exchange market will be limited to transactions aimed at smoothing excessive short-term
fluctuations. The BoSL will remain attentive to challenges arising from the management of foreign
currency denominated government revenue. It will introduce a wholesale foreign exchange auction
system by June 2014 (structural benchmark), to replace the current retail auction system offered to
selected importers. In addition, the BoSL will finalize a revised Foreign Exchange Act, which aligns
Sierra Leone’s legislation in this area with that of its Economic Community of West African States
(ECOWAS) and West African Monetary Zone (WAMZ) partners.

SIERRA LEONE
62 INTERNATIONAL MONETARY FUND
42. The Bank of Sierra Leone recognizes the need to build up foreign exchange reserves in light
of the economy’s vulnerability to external shocks. It aims to accumulate an adequate level of foreign
international reserves to gradually increase the coverage to 3.9 months of imports (excepting
imports related to iron ore projects) by 2016, to buttress macroeconomic stability while creating
policy buffers.
43. The Bank of Sierra Leone will actively pursue initiatives aimed at strengthening the financial
system. It will enhance its supervisory capacity, and offsite supervision through the credit reference
bureau and the rolling out of a new software platform for real time reporting of deposit money bank
balances, as well as preparing a road map to guide the transition to risk-based supervision by June
2014 (structural benchmark). This will help BoSL to better monitor vulnerabilities in the financial
system and facilitate eventual adoption of Basel II Core Principles of Banking Supervision. To support
financial intermediation, the authorities have prepared the Securities Act, which is intended to
promote the development of the Stock Exchange, and the Collective Investment Scheme Act that will
establish the legal framework for investment fund managers. Both measures will be adopted by
cabinet in coming weeks.
44. To strengthen financial inclusion and broaden access to financial services, BoSL will seek to
improve the credit environment, notably by: (i) preparing a development strategy for small- and
medium-sized enterprises by mid-2014 (structural benchmark), in collaboration with the Ministry of
Finance and Economic Development and with the support of the International Finance Corporation;
(ii) expanding the existing credit reference database to assess credit worthiness; and (iii) enacting the
Borrowers and Lenders Act, which is needed for establishing a collateral registry to support
execution of collateral on bad loans and improve the credit culture. The monetary authorities will
also work together with development partners on a Financial Inclusion Strategy to improve financial
literacy and business practices.
C. Debt Policy and Management
45. The government will ensure that borrowing policies are compatible with medium- to long-
term debt sustainability. Therefore, it will continue to give priority to grants and highly concessional
loans in meeting financing needs, particularly for infrastructure projects. In view of increasing
challenges for Sierra Leone to obtain external financing on highly concessional terms, the
government would like to request flexibility under the new ECF-supported program for the
financing, on nonconcessional terms, of some socially and economically viable projects for which
concessional funding could not be secured. For 2013–14, such projects include the construction of
two mini dams to provide access to electricity in a rural area.

SIERRA LEONE
INTERNATIONAL MONETARY FUND 63
46. To enhance debt management capacity, a comprehensive Medium-Term Debt Management
Strategy (MTDS) will be prepared by December 2013 (structural benchmark) with assistance from
the IMF and World Bank staffs; and the preparation of a quarterly report on debt commitments
initiated in mid-2012 will continue (structural benchmark). Preparatory work is underway to link the
Debt Recording and Management System (CS-DRMS) with the IFMIS.
Other Structural Reforms
47. The government intends to accelerate implementation of structural reforms, to support
private sector development and enhance growth prospects in the non-mineral economy. The
following actions are planned for 2013–14:
Rehabilitation of the Bumbuna hydroelectric power plant and thermal power generators to
increase energy supply.
Completion of teacher biometric verification exercise and the civil service remuneration survey;
and implementation of measures to strengthen the Public Service Commission.
Simplify processes related to business registration and licensing and construction permits, and
strengthening the fast track commercial courts.
Establish an SME Fund to finance new centers for training and skills development, including
business management, accounting, and project design.
Introduce a one-stop window for imports clearance (Structural benchmark).
48. The government is aware that additional efforts are needed to improve the quality and
timeliness of economic statistics. It plans to request TA from IMF and other development partners to
address existing weaknesses, including for the producer price index, balance of payments statistics,
mainly for the capital and financial accounts, and agriculture data.
Program Monitoring
49. The program will be monitored on a semi-annual basis, through quantitative targets and
structural benchmarks (Tables 1 to 2). Quantitative targets for end-December 2013, end-June and
end-December 2014 are performance criteria, while those for end-September 2013, end-March
and end-September 2014 are indicative targets. The first review under the program will be
completed by June 15, 2014; the second and third reviews will be completed by December 15, 2014
and June 15, 2015, respectively.

Dec. 2012
Stock Sept. Dec. Mar. Jun. Sept. Dec.
Performance criteria
Net domestic bank credit to the central government (ceiling) 1,356 230 246 71 145 105 245
Net domestic assets of the central bank (ceiling) -284 92 43 -18 -32 -50 32
Gross foreign exchange reserves of the central bank, US$ millions (floor) 420 11 31 13 34 39 53
Ceiling on new nonconcessional external debt (in $ million) 2/ 3/ … 30 30 30 30 30 30
Outstanding stock of external debt owed or guaranteed by the public sector … 0 0 0 0 0 0with maturities of less than one year (ceiling) 2/
External payment arrears of the public sector (ceiling) 2/ … 0 0 0 0 0 0
Indicative target
Total domestic government revenue (floor) … 1,604 2,197 598 1,262 1,884 2,581
Poverty-related expenditures (floor) … 631 1,063 262 559 815 1,155
Domestic primary balance (floor) -132 -313 -128 -255 -325 -476
Memorandum items:
External budgetary assistance (US$ million) 4/ … 37.2 74.3 20.0 28.7 50.7 56.7Net credit to government by nonbank sector 5/ … 63.4 91.1 -1.3 13.2 15.4 66.7ECF disbursements (SDR millions) 13.7 0.0 0.0 13.7 0.0 13.7Exchange rate (Leones/US$) 4,334 4,334 4,334 4,334 4,334 4,334 4,334
1/ The performance criteria and indicative targets are defined in the Technical Memorandum of Understanding (TMU); end-June and end-December are performance criteria, and end-March and end-September are indicative targets.
2/ These apply on a continuous basis.
3/ The ceiling covers priority loans for the energy sector; for 2013–14, such projects include the construction of two mini dams to provide access to electricity in a rural area.
4/ Including grants and loans.
5/ Comprises treasury bills purchased by the National Social Security and Insurance Trust (NASSIT) and the nonfinancial private sector.
2013 2014
Table 1. Sierra Leone: Quantitative Performance Criteria and Indicative Targets for 2013–141
(Cumulative change from beginning of calendar year to end of month indicated; Le billions, unless otherwise indicated)
SIERRA LEON
E
64 INTERN
ATION
AL MO
NETARY FU
ND

SIERRA LEONE
INTERNATIONAL MONETARY FUND 65
Table 2. Sierra Leone: Structural Benchmarks Under the ECF-Supported Program, 2013–14
Measures Timing Macro Rationale
Immediate Measures
Submit to parliament a supplementary 2013 budget consistent with program objectives (MEFP ¶ 33).
Prior action.
Enhance expenditure management and budget execution monitoring.
Prepare a budget execution report on capital spending at end-June, with a Table providing data on budgetary appropriations, commitments, payments, and balances (MEFP ¶ 37).
Prior action and
bi-annual thereafter
Strengthen execution of the capital budget.
Revenue Mobilization
Submit to parliament the Extractive Industries Revenue Bill, including a resource rent tax (MEFP ¶ 37).
Dec. 2013 Improve the fiscal framework for natural resources management, including with respect to transparency and revenue collection.
Set up a resource revenue administration unit at NRA (MEFP ¶ 34).
Dec. 2013 Formalize the responsibilities of NRA with respect to natural resource revenue and risk management of large companies.
Implement a new small taxpayer regime (MEFP ¶ 37). Dec. 2013 To improve voluntary compliance and raise tax revenue.
Establish a Treasury Single Account (TSA), and streamline NRA’s transition accounts (MEFP ¶ 37).
Establish a Natural Resource Revenue Fund with legal
and procedural characteristics as recommended by FAD TA under the Topical Trust Fund for Managing Natural Resource Wealth (MEFP ¶ 37).
June 2014
December 2014
Facilitate improvement in cash management, including with respect to the timeliness of revenue receipts. Support transparent management of expected large resource revenue.
Introduce a new Tax Administration Act (MEFP ¶ 37). Dec. 2014 Harmonize and clarify tax procedures, particularly with respect to extractive industries.
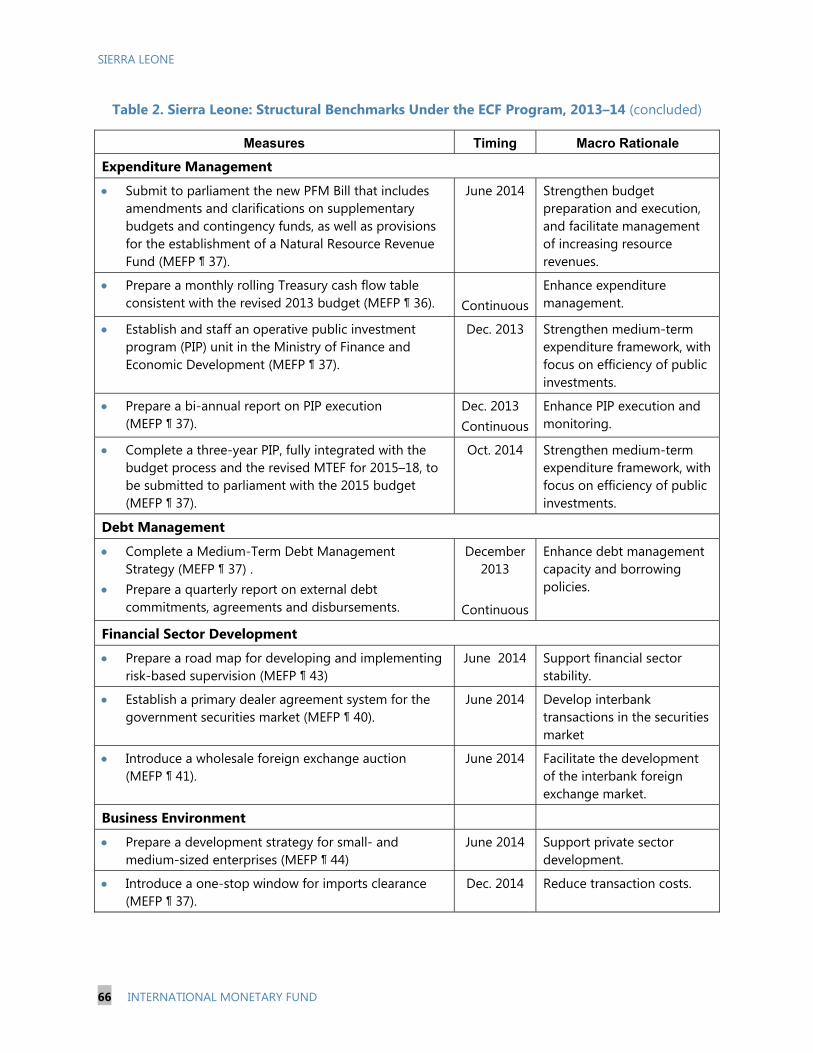
SIERRA LEONE
66 INTERNATIONAL MONETARY FUND
Table 2. Sierra Leone: Structural Benchmarks Under the ECF Program, 2013–14 (concluded)
Measures Timing Macro Rationale
Expenditure Management
Submit to parliament the new PFM Bill that includes amendments and clarifications on supplementary budgets and contingency funds, as well as provisions for the establishment of a Natural Resource Revenue Fund (MEFP ¶ 37).
June 2014 Strengthen budget preparation and execution, and facilitate management of increasing resource revenues.
Prepare a monthly rolling Treasury cash flow table consistent with the revised 2013 budget (MEFP ¶ 36).
Continuous
Enhance expenditure management.
Establish and staff an operative public investment program (PIP) unit in the Ministry of Finance and Economic Development (MEFP ¶ 37).
Dec. 2013 Strengthen medium-term expenditure framework, with focus on efficiency of public investments.
Prepare a bi-annual report on PIP execution (MEFP ¶ 37).
Dec. 2013 Continuous
Enhance PIP execution and monitoring.
Complete a three-year PIP, fully integrated with the budget process and the revised MTEF for 2015–18, to be submitted to parliament with the 2015 budget (MEFP ¶ 37).
Oct. 2014 Strengthen medium-term expenditure framework, with focus on efficiency of public investments.
Debt Management
Complete a Medium-Term Debt Management Strategy (MEFP ¶ 37) .
Prepare a quarterly report on external debt commitments, agreements and disbursements.
December 2013
Continuous
Enhance debt management capacity and borrowing policies.
Financial Sector Development
Prepare a road map for developing and implementing risk-based supervision (MEFP ¶ 43)
June 2014 Support financial sector stability.
Establish a primary dealer agreement system for the government securities market (MEFP ¶ 40).
June 2014 Develop interbank transactions in the securities market
Introduce a wholesale foreign exchange auction (MEFP ¶ 41).
June 2014 Facilitate the development of the interbank foreign exchange market.
Business Environment
Prepare a development strategy for small- and medium-sized enterprises (MEFP ¶ 44)
June 2014 Support private sector development.
Introduce a one-stop window for imports clearance (MEFP ¶ 37).
Dec. 2014 Reduce transaction costs.

SIERRA LEONE
INTERNATIONAL MONETARY FUND 67
Attachment 2. Technical Memorandum of Understanding Freetown, October 1, 2013
Introduction
1. This memorandum sets out the understandings between the Sierra Leonean authorities and the International Monetary Fund (IMF) regarding the definitions of the quantitative performance criteria (PCs) and structural benchmarks (SBs) for the program supported by the Extended Credit Facility (ECF) arrangement, as well as the related reporting requirements. Unless otherwise specified, all quantitative PCs and indicative targets will be evaluated in terms of cumulative flows from the beginning of the period, as specified in Table 3 of the Memorandum of Economic and Financial Policies (MEFP).
2. Program exchange rates.1 For the purpose of the program, foreign currency denominated values for 2013 will be converted into Sierra Leonean currency (leone) using a program exchange rate of Le 4334/US$ and cross rates as of end December 2012.2
Quantitative Performance Criteria
A. Gross Foreign Exchange Reserves of the Bank of Sierra Leone
3. Definition. Unless otherwise noted, gross foreign exchange reserves of the Bank of Sierra Leone (BoSL) are defined as reserve assets of the BoSL. Reserve assets are defined in the IMF’s Balance of Payments Manual (5th ed.) and elaborated in the reserve template of the Fund’s International Reserves and Foreign Currency Liquidity: Guidelines for a Data Template. They exclude foreign assets not readily available to, or controlled by, the monetary authorities.
4. Adjustment clauses. The floor on the change in gross foreign exchange reserves will be adjusted (a) downward (upward) by the amount in U.S. dollars of the shortfall (excess) in programmed external budgetary assistance3—the downward adjustment will be capped at the equivalent of US$20 million; (b) downward (upward) for any shortfall (excess) in the U.S. dollar value of disbursements from the IMF under the ECF arrangement; and (c) upward (downward) for any increase (decrease) in BSL short-term (one year or less in original maturity) foreign currency-denominated liabilities (to residents and nonresidents).
1 The source of the cross exchange rates is International Financial Statistics. 2 For calculating program targets for 2013, all end 2012 stock variables will be based on program exchange rate of Le 4334/US$. 3 External budgetary assistance is defined as program grants and program loans, excluding HIPC assistance.

SIERRA LEONE
68 INTERNATIONAL MONETARY FUND
B. Net Domestic Assets of the BSL
5. Definition. Net domestic assets (NDA) of the BoSL are defined as the end-period stock of the reserve money less the end-period stock of net foreign assets calculated at the program exchange rates. Reserve money includes currency issued (equal to currency outside banks plus cash in vaults), deposits of commercial banks with the BoSL and the BoSL liabilities to other private sector. Net foreign assets of the BSL are defined as gross foreign exchange reserves (defined above) minus foreign liabilities. Foreign liabilities are defined as foreign currency-denominated liabilities of the BSL to nonresidents and the outstanding use of Fund credit. For program purposes, foreign liabilities exclude SDR allocation.
6. Adjustment clauses. The ceiling on changes in NDA of the BoSL will be adjusted upward (downward) by the leone value of the shortfall (excess) in the external budgetary assistance—the upward adjustment will be capped at the equivalent of US$20 million.
C. Net Domestic Bank Credit to the Central Government (NCG)
7. Definition. NCG refers to the net banking system’s claims on the central government as calculated by the BSL. It is defined as follows:
a. the net position of the government with commercial banks, including: (a) treasury bills; (b) treasury bearer bonds; and (c) loan and advances of commercial banks to the government; less government deposits in commercial banks;
b. the net position of the government with the BoSL, including: (a) treasury bills and bonds, excluding holdings of special bonds provided by government to cover the BSL losses; (b) the stock of non-negotiable non-interest bearing securities (NNNIBS); (c) the difference between converted NNNIBS into treasury bills and proceeds from their sales; (d) ways and means; and (e) any other type of direct credit from the BoSL to the government; less (a) central government deposits; and (b) HIPC and MDRI relief deposits.
8. Adjustment clauses. The ceiling on changes in NCG will be adjusted (a) upward (downward) by up to the leone value of the shortfall (excess) in external budgetary assistance—the upward adjustment will be capped at the equivalent of US$20 million; (b) downward (upward) by the excess (shortfall) in the leone value of net issues of government securities to the nonbank private sector vis-à-vis the program assumption (as specified in the memorandum items in Table 3 of the MEFP).
9. Data source. The data source for the above will be the series “Claims on Government (net)”, submitted to the IMF staff and reconciled with the monthly monetary survey prepared by the BSL.
10. Definition of Central Government. Central government is defined for the purposes of this memorandum to comprise the central government and those special accounts that are classified as central government in the BSL statement of accounts. The National Social Security and Insurance Trust and public enterprises are excluded from this definition of central government.

SIERRA LEONE
INTERNATIONAL MONETARY FUND 69
D. External Payment Arrears of the Public Sector
11. Definition. External payment arrears of the public sector are defined to include all debt-service obligations (interest and principal) arising from loans contracted or guaranteed by the public sector. For the purposes of this PC, the public sector comprises the central government, regional government, all public enterprises and the BoSL. The non-accumulation of external arrears is a continuous performance criterion during the program period. For the purposes of this performance criterion, external arrears are obligations that have not been paid on due dates (taking into account the contractual grace periods, if any). Excluded from this PC are those debts subject to rescheduling or restructuring, or are under litigation. This PC will apply on a continuous basis.
E. New Nonconcessional External Debt Contracted or Guaranteed by the Public Sector with an Original Maturity of One Year or More
12. Definition. Those are defined as all forms of new debt with original maturity of one year or more contracted or guaranteed by the public sector (see paragraph 11 for definition of public sector) based on the residency of the creditor. This PC applies not only to debt as defined in the Guidelines on Performance Criteria with Respect to Foreign Debt (Decision No. 12274 (00/85), August 24, 2000, Point 9, as revised on August 31, 2009, (Decision No. 14416-(09/91)) but also to commitments contracted or guaranteed for which value has not been received. Excluded from this PC are disbursements from the IMF and those debts subject to rescheduling. For the purposes of this PC, the “public sector” is as defined in paragraph 11 above. This PC will apply on a continuous basis.
13. Any external debt of which the net present value, calculated with the reference interest rates mentioned hereafter, is greater than 65 percent of the nominal value (grant element of less than 35 percent) is considered nonconcessional, with the exception of IMF lending. The discount rate used for the purpose of calculating concessionality is 5 percent. The government will report any new external borrowing and its terms to Fund staff before external debt is contracted or guaranteed by the government.
F. External Short-Term Debt Contracted or Guaranteed by the Public Sector
14. Definition. External short-term debt is defined as external debt stock with a maturity of less than one year contracted or guaranteed by the public sector (see paragraph 11 for definition of public sector). Debt is defined in Annex I of this TMU. For this purpose, short-term debt will exclude normal trade credit for imports. For the purposes of this PC, the public sector is as defined in paragraph 11 above. This PC will apply on a continuous basis.
SIERRA LEONE
70 INTERNATIONAL MONETARY FUND
Quantitative Indicative Target
A. Domestic Primary Balance
15. Definition. Central Government Revenue less expenditures and net lending adjusted for interest payments and foreign financed capital spending.
B. Domestic Revenue of Central Government
16. Definition. The floor on total domestic central government revenue is defined as total central government revenue, as presented in the central government financial operations table, excluding external grants.
C. Poverty-Related Expenditures
17. Definition. Poverty-related expenditures refer to those expenditures in the areas identified in Table 2 of the Sierra Leone HIPC Decision Point Document.
Program Monitoring
18. The Sierra Leonean authorities shall maintain a program-monitoring committee composed of senior officials from the MoFED, the BSL, and other relevant agencies. The committee shall be responsible for monitoring performance under the program, recommending policy responses, informing the IMF regularly about the progress of the program, and transmitting the supporting materials necessary for the evaluation of PCs and benchmarks. The committee will provide monthly reports to the IMF on progress in implementing the program’s quantitative targets and structural benchmarks.

SIERRA LEONE
INTERNATIONAL MONETARY FUND 71
Annex. Implementation of the Revised Guidelines on Performance Criteria with Respect to Foreign Debt
The term “debt” has the meaning set forth in point No. 9 of the Guidelines on Performance Criteria with Respect to Foreign Debt adopted on August 24, 2000, which reads as follows: “(a) For the purpose of this guideline, the term “debt” will be understood to mean a current, i.e., not contingent, liability, created under a contractual arrangement through the provision of value in the form of assets (including currency) or services, and which requires the obligor to make one or more payments in the form of assets (including currency) or services, at some future point(s) in time; these payments will discharge the principal and/or interest liabilities incurred under the contract. Debts can take a number of forms, the primary ones being as follows: (i) loans, i.e., advances of money to obligor by the lender made on the basis of an undertaking that the obligor will repay the funds in the future (including deposits, bonds, debentures, commercial loans, and buyers’ credits) and temporary exchanges of assets that are equivalent to fully collateralized loans under which the obligor is required to repay the funds, and usually pay interest, by repurchasing the collateral from the buyer in the future (such as repurchase agreements and official swap arrangements); (ii) suppliers’ credits, i.e., contracts where the supplier permits the obligor to defer payments until sometime after the date on which the goods are delivered or services are provided; and (iii) leases, i.e., arrangements under which property is provided which the lessee has the right to use for one or more specified period(s) of time that are usually shorter than the total expected service life of the property, while the lessor retains the title to the property. For the purpose of the guideline, the debt is the present value (at the inception of the lease) of all lease payments expected to be made during the period of the agreement excluding those payments that cover the operation, repair, or maintenance of the property. (b) Under the definition of debt set out above, arrears, penalties, and judicially awarded damages arising from the failure to make payment under a contractual obligation that constitutes debt are debt. Failure to make payment on an obligation that is not considered debt under this definition (e.g., payment on delivery) will not give rise to debt”. (c) Excluded from this performance criterion are normal import-related credits, disbursements from the IMF, and those debts subject to rescheduling arrangements.”

SIERRA LEONE
72 INTERNATIONAL MONETARY FUND
Sierra Leone: Summary of Data Reporting to IMF Staff
Type of Data Tables Frequency Reporting Deadline
Real sector National accounts Annual End of year + 9 months
Revisions of national accounts Variable End of revision + 2 months
Disaggregated consumer price index Monthly End of month + 2 weeks
Public finance
Net government position and details of nonbank financing, including the stock of the float, treasury bills, and bonds, as well as privatization receipts
Monthly End of month + 6 weeks
Government flow-of-funds table (Government Financial Operations Table) with supporting documentation (final) and presented on commitment and cash bases
Monthly End of month + 6 weeks
Petroleum product prices and tax receipts by categories of petroleum products
Monthly End of month + 6 weeks
Stock of outstanding payment commitments with a breakdown between current and capital expenditures
Monthly End of month + 6 weeks
Import duty exemptions by end-users and tariff regimes and estimates of corresponding revenue losses
Quarterly End of quarter + 6 weeks
Monetary and financial data
Monetary survey Monthly End of month + 6 weeks
Balance sheet of the BSL Monthly End of month + 6 weeks
Consolidated balance sheets of commercial banks
Monthly End of month + 6 weeks
BSL monitoring sheet of net financing of the financial sector to the government
Monthly End of month + 6 weeks
BSL monitoring sheet of treasury bills and bonds holdings
Monthly End of month + 6 weeks
Borrowing and lending interest rates Monthly End of month + 6 weeks
Results of foreign exchange and Treasury Bills auctions
Weekly End of week + 3 days
Stocks of government securities Monthly End of month + 6 weeks
Banking supervision ratios Quarterly End of quarter + 8 weeks

SIERRA LEONE
INTERNATIONAL MONETARY FUND 73
Sierra Leone: Summary of Data Reporting to IMF Staff (concluded)
Type of Data Tables Frequency Reporting Deadline
Monetary and financial data
Gross official foreign reserves Weekly End of week + 1 week
Foreign exchange cash flow table Monthly End of month + 3 weeks
Revised balance of payments data Monthly When revisions occur
Exports and imports of goods (including the volume of key minerals and fuels)
Monthly End of month + 3 months
External debt Outstanding external arrears and repayments (if applicable)
Monthly End of month + 4 weeks
Details of all new external borrowing and guarantees provided by government on new borrowing, including the associated concessionality calculation (percentage) for each new loan.
Monthly End of month + 4 weeks
External debt service payments (separately on principal and interest payment) to each creditor, including and excluding new disbursements in the debt recording system. Also, including and excluding HIPC relief.
Monthly End of month + 4 weeks
Report on the stock of debt outstanding, and loan agreements under discussion
Quarterly End of month + 3 months
HIPC initiative and MDRI monitoring
Statement of special account at the BSL, that receives resources generated by the HIPC Initiative and tracks their use
Monthly End of month + 4 weeks
Statement of special MDRI account at the BSL and the corresponding poverty-reducing spending financed
Monthly End of month + 4 weeks
Minutes of the meeting of the Monetary Policy Committee
Monthly Date of meeting + 2 weeks

SIERRA LEONE
74 INTERNATIONAL MONETARY FUND
Annex I. Sierra Leone: Competitiveness and External Stability Assessment1
1. The application of the three
standard methodologies for the
exchange rate assessment suggests
that the real exchange rate is broadly in
line with its long-run equilibrium,
consistent with the previous Article IV
Consultation staff report (Country
Report No. 10/370). External stability is
particularly difficult to benchmark for a
post-conflict economy like Sierra Leone
(SLE) partly because of short historical time series. While staff analysis suggests that the current
account deficit may exceed sustainable levels based on external sustainability methodology, with
large uncertainties surrounding estimates due to data limitations and structural changes in the
economy, there is no strong evidence of real exchange rate misalignment that could lead to external
instability in the medium term. Equilibrium current account deficit estimates are between
4.8–6.8 percent of GDP compared to an underlying deficit of 5.7 percent. The result shows a small
overvaluation of 3.5 percent under the external sustainability, and 4.5 to 6.0 percent of
undervaluation under macro balance and equilibrium exchange rate approaches.
1 Prepared by Friska Parulian.
Approach Norm Underlying
Macroeconomic Balance -6.8 -5.7 -4.5
External Sustainability -4.8 -5.7 3.5
Equilibrium Real Exchange Rate NA NA -6.0
1/ Based on IMF CGER methodology and extension by Vitek (IMF, 2009).
Sierra Leone: Exchange Rate Assessment1/
Current Account/GDP REER Overvaluation (+) /
Undervaluation (-)

SIERRA LEONE
INTERNATIONAL MONETARY FUND 75
2. The non-model analysis
demonstrates Sierra Leone’s steady
progress in competitiveness indicators.
Though SLE is a weak performer under the
World Bank CPIA, the 2012 Ease of Doing
Business score shows an impressive
performance, improving from a
150 position to 141 over 183 countries.
Compared to other Sub-Saharan African
countries, SLE is above average, ranking
19 over 46 countries. Despite progress in
these indicators, important impediments to
private sector development remain, requiring continued implementation of structural reforms to
reduce transaction costs and create an environment conducive to private sector-led growth.
3. Sierra Leone’s international reserves were US $420.0 million (3.1 months of prospective
imports)2 in 2012. The reserve level, as measured by import coverage is on the low end of the
spectrum for comparable countries in the region. For example, ECF countries3 import coverage
ranges from 1 to 7 months of imports and SADC has an informal target of 6 months of imports.
4. Dabla-Norris, et. al. (2011) and IMF (2011) have proposed a new methodology to assess
reserve adequacy for low income countries, taking account of both costs and benefits of holding
reserves. In this framework, a crisis is defined as a sharp drop in absorption, and the optimal level of
reserves is determined when the crisis prevention and mitigation benefits of reserves are balanced
against the net financial cost of reserves, defined as foregone investment opportunities measured by
the marginal product of capital. An important feature of the model is that optimal reserve holdings
depend on country characteristics and policy fundamentals.
5. This methodology was applied to Sierra Leone with the following assumptions: shock
variables (terms of trade, external demand, FDI to GDP ratio, and aid to GDP ratio) were set at the
bottom 10 percentile of the country specific distribution over the past decade (2002–2012);4 The
2 Excluding iron ore-related imports that were financed by foreign direct investment (FDI). 3 ECF countries are Cape Verde, Mozambique, Rwanda, Senegal, Tanzania, and Uganda. Countries that qualify for ECF are normally considered to be in a broadly stable and sustainable macroeconomic position. 4 Longer time series may be more ideal, but we focus on the past 10 years given the significant structural changes experienced by the Sierra Leonean economy.
0.0
0.5
1.0
1.5
2.0
2.5
3.0
3.5
4.0
4.5
5.0
West African Countries: CPIA Index of Business Regulatory and Economic Management (2011)
Business regulatory Economic management
Source: WorldDevelopment Indicators, World Bank.

SIERRA LEONE
76 INTERNATIONAL MONETARY FUND
CPIA and the fiscal balance were set at a three-year average for 2010–12. The values used for this
baseline analysis are summarized in the table below.
6. Reserve holdings would be interpreted as the optimal level of reserves in the face of large
shocks. Under the baseline scenario, the fiscal deficit (including grants) is 4.92 percent of GDP and
the CPIA index, which measures institutional strength is 3.29. Given a higher CPIA score
(e.g., 3.5, improving from a weak performer to a medium performer), optimal reserve holdings would
be lower than the baseline as stronger institutions lower the probability of a crisis. The outcome
would be broadly similar for an improved fiscal position (a deficit of 3 percent), optimal reserve
holdings would be even lower.
Variables1/
Overall balance, percent of GDP -4.92
CPIA2/ 3.29
External demand growth, percent -0.38
Terms of trade growth, percent -6.08
Change in FDI to GDP -43.39
Change in Aid to GDP -21.20 1/ Historical data, unless indicated
2/ World Bank

SIERRA LEONE
INTERNATIONAL MONETARY FUND 77
7. Optimal reserve holdings for Sierra Leone range from 2.9 months of imports to 6.4 months
of imports.5 The openness of the economy and exposure to international commodities prices would
argue for import coverage towards the high end of this spectrum in order to be in a position to
weather external shocks. In light of large infrastructure investment needs, however, the opportunity
costs of holding reserves is relatively high so a target closer to the middle of this range might be
more appropriate. Targeting the level of reserves closer to 4 months of imports would bring reserves
coverage more in line with comparable countries.
5 Note that this estimate is based on current imports. Import coverage based on prospective imports tends to be slightly lower than that based on current imports.

SIERRA LEONE
78 INTERNATIONAL MONETARY FUND
Annex II. Sierra Leone: Financial Sector Development Issues1
Profile of the Financial Sector
A. Institutional Structure
1. The financial sector has expanded rapidly in recent years. Banks represent the bulk of the
financial system, with over 80 percent of all assets, equivalent to 22 percent of GDP in 2012. The
number of commercial banks rose from 8 in 2006 to 13 in 2013, with new foreign entrants into the
market.2 Bank assets and deposits have tripled since 2006, but the banks remain relatively small, with
an average of total assets of about $64 million. Concentration is relatively high, as the two largest
banks hold 37 percent of assets, and 49 percent of the aggregate loan portfolio (Table 1). There are
three medium-sized banks, and eight small banks. Efficiency is low; noninterest expense is equal to
58 percent of gross income, while interest rate spreads have averaged some 13 percentage points
since 2011.
2. The rest of the financial system is relatively small, with assets accounting for less than
20 percent of system assets, or about 5 percent of GDP. The nonbank financial institutions
include ten insurance companies, nine community banks, nine insurance companies, three housing
finance companies, two savings and loans, the Finance and Trust Corporation, two discount houses,
some forty-two foreign exchange bureaus, and six non-deposit taking microfinance institutions. The
state pension fund institution—National Social Security and Insurance Trust (NASSIT)—is the key
nonbank financial institution, with assets of around 10 percent of GDP. The stock exchange was
launched in July 2009, and currently trades irregularly as the sole listing is one commercial bank.
1 Prepared by Toomas Orav and Francis Y. Kumah. 2 Three banks are locally owned, one is a regional bank, and six are subsidiaries of Nigerian banks.

SIERRA LEONE
INTERNATIONAL MONETARY FUND 79
Table 1. Sierra Leone: Banking Sector, December 2012
Classification Large Medium Small
Number of banks 2 3 8
Share of
Assets 36.8 31.7 31.6
Loans 49.1 24.0 26.9
Deposits 40.1 32.0 27.8
Capital 24.0 26.9 49.1
Source: Sierra Leonean authorities.
3. The inter linkages between the banks and other financial institutions appear limited.
Banks’ core business is basic traditional banking activities with very limited insurance services or
securities trading. The NASSIT has some deposit placement and about 20 percent of its institutional
investment of pension funds in the shares of commercial banks. The lack of reliable data on
nonbank financial institutions transactions makes it impossible to assess the degree of exposure of
the banks to these institutions.
4. Transactions in the economy are mainly cash based with very limited use of electronic
payment methods. To date, banks are engaged mostly in retail business and there is virtually no
use of credit cards, internet payment, or ATMs.3 The clearing and payment system is based on
manual data entry. The process of settlements across the banks is not yet automated, due to lack of
a national switch system and absence of adequate IT and power systems. The Sierra Leonean
authorities, with the technical and financial assistance from the African Development Bank and the
West African Monetary Zone, are in the process of developing an electronic, large-value national
payments system.
B. Access to Financial Services
5. Despite the fast growth of the banks, access to financial services is still low. The level of
financial intermediation has grown steadily since the end of the civil conflict in 2001, both in terms
of level of broad money and loan creation relative to GDP (Figure 1). However, when benchmarking
against regional and low income country data, credit levels and deposit transformation are very low.
World Bank data for 2011 indicates that other measures of financial inclusiveness, such as branch
3 The World Bank estimates that at end-2011 there were approximately 25 ATMs in operation in Sierra Leone.

SIERRA LEONE
80 INTERNATIONAL MONETARY FUND
Figure 1. Sierra Leone: Commercial Banks’ Assets and Liabilities (end-March 2013)
Cash5%
Claims on BSL6%
Claims on Local Banks
1%
Claims on Foreign Banks
30%
Claims on Discount Houses
2%
Treasury Bills22%
Other Securities
1%
Private Sector Credit (net of provisions)
28%
Fixed Assets5%
Structure of Bank Assets
Shareholder Equity18%
Retained Earnings
0%
Borrowing 3%
Demand Deposits in
Local Currency17%
Savings Deposits in
Local Currency19%
Time Deposits in Local
Currency8%
Demand Deposits in
Foreing Currencies
27%
Savings Deposits in
Foreign Currencies
1%
Other Liabilities7%
Structure of Bank Liabilities
penetration and account prevalence are catching up to peer group norms. In 2012, there were
89 bank branches in Sierra Leone, up from 57 in 2008, roughly equivalent to three branches per
100,000 persons. However, rural areas remain largely unbanked. As of 2011, household survey data
indicate that around one in seven have deposit accounts in commercial banks, up from 9 percent in
2008, but only 1 percent are borrowers.4 Mobile banking services are still embryonic.
6. The development of financial intermediation is hampered by the structure of the
market. A range of factors are hindering the deepening of financial intermediation, including
market structure, the business environment, and the infrastructure of the financial sector.
Market structure. Sierra Leone lacks markets for trading of longer-term securities or bonds. Bank liabilities tend to be short-term demand and savings deposits (Figure 1). Although relative share of demand deposits is gradually declining, banks continue to invest largely in short-term government treasury bills and extend credit for only short terms at high rates to avoid risks.
Macroeconomic instability. Sierra Leone has experienced bouts of high inflation and currency
depreciation (most recently 2009–10) due to both domestic and international shocks. This has
contributed to negative real interest rates on deposits, slowing financial deepening.
The business environment. Sierra Leone is ranked 10th among low income countries in the
World Bank Doing Business ranking index (Table 3). However, Sierra Leone is a relatively weak
performer in areas important for the development of financial intermediation, such as red tape
and high administrative costs on property registration, contract enforcement, and building
permits.
4 World Bank World Development Indicators (2011).

SIERRA LEONE
INTERNATIONAL MONETARY FUND 81
The infrastructure of the financial sector. As noted above, Sierra Leone lacks many
ingredients for developing the financial sector, including interbank markets, branch networks
that extend beyond major urban areas, an automated payments mechanism, and adequate
supervisory capacity.
C. The Regulatory System
7. The BSL has made strides toward building supervisory capacity and putting in place
the fundamental components for a modern financial system. The BSL and Banking Acts have
been revised to strengthen compliance toward Basel Core Principles; prudential bank guidelines
have been drafted; a benchmark policy rate has been introduced to improve monetary policy
signaling; and a credit reference bureau was established in 2011. The African Development Bank is
providing support to create an automated payment system, which is expected to go live in 2013.
Nevertheless, significant gaps remain, and technical assistance will continue in the areas of banking
supervision and monetary and foreign exchange operations and markets. Looking ahead, the
authorities intend to given special emphasis to enhancing access to finance. The BSL is already
actively supporting initiatives to encourage the development of microfinance institutions in rural
areas and credit facilities for small- and medium-sized enterprises, and is developing a financial
literacy campaign.
Progress in Reform Implementation and Challenges
8. The authorities’ reform agenda is informed by their comprehensive Financial Sector
Development Plan (2009), which sets out a long-term program to foster financial
intermediation. The FSDP was prepared based on recommendations from the 2006 FSAP, which
found a number of financial sector weaknesses, including institutional, administrative, legal, and
physical impediments (e.g., power supply). The preparation of the plan was spearheaded by the BSL,
with input and financial support from development partners, and in consultation with stakeholders
in the Sierra Leonean financial sector. This plan feeds into Sierra Leone’s two most recent poverty
reduction strategies, the Agenda for Change (2009–12) and the Agenda for Prosperity (2013–16),
which aim to grow the private sector from a very low base of financial development.
9. The FSDP emphasizes four priority areas:
Creating an enabling environment in line with best international practice, through legislative and
regulatory reforms and maintenance of macroeconomic stability, inter alia to bolster financial
system stability.

SIERRA LEONE
82 INTERNATIONAL MONETARY FUND
Strengthening the central bank infrastructure, particularly supervisory capacity and IT systems,
and installing an electronic payments system.
Increasing access to finance by improving financial literacy, strengthening microfinance and rural
credit governance and supervision.
Improving mobilization and investment of long-term funds by strengthening savings institutions
and the capital market;
10. Progress under the FSDP has accelerated, particularly in areas concerning legislative
and regulatory framework. An FSDP Secretariat was established at the BSL to coordinate the work
plan. Implementation was initially slow as technical challenges delayed disbursements, but several
milestones were completed in 2011–12:
Comprehensive revisions of the legal framework have been completed, including the Bank of
Sierra Leone Act (2011), Banking Act (2011), and AML/CFT Act (2012);
A bad debtor database was established through the Credit Reference Act (2011);
Revised commercial bank prudential guidelines came into effect January 2013;
The BSL has added and trained staff to the Banking Supervision Department.
11. Progress has been more modest in areas concerned with physical infrastructure and
structural capacity. Resource constraints and donor coordination have proven challenging in areas
requiring significant capital investment and broad technical skill development, e.g., the
modernization of the payments system, establishment of a liquid interbank market, and the
transition to risk-based supervision.
Financial Stability and Risks
12. The overall situation in the banking sector has improved, but financial soundness
indicators (at end-December 2012) suggest vulnerabilities at certain banks (see Table 2 and
Figures 4–5). This assessment broadly restates the vulnerabilities highlighted by the 2011 Financial
Stability Analysis.
13. The system-wide capital adequacy ratio remains comfortable. Banks’ risk-weighted
capital adequacy ratios are generally well above the statutory norm of 15 percent, except at the two
largest banks, both of which have a state participation. With regard to the latter, banking
supervisory procedures have been invoked to address the weak capital positions, although progress

SIERRA LEONE
INTERNATIONAL MONETARY FUND 83
in this area has been slow. Across the system bank capital ratios declined from 2008 to 2011 as
lending to the private sector increased, raising the proportion of assets held at higher risk weights.
The regulatory capital ratio stabilized during 2012, in line with slowing private credit and higher
government securities issuance.
14. Credit risk remains high, and banks are vulnerable to high concentration in lending.
While lending activity has increased substantially during the last five years, the level of
non-performing loans has declined from over 30 percent in 2007 to 14 percent in 2012, higher than
the mean for Sub-Saharan Africa. The level of nonperforming loans (net of provisions) to regulatory
varies widely from bank to bank, and a few banks exhibit a very high risk appetite. Lending appears
relatively diversified across sectors, with international trade, construction, and services (business and
government) accounting for approximately two-thirds of all loans. However, loan concentration is
high; banks’ total largest exposures rose sharply at end-2012 to 300 percent, and substantially
higher than the 400 percent prudential norm at the two largest banks.
15. Earnings have remained strong. Bank returns have improved, with net interest income
rising despite a slowdown in lending to the private sector, boosted by high yields on short-term
government securities. However, as a result, income has become increasingly dependent on the
spread between deposits and government securities, highlighting interest rate risks (Figure 2).
16. The system is highly liquid, although prone to volatile flows. Bank liquidity ratios are
generally high, but volatile liquidity conditions, as reflected by substantial swings in excess reserves
levels, can result in short falls at the aggregate level relative to the required statutory minimum.
Systemic conditions are influenced by large and irregular inflows, particularly bunchy government
payments on ongoing domestic infrastructure investment projects. Lacking an established domestic
Figure 2. Sierra Leone: bank Interest Income and Treasury Bill Interest Rates

SIERRA LEONE
84 INTERNATIONAL MONETARY FUND
money market, banks are also critically dependent on the ability to cash in their holdings of treasury
bills.
17. Foreign exchange risk appears limited. The share of foreign liabilities to total deposits
remains at around 25 percent, but recent exchange rate stability has helped to stabilize the level of
deposit dollarization. Foreign currency lending is not permitted.

SIERRA LEONE
INTERNATIONAL MONETARY FUND 85
Profitability has improved, as shown by ROA… … and ROE....
… although efficiency has deteriorated. Deposit transformation is low….
… while spreads remain high… ..in a context of volatile liquidity.
Sources: World Development Indicators, Sierra Leonean authorities and IMF staff estimates.
Figure 3. Sierra Leone: Selected Indicators on Financial Sector Breadth and Efficiency

SIERRA LEONE
86 INTERNATIONAL MONETARY FUND
Annex III. Sierra Leone: In Search of Inclusive Growth—Key Lessons from the Literature1
Sierra Leone started well at independence, but was battered by external and domestic factors, including adverse terms of trade shocks, ill-advised policy response to the financial impact of hosting the summit of the Organization of African Unity in 1980, and political instability. The civil conflict that resulted from these economic and political frustrations ended in 2002 but post-conflict challenges remain visible. However, all is not lost—there are new opportunities amidst old challenges. The country is poised for a boom in extractive industry activity, with the commencement of iron ore mining in 2011 and prospects for oil and gas. However, it trails behind in human development indicators and institutional reform. The current policy challenge is to efficiently manage these resources to enhance employment opportunities and reduce poverty. This note draws on stylized facts from the literature and country experiences, and outlines key guideposts for policy in Sierra Leone.
A. Background
1. Sierra Leone used to be characterized by solid natural resource base, robust
macroeconomic trends, and exemplary educational standards. In the decade following
independence in 1961—a period of post-independence gust and vibrancy—the economy of
Sierra Leone was booming, supported by abundant natural resources, agriculture and tourism. The
country was popular for diamonds, rutile, iron ore, gold, food sufficiency, and was a prime tourist
destination in West Africa. It was also referred to as the Athens of West Africa because it served as
the hub for tertiary education in English-speaking West Africa—mainly the Gambia, Ghana, Liberia,
and Nigeria. During this period, which pre-dates onset of the civil conflict in 1975, per capita real
GDP growth averaged 4 percent per annum (a high level by regional standards) and inflation
averaged 6 percent.
2. Adverse terms of trade shocks coupled with build-up of economic pressures in the
aftermath of the OAU summit eroded productivity, stoked price pressures, and instigated
political and civil conflict. Given its buoyant economy, the country was called upon by the African
Union to host the OAU summit of heads of state in 1983. Coupled with adverse impact of a decline
in iron ore prices in the mid-1970s, the financial decadence that followed the Organization of
African Unity (OAU) meetings in 1983 eroded these gains even prior to the onset of the civil conflict
in 1991. The main iron ore mining company, Delco mines, had to shut down and this triggered 1 Prepared by Francis Y. Kumah (IMF Resident Representative in Sierra Leone) and Mathew Sandy (economist, IMF Office in Sierra Leone).

SIERRA LEONE
INTERNATIONAL MONETARY FUND 87
deterioration in the balance of payment as well as exchange rate and inflationary pressures that laid
the foundations for political instability. During this period—of internalized adverse external shocks—
per capita real GDP growth declined by 2 percent per year and inflation averaged 40 percent
(Figures 1 and 2). While per capita real GDP growth declined on average by 2 percent per year,
inflation averaged 40 percent as the local currency depreciated by 24 percent relative to the dollar.
The confluence of these factors visited untold hardship on the citizens and, coupled with the onset
of the civil conflict in neighbouring Liberia, fueled the civil conflict that raged during 1991–2001—a
period of heightened per capita misery.
3. The civil conflict halted
all economic activity,
institutions deteriorated, and
human indicators plummeted.
There was a cobweb of coups
and counter coups in the early
1990s that culminated into a
decade-long costly civil conflict.
Per capita real GDP declined
during this period as productivity
sank, and inflation soared. In
fact, this was the period of
highest inflation, if the period
before it is adjusted for the
Per Capita Income
Poverty Headcount
Income Distribution
Adult Literacy Rate (%, 15 and
older)
Human Development
Index
Gambia 633 33.6 47.3 42 0.368
Ghana 301 28.6 42.8 62 0.473
Guinea 478 49.8 39.9 51 0.335
Liberia 217 83.8 38.2 56 0.315
Nigeria 443 65.5 45.9 58 0.441
Sierra Leone 228 53.4 42.5 38 0.292
Regional Average 2/ 383 52.5 42.7 51 0.371
Sub-Saharan Africa 576 … … 60 …
Source: World Development Indicators; and authors' estimates.
1/ Poverty headcount measures percent of population that earns less than $1.25 a day (in PPP terms). Income distribution is measured by the GINI coefficient---the lower the more equal income/wealth distribution. Human Development measures the composite index (average achievement in the three basic dimensions of human development—a long and healthy life, knowledge and a decent standard of living as prescribed by the United Nations. Per Capita Income measures GDP per Capita (at Constant 2000, US$).
2/ A simple average of indicators for The Gambia, Ghana, Guinea, Liberia, Nigeria and Sierra Leone.
Table 1. Sierra Leone: Selected Social Indicators, 2000–10(In indicated measures)1
Figure 1. Sierra Leone: Dynamics of Per Capita Real GDP, 1960–2010
Sources: World Economic Outlook, and authors’ estimates.
Figure 2. Sierra Leone: Real GDP Growth, Exchange Rate Movements, and Consumer Price Inflation, 1960–2010
Sources: World Economic Outlook, and authors’ estimates.

SIERRA LEONE
88 INTERNATIONAL MONETARY FUND
adverse effects of the OAU summit and terms of trade shock; consumer price inflation reached
70 percent in 1991 and averaged 25½ percent per year, while per capita real GDP growth declined
by 7½ percent per year during the period. The country entered a phase of unprecedented per capita
misery as infrastructure and human development suffered massive setback and basic social services
disappeared overnight. Productivity growth and social indicators plummeted and Sierra Leone has
since trailed behind regional peers on many social indicators (Table 1).
4. Quest for socio-economic inclusiveness, following civil conflict and global economic
slowdown in the midst of mineral wealth, has heightened search for inclusive growth. Half a
century has elapsed since Sierra Leone attained independence, and it has been a decade since the
end of the civil conflict that halted economic activities, but structural impediments and institutional
bottlenecks linger and continue to constrain output and employment growth. Notwithstanding
progress in institution building that has helped restore order and bolstered democratic principles,
the country remains poor and ranks low (180 out of 182 countries considered in 2009) on the global
human development index. Policy makers have sought to garner resources and the general
population around a three-year development plan dubbed the Agenda for Change (the country’s
second Poverty Reduction Strategy Paper, 2009–12), which addresses the infrastructure gap while
boosting agricultural and human development. A successor strategy (the Agenda for Prosperity)
aims at addressing unemployment, boosting human development, and building a social protection
floor; it features a chapter on gender equality and women’s empowerment.
5. This note presents stylized facts from current research on inclusive growth, and draws
policy lessons on the way forward for Sierra Leone. Themes that keep recurring in the literature
on inclusive growth include the role of (i) sound macroeconomic policies; (ii) good institutions; and
(iii) affordable social protection floor. Using growth accounting and panel econometric regressions,
Kumah and Sandy (2013) found that
pursuance of policies that promote macroeconomic stability is an essential tool in the search for
inclusive growth;
while opening up the economy helps expand the resource envelop for development and
inclusive growth, evolution of the real exchange rate should be watch in order to ensure
continued external competitiveness;
access to credit is essential for inclusive growth, but excessive credit booms should be watched
to ensure financial stability; and

SIERRA LEONE
INTERNATIONAL MONETARY FUND 89
progress on structural reforms that enhance efficiency of public institutions boost policy
effectiveness and inclusive growth; so do improvements in the business environment.
Thus, while capital accumulation is essential for economic growth, supporting economic policies and
institutional and business environment are equally important. The rest of the paper elaborates on
these findings and their relevance to Sierra Leone in its search for inclusive growth.
B. Stylized Facts from the Literature
6. The search for inclusive growth and economic policies conducive to such growth
started with an inquiry into appropriate operational definition and characterization. Several
researchers have attempted various definitions of inclusive growth, ranging from pro-poor growth
to poverty-reducing growth. The approach adopted by these earlier researchers was bedeviled by
criticality of the distinction between absolute and relative poverty. Ravallion and Chen (2003) put
this succinctly as the questions of “how the gains from aggregate economic growth (or losses from
contraction) were distributed across households according to their initial incomes or expenditures.”
7. Empirical evidence shows that sustained economic growth reduces poverty and
income inequality. While most of these findings are based only on analysis of correlation
coefficients among relevant variables and do not indicate causality, it is widely documented (see for
example Rodrik (2000) and Dollar and Kraay (2000)) that sustained rapid growth that expands
economic opportunities also tends to make society well off—thus reducing absolute poverty. Thus,
inclusive growth has come to be defined as growth that enlarges the size of the economy and
increases employment opportunities. Attaining this type of growth helps reduce absolute poverty, in
particular, as the GINI coefficient tends to be stable over time.
8. The relevant question to ask is what types of policies promote growth and reduce
poverty. In a discourse on the impact of economic growth on poverty reduction, Rodrik (2000)
asserts that “… the magnitude of poverty reduction payoff from growth depends, in part, on a
country’s specific circumstances and policies.” Investigating the significance of various policies on
economic growth and poverty reduction, Dollar and Kraay (2000) found openness to foreign trade,
good rule of law and fiscal discipline, and avoidance of inflation to be important drivers. They
conclude that “… growth generally does benefit the poor…” and that the quest for poverty reduction
should aim at policies that promote growth. Furthermore, they argue for good institutions, the rule
of law, and property rights along with political stability (and peace) when they assert that these
conditions “… directly create a good environment for poor households to increase their production
and income.” Indeed, in their analysis of the growth-poverty nexus, Pinkovskiy and Sala-i-Martin

SIERRA LEONE
90 INTERNATIONAL MONETARY FUND
(2010) indicated that poverty and GDP per capita in the largest Sub-Saharan African countries
during 1970–2009 (Ethiopia, South Africa, Nigeria, and Congo-Zaire) are “mirror images of each
other”—thus, consistent with the findings of Dollar and Kraay (2000), policies that promote growth
of per capita GDP also help reduce poverty.
9. We gather from these findings that (i) growth-promoting policies also help alleviate poverty,
since the GINI coefficient tends to be constant over time, and that (ii) economic policies and quality
of institutions do matter in the quest for inclusive growth; just as initial country circumstances (for
example, countries just emerging out of war have different challenges from those that have enjoyed
long periods of peace) and the nature of the business environment, including access to credit. These
are the factors at the core of empirical research into inclusive growth, which are very pertinent to
Sierra Leone’s specific circumstances—the significance of institutions and economic policy. In what
follows, we use a growth accounting exercise complemented by panel econometric estimates (which
is a standard approach in the literature) to demonstrate the significance of these factors.
Growth Accounting
10. Growth accounting
exercise reveals the impact of
initial conditions on economic
growth and job creation.2 The
growth accounting framework
for all countries for the period
1960–2010 indicates that total
factor productivity (TFP) is an important factor in real per capita output growth (Table 2). For the full
sample, real per capita GDP growth averaged 2 percent in 1960–2010, mainly originating from TFP
which contributed about 1.5 percentage points to this growth. Per capita growth in low-income
countries, including Sub-Saharan African countries, averaged 1 percent during the same period, with
the bulk contribution originating from capital accumulation.
11. Sierra Leone exhibits a decline in total factor productivity, despite capital
accumulation. Real per capita output shrunk overall during 1960–2010 as TFP declined despite
2 The growth accounting exercise uses the neoclassical Cobb-Douglas production function of the form t t ty a k ,
ty denotes real output/GDP per capita, ta corresponds to total factor productivity, tk is capital-labor ratio, and is the share of capital in the production process.
Capital Stock Total Factor Productivity
Full Sample 2.01 0.55 1.46Advance Economies 3.22 -0.04 3.26Middle Income Countries 2.22 0.89 1.33Low Income Countries 1.14 0.69 0.45Sub-Saharan Africa Countries 1.09 0.65 0.43Sierra Leone -0.24 0.81 -1.04
Source: IMF World Outlook (WEO) database; and authors' estimates.
Per Capita Real GDP Growth
Contribution of:
Table 2. Growth Accounting, 1960–2010

SIERRA LEONE
INTERNATIONAL MONETARY FUND 91
capital accumulation, particularly during the civil conflict in the late 1990s (Table 1 and Figure 1). The
country trails behind it peers on comprehensive institutional reforms and competitiveness. The
World Economic Forum 2012 report on competitiveness puts Sierra Leone at 143th place out of
144 countries. At the same time, the Global Competitiveness Report identifies as constraints to
improving the investment climate the infrastructure gap, poor health and primary education
services, low financial market development, weak institutions, and inefficient labor and goods
market. Hence, integrating capital accumulation with capacity building and improvements in
efficiency of basic service delivery would support the production process and deliver better
economic growth and employment results.
Empirical Econometric Results
12. Real per capita output growth is depended not only on the efficiency of capital-labor
ratio but also of the productivity enshrined in entire production processes. Following the
classical approach of Solow (1957), we postulate that the residual from a regression could be
interpreted as capturing total factor productivity, which could be dependent in turn on a variety of
factors—such as openness of the economy (which expands the resource envelope of a country), the
business and institutional environment, macroeconomic policies (the quality of economic
institutions and arrangements and of initial policy stance), and access to credit—that have been
considered in the literature.
13. To investigate the significance of these factors in the growth process, we specify an
empirical panel econometric model of the form:
(1)
where ity denotes real per capita GDP growth, itk is the capital-labor ratio, and itX is a matrix of
proxy variables used to capture the effects of total factor productivity. As discussed above, we
include in itX variables such as openness, the real effective exchange rate, an indicator of
macroeconomic stability, credit boom and real government consumption. It turns out that inflation
variability (defined as the logarithm of the deviation of inflation from the trend in 1960–70) is a
good indicator of macroeconomic stability. Likewise, credit boom (defined/derived as the logarithm
of deviations of real private credit from trend) works well as an indicator for access to credit, as
increases in this proxy variable has the desired effects on real per capita growth. The variable it
captures unobservable country-specific characteristics, while itv is an error term with the usual
classical assumptions: (i) orthogonality and zero mean ( [ ] [ ] [ ] 0i it i itE E v E v ); serial
, 1it i t it it i ity y k X v

SIERRA LEONE
92 INTERNATIONAL MONETARY FUND
uncorrelatedness ( [ ] 0,it isE v v for s t ); and homoskedasticity or constant variance
( 2 2 2 2[ ] [ ]i it vE and E v ). We further assume (i) correlated country-specific effects, or fixed
effects such that [ ] 0it iE X ;3 and (ii) strict exogeneity ( [ ] 0 ,it isE X v for all s t ), which rules out
feedback effects from past isv shocks to current itX .
14. A priori propositions exclude instability and are empirically tested. We do expect, a priori and consistent with the theory, | | 1 for stability, and a positive response of real per capita
GDP growth to increases in the real capital-labor ratio (i.e., 0 ). Economic openness as defined,
measures the extent to which a country trades with the rest of the world; by definition, therefore,
openness is expected to yield additional resources to a country in the form of gains from trade, and
hence should increase growth potentials. Real exchange rate appreciation/depreciation
reduce/enhance competitiveness of countries and has negative/positive effects on per capita real
GDP growth. Further, macroeconomic stability is expected to enhance growth prospects, as it helps
predictability and reduces costs to businesses. It cannot be overemphasized that growth of the
private sector depends, first and foremost, on access to credit, which in turn, improves growth
prospects. On the other hand, excessive real government consumption (i.e., public spending on
wages and salaries, transfers and goods and services) only competes with the private sector for
limited resources and hence reduces growth as the private sector tends to be crowded out by
government spending.
15. The empirical results laud capital accumulation with economic openness (Table 3).
Thus,
Capital stock elasticity of real per capita growth is higher for SSA countries and LICs (0.05–0.06) than for the full sample (0.02). This supports the theoretical proposition of increasing returns on capital at lower levels of capital accumulation; and
Openness stimulates per capita real GDP growth. The results indicate that more open countries tended to have experienced higher real GDP per capita growth during the period 1960–2010;
3 This assumption suggests the fixed effects econometric methodology in estimating the coefficients of our models in subsequent sections as a more suitable approach over the random effects approach. Indeed, country performance on the elements of the X variable set is in reality broadly dependent on country circumstances and/or initial conditions.

SIERRA LEONE
INTERNATIONAL MONETARY FUND 93
16. Further empirical exercises using an expanded set of independent variables underscore
the significance of macroeconomic policies and institutions. These results lead us to investigate
the impact of other factors on the magnitude of capital elasticity of economic growth; more
specifically, the question we seek to answer is whether capita accumulation alone is sufficient to
support inclusive growth—alternatively, do initial conditions, quality of institutions, and economic
policy matter? To answer this question, we replace the openness variable in itX with more active
policy variables such as the real effective exchange rate, inflation variability, increases in private
sector credit (or episodes of credit boom), and government consumption. All these variables are
expressed in logarithms and so their respective coefficients in estimates of equation (1) indicate
elasticities or responses of economic growth (or inclusive growth) to policy. We also investigate the
role of the quality of institutions. The results in the Appendix Tables 1 and 2 are summarized in two
parts below—the role of (a) macroeconomic policy, and (b) quality of institutions.
Sound macroeconomic policies drive real per capita output growth
17. Macroeconomic stability helps develop a predictable economic environment and helps
private sector development and job creation. In our model, the impact of macroeconomic policy
(or stability) on inclusive growth is captured through an inflation viability indicator which is
estimated as the logarithm of the squared deviations of inflation from the trend established in the
1960s. It turns out that attaining macroeconomic stability improves growth performance in all
samples considered. In particular, countries that reduced inflation variability through appropriate
FE GMM-DIFF FE GMM-DIFF FE GMM-DIFF(t-2) (t-2) (t-2)
One-period lagged per capita real GDP 0.9300*** 0.9554*** 0.926*** 0.9105*** 0.9361*** 0.9221***(0.000) (0.000) (0.000) (0.000) (0.000) (0.000)
Capital stock 0.0215*** 0.0211*** 0.047*** 0.0539*** 0.0529*** 0.0627***(0.007) (0.005) (0.000) (0.000) (0.024) (-0.002)
Openness 0.0041*** 0.0062*** 0.0057*** 0.0070*** 0.0065*** 0.0077***(0.000) (0.000) (0.007) (-0.002) (0.012) (-0.002)
Constant 0.3128*** 0.6604*** 0.5483***(0.000) (0.000) (0.003)
Number of observations 2,633 3,016 845 987 773 824
R-squared 0.9709 0.9349 0.9650
F statistic 5,419.97 6,447.71 2,069.32 1,987.41 4,376.57 3,933.91 Prob > F 0.0000 0.0000 0.0000 0.0000 0.0000 0.0000Hansen test (prob.) 1.0000 1.0000 1.0000m(1) 0.0000 0.0000 0.0010m(2) 0.0030 0.2940 0.2320
Source: IMF World Economic Outlook (WEO) database; and authors' estimations using panel methods in Stata.
Notes: All variables are expressed in logarithms. Figures in parenthesis are probability values; note: *** p<0.01, ** p<0.05, * p<0.1
Full Sample Low Income SSA
Table 3a. Panel Estimates of Per Capita Real GDP Equations, 1960–2010(Dependent Variable: per capita real GDP)

SIERRA LEONE
94 INTERNATIONAL MONETARY FUND
macroeconomic policies gained on inclusive growth—the elasticity, albeit small, is highly significant
and consistent with a priori expectations of the effectiveness of macroeconomic policy.
18. Real exchange rate movements (through variations in the nominal exchange or
inflation or some combinations of these) do influence economic growth through the trade
balance. In particular, exchange rate appreciations tend to adversely affect the trade balance and
growth. Our empirical findings summarized in Table 3 are consistent with these theoretical
predictions, which underscore the need for inflation control along with awareness about the impact
of nominal exchange rate movements, particularly in natural resource rich countries, such as
Sierra Leone, where large inflows into the mining sector might lead to nominal appreciation of the
domestic currency while driving a wedge between wages in the tradable and nontradable sectors of
the economy.
19. Availability of finance (or access to credit) helps finance private sector economic
activity and boosts growth and employment. While our empirical results for all low-income
countries are consistent with this proposition, SSA countries exhibit a perverse result where
increases in credit (or credit boom) do reduce real per capita growth. This may be due to interaction
of the dependent variable with the incidence of high nonperforming loans in some SSA countries
and prevents effective realization of the positive effects of credit availability. Further research would
be needed to investigate the relationship between credit and growth in SSA countries taking into
account the effect of financial sector health generally.
Full Sample Low Income SSA Full Sample Low Income SSA Full Sample Low Income SSA
One-period lagged per capita real GDP 0.929*** 0.903*** 0.918*** 0.935*** 0.895*** 0.916*** 0.926*** 0.884*** 0.907***(0.016) (0.021) (0.025) (0.017) (0.020) (0.025) (0.020) (0.021) (0.028)
Capital stock 0.051*** 0.036** 0.063** 0.049*** 0.036*** 0.065** 0.051*** 0.035*** 0.074***(0.015) (0.009) (0.027) (0.016) (0.009) (0.028) (0.019) (0.011) (0.034)
Openness
Inflation variability -0.002*** -0.003*** -0.003** -0.002*** -0.002** -0.003** -0.001*** -0.0001 -0.0014(0.000) (0.001) (0.001) (0.000) (0.001) (0.002) (0.001) (0.001) (0.002)
REER -0.001* -0.000*** -0.0012 -0.002* -0.004** -0.0006 -0.0013 -0.0022 -0.0007(0.001) (0.003) (0.003) (0.001) (0.002) (0.003) (0.001) (0.002) (0.002)
Credit boom 0.0022 0.0003 -0.0011 0.0022 -0.0009 -0.0031(0.004) (0.005) (0.004) (0.004) (0.005) (0.005)
Government consumption 0.028* 0.016*** 0.0123(0.006) (0.010) (0.014)
Constant 0.684*** 0.975*** 0.789*** 0.626*** 1.061*** 0.809*** 0.685*** 1.092*** 0.849***(0.146) (0.202) (0.207) (0.158) (0.202) (0.209) (0.185) (0.218) (0.248)
Number of observations 2010 437 437 1773 417 420 1324 363 351
R-squared 0.9760 0.913 0.9671 0.973 0.9048 0.9666 0.974 0.9111 0.9673
F statistic 5,725.94 737.14 10,323.60 4,744.56 542.08 9,601.23 5487.79 599.52 8415.89Prob > F 0.0000 0.0000 0.0000 0.0000 0.0000 0.0000 0.0000 0.0000 0.0000
Source: IMF World Economic Outlook (WEO) database; and authors' estimations using panel methods in Stata.
Notes: All variables are expressed in logarithms. Figures in parenthesis are standard errors.
Model I Model II Model III
Table 3b. Panel Estimates of Per Capita Real GDP Equations, 1960–2010(Dependent Variable: log. real GDP per capita)

SIERRA LEONE
INTERNATIONAL MONETARY FUND 95
20. Further, we plot two indicators of macroeconomic policy (the CPIA indicator on overall
macroeconomic management and our inflation variability indicator) against per capita real GDP to
get insights into the role of macroeconomic policy in promoting inclusive growth. The results
depicted in Figure 3 below further strengthen our findings from the econometric exercise.

SIERRA LEONE
96 INTERNATIONAL MONETARY FUND
BGDBGDBGDBGDBGDBGDBGDBGDBGDBGDBGDBGDBGDBGDBGDBGDBGDBGDBGDBGDBGDBGDBGDBGDBGDBGDBGDBGDBGDBGDBGDBGDBGDBGDBGDBGDBGDBGDBGDBGDBGDBGDBGDBGDBGDBGDBGD
BENBENBENBENBENBENBENBENBENBENBENBENBENBENBENBENBENBENBENBENBENBENBENBENBENBENBENBENBENBENBENBENBENBENBENBENBENBENBENBENBENBENBENBENBENBENBEN
BTNBTNBTNBTNBTNBTNBTNBTNBTNBTNBTNBTNBTNBTNBTNBTNBTNBTNBTNBTNBTNBTNBTNBTNBTNBTNBTNBTNBTNBTNBTNBTNBTNBTNBTNBTNBTNBTNBTNBTNBTNBTNBTNBTNBTNBTN
BOLBOLBOLBOLBOLBOLBOLBOLBOLBOLBOLBOLBOLBOLBOLBOLBOLBOLBOLBOLBOLBOLBOLBOLBOLBOLBOLBOLBOLBOLBOLBOLBOLBOLBOLBOLBOLBOLBOLBOLBOLBOLBOLBOLBOLBOL BFABFABFABFABFABFABFABFABFABFABFABFABFABFABFABFABFABFABFABFABFABFABFABFABFABFABFABFABFABFABFABFABFABFABFABFABFABFABFABFABFABFABFABFABFABFABFA
BDIBDIBDIBDIBDIBDIBDIBDIBDIBDIBDIBDIBDIBDIBDIBDIBDIBDIBDIBDIBDIBDIBDIBDIBDIBDIBDIBDIBDIBDIBDIBDIBDIBDIBDIBDIBDIBDIBDIBDIBDIBDIBDIBDIBDIBDICMRCMRCMRCMRCMRCMRCMRCMRCMRCMRCMRCMRCMRCMRCMRCMRCMRCMRCMRCMRCMRCMRCMRCMRCMRCMRCMRCMRCMRCMRCMRCMRCMRCMRCMRCMRCMRCMRCMRCMRCMRCMRCMRCMRCMRCMRCMR
CPVCPVCPVCPVCPVCPVCPVCPVCPVCPVCPVCPVCPVCPVCPVCPVCPVCPVCPVCPVCPVCPVCPVCPVCPVCPVCPVCPVCPVCPVCPVCPVCPVCPVCPVCPVCPVCPVCPVCPVCPVCPVCPVCPVCPVCPV
CAFCAFCAFCAFCAFCAFCAFCAFCAFCAFCAFCAFCAFCAFCAFCAFCAFCAFCAFCAFCAFCAFCAFCAFCAFCAFCAFCAFCAFCAFCAFCAFCAFCAFCAFCAFCAFCAFCAFCAFCAFCAFCAFCAFCAFCAF
TCDTCDTCDTCDTCDTCDTCDTCDTCDTCDTCDTCDTCDTCDTCDTCDTCDTCDTCDTCDTCDTCDTCDTCDTCDTCDTCDTCDTCDTCDTCDTCDTCDTCDTCDTCDTCDTCDTCDTCDTCDTCDTCDTCDTCDTCD
COMCOMCOMCOMCOMCOMCOMCOMCOMCOMCOMCOMCOMCOMCOMCOMCOMCOMCOMCOMCOMCOMCOMCOMCOMCOMCOMCOMCOMCOMCOMCOMCOMCOMCOMCOMCOMCOMCOMCOMCOMCOMCOMCOMCOMCOM
ZARZARZARZARZARZARZARZARZARZARZARZARZARZARZARZARZARZARZARZARZARZARZARZARZARZARZARZARZARZARZARZARZARZARZARZARZARZARZARZARZARZARZARZARZARZARZAR
COGCOGCOGCOGCOGCOGCOGCOGCOGCOGCOGCOGCOGCOGCOGCOGCOGCOGCOGCOGCOGCOGCOGCOGCOGCOGCOGCOGCOGCOGCOGCOGCOGCOGCOGCOGCOGCOGCOGCOGCOGCOGCOGCOGCOGCOG
CIVCIVCIVCIVCIVCIVCIVCIVCIVCIVCIVCIVCIVCIVCIVCIVCIVCIVCIVCIVCIVCIVCIVCIVCIVCIVCIVCIVCIVCIVCIVCIVCIVCIVCIVCIVCIVCIVCIVCIVCIVCIVCIVCIVCIVCIVCIV
GMBGMBGMBGMBGMBGMBGMBGMBGMBGMBGMBGMBGMBGMBGMBGMBGMBGMBGMBGMBGMBGMBGMBGMBGMBGMBGMBGMBGMBGMBGMBGMBGMBGMBGMBGMBGMBGMBGMBGMBGMBGMBGMBGMBGMBGMBGHAGHAGHAGHAGHAGHAGHAGHAGHAGHAGHAGHAGHAGHAGHAGHAGHAGHAGHAGHAGHAGHAGHAGHAGHAGHAGHAGHAGHAGHAGHAGHAGHAGHAGHAGHAGHAGHAGHAGHAGHAGHAGHAGHAGHAGHAGHA
GRDGRDGRDGRDGRDGRDGRDGRDGRDGRDGRDGRDGRDGRDGRDGRDGRDGRDGRDGRDGRDGRDGRDGRDGRDGRDGRDGRDGRDGRDGRDGRDGRDGRDGRDGRDGRDGRDGRDGRDGRDGRDGRDGRDGRDGRD
GUYGUYGUYGUYGUYGUYGUYGUYGUYGUYGUYGUYGUYGUYGUYGUYGUYGUYGUYGUYGUYGUYGUYGUYGUYGUYGUYGUYGUYGUYGUYGUYGUYGUYGUYGUYGUYGUYGUYGUYGUYGUYGUYGUYGUYGUYGUY
HTIHTIHTIHTIHTIHTIHTIHTIHTIHTIHTIHTIHTIHTIHTIHTIHTIHTIHTIHTIHTIHTIHTIHTIHTIHTIHTIHTIHTIHTIHTIHTIHTIHTIHTIHTIHTIHTIHTIHTIHTIHTIHTIHTIHTIHTI
HNDHNDHNDHNDHNDHNDHNDHNDHNDHNDHNDHNDHNDHNDHNDHNDHNDHNDHNDHNDHNDHNDHNDHNDHNDHNDHNDHNDHNDHNDHNDHNDHNDHNDHNDHNDHNDHNDHNDHNDHNDHNDHNDHNDHNDHND
INDINDINDINDINDINDINDINDINDINDINDINDINDINDINDINDINDINDINDINDINDINDINDINDINDINDINDINDINDINDINDINDINDINDINDINDINDINDINDINDINDINDINDINDINDINDINDIDNIDNIDNIDNIDNIDNIDNIDNIDNIDNIDNIDNIDNIDNIDNIDNIDNIDNIDNIDNIDNIDNIDNIDNIDNIDNIDNIDNIDNIDNIDNIDNIDNIDNIDNIDNIDNIDNIDNIDNIDNIDNIDNIDNIDNIDNIDN
KENKENKENKENKENKENKENKENKENKENKENKENKENKENKENKENKENKENKENKENKENKENKENKENKENKENKENKENKENKENKENKENKENKENKENKENKENKENKENKENKENKENKENKENKENKENKEN
KIRKIRKIRKIRKIRKIRKIRKIRKIRKIRKIRKIRKIRKIRKIRKIRKIRKIRKIRKIRKIRKIRKIRKIRKIRKIRKIRKIRKIRKIRKIRKIRKIRKIRKIRKIRKIRKIRKIRKIRKIRKIRKIRKIRKIR
LAOLAOLAOLAOLAOLAOLAOLAOLAOLAOLAOLAOLAOLAOLAOLAOLAOLAOLAOLAOLAOLAOLAOLAOLAOLAOLAOLAOLAOLAOLAOLAOLAOLAOLAOLAOLAOLAOLAOLAOLAOLAOLAOLAOLAOLAO
LSOLSOLSOLSOLSOLSOLSOLSOLSOLSOLSOLSOLSOLSOLSOLSOLSOLSOLSOLSOLSOLSOLSOLSOLSOLSOLSOLSOLSOLSOLSOLSOLSOLSOLSOLSOLSOLSOLSOLSOLSOLSOLSOLSOLSOLSO
MDGMDGMDGMDGMDGMDGMDGMDGMDGMDGMDGMDGMDGMDGMDGMDGMDGMDGMDGMDGMDGMDGMDGMDGMDGMDGMDGMDGMDGMDGMDGMDGMDGMDGMDGMDGMDGMDGMDGMDGMDGMDGMDGMDGMDGMDGMDG
MWIMWIMWIMWIMWIMWIMWIMWIMWIMWIMWIMWIMWIMWIMWIMWIMWIMWIMWIMWIMWIMWIMWIMWIMWIMWIMWIMWIMWIMWIMWIMWIMWIMWIMWIMWIMWIMWIMWIMWIMWIMWIMWIMWIMWIMWI
MDVMDVMDVMDVMDVMDVMDVMDVMDVMDVMDVMDVMDVMDVMDVMDVMDVMDVMDVMDVMDVMDVMDVMDVMDVMDVMDVMDVMDVMDVMDVMDVMDVMDVMDVMDVMDVMDVMDVMDVMDVMDVMDVMDVMDVMDV
MLIMLIMLIMLIMLIMLIMLIMLIMLIMLIMLIMLIMLIMLIMLIMLIMLIMLIMLIMLIMLIMLIMLIMLIMLIMLIMLIMLIMLIMLIMLIMLIMLIMLIMLIMLIMLIMLIMLIMLIMLIMLIMLIMLIMLIMLIMLIMRTMRTMRTMRTMRTMRTMRTMRTMRTMRTMRTMRTMRTMRTMRTMRTMRTMRTMRTMRTMRTMRTMRTMRTMRTMRTMRTMRTMRTMRTMRTMRTMRTMRTMRTMRTMRTMRTMRTMRTMRTMRTMRTMRTMRTMRT
MOZMOZMOZMOZMOZMOZMOZMOZMOZMOZMOZMOZMOZMOZMOZMOZMOZMOZMOZMOZMOZMOZMOZMOZMOZMOZMOZMOZMOZMOZMOZMOZMOZMOZMOZMOZMOZMOZMOZMOZMOZMOZMOZMOZMOZMOZ
NPLNPLNPLNPLNPLNPLNPLNPLNPLNPLNPLNPLNPLNPLNPLNPLNPLNPLNPLNPLNPLNPLNPLNPLNPLNPLNPLNPLNPLNPLNPLNPLNPLNPLNPLNPLNPLNPLNPLNPLNPLNPLNPLNPLNPLNPLNPL
NERNERNERNERNERNERNERNERNERNERNERNERNERNERNERNERNERNERNERNERNERNERNERNERNERNERNERNERNERNERNERNERNERNERNERNERNERNERNERNERNERNERNERNERNERNERNER
NGANGANGANGANGANGANGANGANGANGANGANGANGANGANGANGANGANGANGANGANGANGANGANGANGANGANGANGANGANGANGANGANGANGANGANGANGANGANGANGANGANGANGANGANGANGANGAPAKPAKPAKPAKPAKPAKPAKPAKPAKPAKPAKPAKPAKPAKPAKPAKPAKPAKPAKPAKPAKPAKPAKPAKPAKPAKPAKPAKPAKPAKPAKPAKPAKPAKPAKPAKPAKPAKPAKPAKPAKPAKPAKPAKPAKPAKPAK
PNGPNGPNGPNGPNGPNGPNGPNGPNGPNGPNGPNGPNGPNGPNGPNGPNGPNGPNGPNGPNGPNGPNGPNGPNGPNGPNGPNGPNGPNGPNGPNGPNGPNGPNGPNGPNGPNGPNGPNGPNGPNGPNGPNGPNGPNGRWARWARWARWARWARWARWARWARWARWARWARWARWARWARWARWARWARWARWARWARWARWARWARWARWARWARWARWARWARWARWARWARWARWARWARWARWARWARWARWARWARWARWARWARWARWARWASTPSTPSTPSTPSTPSTPSTPSTPSTPSTPSTPSTPSTPSTPSTPSTPSTPSTPSTPSTPSTPSTPSTPSTPSTPSTPSTPSTPSTPSTPSTPSTPSTPSTPSTPSTPSTPSTPSTPSTPSTPSTPSTPSTPSTPSTP
SENSENSENSENSENSENSENSENSENSENSENSENSENSENSENSENSENSENSENSENSENSENSENSENSENSENSENSENSENSENSENSENSENSENSENSENSENSENSENSENSENSENSENSENSENSENSLESLESLESLESLESLESLESLESLESLESLESLESLESLESLESLESLESLESLESLESLESLESLESLESLESLESLESLESLESLESLESLESLESLESLESLESLESLESLESLESLESLESLESLESLESLESLBSLBSLBSLBSLBSLBSLBSLBSLBSLBSLBSLBSLBSLBSLBSLBSLBSLBSLBSLBSLBSLBSLBSLBSLBSLBSLBSLBSLBSLBSLBSLBSLBSLBSLBSLBSLBSLBSLBSLBSLBSLBSLBSLBSLBSLB
LKALKALKALKALKALKALKALKALKALKALKALKALKALKALKALKALKALKALKALKALKALKALKALKALKALKALKALKALKALKALKALKALKALKALKALKALKALKALKALKALKALKALKALKALKALKALKA LCALCALCALCALCALCALCALCALCALCALCALCALCALCALCALCALCALCALCALCALCALCALCALCALCALCALCALCALCALCALCALCALCALCALCALCALCALCALCALCALCALCALCALCALCALCALCAVCTVCTVCTVCTVCTVCTVCTVCTVCTVCTVCTVCTVCTVCTVCTVCTVCTVCTVCTVCTVCTVCTVCTVCTVCTVCTVCTVCTVCTVCTVCTVCTVCTVCTVCTVCTVCTVCTVCTVCTVCTVCTVCTVCTVCTVCT
SDNSDNSDNSDNSDNSDNSDNSDNSDNSDNSDNSDNSDNSDNSDNSDNSDNSDNSDNSDNSDNSDNSDNSDNSDNSDNSDNSDNSDNSDNSDNSDNSDNSDNSDNSDNSDNSDNSDNSDNSDNSDNSDNSDNSDNSDNSDN
TGOTGOTGOTGOTGOTGOTGOTGOTGOTGOTGOTGOTGOTGOTGOTGOTGOTGOTGOTGOTGOTGOTGOTGOTGOTGOTGOTGOTGOTGOTGOTGOTGOTGOTGOTGOTGOTGOTGOTGOTGOTGOTGOTGOTGOTGOTGO
-20
24
68
Per
Cap
ital
Rea
l GD
P G
row
th(I
n pe
rcen
t; a
vg 1
960-
2010
)
0 2 4 6Quality of Macroeconomic Management
(CPIA Indicator; avg 2005-2009)
I. Full Sample
DZADZADZADZADZADZADZADZADZADZADZADZADZADZADZADZADZADZADZADZADZADZADZADZADZADZADZADZADZADZADZADZADZADZADZADZADZADZADZADZADZADZADZADZADZADZADZA
AGOAGOAGOAGOAGOAGOAGOAGOAGOAGOAGOAGOAGOAGOAGOAGOAGOAGOAGOAGOAGOAGOAGOAGOAGOAGOAGOAGOAGOAGOAGO
ARBARBARBARBARBARBARBARBARBARBARBARBARBARBARBARBARBARBARBARBARBARBARBARBARBARBARBARBARBARBARBARBARBARBARBARBARBARBARBARBARBARBARBARBARBARB
ARGARGARGARGARGARGARGARGARGARGARGARGARGARGARGARGARGARGARGARGARGARGARGARGARGARGARGARGAUSAUSAUSAUSAUSAUSAUSAUSAUSAUSAUSAUSAUSAUSAUSAUSAUSAUSAUSAUSAUSAUSAUSAUSAUSAUSAUSAUSAUSAUSAUSAUSAUSAUSAUSAUSAUSAUSAUSAUSAUSAUSAUSAUSAUSAUSAUSAUSAUSAUTAUTAUTAUTAUTAUTAUTAUTAUTAUTAUTAUTAUTAUTAUTAUTAUTAUTAUTAUTAUTAUTAUTAUTAUTAUTAUTAUTAUTAUTAUTAUTAUTAUTAUTAUTAUTAUTAUTAUTAUTAUTAUTAUTAUT
BHSBHSBHSBHSBHSBHSBHSBHSBHSBHSBHSBHSBHSBHSBHSBHSBHSBHSBHSBHSBHSBHSBHSBHSBHSBHSBHSBHSBHSBHSBHSBHSBHSBHSBHSBHSBHSBHSBHSBHSBHSBHSBHSBHSBHSBHSBHS BHRBHRBHRBHRBHRBHRBHRBHRBHRBHRBHRBHRBHRBHRBHRBHRBHRBHRBHRBHRBHRBHRBHRBHRBHRBHRBHRBHRBHRBHRBHRBHRBHRBHRBHRBHRBHRBHRBHRBHRBHRBHRBHRBHRBHRBHRBHR
BGDBGDBGDBGDBGDBGDBGDBGDBGDBGDBGDBGDBGDBGDBGDBGDBGDBGDBGDBGDBGDBGDBGDBGDBGDBGDBGDBGDBGDBGDBGDBGDBGDBGDBGDBGDBGDBGDBGDBGDBGDBGDBGDBGD
BRBBRBBRBBRBBRBBRBBRBBRBBRBBRBBRBBRBBRBBRBBRBBRBBRBBRBBRBBRBBRBBRBBRBBRBBRBBRBBRBBRBBRBBRBBRBBRBBRBBRBBRBBRBBRBBRBBRBBRBBRBBRBBRBBRBBRBBRBBRBBELBELBELBELBELBELBELBELBELBELBELBELBELBELBELBELBELBELBELBELBELBELBELBELBELBELBELBELBELBELBELBELBELBELBELBELBELBELBELBELBELBELBELBELBELBELBELBELBEL
BENBENBENBENBENBENBENBENBENBENBENBENBENBENBENBENBENBENBENBENBENBENBENBENBENBENBENBENBENBENBENBENBENBENBENBENBENBENBENBENBENBENBENBENBENBEN
BTNBTNBTNBTNBTNBTNBTNBTNBTNBTNBTNBTNBTNBTNBTNBTNBTNBTNBTNBTNBTNBTNBTNBTNBTNBTNBTNBTNBTNBTNBTNBTNBTNBTNBTNBTNBTNBTNBTNBTNBTNBTNBTNBTNBTNBTN
BOLBOLBOLBOLBOLBOLBOLBOLBOLBOLBOLBOLBOLBOLBOLBOLBOLBOLBOLBOLBOLBOLBOLBOLBOLBOLBOLBOLBOLBOLBOLBOLBOLBOLBOLBOLBOLBOLBOL
BWABWABWABWABWABWABWABWABWABWABWABWABWABWABWABWABWABWABWABWABWABWABWABWABWABWABWABWABWABWABWABWABWABWABWABWABWABWABWABWABWABWABWABWABWABWABWA
BRABRABRABRABRABRABRABRABRABRABRABRABRABRABRABRABRABRABRABRABRABRABRABRABRABRABRABRABRABRABRA
BFABFABFABFABFABFABFABFABFABFABFABFABFABFABFABFABFABFABFABFABFABFABFABFABFABFABFABFABFABFABFABFABFABFABFABFABFABFABFABFABFABFABFABFABFABFABFA
BDIBDIBDIBDIBDIBDIBDIBDIBDIBDIBDIBDIBDIBDIBDIBDIBDIBDIBDIBDIBDIBDIBDIBDIBDIBDIBDIBDIBDIBDIBDIBDIBDIBDIBDIBDIBDIBDIBDIBDIBDIBDIBDIBDIBDIBDICMRCMRCMRCMRCMRCMRCMRCMRCMRCMRCMRCMRCMRCMRCMRCMRCMRCMRCMRCMRCMRCMRCMRCMRCMRCMRCMRCMRCMRCMRCMRCMRCMRCMRCMRCMRCMRCMRCMRCMRCMRCMRCMRCMRCMRCMRCMR
CANCANCANCANCANCANCANCANCANCANCANCANCANCANCANCANCANCANCANCANCANCANCANCANCANCANCANCANCANCANCANCANCANCANCANCANCANCANCANCANCANCANCANCANCANCANCANCANCANCPVCPVCPVCPVCPVCPVCPVCPVCPVCPVCPVCPVCPVCPVCPVCPVCPVCPVCPVCPVCPVCPVCPVCPVCPVCPVCPVCPVCPVCPVCPVCPVCPVCPVCPVCPVCPVCPVCPVCPVCPVCPVCPVCPVCPVCPV
CAFCAFCAFCAFCAFCAFCAFCAFCAFCAFCAFCAFCAFCAFCAFCAFCAFCAFCAFCAFCAFCAFCAFCAFCAFCAFCAFCAFCAFCAFCAFCAFCAFCAFCAFCAFCAFCAFCAFCAFCAFCAFCAFCAFCAFCAF
TCDTCDTCDTCDTCDTCDTCDTCDTCDTCDTCDTCDTCDTCDTCDTCDTCDTCDTCDTCDTCDTCDTCDTCDTCDTCDTCDTCDTCDTCDTCDTCDTCDTCDTCDTCDTCDTCDTCDTCDTCDTCDTCDTCDTCD
CHLCHLCHLCHLCHLCHLCHLCHLCHLCHLCHLCHLCHLCHLCHLCHLCHLCHLCHLCHLCHLCHLCHLCHLCHLCHLCHLCHLCHLCHLCHLCHLCHLCHLCHLCHLCHLCHLCHLCHLCHLCHLCHL
CHNCHNCHNCHNCHNCHNCHNCHNCHNCHNCHNCHNCHNCHNCHNCHNCHNCHNCHNCHNCHNCHNCHNCHNCHNCHNCHNCHNCHNCHNCHNCHNCHNCHNCHNCHNCHNCHNCHNCHNCHNCHNCHNCHNCHNCHNCHN
CHKCHKCHKCHKCHKCHKCHKCHKCHKCHKCHKCHKCHKCHKCHKCHKCHKCHKCHKCHKCHKCHKCHKCHKCHKCHKCHKCHKCHKCHKCHKCHKCHKCHKCHKCHKCHKCHKCHKCHKCHKCHKCHKCHKCHKCHK
COMCOMCOMCOMCOMCOMCOMCOMCOMCOMCOMCOMCOMCOMCOMCOMCOMCOMCOMCOMCOMCOMCOMCOMCOMCOMCOMCOMCOMCOMCOMCOMCOMCOMCOMCOMCOMCOMCOMCOMCOMCOMCOMCOMCOMCOM
ZARZARZARZARZARZARZARZARZARZARZARZARZARZARZARZARZARZARZARZARZARZARZARZARZARZARZARZARZAR
COGCOGCOGCOGCOGCOGCOGCOGCOGCOGCOGCOGCOGCOGCOGCOGCOGCOGCOGCOGCOGCOGCOGCOGCOGCOGCOGCOGCOGCOGCOGCOGCOGCOGCOGCOGCOGCOGCOGCOGCOGCOGCOGCOGCOG
CIVCIVCIVCIVCIVCIVCIVCIVCIVCIVCIVCIVCIVCIVCIVCIVCIVCIVCIVCIVCIVCIVCIVCIVCIVCIVCIVCIVCIVCIVCIVCIVCIVCIVCIVCIVCIVCIVCIVCIVCIVCIVCIVCIVCIVCIVCIV
CYPCYPCYPCYPCYPCYPCYPCYPCYPCYPCYPCYPCYPCYPCYPCYPCYPCYPCYPCYPCYPCYPCYPCYPCYPCYPCYPCYPCYPCYPCYPCYPCYPCYPCYPCYPCYPCYPCYPCYPCYPCYPCYPCYPCYPCYP
DNKDNKDNKDNKDNKDNKDNKDNKDNKDNKDNKDNKDNKDNKDNKDNKDNKDNKDNKDNKDNKDNKDNKDNKDNKDNKDNKDNKDNKDNKDNKDNKDNKDNKDNKDNKDNKDNKDNKDNKDNKDNKDNKDNK
DOMDOMDOMDOMDOMDOMDOMDOMDOMDOMDOMDOMDOMDOMDOMDOMDOMDOMDOMDOMDOMDOMDOMDOMDOMDOMDOMDOMDOMDOMDOMDOMDOMDOMDOMDOMDOMDOMDOMDOMDOMEGYEGYEGYEGYEGYEGYEGYEGYEGYEGYEGYEGYEGYEGYEGYEGYEGYEGYEGYEGYEGYEGYEGYEGYEGYEGYEGYEGYEGYEGYEGYEGYEGYEGYEGYEGYEGYEGYEGYEGYEGYEGYEGYEGYEGYEGYEGY
GNQGNQGNQGNQGNQGNQGNQGNQGNQGNQGNQGNQGNQGNQGNQGNQGNQGNQGNQGNQGNQGNQGNQGNQGNQGNQGNQGNQGNQGNQGNQGNQGNQGNQGNQGNQGNQGNQGNQGNQGNQGNQGNQ
FJIFJIFJIFJIFJIFJIFJIFJIFJIFJIFJIFJIFJIFJIFJIFJIFJIFJIFJIFJIFJIFJIFJIFJIFJIFJIFJIFJIFJIFJIFJIFJIFJIFJIFJIFJIFJIFJIFJIFJIFJIFJIFJIFJIFJIFJI
FINFINFINFINFINFINFINFINFINFINFINFINFINFINFINFINFINFINFINFINFINFINFINFINFINFINFINFINFINFINFINFINFINFINFINFINFINFINFINFINFINFINFINFINFINFINFINFINFINFRAFRAFRAFRAFRAFRAFRAFRAFRAFRAFRAFRAFRAFRAFRAFRAFRAFRAFRAFRAFRAFRAFRAFRAFRAFRAFRAFRAFRAFRAFRAFRAFRAFRAFRAFRAFRAFRAFRAFRAFRAFRAFRAFRAFRAFRAFRAFRAFRA
GABGABGABGABGABGABGABGABGABGABGABGABGABGABGABGABGABGABGABGABGABGABGABGABGABGABGABGABGABGABGABGABGABGABGABGABGABGABGABGABGABGABGABGABGABGAB
GMBGMBGMBGMBGMBGMBGMBGMBGMBGMBGMBGMBGMBGMBGMBGMBGMBGMBGMBGMBGMBGMBGMBGMBGMBGMBGMBGMBGMBGMBGMBGMBGMBGMBGMBGMBGMBGMBGMBGMBGMBGMBGMBGMBGMB
DEUDEUDEUDEUDEUDEUDEUDEUDEUDEUDEUDEUDEUDEUDEUDEUDEUDEUDEUDEUDEUDEUDEUDEUDEUDEUDEUDEUDEUDEUDEUDEUDEUDEUDEUDEUDEUDEUDEUDEUDEUDEUDEUDEUDEUDEUDEUDEUDEU
GHAGHAGHAGHAGHAGHAGHAGHAGHAGHAGHAGHAGHAGHAGHAGHAGHAGHAGHAGHAGHAGHAGHAGHAGHAGHAGHAGHAGHAGHAGHAGHAGHAGHAGHAGHAGHAGHAGHA
GRCGRCGRCGRCGRCGRCGRCGRCGRCGRCGRCGRCGRCGRCGRCGRCGRCGRCGRCGRCGRCGRCGRCGRCGRCGRCGRCGRCGRCGRCGRCGRCGRCGRCGRCGRCGRCGRCGRCGRCGRCGRCGRCGRCGRCGRCGRCGRCGRC
GRDGRDGRDGRDGRDGRDGRDGRDGRDGRDGRDGRDGRDGRDGRDGRDGRDGRDGRDGRDGRDGRDGRDGRDGRDGRDGRDGRDGRDGRDGRDGRDGRDGRDGRDGRDGRDGRDGRDGRDGRDGRDGRDGRDGRDGRD
GTMGTMGTMGTMGTMGTMGTMGTMGTMGTMGTMGTMGTMGTMGTMGTMGTMGTMGTMGTMGTMGTMGTMGTMGTMGTMGTMGTMGTMGTMGTMGTMGTMGTMGTMGTMGTMGTMGTMGTMGTMGTMGTMGTMGTMGUYGUYGUYGUYGUYGUYGUYGUYGUYGUYGUYGUYGUYGUYGUYGUYGUYGUYGUYGUYGUYGUYGUYGUYGUYGUYGUYGUYGUYGUYGUYGUYGUYGUYGUYGUYGUYGUYGUYGUYGUYGUYGUY
HTIHTIHTIHTIHTIHTIHTIHTIHTIHTIHTIHTIHTIHTIHTIHTIHTIHTIHTIHTIHTIHTIHTIHTIHTIHTIHTIHTIHTIHTIHTIHTIHTIHTIHTIHTIHTIHTIHTIHTIHTIHTIHTIHTIHTI
HNDHNDHNDHNDHNDHNDHNDHNDHNDHNDHNDHNDHNDHNDHNDHNDHNDHNDHNDHNDHNDHNDHNDHNDHNDHNDHNDHNDHNDHNDHNDHNDHNDHNDHNDHNDHNDHNDHNDHNDHNDHNDHNDHNDHNDHND
HUNHUNHUNHUNHUNHUNHUNHUNHUNHUNHUNHUNHUNHUNHUNHUNHUNHUNHUNHUNHUNHUNHUNHUNHUNHUNHUNHUNHUNHUNHUNHUNHUNHUNHUNHUNHUNHUNHUNHUNHUNHUNHUNHUNHUNHUNHUN ISLISLISLISLISLISLISLISLISLISLISLISLISLISLISLISLISLISLISLISLISLISLISLISLISLISLISLISLISLISLISLISLISLISLISLISLISLISLISLISLISLISLISLISLISLISLISLINDINDINDINDINDINDINDINDINDINDINDINDINDINDINDINDINDINDINDINDINDINDINDINDINDINDINDINDINDINDINDINDINDINDINDINDINDINDINDINDINDINDINDINDINDINDIND
IDNIDNIDNIDN
IRNIRNIRNIRNIRNIRNIRNIRNIRNIRNIRNIRNIRNIRNIRNIRNIRNIRNIRNIRNIRNIRNIRNIRNIRNIRNIRNIRNIRNIRNIRNIRNIRNIRNIRNIRNIRNIRNIRNIRNIRNIRNIRNIRNIRNIRN
IRLIRLIRLIRLIRLIRLIRLIRLIRLIRLIRLIRLIRLIRLIRLIRLIRLIRLIRLIRLIRLIRLIRLIRLIRLIRLIRLIRLIRLIRLIRLIRLIRLIRLIRLIRLIRLIRLIRLIRLIRLIRLIRLIRLIRLIRLIRLIRLIRLISRISRISRISRISRISRISRISRISRISRISRISRISRISRISRISRISRISRISRISRISRISRISRISRISRISRISRISRISRISRISRISRISRISRISRISRISRISRISR
ITAITAITAITAITAITAITAITAITAITAITAITAITAITAITAITAITAITAITAITAITAITAITAITAITAITAITAITAITAITAITAITAITAITAITAITAITAITAITAITAITAITAITAITAITAITAITAITAITA
JAMJAMJAMJAMJAMJAMJAMJAMJAMJAMJAMJAMJAMJAMJAMJAMJAMJAMJAMJAMJAMJAMJAMJAMJAMJAMJAMJAMJAMJAMJAMJAMJAMJAMJAMJAMJAMJAMJAMJAMJAMJAMJAMJAMJAM
JPNJPNJPNJPNJPNJPNJPNJPNJPNJPNJPNJPNJPNJPNJPNJPNJPNJPNJPNJPNJPNJPNJPNJPNJPNJPNJPNJPNJPNJPNJPNJPNJPNJPNJPNJPNJPNJPNJPNJPNJPNJPNJPNJPNJPNJPNJPNJPNJPN
JORJORJORJORJORJORJORJORJORJORJORJORJORJORJORJORJORJORJORJORJORJORJORJORJORJORJORJORJORJORJORJORJORJORJORJORJORJORJORJORJORJORJORJORJORJORJOR KENKENKENKENKENKENKENKENKENKENKENKENKENKENKENKENKENKENKENKENKENKENKENKENKENKENKENKENKENKENKENKENKENKENKENKENKENKENKENKENKENKENKENKENKENKEN
KIRKIRKIRKIRKIRKIRKIRKIRKIRKIRKIRKIRKIRKIRKIRKIRKIRKIRKIRKIRKIRKIRKIRKIRKIRKIRKIRKIRKIRKIRKIRKIRKIRKIRKIRKIRKIRKIRKIRKIRKIRKIRKIRKIRKIR
KORKORKORKORKORKORKORKORKORKORKORKORKORKORKORKORKORKORKORKORKORKORKORKORKORKORKORKORKORKORKORKORKORKORKORKORKORKORKORKORKORKORKORKORKORKORKOR
KWTKWTKWTKWTKWTKWTKWTKWTKWTKWTKWTKWTKWTKWTKWTKWTKWTKWTKWTKWTKWTKWTKWTKWTKWTKWTKWTKWTKWTKWTKWTKWTKWTKWTKWTKWTKWTKWTKWTKWTKWTKWTKWTKWTKWTKWTKWT
LAOLAOLAOLAOLAOLAOLAOLAOLAOLAOLAOLAOLAOLAOLAOLAOLAOLAOLAOLAOLAOLAOLAOLAOLAOLAOLAOLAOLAOLAOLAOLAOLAOLAOLAOLAO
LBNLBNLBNLBNLBNLBNLBNLBNLBNLBNLBNLBNLBNLBNLBNLBNLBNLBNLBNLBNLBNLBNLBNLBNLBNLBNLBNLBNLBNLBNLBNLBNLBNLBNLBNLBNLBNLBNLBN
LSOLSOLSOLSOLSOLSOLSOLSOLSOLSOLSOLSOLSOLSOLSOLSOLSOLSOLSOLSOLSOLSOLSOLSOLSOLSOLSOLSOLSOLSOLSOLSOLSOLSOLSOLSOLSOLSOLSOLSOLSOLSOLSOLSOLSOLSOLBYLBYLBYLBYLBYLBYLBYLBYLBYLBYLBYLBYLBYLBYLBYLBYLBYLBYLBYLBYLBYLBYLBYLBYLBYLBYLBYLBYLBYLBYLBYLBYLBYLBYLBYLBYLBYLBYLBYLBYLBYLBYLBYLBYLBYLBYLBY
LUXLUXLUXLUXLUXLUXLUXLUXLUXLUXLUXLUXLUXLUXLUXLUXLUXLUXLUXLUXLUXLUXLUXLUXLUXLUXLUXLUXLUXLUXLUXLUXLUXLUXLUXLUXLUXLUXLUXLUXLUXLUXLUXLUXLUXLUXLUXLUXLUX
MDGMDGMDGMDGMDGMDGMDGMDGMDGMDGMDGMDGMDGMDGMDGMDGMDGMDGMDGMDGMDGMDGMDGMDGMDGMDGMDGMDGMDGMDGMDGMDGMDGMDGMDGMDGMDGMDGMDGMDGMDGMDGMDGMDGMDGMDG
MWIMWIMWIMWIMWIMWIMWIMWIMWIMWIMWIMWIMWIMWIMWIMWIMWIMWIMWIMWIMWIMWIMWIMWIMWIMWIMWIMWIMWIMWIMWIMWIMWIMWIMWIMWIMWIMWIMWIMWIMWIMWIMWIMWI
MYSMYSMYSMYSMYSMYSMYSMYSMYSMYSMYSMYSMYSMYSMYSMYSMYSMYSMYSMYSMYSMYSMYSMYSMYSMYSMYSMYSMYSMYSMYSMYSMYSMYSMYSMYSMYSMYSMYSMYSMYSMYSMYSMYSMYSMYSMYSMDVMDVMDVMDVMDVMDVMDVMDVMDVMDVMDVMDVMDVMDVMDVMDVMDVMDVMDVMDVMDVMDVMDVMDVMDVMDVMDVMDVMDVMDVMDVMDVMDVMDVMDVMDVMDVMDVMDVMDVMDVMDVMDVMDVMDVMDV
MLIMLIMLIMLIMLIMLIMLIMLIMLIMLIMLIMLIMLIMLIMLIMLIMLIMLIMLIMLIMLIMLIMLIMLIMLIMLIMLIMLIMLIMLIMLIMLIMLIMLIMLIMLIMLIMLIMLIMLIMLIMLIMLIMLIMLIMLIMLIMRTMRTMRTMRTMRTMRTMRTMRTMRTMRTMRTMRTMRTMRTMRTMRTMRTMRTMRTMRTMRTMRTMRTMRTMRTMRTMRTMRTMRTMRTMRTMRTMRTMRTMRTMRTMRTMRTMRTMRTMRTMRTMRTMRTMRTMRT
MUSMUSMUSMUSMUSMUSMUSMUSMUSMUSMUSMUSMUSMUSMUSMUSMUSMUSMUSMUSMUSMUSMUSMUSMUSMUSMUSMUSMUSMUSMUSMUSMUSMUSMUSMUSMUSMUSMUSMUSMUSMUSMUSMUSMUSMUSMUS
MEXMEXMEXMEXMEXMEXMEXMEXMEXMEXMEXMEXMEXMEXMEXMEXMEXMEXMEXMEXMEXMEXMEXMEXMEXMEXMEXMEXMEXMEXMEXMEXMEXMEXMEXMEXMEXMEXMEXMEXMARMARMARMARMARMARMARMARMARMARMARMARMARMARMARMARMARMARMARMARMARMARMARMARMARMARMARMARMARMARMARMARMARMARMARMARMARMARMARMARMARMARMARMARMARMARMARMOZMOZMOZMOZMOZMOZMOZMOZMOZMOZMOZMOZMOZMOZMOZMOZMOZMOZMOZMOZMOZMOZMOZMOZMOZMOZMOZMOZMOZMOZMOZMOZMOZMOZMOZMOZ
MMRMMRMMRMMRMMRMMRMMRMMRMMRMMRMMRMMRMMRMMRMMRMMRMMRMMRMMRMMRMMRMMRMMRMMRMMRMMRMMRMMRMMRMMRMMRMMRMMRMMRMMRMMRMMRMMRMMRMMRMMRMMRMMRMMR
NPLNPLNPLNPLNPLNPLNPLNPLNPLNPLNPLNPLNPLNPLNPLNPLNPLNPLNPLNPLNPLNPLNPLNPLNPLNPLNPLNPLNPLNPLNPLNPLNPLNPLNPLNPLNPLNPLNPLNPLNPLNPLNPLNPLNPLNPLNPL
NLDNLDNLDNLDNLDNLDNLDNLDNLDNLDNLDNLDNLDNLDNLDNLDNLDNLDNLDNLDNLDNLDNLDNLDNLDNLDNLDNLDNLDNLDNLDNLDNLDNLDNLDNLDNLDNLDNLDNLDNLDNLDNLDNLDNLDNLDNLDNLDNLD
NZLNZLNZLNZLNZLNZLNZLNZLNZLNZLNZLNZLNZLNZLNZLNZLNZLNZLNZLNZLNZLNZLNZLNZLNZLNZLNZLNZLNZLNZLNZLNZLNZLNZLNZLNZLNZLNZLNZLNZLNZLNZLNZLNZL
NERNERNERNERNERNERNERNERNERNERNERNERNERNERNERNERNERNERNERNERNERNERNERNERNERNERNERNERNERNERNERNERNERNERNERNERNERNERNERNERNERNERNERNERNERNERNER
NGANGANGANGANGANGANGANGANGANGANGANGANGANGANGANGANGANGANGANGANGANGANGANGANGANGANGANGANGANGANGANGANGANGANGANGANGANGANGANGANGANORNORNORNORNORNORNORNORNORNORNORNORNORNORNORNORNORNORNORNORNORNORNORNORNORNORNORNORNORNORNORNORNORNORNORNORNORNORNORNORNORNORNORNORNORNORNORNORNOROMNOMNOMNOMNOMNOMNOMNOMNOMNOMNOMNOMNOMNOMNOMNOMNOMNOMNOMNOMNOMNOMNOMNOMNOMNOMNOMNOMNOMNOMNOMNOMNOMNOMNOMNOMNOMNOMNOMNOMNOMNOMNOMNOMNOMNOMNOMN
PAKPAKPAKPAKPAKPAKPAKPAKPAKPAKPAKPAKPAKPAKPAKPAKPAKPAKPAKPAKPAKPAKPAKPAKPAKPAKPAKPAKPAKPAKPAKPAKPAKPAKPAKPAKPAKPAKPAKPAKPAKPAKPAKPAKPAKPAKPAKPANPANPANPANPANPANPANPANPANPANPANPANPANPANPANPANPANPANPANPANPANPANPANPANPANPANPANPANPANPANPANPANPANPANPANPANPANPANPANPANPANPANPANPANPANPANPAN
PNGPNGPNGPNGPNGPNGPNGPNGPNGPNGPNGPNGPNGPNGPNGPNGPNGPNGPNGPNGPNGPNGPNGPNGPNGPNGPNGPNGPNGPNGPNGPNGPNGPNGPNGPNGPNGPNGPNGPNGPNGPNGPNGPNGPNGPNG
PRYPRYPRYPRYPRYPRYPRYPRYPRYPRYPRYPRYPRYPRYPRYPRYPRYPRYPRYPRYPRYPRYPRYPRYPRYPRYPRYPRYPRYPRYPRYPRYPRYPRYPRYPRYPRYPRYPRYPRYPRYPRYPRYPRYPRYPRYPRYPERPERPERPERPERPERPERPERPERPERPERPERPERPERPERPERPERPERPERPERPERPERPERPERPERPERPERPERPERPERPERPERPERPERPHLPHLPHLPHLPHLPHLPHLPHLPHLPHLPHLPHLPHLPHLPHLPHLPHLPHLPHLPHLPHLPHLPHLPHLPHLPHLPHLPHLPHLPHLPHLPHLPHLPHLPHLPHLPHLPHLPHLPHLPHLPHLPHLPHLPHLPHL
POLPOLPOLPOLPOLPOLPOLPOLPOLPOLPOLPOLPOLPOLPOLPOLPOLPOLPOLPOLPOLPOLPOLPOLPOLPOLPOLPOLPOLPOLPOLPOLPOLPOLPOLPOLPOLPOLPOLPRTPRTPRTPRTPRTPRTPRTPRTPRTPRTPRTPRTPRTPRTPRTPRTPRTPRTPRTPRTPRTPRTPRTPRTPRTPRTPRTPRTPRTPRTPRTPRTPRTPRTPRTPRTPRTPRTPRTPRTPRTPRTPRTPRTPRT
QATQATQATQATQATQATQATQATQATQATQATQATQATQATQATQATQATQATQATQATQATQATQATQATQATQATQATQATQATQATQATQATQATQATQATQATQATQATQATQATQATQATQATQATQATQAT
ROMROMROMROMROMROMROMROMROMROMROMROMROMROMROMROMROMROMROMROMROMROMROMROMROMROMROMROMROMROMROMROMROMROMROMROMROM
RWARWARWARWARWARWARWARWARWARWARWARWARWARWARWARWARWARWARWARWARWARWARWARWARWARWARWARWARWARWARWARWARWARWARWARWARWARWARWARWARWARWARWARWARWA STPSTPSTPSTPSTPSTPSTPSTPSTPSTPSTPSTPSTPSTPSTPSTPSTPSTPSTPSTPSTPSTPSTPSTPSTPSTPSTPSTPSTPSTPSTPSTPSTPSTPSTPSTPSTPSTPSTPSTPSTPSAUSAUSAUSAUSAUSAUSAUSAUSAUSAUSAUSAUSAUSAUSAUSAUSAUSAUSAUSAUSAUSAUSAUSAUSAUSAUSAUSAUSAUSAUSAUSAUSAUSAUSAUSAUSAUSAUSAUSAUSAUSAUSAUSAUSAUSAUSAU
SENSENSENSENSENSENSENSENSENSENSENSENSENSENSENSENSENSENSENSENSENSENSENSENSENSENSENSENSENSENSENSENSENSENSENSENSENSENSENSENSENSENSENSENSENSEN
SYCSYCSYCSYCSYCSYCSYCSYCSYCSYCSYCSYCSYCSYCSYCSYCSYCSYCSYCSYCSYCSYCSYCSYCSYCSYCSYCSYCSYCSYCSYCSYCSYCSYCSYCSYCSYCSYCSYCSYCSYCSYCSYCSYCSYCSYC
SLESLESLESLESLESLESLESLESLESLESLESLESLESLESLESLESLESLESLESLESLESLESLESLESLESLESLESLESLESLESLESLESLESLESLESLESLE
SGPSGPSGPSGPSGPSGPSGPSGPSGPSGPSGPSGPSGPSGPSGPSGPSGPSGPSGPSGPSGPSGPSGPSGPSGPSGPSGPSGPSGPSGPSGPSGPSGPSGPSGPSGPSGPSGPSGPSGPSGPSGPSGPSGPSGPSGPSGP
SLBSLBSLBSLBSLBSLBSLBSLBSLBSLBSLBSLBSLBSLBSLBSLBSLBSLBSLBSLBSLBSLBSLBSLBSLBSLBSLBSLBSLBSLBSLBSLBSLBSLBSLBSLBSLBSLBSLBSLBSLBSLBSLBSLBSLBSLB
ZAFZAFZAFZAFZAFZAFZAFZAFZAFZAFZAFZAFZAFZAFZAFZAFZAFZAFZAFZAFZAFZAFZAFZAFZAFZAFZAFZAFZAFZAFZAFZAFZAFZAFZAFZAFZAFZAFZAFZAFZAFZAFZAFZAFZAFZAFZAF
ESPESPESPESPESPESPESPESPESPESPESPESPESPESPESPESPESPESPESPESPESPESPESPESPESPESPESPESPESPESPESPESPESPESPESPESPESPESPESPESPESPESPESPESPESP
LKALKALKALKALKALKALKALKALKALKALKALKALKALKALKALKALKALKALKALKALKALKALKALKALKALKALKALKALKALKALKALKALKALKALKALKALKALKALKALKALKALKALKALKALKALKALKA
KNAKNAKNAKNAKNAKNAKNAKNAKNAKNAKNAKNAKNAKNAKNAKNAKNAKNAKNAKNAKNAKNAKNAKNAKNAKNAKNAKNAKNAKNAKNAKNAKNAKNAKNAKNAKNAKNAKNAKNAKNAKNAKNAKNAKNAKNAKNA
LCALCALCALCALCALCALCALCALCALCALCALCALCALCALCALCALCALCALCALCALCALCALCALCALCALCALCALCALCALCALCALCALCALCALCALCALCALCALCALCALCALCALCALCALCALCALCAVCTVCTVCTVCTVCTVCTVCTVCTVCTVCTVCTVCTVCTVCTVCTVCTVCTVCTVCTVCTVCTVCTVCTVCTVCTVCTVCTVCTVCTVCTVCTVCTVCTVCTVCTVCTVCTVCTVCTVCTVCTVCTVCTVCTVCTVCT
SDNSDNSDNSDNSDNSDNSDNSDNSDNSDNSDNSDNSDNSDNSDNSDNSDNSDNSDNSDNSDNSDNSDNSDNSDNSDNSDNSDNSDNSDNSDNSDNSDNSDNSDNSDN
SWZSWZSWZSWZSWZSWZSWZSWZSWZSWZSWZSWZSWZSWZSWZSWZSWZSWZSWZSWZSWZSWZSWZSWZSWZSWZSWZSWZSWZSWZSWZSWZSWZSWZSWZSWZSWZSWZSWZSWZSWZSWZSWZSWZSWZSWZSWESWESWESWESWESWESWESWESWESWESWESWESWESWESWESWESWESWESWESWESWESWESWESWESWESWESWESWESWESWESWESWESWESWESWESWESWESWESWESWESWESWESWESWESWESWESWESWESWE
CHECHECHECHECHECHECHECHECHECHECHECHECHECHECHECHECHECHECHECHECHECHECHECHECHECHECHECHECHECHECHECHECHECHECHECHECHECHECHECHECHECHECHECHECHECHECHECHECHESYRSYRSYRSYRSYRSYRSYRSYRSYRSYRSYRSYRSYRSYRSYRSYRSYRSYRSYRSYRSYRSYRSYRSYRSYRSYRSYRSYRSYRSYRSYRSYRSYRSYRSYRSYRSYRSYRSYRSYRSYRSYRSYRSYRSYRSYR
TZATZATZATZATZATZATZATZATZATZATZATZATZATZATZATZATZATZATZATZATZATZATZATZATZATZATZATZATZATZATZATZATZATZATZATZATZATZATZATZATZATZATZATZATZATZATZA
THATHATHATHATHATHATHATHATHATHATHATHATHATHATHATHATHATHATHATHATHATHATHATHATHATHATHATHATHATHATHATHATHATHATHATHATHATHATHATHATHATHATHATHATHATHATHA
TGOTGOTGOTGOTGOTGOTGOTGOTGOTGOTGOTGOTGOTGOTGOTGOTGOTGOTGOTGOTGOTGOTGOTGOTGOTGOTGOTGOTGOTGOTGOTGOTGOTGOTGOTGOTGOTGOTGOTGOTGOTGOTGOTGOTGOTGOTGO
TUNTUNTUNTUNTUNTUNTUNTUNTUNTUNTUNTUNTUNTUNTUNTUNTUNTUNTUNTUNTUNTUNTUNTUNTUNTUNTUNTUNTUNTUNTUNTUNTUNTUNTUNTUNTUNTUNTUNTUNTUNTUNTUNTUNTUNTUNTUNTURTURTURTURTURTURTURTURTURTURTURTURTURTURTURTURTURTURTURTURTURTURTURTURTURTURTUR
AREAREAREAREAREAREAREAREAREAREAREAREAREAREAREAREAREAREAREAREAREAREAREAREAREAREAREAREAREAREAREAREAREAREAREAREAREAREAREAREAREAREAREAREAREAREAREGBRGBRGBRGBRGBRGBRGBRGBRGBRGBRGBRGBRGBRGBRGBRGBRGBRGBRGBRGBRGBRGBRGBRGBRGBRGBRGBRGBRGBRGBRGBRGBRGBRGBRGBRGBRGBRGBRGBRGBRGBRGBRGBRGBRGBRGBRGBRGBRGBRUSAUSAUSAUSAUSAUSAUSAUSAUSAUSAUSAUSAUSAUSAUSAUSAUSAUSAUSAUSAUSAUSAUSAUSAUSAUSAUSAUSAUSAUSAUSAUSAUSAUSAUSAUSAUSAUSAUSAUSAUSAUSAUSAUSAUSAUSAUSA
VENVENVENVENVENVENVENVENVENVENVENVENVENVENVENVENVENVENVENVENVENVENVENVENVENVENVENVENVENVENVENVENVENVENVENVENVENVENVENVEN
-20
24
68
Per
Cap
ital
Rea
l GD
P G
row
th(I
n pe
rcen
t; a
vg 1
960-
2010
)
0 50 100 150 200 250Indicator of Macroeconomic Stability
(Inflation Variability Indicator; avg 1960-2010)
BGDBGDBGDBGDBGDBGDBGDBGDBGDBGDBGDBGDBGDBGDBGDBGDBGDBGDBGDBGDBGDBGDBGDBGDBGDBGDBGDBGDBGDBGDBGDBGDBGDBGDBGDBGDBGDBGDBGDBGDBGDBGDBGDBGDBGDBGDBGD
BENBENBENBENBENBENBENBENBENBENBENBENBENBENBENBENBENBENBENBENBENBENBENBENBENBENBENBENBENBENBENBENBENBENBENBENBENBENBENBENBENBENBENBENBENBENBEN
BTNBTNBTNBTNBTNBTNBTNBTNBTNBTNBTNBTNBTNBTNBTNBTNBTNBTNBTNBTNBTNBTNBTNBTNBTNBTNBTNBTNBTNBTNBTNBTNBTNBTNBTNBTNBTNBTNBTNBTNBTNBTNBTNBTNBTNBTN
BOLBOLBOLBOLBOLBOLBOLBOLBOLBOLBOLBOLBOLBOLBOLBOLBOLBOLBOLBOLBOLBOLBOLBOLBOLBOLBOLBOLBOLBOLBOLBOLBOLBOLBOLBOLBOLBOLBOLBOLBOLBOLBOLBOLBOLBOL BFABFABFABFABFABFABFABFABFABFABFABFABFABFABFABFABFABFABFABFABFABFABFABFABFABFABFABFABFABFABFABFABFABFABFABFABFABFABFABFABFABFABFABFABFABFABFA
BDIBDIBDIBDIBDIBDIBDIBDIBDIBDIBDIBDIBDIBDIBDIBDIBDIBDIBDIBDIBDIBDIBDIBDIBDIBDIBDIBDIBDIBDIBDIBDIBDIBDIBDIBDIBDIBDIBDIBDIBDIBDIBDIBDIBDIBDICMRCMRCMRCMRCMRCMRCMRCMRCMRCMRCMRCMRCMRCMRCMRCMRCMRCMRCMRCMRCMRCMRCMRCMRCMRCMRCMRCMRCMRCMRCMRCMRCMRCMRCMRCMRCMRCMRCMRCMRCMRCMRCMRCMRCMRCMRCMR
CPVCPVCPVCPVCPVCPVCPVCPVCPVCPVCPVCPVCPVCPVCPVCPVCPVCPVCPVCPVCPVCPVCPVCPVCPVCPVCPVCPVCPVCPVCPVCPVCPVCPVCPVCPVCPVCPVCPVCPVCPVCPVCPVCPVCPVCPV
CAFCAFCAFCAFCAFCAFCAFCAFCAFCAFCAFCAFCAFCAFCAFCAFCAFCAFCAFCAFCAFCAFCAFCAFCAFCAFCAFCAFCAFCAFCAFCAFCAFCAFCAFCAFCAFCAFCAFCAFCAFCAFCAFCAFCAFCAF
TCDTCDTCDTCDTCDTCDTCDTCDTCDTCDTCDTCDTCDTCDTCDTCDTCDTCDTCDTCDTCDTCDTCDTCDTCDTCDTCDTCDTCDTCDTCDTCDTCDTCDTCDTCDTCDTCDTCDTCDTCDTCDTCDTCDTCDTCD
COMCOMCOMCOMCOMCOMCOMCOMCOMCOMCOMCOMCOMCOMCOMCOMCOMCOMCOMCOMCOMCOMCOMCOMCOMCOMCOMCOMCOMCOMCOMCOMCOMCOMCOMCOMCOMCOMCOMCOMCOMCOMCOMCOMCOMCOM
ZARZARZARZARZARZARZARZARZARZARZARZARZARZARZARZARZARZARZARZARZARZARZARZARZARZARZARZARZARZARZARZARZARZARZARZARZARZARZARZARZARZARZARZARZARZARZAR
COGCOGCOGCOGCOGCOGCOGCOGCOGCOGCOGCOGCOGCOGCOGCOGCOGCOGCOGCOGCOGCOGCOGCOGCOGCOGCOGCOGCOGCOGCOGCOGCOGCOGCOGCOGCOGCOGCOGCOGCOGCOGCOGCOGCOGCOG
CIVCIVCIVCIVCIVCIVCIVCIVCIVCIVCIVCIVCIVCIVCIVCIVCIVCIVCIVCIVCIVCIVCIVCIVCIVCIVCIVCIVCIVCIVCIVCIVCIVCIVCIVCIVCIVCIVCIVCIVCIVCIVCIVCIVCIVCIVCIV
GMBGMBGMBGMBGMBGMBGMBGMBGMBGMBGMBGMBGMBGMBGMBGMBGMBGMBGMBGMBGMBGMBGMBGMBGMBGMBGMBGMBGMBGMBGMBGMBGMBGMBGMBGMBGMBGMBGMBGMBGMBGMBGMBGMBGMBGMBGHAGHAGHAGHAGHAGHAGHAGHAGHAGHAGHAGHAGHAGHAGHAGHAGHAGHAGHAGHAGHAGHAGHAGHAGHAGHAGHAGHAGHAGHAGHAGHAGHAGHAGHAGHAGHAGHAGHAGHAGHAGHAGHAGHAGHAGHAGHA
GRDGRDGRDGRDGRDGRDGRDGRDGRDGRDGRDGRDGRDGRDGRDGRDGRDGRDGRDGRDGRDGRDGRDGRDGRDGRDGRDGRDGRDGRDGRDGRDGRDGRDGRDGRDGRDGRDGRDGRDGRDGRDGRDGRDGRDGRD
GUYGUYGUYGUYGUYGUYGUYGUYGUYGUYGUYGUYGUYGUYGUYGUYGUYGUYGUYGUYGUYGUYGUYGUYGUYGUYGUYGUYGUYGUYGUYGUYGUYGUYGUYGUYGUYGUYGUYGUYGUYGUYGUYGUYGUYGUYGUY
HTIHTIHTIHTIHTIHTIHTIHTIHTIHTIHTIHTIHTIHTIHTIHTIHTIHTIHTIHTIHTIHTIHTIHTIHTIHTIHTIHTIHTIHTIHTIHTIHTIHTIHTIHTIHTIHTIHTIHTIHTIHTIHTIHTIHTIHTI
HNDHNDHNDHNDHNDHNDHNDHNDHNDHNDHNDHNDHNDHNDHNDHNDHNDHNDHNDHNDHNDHNDHNDHNDHNDHNDHNDHNDHNDHNDHNDHNDHNDHNDHNDHNDHNDHNDHNDHNDHNDHNDHNDHNDHNDHNDKENKENKENKENKENKENKENKENKENKENKENKENKENKENKENKENKENKENKENKENKENKENKENKENKENKENKENKENKENKENKENKENKENKENKENKENKENKENKENKENKENKENKENKENKENKENKEN
KIRKIRKIRKIRKIRKIRKIRKIRKIRKIRKIRKIRKIRKIRKIRKIRKIRKIRKIRKIRKIRKIRKIRKIRKIRKIRKIRKIRKIRKIRKIRKIRKIRKIRKIRKIRKIRKIRKIRKIRKIRKIRKIRKIRKIR
LAOLAOLAOLAOLAOLAOLAOLAOLAOLAOLAOLAOLAOLAOLAOLAOLAOLAOLAOLAOLAOLAOLAOLAOLAOLAOLAOLAOLAOLAOLAOLAOLAOLAOLAOLAOLAOLAOLAOLAOLAOLAOLAOLAOLAOLAO
LSOLSOLSOLSOLSOLSOLSOLSOLSOLSOLSOLSOLSOLSOLSOLSOLSOLSOLSOLSOLSOLSOLSOLSOLSOLSOLSOLSOLSOLSOLSOLSOLSOLSOLSOLSOLSOLSOLSOLSOLSOLSOLSOLSOLSOLSOMWIMWIMWIMWIMWIMWIMWIMWIMWIMWIMWIMWIMWIMWIMWIMWIMWIMWIMWIMWIMWIMWIMWIMWIMWIMWIMWIMWIMWIMWIMWIMWIMWIMWIMWIMWIMWIMWIMWIMWIMWIMWIMWIMWIMWIMWI
MDVMDVMDVMDVMDVMDVMDVMDVMDVMDVMDVMDVMDVMDVMDVMDVMDVMDVMDVMDVMDVMDVMDVMDVMDVMDVMDVMDVMDVMDVMDVMDVMDVMDVMDVMDVMDVMDVMDVMDVMDVMDVMDVMDVMDVMDV
MLIMLIMLIMLIMLIMLIMLIMLIMLIMLIMLIMLIMLIMLIMLIMLIMLIMLIMLIMLIMLIMLIMLIMLIMLIMLIMLIMLIMLIMLIMLIMLIMLIMLIMLIMLIMLIMLIMLIMLIMLIMLIMLIMLIMLIMLIMLIMRTMRTMRTMRTMRTMRTMRTMRTMRTMRTMRTMRTMRTMRTMRTMRTMRTMRTMRTMRTMRTMRTMRTMRTMRTMRTMRTMRTMRTMRTMRTMRTMRTMRTMRTMRTMRTMRTMRTMRTMRTMRTMRTMRTMRTMRT
MOZMOZMOZMOZMOZMOZMOZMOZMOZMOZMOZMOZMOZMOZMOZMOZMOZMOZMOZMOZMOZMOZMOZMOZMOZMOZMOZMOZMOZMOZMOZMOZMOZMOZMOZMOZMOZMOZMOZMOZMOZMOZMOZMOZMOZMOZ
NPLNPLNPLNPLNPLNPLNPLNPLNPLNPLNPLNPLNPLNPLNPLNPLNPLNPLNPLNPLNPLNPLNPLNPLNPLNPLNPLNPLNPLNPLNPLNPLNPLNPLNPLNPLNPLNPLNPLNPLNPLNPLNPLNPLNPLNPLNPL
NERNERNERNERNERNERNERNERNERNERNERNERNERNERNERNERNERNERNERNERNERNERNERNERNERNERNERNERNERNERNERNERNERNERNERNERNERNERNERNERNERNERNERNERNERNERNER
NGANGANGANGANGANGANGANGANGANGANGANGANGANGANGANGANGANGANGANGANGANGANGANGANGANGANGANGANGANGANGANGANGANGANGANGANGANGANGANGANGANGANGANGANGANGANGA
PNGPNGPNGPNGPNGPNGPNGPNGPNGPNGPNGPNGPNGPNGPNGPNGPNGPNGPNGPNGPNGPNGPNGPNGPNGPNGPNGPNGPNGPNGPNGPNGPNGPNGPNGPNGPNGPNGPNGPNGPNGPNGPNGPNGPNGPNGRWARWARWARWARWARWARWARWARWARWARWARWARWARWARWARWARWARWARWARWARWARWARWARWARWARWARWARWARWARWARWARWARWARWARWARWARWARWARWARWARWARWARWARWARWARWARWASTPSTPSTPSTPSTPSTPSTPSTPSTPSTPSTPSTPSTPSTPSTPSTPSTPSTPSTPSTPSTPSTPSTPSTPSTPSTPSTPSTPSTPSTPSTPSTPSTPSTPSTPSTPSTPSTPSTPSTPSTPSTPSTPSTPSTPSTP
SENSENSENSENSENSENSENSENSENSENSENSENSENSENSENSENSENSENSENSENSENSENSENSENSENSENSENSENSENSENSENSENSENSENSENSENSENSENSENSENSENSENSENSENSENSENSLESLESLESLESLESLESLESLESLESLESLESLESLESLESLESLESLESLESLESLESLESLESLESLESLESLESLESLESLESLESLESLESLESLESLESLESLESLESLESLESLESLESLESLESLESLESLBSLBSLBSLBSLBSLBSLBSLBSLBSLBSLBSLBSLBSLBSLBSLBSLBSLBSLBSLBSLBSLBSLBSLBSLBSLBSLBSLBSLBSLBSLBSLBSLBSLBSLBSLBSLBSLBSLBSLBSLBSLBSLBSLBSLBSLB
LCALCALCALCALCALCALCALCALCALCALCALCALCALCALCALCALCALCALCALCALCALCALCALCALCALCALCALCALCALCALCALCALCALCALCALCALCALCALCALCALCALCALCALCALCALCALCAVCTVCTVCTVCTVCTVCTVCTVCTVCTVCTVCTVCTVCTVCTVCTVCTVCTVCTVCTVCTVCTVCTVCTVCTVCTVCTVCTVCTVCTVCTVCTVCTVCTVCTVCTVCTVCTVCTVCTVCTVCTVCTVCTVCTVCTVCT
SDNSDNSDNSDNSDNSDNSDNSDNSDNSDNSDNSDNSDNSDNSDNSDNSDNSDNSDNSDNSDNSDNSDNSDNSDNSDNSDNSDNSDNSDNSDNSDNSDNSDNSDNSDNSDNSDNSDNSDNSDNSDNSDNSDNSDNSDNSDN
TGOTGOTGOTGOTGOTGOTGOTGOTGOTGOTGOTGOTGOTGOTGOTGOTGOTGOTGOTGOTGOTGOTGOTGOTGOTGOTGOTGOTGOTGOTGOTGOTGOTGOTGOTGOTGOTGOTGOTGOTGOTGOTGOTGOTGOTGOTGO
-20
24
68
Per
Cap
ital
Rea
l GD
P G
row
th(I
n pe
rcen
t; a
vg 1
960-
2010
)
0 2 4 6Quality of Macroeconomic Management
(CPIA Indicator; avg 2005-2009)
II. Low Income Countries
BGDBGDBGDBGDBGDBGDBGDBGDBGDBGDBGDBGDBGDBGDBGDBGDBGDBGDBGDBGDBGDBGDBGDBGDBGDBGDBGDBGDBGDBGDBGDBGDBGDBGDBGDBGDBGDBGDBGDBGDBGDBGDBGDBGD
BENBENBENBENBENBENBENBENBENBENBENBENBENBENBENBENBENBENBENBENBENBENBENBENBENBENBENBENBENBENBENBENBENBENBENBENBENBENBENBENBENBENBENBENBENBEN
BTNBTNBTNBTNBTNBTNBTNBTNBTNBTNBTNBTNBTNBTNBTNBTNBTNBTNBTNBTNBTNBTNBTNBTNBTNBTNBTNBTNBTNBTNBTNBTNBTNBTNBTNBTNBTNBTNBTNBTNBTNBTNBTNBTNBTNBTN
BOLBOLBOLBOLBOLBOLBOLBOLBOLBOLBOLBOLBOLBOLBOLBOLBOLBOLBOLBOLBOLBOLBOLBOLBOLBOLBOLBOLBOLBOLBOLBOLBOLBOLBOLBOLBOLBOLBOLBFABFABFABFABFABFABFABFABFABFABFABFABFABFABFABFABFABFABFABFABFABFABFABFABFABFABFABFABFABFABFABFABFABFABFABFABFABFABFABFABFABFABFABFABFABFABFA
BDIBDIBDIBDIBDIBDIBDIBDIBDIBDIBDIBDIBDIBDIBDIBDIBDIBDIBDIBDIBDIBDIBDIBDIBDIBDIBDIBDIBDIBDIBDIBDIBDIBDIBDIBDIBDIBDIBDIBDIBDIBDIBDIBDIBDIBDICMRCMRCMRCMRCMRCMRCMRCMRCMRCMRCMRCMRCMRCMRCMRCMRCMRCMRCMRCMRCMRCMRCMRCMRCMRCMRCMRCMRCMRCMRCMRCMRCMRCMRCMRCMRCMRCMRCMRCMRCMRCMRCMRCMRCMRCMRCMR
CPVCPVCPVCPVCPVCPVCPVCPVCPVCPVCPVCPVCPVCPVCPVCPVCPVCPVCPVCPVCPVCPVCPVCPVCPVCPVCPVCPVCPVCPVCPVCPVCPVCPVCPVCPVCPVCPVCPVCPVCPVCPVCPVCPVCPVCPV
CAFCAFCAFCAFCAFCAFCAFCAFCAFCAFCAFCAFCAFCAFCAFCAFCAFCAFCAFCAFCAFCAFCAFCAFCAFCAFCAFCAFCAFCAFCAFCAFCAFCAFCAFCAFCAFCAFCAFCAFCAFCAFCAFCAFCAFCAF
TCDTCDTCDTCDTCDTCDTCDTCDTCDTCDTCDTCDTCDTCDTCDTCDTCDTCDTCDTCDTCDTCDTCDTCDTCDTCDTCDTCDTCDTCDTCDTCDTCDTCDTCDTCDTCDTCDTCDTCDTCDTCDTCDTCDTCD
COMCOMCOMCOMCOMCOMCOMCOMCOMCOMCOMCOMCOMCOMCOMCOMCOMCOMCOMCOMCOMCOMCOMCOMCOMCOMCOMCOMCOMCOMCOMCOMCOMCOMCOMCOMCOMCOMCOMCOMCOMCOMCOMCOMCOMCOM
ZARZARZARZARZARZARZARZARZARZARZARZARZARZARZARZARZARZARZARZARZARZARZARZARZARZARZARZARZAR
COGCOGCOGCOGCOGCOGCOGCOGCOGCOGCOGCOGCOGCOGCOGCOGCOGCOGCOGCOGCOGCOGCOGCOGCOGCOGCOGCOGCOGCOGCOGCOGCOGCOGCOGCOGCOGCOGCOGCOGCOGCOGCOGCOGCOG
CIVCIVCIVCIVCIVCIVCIVCIVCIVCIVCIVCIVCIVCIVCIVCIVCIVCIVCIVCIVCIVCIVCIVCIVCIVCIVCIVCIVCIVCIVCIVCIVCIVCIVCIVCIVCIVCIVCIVCIVCIVCIVCIVCIVCIVCIVCIV
GMBGMBGMBGMBGMBGMBGMBGMBGMBGMBGMBGMBGMBGMBGMBGMBGMBGMBGMBGMBGMBGMBGMBGMBGMBGMBGMBGMBGMBGMBGMBGMBGMBGMBGMBGMBGMBGMBGMBGMBGMBGMBGMBGMBGMBGHAGHAGHAGHAGHAGHAGHAGHAGHAGHAGHAGHAGHAGHAGHAGHAGHAGHAGHAGHAGHAGHAGHAGHAGHAGHAGHAGHAGHAGHAGHAGHAGHAGHAGHAGHAGHAGHAGHA
GRDGRDGRDGRDGRDGRDGRDGRDGRDGRDGRDGRDGRDGRDGRDGRDGRDGRDGRDGRDGRDGRDGRDGRDGRDGRDGRDGRDGRDGRDGRDGRDGRDGRDGRDGRDGRDGRDGRDGRDGRDGRDGRDGRDGRDGRD
GUYGUYGUYGUYGUYGUYGUYGUYGUYGUYGUYGUYGUYGUYGUYGUYGUYGUYGUYGUYGUYGUYGUYGUYGUYGUYGUYGUYGUYGUYGUYGUYGUYGUYGUYGUYGUYGUYGUYGUYGUYGUYGUY
HTIHTIHTIHTIHTIHTIHTIHTIHTIHTIHTIHTIHTIHTIHTIHTIHTIHTIHTIHTIHTIHTIHTIHTIHTIHTIHTIHTIHTIHTIHTIHTIHTIHTIHTIHTIHTIHTIHTIHTIHTIHTIHTIHTIHTI
HNDHNDHNDHNDHNDHNDHNDHNDHNDHNDHNDHNDHNDHNDHNDHNDHNDHNDHNDHNDHNDHNDHNDHNDHNDHNDHNDHNDHNDHNDHNDHNDHNDHNDHNDHNDHNDHNDHNDHNDHNDHNDHNDHNDHNDHNDKENKENKENKENKENKENKENKENKENKENKENKENKENKENKENKENKENKENKENKENKENKENKENKENKENKENKENKENKENKENKENKENKENKENKENKENKENKENKENKENKENKENKENKENKENKEN
KIRKIRKIRKIRKIRKIRKIRKIRKIRKIRKIRKIRKIRKIRKIRKIRKIRKIRKIRKIRKIRKIRKIRKIRKIRKIRKIRKIRKIRKIRKIRKIRKIRKIRKIRKIRKIRKIRKIRKIRKIRKIRKIRKIRKIR
LAOLAOLAOLAOLAOLAOLAOLAOLAOLAOLAOLAOLAOLAOLAOLAOLAOLAOLAOLAOLAOLAOLAOLAOLAOLAOLAOLAOLAOLAOLAOLAOLAOLAOLAOLAO
LSOLSOLSOLSOLSOLSOLSOLSOLSOLSOLSOLSOLSOLSOLSOLSOLSOLSOLSOLSOLSOLSOLSOLSOLSOLSOLSOLSOLSOLSOLSOLSOLSOLSOLSOLSOLSOLSOLSOLSOLSOLSOLSOLSOLSOLSO MWIMWIMWIMWIMWIMWIMWIMWIMWIMWIMWIMWIMWIMWIMWIMWIMWIMWIMWIMWIMWIMWIMWIMWIMWIMWIMWIMWIMWIMWIMWIMWIMWIMWIMWIMWIMWIMWIMWIMWIMWIMWIMWIMWI
MDVMDVMDVMDVMDVMDVMDVMDVMDVMDVMDVMDVMDVMDVMDVMDVMDVMDVMDVMDVMDVMDVMDVMDVMDVMDVMDVMDVMDVMDVMDVMDVMDVMDVMDVMDVMDVMDVMDVMDVMDVMDVMDVMDVMDVMDV
MLIMLIMLIMLIMLIMLIMLIMLIMLIMLIMLIMLIMLIMLIMLIMLIMLIMLIMLIMLIMLIMLIMLIMLIMLIMLIMLIMLIMLIMLIMLIMLIMLIMLIMLIMLIMLIMLIMLIMLIMLIMLIMLIMLIMLIMLIMLIMRTMRTMRTMRTMRTMRTMRTMRTMRTMRTMRTMRTMRTMRTMRTMRTMRTMRTMRTMRTMRTMRTMRTMRTMRTMRTMRTMRTMRTMRTMRTMRTMRTMRTMRTMRTMRTMRTMRTMRTMRTMRTMRTMRTMRTMRT
MOZMOZMOZMOZMOZMOZMOZMOZMOZMOZMOZMOZMOZMOZMOZMOZMOZMOZMOZMOZMOZMOZMOZMOZMOZMOZMOZMOZMOZMOZMOZMOZMOZMOZMOZMOZ
MMRMMRMMRMMRMMRMMRMMRMMRMMRMMRMMRMMRMMRMMRMMRMMRMMRMMRMMRMMRMMRMMRMMRMMRMMRMMRMMRMMRMMRMMRMMRMMRMMRMMRMMRMMRMMRMMRMMRMMRMMRMMRMMRMMR
NPLNPLNPLNPLNPLNPLNPLNPLNPLNPLNPLNPLNPLNPLNPLNPLNPLNPLNPLNPLNPLNPLNPLNPLNPLNPLNPLNPLNPLNPLNPLNPLNPLNPLNPLNPLNPLNPLNPLNPLNPLNPLNPLNPLNPLNPLNPL
NERNERNERNERNERNERNERNERNERNERNERNERNERNERNERNERNERNERNERNERNERNERNERNERNERNERNERNERNERNERNERNERNERNERNERNERNERNERNERNERNERNERNERNERNERNERNER
NGANGANGANGANGANGANGANGANGANGANGANGANGANGANGANGANGANGANGANGANGANGANGANGANGANGANGANGANGANGANGANGANGANGANGANGANGANGANGANGANGA
PNGPNGPNGPNGPNGPNGPNGPNGPNGPNGPNGPNGPNGPNGPNGPNGPNGPNGPNGPNGPNGPNGPNGPNGPNGPNGPNGPNGPNGPNGPNGPNGPNGPNGPNGPNGPNGPNGPNGPNGPNGPNGPNGPNGPNGPNGRWARWARWARWARWARWARWARWARWARWARWARWARWARWARWARWARWARWARWARWARWARWARWARWARWARWARWARWARWARWARWARWARWARWARWARWARWARWARWARWARWARWARWARWARWA STPSTPSTPSTPSTPSTPSTPSTPSTPSTPSTPSTPSTPSTPSTPSTPSTPSTPSTPSTPSTPSTPSTPSTPSTPSTPSTPSTPSTPSTPSTPSTPSTPSTPSTPSTPSTPSTPSTPSTPSTP
SENSENSENSENSENSENSENSENSENSENSENSENSENSENSENSENSENSENSENSENSENSENSENSENSENSENSENSENSENSENSENSENSENSENSENSENSENSENSENSENSENSENSENSENSENSEN SLESLESLESLESLESLESLESLESLESLESLESLESLESLESLESLESLESLESLESLESLESLESLESLESLESLESLESLESLESLESLESLESLESLESLESLESLE
SLBSLBSLBSLBSLBSLBSLBSLBSLBSLBSLBSLBSLBSLBSLBSLBSLBSLBSLBSLBSLBSLBSLBSLBSLBSLBSLBSLBSLBSLBSLBSLBSLBSLBSLBSLBSLBSLBSLBSLBSLBSLBSLBSLBSLBSLB
LCALCALCALCALCALCALCALCALCALCALCALCALCALCALCALCALCALCALCALCALCALCALCALCALCALCALCALCALCALCALCALCALCALCALCALCALCALCALCALCALCALCALCALCALCALCALCAVCTVCTVCTVCTVCTVCTVCTVCTVCTVCTVCTVCTVCTVCTVCTVCTVCTVCTVCTVCTVCTVCTVCTVCTVCTVCTVCTVCTVCTVCTVCTVCTVCTVCTVCTVCTVCTVCTVCTVCTVCTVCTVCTVCTVCTVCT
SDNSDNSDNSDNSDNSDNSDNSDNSDNSDNSDNSDNSDNSDNSDNSDNSDNSDNSDNSDNSDNSDNSDNSDNSDNSDNSDNSDNSDNSDNSDNSDNSDNSDNSDNSDNTZATZATZATZATZATZATZATZATZATZATZATZATZATZATZATZATZATZATZATZATZATZATZATZATZATZATZATZATZATZATZATZATZATZATZATZATZATZATZATZATZATZATZATZATZATZATZA
TGOTGOTGOTGOTGOTGOTGOTGOTGOTGOTGOTGOTGOTGOTGOTGOTGOTGOTGOTGOTGOTGOTGOTGOTGOTGOTGOTGOTGOTGOTGOTGOTGOTGOTGOTGOTGOTGOTGOTGOTGOTGOTGOTGOTGOTGOTGO
-20
24
68
Per
Cap
ital
Rea
l GD
P G
row
th(I
n pe
rcen
t; a
vg 1
960-
2010
)
0 50 100 150 200Indicator of Macroeconomic Stability
(Inflation Variability Indicator; avg 1960-2010)
BENBENBENBENBENBENBENBENBENBENBENBENBENBENBENBENBENBENBENBENBENBENBENBENBENBENBENBENBENBENBENBENBENBENBENBENBENBENBENBENBENBENBENBENBENBENBENBDIBDIBDIBDIBDIBDIBDIBDIBDIBDIBDIBDIBDIBDIBDIBDIBDIBDIBDIBDIBDIBDIBDIBDIBDIBDIBDIBDIBDIBDIBDIBDIBDIBDIBDIBDIBDIBDIBDIBDIBDIBDIBDIBDIBDIBDICMRCMRCMRCMRCMRCMRCMRCMRCMRCMRCMRCMRCMRCMRCMRCMRCMRCMRCMRCMRCMRCMRCMRCMRCMRCMRCMRCMRCMRCMRCMRCMRCMRCMRCMRCMRCMRCMRCMRCMRCMRCMRCMRCMRCMRCMRCMR
CPVCPVCPVCPVCPVCPVCPVCPVCPVCPVCPVCPVCPVCPVCPVCPVCPVCPVCPVCPVCPVCPVCPVCPVCPVCPVCPVCPVCPVCPVCPVCPVCPVCPVCPVCPVCPVCPVCPVCPVCPVCPVCPVCPVCPVCPV
CAFCAFCAFCAFCAFCAFCAFCAFCAFCAFCAFCAFCAFCAFCAFCAFCAFCAFCAFCAFCAFCAFCAFCAFCAFCAFCAFCAFCAFCAFCAFCAFCAFCAFCAFCAFCAFCAFCAFCAFCAFCAFCAFCAFCAFCAF
TCDTCDTCDTCDTCDTCDTCDTCDTCDTCDTCDTCDTCDTCDTCDTCDTCDTCDTCDTCDTCDTCDTCDTCDTCDTCDTCDTCDTCDTCDTCDTCDTCDTCDTCDTCDTCDTCDTCDTCDTCDTCDTCDTCDTCDTCD
COMCOMCOMCOMCOMCOMCOMCOMCOMCOMCOMCOMCOMCOMCOMCOMCOMCOMCOMCOMCOMCOMCOMCOMCOMCOMCOMCOMCOMCOMCOMCOMCOMCOMCOMCOMCOMCOMCOMCOMCOMCOMCOMCOMCOMCOM
ZARZARZARZARZARZARZARZARZARZARZARZARZARZARZARZARZARZARZARZARZARZARZARZARZARZARZARZARZARZARZARZARZARZARZARZARZARZARZARZARZARZARZARZARZARZARZAR
COGCOGCOGCOGCOGCOGCOGCOGCOGCOGCOGCOGCOGCOGCOGCOGCOGCOGCOGCOGCOGCOGCOGCOGCOGCOGCOGCOGCOGCOGCOGCOGCOGCOGCOGCOGCOGCOGCOGCOGCOGCOGCOGCOGCOGCOG
CIVCIVCIVCIVCIVCIVCIVCIVCIVCIVCIVCIVCIVCIVCIVCIVCIVCIVCIVCIVCIVCIVCIVCIVCIVCIVCIVCIVCIVCIVCIVCIVCIVCIVCIVCIVCIVCIVCIVCIVCIVCIVCIVCIVCIVCIVCIV
GMBGMBGMBGMBGMBGMBGMBGMBGMBGMBGMBGMBGMBGMBGMBGMBGMBGMBGMBGMBGMBGMBGMBGMBGMBGMBGMBGMBGMBGMBGMBGMBGMBGMBGMBGMBGMBGMBGMBGMBGMBGMBGMBGMBGMBGMBGHAGHAGHAGHAGHAGHAGHAGHAGHAGHAGHAGHAGHAGHAGHAGHAGHAGHAGHAGHAGHAGHAGHAGHAGHAGHAGHAGHAGHAGHAGHAGHAGHAGHAGHAGHAGHAGHAGHAGHAGHAGHAGHAGHAGHAGHAGHA
KENKENKENKENKENKENKENKENKENKENKENKENKENKENKENKENKENKENKENKENKENKENKENKENKENKENKENKENKENKENKENKENKENKENKENKENKENKENKENKENKENKENKENKENKENKENKENLSOLSOLSOLSOLSOLSOLSOLSOLSOLSOLSOLSOLSOLSOLSOLSOLSOLSOLSOLSOLSOLSOLSOLSOLSOLSOLSOLSOLSOLSOLSOLSOLSOLSOLSOLSOLSOLSOLSOLSOLSOLSOLSOLSOLSOLSO
MDGMDGMDGMDGMDGMDGMDGMDGMDGMDGMDGMDGMDGMDGMDGMDGMDGMDGMDGMDGMDGMDGMDGMDGMDGMDGMDGMDGMDGMDGMDGMDGMDGMDGMDGMDGMDGMDGMDGMDGMDGMDGMDGMDGMDGMDGMDG
MWIMWIMWIMWIMWIMWIMWIMWIMWIMWIMWIMWIMWIMWIMWIMWIMWIMWIMWIMWIMWIMWIMWIMWIMWIMWIMWIMWIMWIMWIMWIMWIMWIMWIMWIMWIMWIMWIMWIMWIMWIMWIMWIMWIMWIMWI MLIMLIMLIMLIMLIMLIMLIMLIMLIMLIMLIMLIMLIMLIMLIMLIMLIMLIMLIMLIMLIMLIMLIMLIMLIMLIMLIMLIMLIMLIMLIMLIMLIMLIMLIMLIMLIMLIMLIMLIMLIMLIMLIMLIMLIMLIMLIMRTMRTMRTMRTMRTMRTMRTMRTMRTMRTMRTMRTMRTMRTMRTMRTMRTMRTMRTMRTMRTMRTMRTMRTMRTMRTMRTMRTMRTMRTMRTMRTMRTMRTMRTMRTMRTMRTMRTMRTMRTMRTMRTMRTMRTMRT
MOZMOZMOZMOZMOZMOZMOZMOZMOZMOZMOZMOZMOZMOZMOZMOZMOZMOZMOZMOZMOZMOZMOZMOZMOZMOZMOZMOZMOZMOZMOZMOZMOZMOZMOZMOZMOZMOZMOZMOZMOZMOZMOZMOZMOZMOZ
NERNERNERNERNERNERNERNERNERNERNERNERNERNERNERNERNERNERNERNERNERNERNERNERNERNERNERNERNERNERNERNERNERNERNERNERNERNERNERNERNERNERNERNERNERNERNER
NGANGANGANGANGANGANGANGANGANGANGANGANGANGANGANGANGANGANGANGANGANGANGANGANGANGANGANGANGANGANGANGANGANGANGANGANGANGANGANGANGANGANGANGANGANGANGA
RWARWARWARWARWARWARWARWARWARWARWARWARWARWARWARWARWARWARWARWARWARWARWARWARWARWARWARWARWARWARWARWARWARWARWARWARWARWARWARWARWARWARWARWARWARWARWASTPSTPSTPSTPSTPSTPSTPSTPSTPSTPSTPSTPSTPSTPSTPSTPSTPSTPSTPSTPSTPSTPSTPSTPSTPSTPSTPSTPSTPSTPSTPSTPSTPSTPSTPSTPSTPSTPSTPSTPSTPSTPSTPSTPSTPSTP
SENSENSENSENSENSENSENSENSENSENSENSENSENSENSENSENSENSENSENSENSENSENSENSENSENSENSENSENSENSENSENSENSENSENSENSENSENSENSENSENSENSENSENSENSENSENSLESLESLESLESLESLESLESLESLESLESLESLESLESLESLESLESLESLESLESLESLESLESLESLESLESLESLESLESLESLESLESLESLESLESLESLESLESLESLESLESLESLESLESLESLESLE
SDNSDNSDNSDNSDNSDNSDNSDNSDNSDNSDNSDNSDNSDNSDNSDNSDNSDNSDNSDNSDNSDNSDNSDNSDNSDNSDNSDNSDNSDNSDNSDNSDNSDNSDNSDNSDNSDNSDNSDNSDNSDNSDNSDNSDNSDNSDN
TGOTGOTGOTGOTGOTGOTGOTGOTGOTGOTGOTGOTGOTGOTGOTGOTGOTGOTGOTGOTGOTGOTGOTGOTGOTGOTGOTGOTGOTGOTGOTGOTGOTGOTGOTGOTGOTGOTGOTGOTGOTGOTGOTGOTGOTGOTGO
-20
24
68
Per
Cap
ital
Rea
l GD
P G
row
th(I
n pe
rcen
t; a
vg 1
960-
2010
)
0 2 4 6Quality of Macroeconomic Management
(CPIA Indicator; avg 2005-2009)
III. Sub-Saharan Africa
AGOAGOAGOAGOAGOAGOAGOAGOAGOAGOAGOAGOAGOAGOAGOAGOAGOAGOAGOAGOAGOAGOAGOAGOAGOAGOAGOAGOAGOAGOAGO
BENBENBENBENBENBENBENBENBENBENBENBENBENBENBENBENBENBENBENBENBENBENBENBENBENBENBENBENBENBENBENBENBENBENBENBENBENBENBENBENBENBENBENBENBENBEN
BWABWABWABWABWABWABWABWABWABWABWABWABWABWABWABWABWABWABWABWABWABWABWABWABWABWABWABWABWABWABWABWABWABWABWABWABWABWABWABWABWABWABWABWABWABWABWA
BDIBDIBDIBDIBDIBDIBDIBDIBDIBDIBDIBDIBDIBDIBDIBDIBDIBDIBDIBDIBDIBDIBDIBDIBDIBDIBDIBDIBDIBDIBDIBDIBDIBDIBDIBDIBDIBDIBDIBDIBDIBDIBDIBDIBDIBDICMRCMRCMRCMRCMRCMRCMRCMRCMRCMRCMRCMRCMRCMRCMRCMRCMRCMRCMRCMRCMRCMRCMRCMRCMRCMRCMRCMRCMRCMRCMRCMRCMRCMRCMRCMRCMRCMRCMRCMRCMRCMRCMRCMRCMRCMRCMR
CPVCPVCPVCPVCPVCPVCPVCPVCPVCPVCPVCPVCPVCPVCPVCPVCPVCPVCPVCPVCPVCPVCPVCPVCPVCPVCPVCPVCPVCPVCPVCPVCPVCPVCPVCPVCPVCPVCPVCPVCPVCPVCPVCPVCPVCPV
CAFCAFCAFCAFCAFCAFCAFCAFCAFCAFCAFCAFCAFCAFCAFCAFCAFCAFCAFCAFCAFCAFCAFCAFCAFCAFCAFCAFCAFCAFCAFCAFCAFCAFCAFCAFCAFCAFCAFCAFCAFCAFCAFCAFCAFCAF
TCDTCDTCDTCDTCDTCDTCDTCDTCDTCDTCDTCDTCDTCDTCDTCDTCDTCDTCDTCDTCDTCDTCDTCDTCDTCDTCDTCDTCDTCDTCDTCDTCDTCDTCDTCDTCDTCDTCDTCDTCDTCDTCDTCDTCD
COMCOMCOMCOMCOMCOMCOMCOMCOMCOMCOMCOMCOMCOMCOMCOMCOMCOMCOMCOMCOMCOMCOMCOMCOMCOMCOMCOMCOMCOMCOMCOMCOMCOMCOMCOMCOMCOMCOMCOMCOMCOMCOMCOMCOMCOM
ZARZARZARZARZARZARZARZARZARZARZARZARZARZARZARZARZARZARZARZARZARZARZARZARZARZARZARZARZAR
COGCOGCOGCOGCOGCOGCOGCOGCOGCOGCOGCOGCOGCOGCOGCOGCOGCOGCOGCOGCOGCOGCOGCOGCOGCOGCOGCOGCOGCOGCOGCOGCOGCOGCOGCOGCOGCOGCOGCOGCOGCOGCOGCOGCOG
CIVCIVCIVCIVCIVCIVCIVCIVCIVCIVCIVCIVCIVCIVCIVCIVCIVCIVCIVCIVCIVCIVCIVCIVCIVCIVCIVCIVCIVCIVCIVCIVCIVCIVCIVCIVCIVCIVCIVCIVCIVCIVCIVCIVCIVCIVCIV
GNQGNQGNQGNQGNQGNQGNQGNQGNQGNQGNQGNQGNQGNQGNQGNQGNQGNQGNQGNQGNQGNQGNQGNQGNQGNQGNQGNQGNQGNQGNQGNQGNQGNQGNQGNQGNQGNQGNQGNQGNQGNQGNQ
GABGABGABGABGABGABGABGABGABGABGABGABGABGABGABGABGABGABGABGABGABGABGABGABGABGABGABGABGABGABGABGABGABGABGABGABGABGABGABGABGABGABGABGABGABGAB
GMBGMBGMBGMBGMBGMBGMBGMBGMBGMBGMBGMBGMBGMBGMBGMBGMBGMBGMBGMBGMBGMBGMBGMBGMBGMBGMBGMBGMBGMBGMBGMBGMBGMBGMBGMBGMBGMBGMBGMBGMBGMBGMBGMBGMBGHAGHAGHAGHAGHAGHAGHAGHAGHAGHAGHAGHAGHAGHAGHAGHAGHAGHAGHAGHAGHAGHAGHAGHAGHAGHAGHAGHAGHAGHAGHAGHAGHAGHAGHAGHAGHAGHAGHA
KENKENKENKENKENKENKENKENKENKENKENKENKENKENKENKENKENKENKENKENKENKENKENKENKENKENKENKENKENKENKENKENKENKENKENKENKENKENKENKENKENKENKENKENKENKENLSOLSOLSOLSOLSOLSOLSOLSOLSOLSOLSOLSOLSOLSOLSOLSOLSOLSOLSOLSOLSOLSOLSOLSOLSOLSOLSOLSOLSOLSOLSOLSOLSOLSOLSOLSOLSOLSOLSOLSOLSOLSOLSOLSOLSOLSO
MDGMDGMDGMDGMDGMDGMDGMDGMDGMDGMDGMDGMDGMDGMDGMDGMDGMDGMDGMDGMDGMDGMDGMDGMDGMDGMDGMDGMDGMDGMDGMDGMDGMDGMDGMDGMDGMDGMDGMDGMDGMDGMDGMDGMDGMDG
MWIMWIMWIMWIMWIMWIMWIMWIMWIMWIMWIMWIMWIMWIMWIMWIMWIMWIMWIMWIMWIMWIMWIMWIMWIMWIMWIMWIMWIMWIMWIMWIMWIMWIMWIMWIMWIMWIMWIMWIMWIMWIMWIMWIMLIMLIMLIMLIMLIMLIMLIMLIMLIMLIMLIMLIMLIMLIMLIMLIMLIMLIMLIMLIMLIMLIMLIMLIMLIMLIMLIMLIMLIMLIMLIMLIMLIMLIMLIMLIMLIMLIMLIMLIMLIMLIMLIMLIMLIMLIMLIMRTMRTMRTMRTMRTMRTMRTMRTMRTMRTMRTMRTMRTMRTMRTMRTMRTMRTMRTMRTMRTMRTMRTMRTMRTMRTMRTMRTMRTMRTMRTMRTMRTMRTMRTMRTMRTMRTMRTMRTMRTMRTMRTMRTMRTMRT
MUSMUSMUSMUSMUSMUSMUSMUSMUSMUSMUSMUSMUSMUSMUSMUSMUSMUSMUSMUSMUSMUSMUSMUSMUSMUSMUSMUSMUSMUSMUSMUSMUSMUSMUSMUSMUSMUSMUSMUSMUSMUSMUSMUSMUSMUSMUS
MOZMOZMOZMOZMOZMOZMOZMOZMOZMOZMOZMOZMOZMOZMOZMOZMOZMOZMOZMOZMOZMOZMOZMOZMOZMOZMOZMOZMOZMOZMOZMOZMOZMOZMOZMOZ
NERNERNERNERNERNERNERNERNERNERNERNERNERNERNERNERNERNERNERNERNERNERNERNERNERNERNERNERNERNERNERNERNERNERNERNERNERNERNERNERNERNERNERNERNERNERNER
NGANGANGANGANGANGANGANGANGANGANGANGANGANGANGANGANGANGANGANGANGANGANGANGANGANGANGANGANGANGANGANGANGANGANGANGANGANGANGANGANGA
RWARWARWARWARWARWARWARWARWARWARWARWARWARWARWARWARWARWARWARWARWARWARWARWARWARWARWARWARWARWARWARWARWARWARWARWARWARWARWARWARWARWARWARWARWA STPSTPSTPSTPSTPSTPSTPSTPSTPSTPSTPSTPSTPSTPSTPSTPSTPSTPSTPSTPSTPSTPSTPSTPSTPSTPSTPSTPSTPSTPSTPSTPSTPSTPSTPSTPSTPSTPSTPSTPSTP
SENSENSENSENSENSENSENSENSENSENSENSENSENSENSENSENSENSENSENSENSENSENSENSENSENSENSENSENSENSENSENSENSENSENSENSENSENSENSENSENSENSENSENSENSENSEN SLESLESLESLESLESLESLESLESLESLESLESLESLESLESLESLESLESLESLESLESLESLESLESLESLESLESLESLESLESLESLESLESLESLESLESLESLE
ZAFZAFZAFZAFZAFZAFZAFZAFZAFZAFZAFZAFZAFZAFZAFZAFZAFZAFZAFZAFZAFZAFZAFZAFZAFZAFZAFZAFZAFZAFZAFZAFZAFZAFZAFZAFZAFZAFZAFZAFZAFZAFZAFZAFZAFZAFZAFSDNSDNSDNSDNSDNSDNSDNSDNSDNSDNSDNSDNSDNSDNSDNSDNSDNSDNSDNSDNSDNSDNSDNSDNSDNSDNSDNSDNSDNSDNSDNSDNSDNSDNSDNSDN
SWZSWZSWZSWZSWZSWZSWZSWZSWZSWZSWZSWZSWZSWZSWZSWZSWZSWZSWZSWZSWZSWZSWZSWZSWZSWZSWZSWZSWZSWZSWZSWZSWZSWZSWZSWZSWZSWZSWZSWZSWZSWZSWZSWZSWZSWZTZATZATZATZATZATZATZATZATZATZATZATZATZATZATZATZATZATZATZATZATZATZATZATZATZATZATZATZATZATZATZATZATZATZATZATZATZATZATZATZATZATZATZATZATZATZATZA
TGOTGOTGOTGOTGOTGOTGOTGOTGOTGOTGOTGOTGOTGOTGOTGOTGOTGOTGOTGOTGOTGOTGOTGOTGOTGOTGOTGOTGOTGOTGOTGOTGOTGOTGOTGOTGOTGOTGOTGOTGOTGOTGOTGOTGOTGOTGO
-20
24
68
Per
Cap
ital
Rea
l GD
P G
row
th(I
n pe
rcen
t; a
vg 1
960-
2010
)
0 50 100 150 200Indicator of Macroeconomic Stability
(Inflation Variability Indicator; avg 1960-2010)
Source: IMF World Economic Outlook; and authors' calculations.
Figure 3. Per Capita Real GDP Growth and Quality of Macroeconomic Policy, 1960–2010

SIERRA LEONE
INTERNATIONAL MONETARY FUND 97
Specifically: (i) countries that have made good progress on overall macroeconomic management,
culminating into higher average CPIA scores in 2005–09 also showed high average per capita
real GDP growth in 1960–2010. This finding runs through for all country samples considered—the
full sample (in row 1), sample of LICs (in row 2), and SSA countries (in the last row); and
(ii) macroeconomic stability promotes inclusive growth—the charts in the second column of Figure 3
confirm this with a negative slope between average inflation variability and per capita real GDP
growth in 1960–2010.
Quality of economic institutions matter
21. To avoid entering into the complexities of the nature of the interaction of institutions with
economic factors and initial conditions (such as previous adverse or benign socio-political and/or
economic conditions),4 we regroup all our country samples into subgroups of above and below
average performers on the World Bank CPIA indicators for quality of structural policies, business
environment, and overall macroeconomic management. We then run panel fixed effects regressions
for these subgroups to ascertain whether there are any significant changes in estimated multipliers.
Based on these results (Appendix Table 1) we derive the total policy effects on inclusive growth of a
ten-percent improvement in the quality of policy (i.e., in macroeconomic stability government
consumption and the real effective exchange rate). Improvements in macroeconomic stability and
the real effective exchange rate are here interpreted as reductions or stability in inflation variability
and the real effective exchange rate, while improvements in government consumption are increases
in current government current spending that does not crowd-in the private sector or introduce
inefficiencies that reduce the production possibilities frontier.
22. A simple penalty function is used to capture total effects of policy changes on
inclusive growth. The penal aspect comes in where the sign of a coefficient deviates from its apriori
theoretical expectations. We specify the simple penalty function:
1 1
ˆ ( ( ))n n
p k k kk k
g c p
(2)
4 Initial conditions have received much attention in the literature, but their characterization of the elements/factors— including colonial origins (Acemoglu et al., 2001), the slave trade (Nunn, 2008), and geography (Bloom and Sachs, 1998), and—differ from our use of the term. Consistent with our view, some researchers (such as Fosu, 2012) use past policy regimes to proxy initial conditions. In this literature, such past policy regimes or “policy syndromes” are defined to include state controls, adverse redistribution, suboptimal intertemporal resource allocation, and state breakdown or war and civil conflict. Bosworth and Collins (2003) define initial conditions to include population growth, geography, institutional quality and initial per capita income.

SIERRA LEONE
98 INTERNATIONAL MONETARY FUND
where ˆ0 ( ) is theory inconsistent
( ( ))ˆ ˆ( ) is consistent with theory
kk
k k
if signg c p
if sign
is a chosen percent change in the policy variable, p; denotes the weight of the policy
variable; is the penalty coefficient (in this example, we set this to 10, the percent increase in the
policy variable); and k (=1,2,…,n) is the number of policy variables.
23. The results confirm that the quality of structural reforms, the business environment,
and of the overall macroeconomic management do matter for economic growth—and job
creation (Figure 4).5 Specifically, total policy impact in countries that scored well (i.e., above
average) on the World Bank’s CPIA sub-modules on these indicators is higher that the baseline
(where no distinction is made regarding the quality of institutions and policy implementation) and
across all country groupings, except in low-income countries (on all three indicators) and SSA
countries (on the structural policies indicator). Thus, for SSA countries for example, the difference in
the policy impact of a 10 percent improvement in the chosen policy variables varies by as much as
9 percentage points and 2 percentage points above the baseline impact, for quality of the business
environment and overall macroeconomic management, respectively.
5 A simple version of the penalty function (with set to 1 for all the policy variables) is used.

SIERRA LEONE
INTERNATIONAL MONETARY FUND 99
24. These results are broadly corroborated by Figure 5, which reveals the significance of
structural reforms and the quality of the business environment for real per capita GDP growth for all
country groupings considered—the full sample in the first row, LICs in the second row, and SSA in
the third row. The positive slope of the estimated trend line confirms this observation. Further, and
similar to the results in the section above, almost all SSA countries fall below the average
performance for their peers that scored similarly on the business environment indicator and the
structural policies indicator. Again, this may indicate the absence of necessary ingredients such as
peace, basic infrastructure, and human capacity. It is therefore no surprise that Sierra Leone, which
has been through a decade of civil conflict that devastated basic infrastructure and halted progress
in building human capacity, experienced even lower average per capita real GDP growth rate during
the period even among its peer SSA countries that scored similar levels of quality of the business
environment (such as Côte d’Ivoire and Mozambique) and progress on structural reform
(Côte d’Ivoire and Niger).
0.00
2.00
4.00
6.00
8.00
10.00
12.00
14.00
16.00
Full Sample LICs SSA
Tota
l Effe
ct o
f Pol
icy C
hang
es (i
n pe
rcen
t)
Country Groupings
I. Quality of Structural Policies
Below Average
Baseline
Above Average
0.00
2.00
4.00
6.00
8.00
10.00
12.00
14.00
16.00
Full Sample LICs SSA
Tota
l Effe
ct o
f Pol
icy C
hang
es (i
n pe
rcen
t)
Country Groupings
II. Business Environment
0.00
2.00
4.00
6.00
8.00
10.00
12.00
14.00
16.00
Full Sample LICs SSA
Tota
l effe
ct o
f Poli
cy C
hang
es (i
n pe
rcen
t)
Country Groupings
III. Overall Macroeconomy
Figure 4. Estimated Effects of Policy Changes
Source: IMF's World Economic Outlook; and authors' estimates based on panel fixed effects estimates of coefficients.

SIERRA LEONE
100 INTERNATIONAL MONETARY FUND
BGDBGDBGDBGDBGDBGDBGDBGDBGDBGDBGDBGDBGDBGDBGDBGDBGDBGDBGDBGDBGDBGDBGDBGDBGDBGDBGDBGDBGDBGDBGDBGDBGDBGDBGDBGDBGDBGDBGDBGDBGDBGDBGDBGDBGDBGDBGD
BENBENBENBENBENBENBENBENBENBENBENBENBENBENBENBENBENBENBENBENBENBENBENBENBENBENBENBENBENBENBENBENBENBENBENBENBENBENBENBENBENBENBENBENBENBENBEN
BTNBTNBTNBTNBTNBTNBTNBTNBTNBTNBTNBTNBTNBTNBTNBTNBTNBTNBTNBTNBTNBTNBTNBTNBTNBTNBTNBTNBTNBTNBTNBTNBTNBTNBTNBTNBTNBTNBTNBTNBTNBTNBTNBTNBTNBTN
BOLBOLBOLBOLBOLBOLBOLBOLBOLBOLBOLBOLBOLBOLBOLBOLBOLBOLBOLBOLBOLBOLBOLBOLBOLBOLBOLBOLBOLBOLBOLBOLBOLBOLBOLBOLBOLBOLBOLBOLBOLBOLBOLBOLBOLBOL BFABFABFABFABFABFABFABFABFABFABFABFABFABFABFABFABFABFABFABFABFABFABFABFABFABFABFABFABFABFABFABFABFABFABFABFABFABFABFABFABFABFABFABFABFABFABFA
BDIBDIBDIBDIBDIBDIBDIBDIBDIBDIBDIBDIBDIBDIBDIBDIBDIBDIBDIBDIBDIBDIBDIBDIBDIBDIBDIBDIBDIBDIBDIBDIBDIBDIBDIBDIBDIBDIBDIBDIBDIBDIBDIBDIBDIBDI
CMRCMRCMRCMRCMRCMRCMRCMRCMRCMRCMRCMRCMRCMRCMRCMRCMRCMRCMRCMRCMRCMRCMRCMRCMRCMRCMRCMRCMRCMRCMRCMRCMRCMRCMRCMRCMRCMRCMRCMRCMRCMRCMRCMRCMRCMRCMR
CPVCPVCPVCPVCPVCPVCPVCPVCPVCPVCPVCPVCPVCPVCPVCPVCPVCPVCPVCPVCPVCPVCPVCPVCPVCPVCPVCPVCPVCPVCPVCPVCPVCPVCPVCPVCPVCPVCPVCPVCPVCPVCPVCPVCPVCPV
CAFCAFCAFCAFCAFCAFCAFCAFCAFCAFCAFCAFCAFCAFCAFCAFCAFCAFCAFCAFCAFCAFCAFCAFCAFCAFCAFCAFCAFCAFCAFCAFCAFCAFCAFCAFCAFCAFCAFCAFCAFCAFCAFCAFCAFCAF
TCDTCDTCDTCDTCDTCDTCDTCDTCDTCDTCDTCDTCDTCDTCDTCDTCDTCDTCDTCDTCDTCDTCDTCDTCDTCDTCDTCDTCDTCDTCDTCDTCDTCDTCDTCDTCDTCDTCDTCDTCDTCDTCDTCDTCDTCD
COMCOMCOMCOMCOMCOMCOMCOMCOMCOMCOMCOMCOMCOMCOMCOMCOMCOMCOMCOMCOMCOMCOMCOMCOMCOMCOMCOMCOMCOMCOMCOMCOMCOMCOMCOMCOMCOMCOMCOMCOMCOMCOMCOMCOMCOM
ZARZARZARZARZARZARZARZARZARZARZARZARZARZARZARZARZARZARZARZARZARZARZARZARZARZARZARZARZARZARZARZARZARZARZARZARZARZARZARZARZARZARZARZARZARZARZAR
COGCOGCOGCOGCOGCOGCOGCOGCOGCOGCOGCOGCOGCOGCOGCOGCOGCOGCOGCOGCOGCOGCOGCOGCOGCOGCOGCOGCOGCOGCOGCOGCOGCOGCOGCOGCOGCOGCOGCOGCOGCOGCOGCOGCOGCOG
CIVCIVCIVCIVCIVCIVCIVCIVCIVCIVCIVCIVCIVCIVCIVCIVCIVCIVCIVCIVCIVCIVCIVCIVCIVCIVCIVCIVCIVCIVCIVCIVCIVCIVCIVCIVCIVCIVCIVCIVCIVCIVCIVCIVCIVCIVCIV
GMBGMBGMBGMBGMBGMBGMBGMBGMBGMBGMBGMBGMBGMBGMBGMBGMBGMBGMBGMBGMBGMBGMBGMBGMBGMBGMBGMBGMBGMBGMBGMBGMBGMBGMBGMBGMBGMBGMBGMBGMBGMBGMBGMBGMBGMB
GHAGHAGHAGHAGHAGHAGHAGHAGHAGHAGHAGHAGHAGHAGHAGHAGHAGHAGHAGHAGHAGHAGHAGHAGHAGHAGHAGHAGHAGHAGHAGHAGHAGHAGHAGHAGHAGHAGHAGHAGHAGHAGHAGHAGHAGHAGHA
GRDGRDGRDGRDGRDGRDGRDGRDGRDGRDGRDGRDGRDGRDGRDGRDGRDGRDGRDGRDGRDGRDGRDGRDGRDGRDGRDGRDGRDGRDGRDGRDGRDGRDGRDGRDGRDGRDGRDGRDGRDGRDGRDGRDGRDGRD
GUYGUYGUYGUYGUYGUYGUYGUYGUYGUYGUYGUYGUYGUYGUYGUYGUYGUYGUYGUYGUYGUYGUYGUYGUYGUYGUYGUYGUYGUYGUYGUYGUYGUYGUYGUYGUYGUYGUYGUYGUYGUYGUYGUYGUYGUYGUY
HTIHTIHTIHTIHTIHTIHTIHTIHTIHTIHTIHTIHTIHTIHTIHTIHTIHTIHTIHTIHTIHTIHTIHTIHTIHTIHTIHTIHTIHTIHTIHTIHTIHTIHTIHTIHTIHTIHTIHTIHTIHTIHTIHTIHTIHTI
HNDHNDHNDHNDHNDHNDHNDHNDHNDHNDHNDHNDHNDHNDHNDHNDHNDHNDHNDHNDHNDHNDHNDHNDHNDHNDHNDHNDHNDHNDHNDHNDHNDHNDHNDHNDHNDHNDHNDHNDHNDHNDHNDHNDHNDHND
INDINDINDINDINDINDINDINDINDINDINDINDINDINDINDINDINDINDINDINDINDINDINDINDINDINDINDINDINDINDINDINDINDINDINDINDINDINDINDINDINDINDINDINDINDINDIND
IDNIDNIDNIDNIDNIDNIDNIDNIDNIDNIDNIDNIDNIDNIDNIDNIDNIDNIDNIDNIDNIDNIDNIDNIDNIDNIDNIDNIDNIDNIDNIDNIDNIDNIDNIDNIDNIDNIDNIDNIDNIDNIDNIDNIDNIDNIDN
KENKENKENKENKENKENKENKENKENKENKENKENKENKENKENKENKENKENKENKENKENKENKENKENKENKENKENKENKENKENKENKENKENKENKENKENKENKENKENKENKENKENKENKENKENKENKEN
KIRKIRKIRKIRKIRKIRKIRKIRKIRKIRKIRKIRKIRKIRKIRKIRKIRKIRKIRKIRKIRKIRKIRKIRKIRKIRKIRKIRKIRKIRKIRKIRKIRKIRKIRKIRKIRKIRKIRKIRKIRKIRKIRKIRKIR
LAOLAOLAOLAOLAOLAOLAOLAOLAOLAOLAOLAOLAOLAOLAOLAOLAOLAOLAOLAOLAOLAOLAOLAOLAOLAOLAOLAOLAOLAOLAOLAOLAOLAOLAOLAOLAOLAOLAOLAOLAOLAOLAOLAOLAOLAO
LSOLSOLSOLSOLSOLSOLSOLSOLSOLSOLSOLSOLSOLSOLSOLSOLSOLSOLSOLSOLSOLSOLSOLSOLSOLSOLSOLSOLSOLSOLSOLSOLSOLSOLSOLSOLSOLSOLSOLSOLSOLSOLSOLSOLSOLSO
MDGMDGMDGMDGMDGMDGMDGMDGMDGMDGMDGMDGMDGMDGMDGMDGMDGMDGMDGMDGMDGMDGMDGMDGMDGMDGMDGMDGMDGMDGMDGMDGMDGMDGMDGMDGMDGMDGMDGMDGMDGMDGMDGMDGMDGMDGMDG
MWIMWIMWIMWIMWIMWIMWIMWIMWIMWIMWIMWIMWIMWIMWIMWIMWIMWIMWIMWIMWIMWIMWIMWIMWIMWIMWIMWIMWIMWIMWIMWIMWIMWIMWIMWIMWIMWIMWIMWIMWIMWIMWIMWIMWIMWI
MDVMDVMDVMDVMDVMDVMDVMDVMDVMDVMDVMDVMDVMDVMDVMDVMDVMDVMDVMDVMDVMDVMDVMDVMDVMDVMDVMDVMDVMDVMDVMDVMDVMDVMDVMDVMDVMDVMDVMDVMDVMDVMDVMDVMDVMDV
MLIMLIMLIMLIMLIMLIMLIMLIMLIMLIMLIMLIMLIMLIMLIMLIMLIMLIMLIMLIMLIMLIMLIMLIMLIMLIMLIMLIMLIMLIMLIMLIMLIMLIMLIMLIMLIMLIMLIMLIMLIMLIMLIMLIMLIMLIMLIMRTMRTMRTMRTMRTMRTMRTMRTMRTMRTMRTMRTMRTMRTMRTMRTMRTMRTMRTMRTMRTMRTMRTMRTMRTMRTMRTMRTMRTMRTMRTMRTMRTMRTMRTMRTMRTMRTMRTMRTMRTMRTMRTMRTMRTMRT
MOZMOZMOZMOZMOZMOZMOZMOZMOZMOZMOZMOZMOZMOZMOZMOZMOZMOZMOZMOZMOZMOZMOZMOZMOZMOZMOZMOZMOZMOZMOZMOZMOZMOZMOZMOZMOZMOZMOZMOZMOZMOZMOZMOZMOZMOZ
NPLNPLNPLNPLNPLNPLNPLNPLNPLNPLNPLNPLNPLNPLNPLNPLNPLNPLNPLNPLNPLNPLNPLNPLNPLNPLNPLNPLNPLNPLNPLNPLNPLNPLNPLNPLNPLNPLNPLNPLNPLNPLNPLNPLNPLNPLNPL
NERNERNERNERNERNERNERNERNERNERNERNERNERNERNERNERNERNERNERNERNERNERNERNERNERNERNERNERNERNERNERNERNERNERNERNERNERNERNERNERNERNERNERNERNERNERNER
NGANGANGANGANGANGANGANGANGANGANGANGANGANGANGANGANGANGANGANGANGANGANGANGANGANGANGANGANGANGANGANGANGANGANGANGANGANGANGANGANGANGANGANGANGANGANGAPAKPAKPAKPAKPAKPAKPAKPAKPAKPAKPAKPAKPAKPAKPAKPAKPAKPAKPAKPAKPAKPAKPAKPAKPAKPAKPAKPAKPAKPAKPAKPAKPAKPAKPAKPAKPAKPAKPAKPAKPAKPAKPAKPAKPAKPAKPAK
PNGPNGPNGPNGPNGPNGPNGPNGPNGPNGPNGPNGPNGPNGPNGPNGPNGPNGPNGPNGPNGPNGPNGPNGPNGPNGPNGPNGPNGPNGPNGPNGPNGPNGPNGPNGPNGPNGPNGPNGPNGPNGPNGPNGPNGPNGRWARWARWARWARWARWARWARWARWARWARWARWARWARWARWARWARWARWARWARWARWARWARWARWARWARWARWARWARWARWARWARWARWARWARWARWARWARWARWARWARWARWARWARWARWARWARWASTPSTPSTPSTPSTPSTPSTPSTPSTPSTPSTPSTPSTPSTPSTPSTPSTPSTPSTPSTPSTPSTPSTPSTPSTPSTPSTPSTPSTPSTPSTPSTPSTPSTPSTPSTPSTPSTPSTPSTPSTPSTPSTPSTPSTPSTP
SENSENSENSENSENSENSENSENSENSENSENSENSENSENSENSENSENSENSENSENSENSENSENSENSENSENSENSENSENSENSENSENSENSENSENSENSENSENSENSENSENSENSENSENSENSENSLESLESLESLESLESLESLESLESLESLESLESLESLESLESLESLESLESLESLESLESLESLESLESLESLESLESLESLESLESLESLESLESLESLESLESLESLESLESLESLESLESLESLESLESLESLE
SLBSLBSLBSLBSLBSLBSLBSLBSLBSLBSLBSLBSLBSLBSLBSLBSLBSLBSLBSLBSLBSLBSLBSLBSLBSLBSLBSLBSLBSLBSLBSLBSLBSLBSLBSLBSLBSLBSLBSLBSLBSLBSLBSLBSLBSLB
LKALKALKALKALKALKALKALKALKALKALKALKALKALKALKALKALKALKALKALKALKALKALKALKALKALKALKALKALKALKALKALKALKALKALKALKALKALKALKALKALKALKALKALKALKALKALKALCALCALCALCALCALCALCALCALCALCALCALCALCALCALCALCALCALCALCALCALCALCALCALCALCALCALCALCALCALCALCALCALCALCALCALCALCALCALCALCALCALCALCALCALCALCALCAVCTVCTVCTVCTVCTVCTVCTVCTVCTVCTVCTVCTVCTVCTVCTVCTVCTVCTVCTVCTVCTVCTVCTVCTVCTVCTVCTVCTVCTVCTVCTVCTVCTVCTVCTVCTVCTVCTVCTVCTVCTVCTVCTVCTVCTVCT
SDNSDNSDNSDNSDNSDNSDNSDNSDNSDNSDNSDNSDNSDNSDNSDNSDNSDNSDNSDNSDNSDNSDNSDNSDNSDNSDNSDNSDNSDNSDNSDNSDNSDNSDNSDNSDNSDNSDNSDNSDNSDNSDNSDNSDNSDNSDN
TGOTGOTGOTGOTGOTGOTGOTGOTGOTGOTGOTGOTGOTGOTGOTGOTGOTGOTGOTGOTGOTGOTGOTGOTGOTGOTGOTGOTGOTGOTGOTGOTGOTGOTGOTGOTGOTGOTGOTGOTGOTGOTGOTGOTGOTGOTGO
-20
24
Per
Cap
ital
Rea
l GD
P G
row
th(I
n pe
rcen
t; a
vg 1
960-
2010
)
0 2 4 6Quality of Business Environment(CPIA Indicator; avg 2005-2009)
I. Full Sample
BGDBGDBGDBGDBGDBGDBGDBGDBGDBGDBGDBGDBGDBGDBGDBGDBGDBGDBGDBGDBGDBGDBGDBGDBGDBGDBGDBGDBGDBGDBGDBGDBGDBGDBGDBGDBGDBGDBGDBGDBGDBGDBGDBGDBGDBGDBGD
BENBENBENBENBENBENBENBENBENBENBENBENBENBENBENBENBENBENBENBENBENBENBENBENBENBENBENBENBENBENBENBENBENBENBENBENBENBENBENBENBENBENBENBENBENBENBEN
BTNBTNBTNBTNBTNBTNBTNBTNBTNBTNBTNBTNBTNBTNBTNBTNBTNBTNBTNBTNBTNBTNBTNBTNBTNBTNBTNBTNBTNBTNBTNBTNBTNBTNBTNBTNBTNBTNBTNBTNBTNBTNBTNBTNBTNBTN
BOLBOLBOLBOLBOLBOLBOLBOLBOLBOLBOLBOLBOLBOLBOLBOLBOLBOLBOLBOLBOLBOLBOLBOLBOLBOLBOLBOLBOLBOLBOLBOLBOLBOLBOLBOLBOLBOLBOLBOLBOLBOLBOLBOLBOLBOLBFABFABFABFABFABFABFABFABFABFABFABFABFABFABFABFABFABFABFABFABFABFABFABFABFABFABFABFABFABFABFABFABFABFABFABFABFABFABFABFABFABFABFABFABFABFABFA
BDIBDIBDIBDIBDIBDIBDIBDIBDIBDIBDIBDIBDIBDIBDIBDIBDIBDIBDIBDIBDIBDIBDIBDIBDIBDIBDIBDIBDIBDIBDIBDIBDIBDIBDIBDIBDIBDIBDIBDIBDIBDIBDIBDIBDIBDI
CMRCMRCMRCMRCMRCMRCMRCMRCMRCMRCMRCMRCMRCMRCMRCMRCMRCMRCMRCMRCMRCMRCMRCMRCMRCMRCMRCMRCMRCMRCMRCMRCMRCMRCMRCMRCMRCMRCMRCMRCMRCMRCMRCMRCMRCMRCMR
CPVCPVCPVCPVCPVCPVCPVCPVCPVCPVCPVCPVCPVCPVCPVCPVCPVCPVCPVCPVCPVCPVCPVCPVCPVCPVCPVCPVCPVCPVCPVCPVCPVCPVCPVCPVCPVCPVCPVCPVCPVCPVCPVCPVCPVCPV
CAFCAFCAFCAFCAFCAFCAFCAFCAFCAFCAFCAFCAFCAFCAFCAFCAFCAFCAFCAFCAFCAFCAFCAFCAFCAFCAFCAFCAFCAFCAFCAFCAFCAFCAFCAFCAFCAFCAFCAFCAFCAFCAFCAFCAFCAF
TCDTCDTCDTCDTCDTCDTCDTCDTCDTCDTCDTCDTCDTCDTCDTCDTCDTCDTCDTCDTCDTCDTCDTCDTCDTCDTCDTCDTCDTCDTCDTCDTCDTCDTCDTCDTCDTCDTCDTCDTCDTCDTCDTCDTCDTCD
COMCOMCOMCOMCOMCOMCOMCOMCOMCOMCOMCOMCOMCOMCOMCOMCOMCOMCOMCOMCOMCOMCOMCOMCOMCOMCOMCOMCOMCOMCOMCOMCOMCOMCOMCOMCOMCOMCOMCOMCOMCOMCOMCOMCOMCOM
ZARZARZARZARZARZARZARZARZARZARZARZARZARZARZARZARZARZARZARZARZARZARZARZARZARZARZARZARZARZARZARZARZARZARZARZARZARZARZARZARZARZARZARZARZARZARZAR
COGCOGCOGCOGCOGCOGCOGCOGCOGCOGCOGCOGCOGCOGCOGCOGCOGCOGCOGCOGCOGCOGCOGCOGCOGCOGCOGCOGCOGCOGCOGCOGCOGCOGCOGCOGCOGCOGCOGCOGCOGCOGCOGCOGCOGCOG
CIVCIVCIVCIVCIVCIVCIVCIVCIVCIVCIVCIVCIVCIVCIVCIVCIVCIVCIVCIVCIVCIVCIVCIVCIVCIVCIVCIVCIVCIVCIVCIVCIVCIVCIVCIVCIVCIVCIVCIVCIVCIVCIVCIVCIVCIVCIV
GMBGMBGMBGMBGMBGMBGMBGMBGMBGMBGMBGMBGMBGMBGMBGMBGMBGMBGMBGMBGMBGMBGMBGMBGMBGMBGMBGMBGMBGMBGMBGMBGMBGMBGMBGMBGMBGMBGMBGMBGMBGMBGMBGMBGMBGMB
GHAGHAGHAGHAGHAGHAGHAGHAGHAGHAGHAGHAGHAGHAGHAGHAGHAGHAGHAGHAGHAGHAGHAGHAGHAGHAGHAGHAGHAGHAGHAGHAGHAGHAGHAGHAGHAGHAGHAGHAGHAGHAGHAGHAGHAGHAGHA
GRDGRDGRDGRDGRDGRDGRDGRDGRDGRDGRDGRDGRDGRDGRDGRDGRDGRDGRDGRDGRDGRDGRDGRDGRDGRDGRDGRDGRDGRDGRDGRDGRDGRDGRDGRDGRDGRDGRDGRDGRDGRDGRDGRDGRDGRD
GUYGUYGUYGUYGUYGUYGUYGUYGUYGUYGUYGUYGUYGUYGUYGUYGUYGUYGUYGUYGUYGUYGUYGUYGUYGUYGUYGUYGUYGUYGUYGUYGUYGUYGUYGUYGUYGUYGUYGUYGUYGUYGUYGUYGUYGUYGUY
HTIHTIHTIHTIHTIHTIHTIHTIHTIHTIHTIHTIHTIHTIHTIHTIHTIHTIHTIHTIHTIHTIHTIHTIHTIHTIHTIHTIHTIHTIHTIHTIHTIHTIHTIHTIHTIHTIHTIHTIHTIHTIHTIHTIHTIHTI
HNDHNDHNDHNDHNDHNDHNDHNDHNDHNDHNDHNDHNDHNDHNDHNDHNDHNDHNDHNDHNDHNDHNDHNDHNDHNDHNDHNDHNDHNDHNDHNDHNDHNDHNDHNDHNDHNDHNDHNDHNDHNDHNDHNDHNDHND
INDINDINDINDINDINDINDINDINDINDINDINDINDINDINDINDINDINDINDINDINDINDINDINDINDINDINDINDINDINDINDINDINDINDINDINDINDINDINDINDINDINDINDINDINDINDIND
IDNIDNIDNIDNIDNIDNIDNIDNIDNIDNIDNIDNIDNIDNIDNIDNIDNIDNIDNIDNIDNIDNIDNIDNIDNIDNIDNIDNIDNIDNIDNIDNIDNIDNIDNIDNIDNIDNIDNIDNIDNIDNIDNIDNIDNIDNIDN
KENKENKENKENKENKENKENKENKENKENKENKENKENKENKENKENKENKENKENKENKENKENKENKENKENKENKENKENKENKENKENKENKENKENKENKENKENKENKENKENKENKENKENKENKENKENKEN
KIRKIRKIRKIRKIRKIRKIRKIRKIRKIRKIRKIRKIRKIRKIRKIRKIRKIRKIRKIRKIRKIRKIRKIRKIRKIRKIRKIRKIRKIRKIRKIRKIRKIRKIRKIRKIRKIRKIRKIRKIRKIRKIRKIRKIR
LAOLAOLAOLAOLAOLAOLAOLAOLAOLAOLAOLAOLAOLAOLAOLAOLAOLAOLAOLAOLAOLAOLAOLAOLAOLAOLAOLAOLAOLAOLAOLAOLAOLAOLAOLAOLAOLAOLAOLAOLAOLAOLAOLAOLAOLAO
LSOLSOLSOLSOLSOLSOLSOLSOLSOLSOLSOLSOLSOLSOLSOLSOLSOLSOLSOLSOLSOLSOLSOLSOLSOLSOLSOLSOLSOLSOLSOLSOLSOLSOLSOLSOLSOLSOLSOLSOLSOLSOLSOLSOLSOLSO
MDGMDGMDGMDGMDGMDGMDGMDGMDGMDGMDGMDGMDGMDGMDGMDGMDGMDGMDGMDGMDGMDGMDGMDGMDGMDGMDGMDGMDGMDGMDGMDGMDGMDGMDGMDGMDGMDGMDGMDGMDGMDGMDGMDGMDGMDGMDG
MWIMWIMWIMWIMWIMWIMWIMWIMWIMWIMWIMWIMWIMWIMWIMWIMWIMWIMWIMWIMWIMWIMWIMWIMWIMWIMWIMWIMWIMWIMWIMWIMWIMWIMWIMWIMWIMWIMWIMWIMWIMWIMWIMWIMWIMWI
MDVMDVMDVMDVMDVMDVMDVMDVMDVMDVMDVMDVMDVMDVMDVMDVMDVMDVMDVMDVMDVMDVMDVMDVMDVMDVMDVMDVMDVMDVMDVMDVMDVMDVMDVMDVMDVMDVMDVMDVMDVMDVMDVMDVMDVMDV
MLIMLIMLIMLIMLIMLIMLIMLIMLIMLIMLIMLIMLIMLIMLIMLIMLIMLIMLIMLIMLIMLIMLIMLIMLIMLIMLIMLIMLIMLIMLIMLIMLIMLIMLIMLIMLIMLIMLIMLIMLIMLIMLIMLIMLIMLIMLIMRTMRTMRTMRTMRTMRTMRTMRTMRTMRTMRTMRTMRTMRTMRTMRTMRTMRTMRTMRTMRTMRTMRTMRTMRTMRTMRTMRTMRTMRTMRTMRTMRTMRTMRTMRTMRTMRTMRTMRTMRTMRTMRTMRTMRTMRT
MOZMOZMOZMOZMOZMOZMOZMOZMOZMOZMOZMOZMOZMOZMOZMOZMOZMOZMOZMOZMOZMOZMOZMOZMOZMOZMOZMOZMOZMOZMOZMOZMOZMOZMOZMOZMOZMOZMOZMOZMOZMOZMOZMOZMOZMOZ
NPLNPLNPLNPLNPLNPLNPLNPLNPLNPLNPLNPLNPLNPLNPLNPLNPLNPLNPLNPLNPLNPLNPLNPLNPLNPLNPLNPLNPLNPLNPLNPLNPLNPLNPLNPLNPLNPLNPLNPLNPLNPLNPLNPLNPLNPLNPL
NERNERNERNERNERNERNERNERNERNERNERNERNERNERNERNERNERNERNERNERNERNERNERNERNERNERNERNERNERNERNERNERNERNERNERNERNERNERNERNERNERNERNERNERNERNERNER
NGANGANGANGANGANGANGANGANGANGANGANGANGANGANGANGANGANGANGANGANGANGANGANGANGANGANGANGANGANGANGANGANGANGANGANGANGANGANGANGANGANGANGANGANGANGANGAPAKPAKPAKPAKPAKPAKPAKPAKPAKPAKPAKPAKPAKPAKPAKPAKPAKPAKPAKPAKPAKPAKPAKPAKPAKPAKPAKPAKPAKPAKPAKPAKPAKPAKPAKPAKPAKPAKPAKPAKPAKPAKPAKPAKPAKPAKPAK
PNGPNGPNGPNGPNGPNGPNGPNGPNGPNGPNGPNGPNGPNGPNGPNGPNGPNGPNGPNGPNGPNGPNGPNGPNGPNGPNGPNGPNGPNGPNGPNGPNGPNGPNGPNGPNGPNGPNGPNGPNGPNGPNGPNGPNGPNGRWARWARWARWARWARWARWARWARWARWARWARWARWARWARWARWARWARWARWARWARWARWARWARWARWARWARWARWARWARWARWARWARWARWARWARWARWARWARWARWARWARWARWARWARWARWARWASTPSTPSTPSTPSTPSTPSTPSTPSTPSTPSTPSTPSTPSTPSTPSTPSTPSTPSTPSTPSTPSTPSTPSTPSTPSTPSTPSTPSTPSTPSTPSTPSTPSTPSTPSTPSTPSTPSTPSTPSTPSTPSTPSTPSTPSTP
SENSENSENSENSENSENSENSENSENSENSENSENSENSENSENSENSENSENSENSENSENSENSENSENSENSENSENSENSENSENSENSENSENSENSENSENSENSENSENSENSENSENSENSENSENSENSLESLESLESLESLESLESLESLESLESLESLESLESLESLESLESLESLESLESLESLESLESLESLESLESLESLESLESLESLESLESLESLESLESLESLESLESLESLESLESLESLESLESLESLESLESLE
SLBSLBSLBSLBSLBSLBSLBSLBSLBSLBSLBSLBSLBSLBSLBSLBSLBSLBSLBSLBSLBSLBSLBSLBSLBSLBSLBSLBSLBSLBSLBSLBSLBSLBSLBSLBSLBSLBSLBSLBSLBSLBSLBSLBSLBSLB
LKALKALKALKALKALKALKALKALKALKALKALKALKALKALKALKALKALKALKALKALKALKALKALKALKALKALKALKALKALKALKALKALKALKALKALKALKALKALKALKALKALKALKALKALKALKALKALCALCALCALCALCALCALCALCALCALCALCALCALCALCALCALCALCALCALCALCALCALCALCALCALCALCALCALCALCALCALCALCALCALCALCALCALCALCALCALCALCALCALCALCALCALCALCAVCTVCTVCTVCTVCTVCTVCTVCTVCTVCTVCTVCTVCTVCTVCTVCTVCTVCTVCTVCTVCTVCTVCTVCTVCTVCTVCTVCTVCTVCTVCTVCTVCTVCTVCTVCTVCTVCTVCTVCTVCTVCTVCTVCTVCTVCT
SDNSDNSDNSDNSDNSDNSDNSDNSDNSDNSDNSDNSDNSDNSDNSDNSDNSDNSDNSDNSDNSDNSDNSDNSDNSDNSDNSDNSDNSDNSDNSDNSDNSDNSDNSDNSDNSDNSDNSDNSDNSDNSDNSDNSDNSDNSDN
TGOTGOTGOTGOTGOTGOTGOTGOTGOTGOTGOTGOTGOTGOTGOTGOTGOTGOTGOTGOTGOTGOTGOTGOTGOTGOTGOTGOTGOTGOTGOTGOTGOTGOTGOTGOTGOTGOTGOTGOTGOTGOTGOTGOTGOTGOTGO
-20
24
Per
Cap
ital
Rea
l GD
P G
row
th(I
n pe
rcen
t; a
vg 1
960-
2010
)
0 2 4 6Progress on Structural Policies
(CPIA Indicator; avg 2005-2009)
BGDBGDBGDBGDBGDBGDBGDBGDBGDBGDBGDBGDBGDBGDBGDBGDBGDBGDBGDBGDBGDBGDBGDBGDBGDBGDBGDBGDBGDBGDBGDBGDBGDBGDBGDBGDBGDBGDBGDBGDBGDBGDBGDBGDBGDBGDBGD
BENBENBENBENBENBENBENBENBENBENBENBENBENBENBENBENBENBENBENBENBENBENBENBENBENBENBENBENBENBENBENBENBENBENBENBENBENBENBENBENBENBENBENBENBENBENBEN
BTNBTNBTNBTNBTNBTNBTNBTNBTNBTNBTNBTNBTNBTNBTNBTNBTNBTNBTNBTNBTNBTNBTNBTNBTNBTNBTNBTNBTNBTNBTNBTNBTNBTNBTNBTNBTNBTNBTNBTNBTNBTNBTNBTNBTNBTN
BOLBOLBOLBOLBOLBOLBOLBOLBOLBOLBOLBOLBOLBOLBOLBOLBOLBOLBOLBOLBOLBOLBOLBOLBOLBOLBOLBOLBOLBOLBOLBOLBOLBOLBOLBOLBOLBOLBOLBOLBOLBOLBOLBOLBOLBOL BFABFABFABFABFABFABFABFABFABFABFABFABFABFABFABFABFABFABFABFABFABFABFABFABFABFABFABFABFABFABFABFABFABFABFABFABFABFABFABFABFABFABFABFABFABFABFA
BDIBDIBDIBDIBDIBDIBDIBDIBDIBDIBDIBDIBDIBDIBDIBDIBDIBDIBDIBDIBDIBDIBDIBDIBDIBDIBDIBDIBDIBDIBDIBDIBDIBDIBDIBDIBDIBDIBDIBDIBDIBDIBDIBDIBDIBDI
CMRCMRCMRCMRCMRCMRCMRCMRCMRCMRCMRCMRCMRCMRCMRCMRCMRCMRCMRCMRCMRCMRCMRCMRCMRCMRCMRCMRCMRCMRCMRCMRCMRCMRCMRCMRCMRCMRCMRCMRCMRCMRCMRCMRCMRCMRCMR
CPVCPVCPVCPVCPVCPVCPVCPVCPVCPVCPVCPVCPVCPVCPVCPVCPVCPVCPVCPVCPVCPVCPVCPVCPVCPVCPVCPVCPVCPVCPVCPVCPVCPVCPVCPVCPVCPVCPVCPVCPVCPVCPVCPVCPVCPV
CAFCAFCAFCAFCAFCAFCAFCAFCAFCAFCAFCAFCAFCAFCAFCAFCAFCAFCAFCAFCAFCAFCAFCAFCAFCAFCAFCAFCAFCAFCAFCAFCAFCAFCAFCAFCAFCAFCAFCAFCAFCAFCAFCAFCAFCAF
TCDTCDTCDTCDTCDTCDTCDTCDTCDTCDTCDTCDTCDTCDTCDTCDTCDTCDTCDTCDTCDTCDTCDTCDTCDTCDTCDTCDTCDTCDTCDTCDTCDTCDTCDTCDTCDTCDTCDTCDTCDTCDTCDTCDTCDTCD
COMCOMCOMCOMCOMCOMCOMCOMCOMCOMCOMCOMCOMCOMCOMCOMCOMCOMCOMCOMCOMCOMCOMCOMCOMCOMCOMCOMCOMCOMCOMCOMCOMCOMCOMCOMCOMCOMCOMCOMCOMCOMCOMCOMCOMCOM
ZARZARZARZARZARZARZARZARZARZARZARZARZARZARZARZARZARZARZARZARZARZARZARZARZARZARZARZARZARZARZARZARZARZARZARZARZARZARZARZARZARZARZARZARZARZARZAR
COGCOGCOGCOGCOGCOGCOGCOGCOGCOGCOGCOGCOGCOGCOGCOGCOGCOGCOGCOGCOGCOGCOGCOGCOGCOGCOGCOGCOGCOGCOGCOGCOGCOGCOGCOGCOGCOGCOGCOGCOGCOGCOGCOGCOGCOG
CIVCIVCIVCIVCIVCIVCIVCIVCIVCIVCIVCIVCIVCIVCIVCIVCIVCIVCIVCIVCIVCIVCIVCIVCIVCIVCIVCIVCIVCIVCIVCIVCIVCIVCIVCIVCIVCIVCIVCIVCIVCIVCIVCIVCIVCIVCIV
GMBGMBGMBGMBGMBGMBGMBGMBGMBGMBGMBGMBGMBGMBGMBGMBGMBGMBGMBGMBGMBGMBGMBGMBGMBGMBGMBGMBGMBGMBGMBGMBGMBGMBGMBGMBGMBGMBGMBGMBGMBGMBGMBGMBGMBGMB
GHAGHAGHAGHAGHAGHAGHAGHAGHAGHAGHAGHAGHAGHAGHAGHAGHAGHAGHAGHAGHAGHAGHAGHAGHAGHAGHAGHAGHAGHAGHAGHAGHAGHAGHAGHAGHAGHAGHAGHAGHAGHAGHAGHAGHAGHAGHA
GRDGRDGRDGRDGRDGRDGRDGRDGRDGRDGRDGRDGRDGRDGRDGRDGRDGRDGRDGRDGRDGRDGRDGRDGRDGRDGRDGRDGRDGRDGRDGRDGRDGRDGRDGRDGRDGRDGRDGRDGRDGRDGRDGRDGRDGRD
GUYGUYGUYGUYGUYGUYGUYGUYGUYGUYGUYGUYGUYGUYGUYGUYGUYGUYGUYGUYGUYGUYGUYGUYGUYGUYGUYGUYGUYGUYGUYGUYGUYGUYGUYGUYGUYGUYGUYGUYGUYGUYGUYGUYGUYGUYGUY
HTIHTIHTIHTIHTIHTIHTIHTIHTIHTIHTIHTIHTIHTIHTIHTIHTIHTIHTIHTIHTIHTIHTIHTIHTIHTIHTIHTIHTIHTIHTIHTIHTIHTIHTIHTIHTIHTIHTIHTIHTIHTIHTIHTIHTIHTI
HNDHNDHNDHNDHNDHNDHNDHNDHNDHNDHNDHNDHNDHNDHNDHNDHNDHNDHNDHNDHNDHNDHNDHNDHNDHNDHNDHNDHNDHNDHNDHNDHNDHNDHNDHNDHNDHNDHNDHNDHNDHNDHNDHNDHNDHNDKENKENKENKENKENKENKENKENKENKENKENKENKENKENKENKENKENKENKENKENKENKENKENKENKENKENKENKENKENKENKENKENKENKENKENKENKENKENKENKENKENKENKENKENKENKENKEN
KIRKIRKIRKIRKIRKIRKIRKIRKIRKIRKIRKIRKIRKIRKIRKIRKIRKIRKIRKIRKIRKIRKIRKIRKIRKIRKIRKIRKIRKIRKIRKIRKIRKIRKIRKIRKIRKIRKIRKIRKIRKIRKIRKIRKIR
LAOLAOLAOLAOLAOLAOLAOLAOLAOLAOLAOLAOLAOLAOLAOLAOLAOLAOLAOLAOLAOLAOLAOLAOLAOLAOLAOLAOLAOLAOLAOLAOLAOLAOLAOLAOLAOLAOLAOLAOLAOLAOLAOLAOLAOLAO
LSOLSOLSOLSOLSOLSOLSOLSOLSOLSOLSOLSOLSOLSOLSOLSOLSOLSOLSOLSOLSOLSOLSOLSOLSOLSOLSOLSOLSOLSOLSOLSOLSOLSOLSOLSOLSOLSOLSOLSOLSOLSOLSOLSOLSOLSO MWIMWIMWIMWIMWIMWIMWIMWIMWIMWIMWIMWIMWIMWIMWIMWIMWIMWIMWIMWIMWIMWIMWIMWIMWIMWIMWIMWIMWIMWIMWIMWIMWIMWIMWIMWIMWIMWIMWIMWIMWIMWIMWIMWIMWIMWI
MDVMDVMDVMDVMDVMDVMDVMDVMDVMDVMDVMDVMDVMDVMDVMDVMDVMDVMDVMDVMDVMDVMDVMDVMDVMDVMDVMDVMDVMDVMDVMDVMDVMDVMDVMDVMDVMDVMDVMDVMDVMDVMDVMDVMDVMDV
MLIMLIMLIMLIMLIMLIMLIMLIMLIMLIMLIMLIMLIMLIMLIMLIMLIMLIMLIMLIMLIMLIMLIMLIMLIMLIMLIMLIMLIMLIMLIMLIMLIMLIMLIMLIMLIMLIMLIMLIMLIMLIMLIMLIMLIMLIMLIMRTMRTMRTMRTMRTMRTMRTMRTMRTMRTMRTMRTMRTMRTMRTMRTMRTMRTMRTMRTMRTMRTMRTMRTMRTMRTMRTMRTMRTMRTMRTMRTMRTMRTMRTMRTMRTMRTMRTMRTMRTMRTMRTMRTMRTMRT
MOZMOZMOZMOZMOZMOZMOZMOZMOZMOZMOZMOZMOZMOZMOZMOZMOZMOZMOZMOZMOZMOZMOZMOZMOZMOZMOZMOZMOZMOZMOZMOZMOZMOZMOZMOZMOZMOZMOZMOZMOZMOZMOZMOZMOZMOZ
NPLNPLNPLNPLNPLNPLNPLNPLNPLNPLNPLNPLNPLNPLNPLNPLNPLNPLNPLNPLNPLNPLNPLNPLNPLNPLNPLNPLNPLNPLNPLNPLNPLNPLNPLNPLNPLNPLNPLNPLNPLNPLNPLNPLNPLNPLNPL
NERNERNERNERNERNERNERNERNERNERNERNERNERNERNERNERNERNERNERNERNERNERNERNERNERNERNERNERNERNERNERNERNERNERNERNERNERNERNERNERNERNERNERNERNERNERNER
NGANGANGANGANGANGANGANGANGANGANGANGANGANGANGANGANGANGANGANGANGANGANGANGANGANGANGANGANGANGANGANGANGANGANGANGANGANGANGANGANGANGANGANGANGANGANGA
PNGPNGPNGPNGPNGPNGPNGPNGPNGPNGPNGPNGPNGPNGPNGPNGPNGPNGPNGPNGPNGPNGPNGPNGPNGPNGPNGPNGPNGPNGPNGPNGPNGPNGPNGPNGPNGPNGPNGPNGPNGPNGPNGPNGPNGPNGRWARWARWARWARWARWARWARWARWARWARWARWARWARWARWARWARWARWARWARWARWARWARWARWARWARWARWARWARWARWARWARWARWARWARWARWARWARWARWARWARWARWARWARWARWARWARWASTPSTPSTPSTPSTPSTPSTPSTPSTPSTPSTPSTPSTPSTPSTPSTPSTPSTPSTPSTPSTPSTPSTPSTPSTPSTPSTPSTPSTPSTPSTPSTPSTPSTPSTPSTPSTPSTPSTPSTPSTPSTPSTPSTPSTPSTP
SENSENSENSENSENSENSENSENSENSENSENSENSENSENSENSENSENSENSENSENSENSENSENSENSENSENSENSENSENSENSENSENSENSENSENSENSENSENSENSENSENSENSENSENSENSENSLESLESLESLESLESLESLESLESLESLESLESLESLESLESLESLESLESLESLESLESLESLESLESLESLESLESLESLESLESLESLESLESLESLESLESLESLESLESLESLESLESLESLESLESLESLE
SLBSLBSLBSLBSLBSLBSLBSLBSLBSLBSLBSLBSLBSLBSLBSLBSLBSLBSLBSLBSLBSLBSLBSLBSLBSLBSLBSLBSLBSLBSLBSLBSLBSLBSLBSLBSLBSLBSLBSLBSLBSLBSLBSLBSLBSLB
LCALCALCALCALCALCALCALCALCALCALCALCALCALCALCALCALCALCALCALCALCALCALCALCALCALCALCALCALCALCALCALCALCALCALCALCALCALCALCALCALCALCALCALCALCALCALCAVCTVCTVCTVCTVCTVCTVCTVCTVCTVCTVCTVCTVCTVCTVCTVCTVCTVCTVCTVCTVCTVCTVCTVCTVCTVCTVCTVCTVCTVCTVCTVCTVCTVCTVCTVCTVCTVCTVCTVCTVCTVCTVCTVCTVCTVCT
SDNSDNSDNSDNSDNSDNSDNSDNSDNSDNSDNSDNSDNSDNSDNSDNSDNSDNSDNSDNSDNSDNSDNSDNSDNSDNSDNSDNSDNSDNSDNSDNSDNSDNSDNSDNSDNSDNSDNSDNSDNSDNSDNSDNSDNSDNSDN
TGOTGOTGOTGOTGOTGOTGOTGOTGOTGOTGOTGOTGOTGOTGOTGOTGOTGOTGOTGOTGOTGOTGOTGOTGOTGOTGOTGOTGOTGOTGOTGOTGOTGOTGOTGOTGOTGOTGOTGOTGOTGOTGOTGOTGOTGOTGO
-20
24
Per
Cap
ital
Rea
l GD
P G
row
th(I
n pe
rcen
t; a
vg 1
960-
2010
)
0 2 4 6Quality of Business Environment(CPIA Indicator; avg 2005-2009)
II. Low Income Countries
BGDBGDBGDBGDBGDBGDBGDBGDBGDBGDBGDBGDBGDBGDBGDBGDBGDBGDBGDBGDBGDBGDBGDBGDBGDBGDBGDBGDBGDBGDBGDBGDBGDBGDBGDBGDBGDBGDBGDBGDBGDBGDBGDBGDBGDBGDBGD
BENBENBENBENBENBENBENBENBENBENBENBENBENBENBENBENBENBENBENBENBENBENBENBENBENBENBENBENBENBENBENBENBENBENBENBENBENBENBENBENBENBENBENBENBENBENBEN
BTNBTNBTNBTNBTNBTNBTNBTNBTNBTNBTNBTNBTNBTNBTNBTNBTNBTNBTNBTNBTNBTNBTNBTNBTNBTNBTNBTNBTNBTNBTNBTNBTNBTNBTNBTNBTNBTNBTNBTNBTNBTNBTNBTNBTNBTN
BOLBOLBOLBOLBOLBOLBOLBOLBOLBOLBOLBOLBOLBOLBOLBOLBOLBOLBOLBOLBOLBOLBOLBOLBOLBOLBOLBOLBOLBOLBOLBOLBOLBOLBOLBOLBOLBOLBOLBOLBOLBOLBOLBOLBOLBOLBFABFABFABFABFABFABFABFABFABFABFABFABFABFABFABFABFABFABFABFABFABFABFABFABFABFABFABFABFABFABFABFABFABFABFABFABFABFABFABFABFABFABFABFABFABFABFA
BDIBDIBDIBDIBDIBDIBDIBDIBDIBDIBDIBDIBDIBDIBDIBDIBDIBDIBDIBDIBDIBDIBDIBDIBDIBDIBDIBDIBDIBDIBDIBDIBDIBDIBDIBDIBDIBDIBDIBDIBDIBDIBDIBDIBDIBDI
CMRCMRCMRCMRCMRCMRCMRCMRCMRCMRCMRCMRCMRCMRCMRCMRCMRCMRCMRCMRCMRCMRCMRCMRCMRCMRCMRCMRCMRCMRCMRCMRCMRCMRCMRCMRCMRCMRCMRCMRCMRCMRCMRCMRCMRCMRCMR
CPVCPVCPVCPVCPVCPVCPVCPVCPVCPVCPVCPVCPVCPVCPVCPVCPVCPVCPVCPVCPVCPVCPVCPVCPVCPVCPVCPVCPVCPVCPVCPVCPVCPVCPVCPVCPVCPVCPVCPVCPVCPVCPVCPVCPVCPV
CAFCAFCAFCAFCAFCAFCAFCAFCAFCAFCAFCAFCAFCAFCAFCAFCAFCAFCAFCAFCAFCAFCAFCAFCAFCAFCAFCAFCAFCAFCAFCAFCAFCAFCAFCAFCAFCAFCAFCAFCAFCAFCAFCAFCAFCAF
TCDTCDTCDTCDTCDTCDTCDTCDTCDTCDTCDTCDTCDTCDTCDTCDTCDTCDTCDTCDTCDTCDTCDTCDTCDTCDTCDTCDTCDTCDTCDTCDTCDTCDTCDTCDTCDTCDTCDTCDTCDTCDTCDTCDTCDTCD
COMCOMCOMCOMCOMCOMCOMCOMCOMCOMCOMCOMCOMCOMCOMCOMCOMCOMCOMCOMCOMCOMCOMCOMCOMCOMCOMCOMCOMCOMCOMCOMCOMCOMCOMCOMCOMCOMCOMCOMCOMCOMCOMCOMCOMCOM
ZARZARZARZARZARZARZARZARZARZARZARZARZARZARZARZARZARZARZARZARZARZARZARZARZARZARZARZARZARZARZARZARZARZARZARZARZARZARZARZARZARZARZARZARZARZARZAR
COGCOGCOGCOGCOGCOGCOGCOGCOGCOGCOGCOGCOGCOGCOGCOGCOGCOGCOGCOGCOGCOGCOGCOGCOGCOGCOGCOGCOGCOGCOGCOGCOGCOGCOGCOGCOGCOGCOGCOGCOGCOGCOGCOGCOGCOG
CIVCIVCIVCIVCIVCIVCIVCIVCIVCIVCIVCIVCIVCIVCIVCIVCIVCIVCIVCIVCIVCIVCIVCIVCIVCIVCIVCIVCIVCIVCIVCIVCIVCIVCIVCIVCIVCIVCIVCIVCIVCIVCIVCIVCIVCIVCIV
GMBGMBGMBGMBGMBGMBGMBGMBGMBGMBGMBGMBGMBGMBGMBGMBGMBGMBGMBGMBGMBGMBGMBGMBGMBGMBGMBGMBGMBGMBGMBGMBGMBGMBGMBGMBGMBGMBGMBGMBGMBGMBGMBGMBGMBGMB
GHAGHAGHAGHAGHAGHAGHAGHAGHAGHAGHAGHAGHAGHAGHAGHAGHAGHAGHAGHAGHAGHAGHAGHAGHAGHAGHAGHAGHAGHAGHAGHAGHAGHAGHAGHAGHAGHAGHAGHAGHAGHAGHAGHAGHAGHAGHA
GRDGRDGRDGRDGRDGRDGRDGRDGRDGRDGRDGRDGRDGRDGRDGRDGRDGRDGRDGRDGRDGRDGRDGRDGRDGRDGRDGRDGRDGRDGRDGRDGRDGRDGRDGRDGRDGRDGRDGRDGRDGRDGRDGRDGRDGRD
GUYGUYGUYGUYGUYGUYGUYGUYGUYGUYGUYGUYGUYGUYGUYGUYGUYGUYGUYGUYGUYGUYGUYGUYGUYGUYGUYGUYGUYGUYGUYGUYGUYGUYGUYGUYGUYGUYGUYGUYGUYGUYGUYGUYGUYGUYGUY
HTIHTIHTIHTIHTIHTIHTIHTIHTIHTIHTIHTIHTIHTIHTIHTIHTIHTIHTIHTIHTIHTIHTIHTIHTIHTIHTIHTIHTIHTIHTIHTIHTIHTIHTIHTIHTIHTIHTIHTIHTIHTIHTIHTIHTIHTI
HNDHNDHNDHNDHNDHNDHNDHNDHNDHNDHNDHNDHNDHNDHNDHNDHNDHNDHNDHNDHNDHNDHNDHNDHNDHNDHNDHNDHNDHNDHNDHNDHNDHNDHNDHNDHNDHNDHNDHNDHNDHNDHNDHNDHNDHND
KENKENKENKENKENKENKENKENKENKENKENKENKENKENKENKENKENKENKENKENKENKENKENKENKENKENKENKENKENKENKENKENKENKENKENKENKENKENKENKENKENKENKENKENKENKENKEN
KIRKIRKIRKIRKIRKIRKIRKIRKIRKIRKIRKIRKIRKIRKIRKIRKIRKIRKIRKIRKIRKIRKIRKIRKIRKIRKIRKIRKIRKIRKIRKIRKIRKIRKIRKIRKIRKIRKIRKIRKIRKIRKIRKIRKIR
LAOLAOLAOLAOLAOLAOLAOLAOLAOLAOLAOLAOLAOLAOLAOLAOLAOLAOLAOLAOLAOLAOLAOLAOLAOLAOLAOLAOLAOLAOLAOLAOLAOLAOLAOLAOLAOLAOLAOLAOLAOLAOLAOLAOLAOLAO
LSOLSOLSOLSOLSOLSOLSOLSOLSOLSOLSOLSOLSOLSOLSOLSOLSOLSOLSOLSOLSOLSOLSOLSOLSOLSOLSOLSOLSOLSOLSOLSOLSOLSOLSOLSOLSOLSOLSOLSOLSOLSOLSOLSOLSOLSOMWIMWIMWIMWIMWIMWIMWIMWIMWIMWIMWIMWIMWIMWIMWIMWIMWIMWIMWIMWIMWIMWIMWIMWIMWIMWIMWIMWIMWIMWIMWIMWIMWIMWIMWIMWIMWIMWIMWIMWIMWIMWIMWIMWIMWIMWI
MDVMDVMDVMDVMDVMDVMDVMDVMDVMDVMDVMDVMDVMDVMDVMDVMDVMDVMDVMDVMDVMDVMDVMDVMDVMDVMDVMDVMDVMDVMDVMDVMDVMDVMDVMDVMDVMDVMDVMDVMDVMDVMDVMDVMDVMDV
MLIMLIMLIMLIMLIMLIMLIMLIMLIMLIMLIMLIMLIMLIMLIMLIMLIMLIMLIMLIMLIMLIMLIMLIMLIMLIMLIMLIMLIMLIMLIMLIMLIMLIMLIMLIMLIMLIMLIMLIMLIMLIMLIMLIMLIMLIMLIMRTMRTMRTMRTMRTMRTMRTMRTMRTMRTMRTMRTMRTMRTMRTMRTMRTMRTMRTMRTMRTMRTMRTMRTMRTMRTMRTMRTMRTMRTMRTMRTMRTMRTMRTMRTMRTMRTMRTMRTMRTMRTMRTMRTMRTMRT
MOZMOZMOZMOZMOZMOZMOZMOZMOZMOZMOZMOZMOZMOZMOZMOZMOZMOZMOZMOZMOZMOZMOZMOZMOZMOZMOZMOZMOZMOZMOZMOZMOZMOZMOZMOZMOZMOZMOZMOZMOZMOZMOZMOZMOZMOZ
NPLNPLNPLNPLNPLNPLNPLNPLNPLNPLNPLNPLNPLNPLNPLNPLNPLNPLNPLNPLNPLNPLNPLNPLNPLNPLNPLNPLNPLNPLNPLNPLNPLNPLNPLNPLNPLNPLNPLNPLNPLNPLNPLNPLNPLNPLNPL
NERNERNERNERNERNERNERNERNERNERNERNERNERNERNERNERNERNERNERNERNERNERNERNERNERNERNERNERNERNERNERNERNERNERNERNERNERNERNERNERNERNERNERNERNERNERNER
NGANGANGANGANGANGANGANGANGANGANGANGANGANGANGANGANGANGANGANGANGANGANGANGANGANGANGANGANGANGANGANGANGANGANGANGANGANGANGANGANGANGANGANGANGANGANGA
PNGPNGPNGPNGPNGPNGPNGPNGPNGPNGPNGPNGPNGPNGPNGPNGPNGPNGPNGPNGPNGPNGPNGPNGPNGPNGPNGPNGPNGPNGPNGPNGPNGPNGPNGPNGPNGPNGPNGPNGPNGPNGPNGPNGPNGPNGRWARWARWARWARWARWARWARWARWARWARWARWARWARWARWARWARWARWARWARWARWARWARWARWARWARWARWARWARWARWARWARWARWARWARWARWARWARWARWARWARWARWARWARWARWARWARWASTPSTPSTPSTPSTPSTPSTPSTPSTPSTPSTPSTPSTPSTPSTPSTPSTPSTPSTPSTPSTPSTPSTPSTPSTPSTPSTPSTPSTPSTPSTPSTPSTPSTPSTPSTPSTPSTPSTPSTPSTPSTPSTPSTPSTPSTP
SENSENSENSENSENSENSENSENSENSENSENSENSENSENSENSENSENSENSENSENSENSENSENSENSENSENSENSENSENSENSENSENSENSENSENSENSENSENSENSENSENSENSENSENSENSENSLESLESLESLESLESLESLESLESLESLESLESLESLESLESLESLESLESLESLESLESLESLESLESLESLESLESLESLESLESLESLESLESLESLESLESLESLESLESLESLESLESLESLESLESLESLE
SLBSLBSLBSLBSLBSLBSLBSLBSLBSLBSLBSLBSLBSLBSLBSLBSLBSLBSLBSLBSLBSLBSLBSLBSLBSLBSLBSLBSLBSLBSLBSLBSLBSLBSLBSLBSLBSLBSLBSLBSLBSLBSLBSLBSLBSLB
LCALCALCALCALCALCALCALCALCALCALCALCALCALCALCALCALCALCALCALCALCALCALCALCALCALCALCALCALCALCALCALCALCALCALCALCALCALCALCALCALCALCALCALCALCALCALCAVCTVCTVCTVCTVCTVCTVCTVCTVCTVCTVCTVCTVCTVCTVCTVCTVCTVCTVCTVCTVCTVCTVCTVCTVCTVCTVCTVCTVCTVCTVCTVCTVCTVCTVCTVCTVCTVCTVCTVCTVCTVCTVCTVCTVCTVCT
SDNSDNSDNSDNSDNSDNSDNSDNSDNSDNSDNSDNSDNSDNSDNSDNSDNSDNSDNSDNSDNSDNSDNSDNSDNSDNSDNSDNSDNSDNSDNSDNSDNSDNSDNSDNSDNSDNSDNSDNSDNSDNSDNSDNSDNSDNSDN
TGOTGOTGOTGOTGOTGOTGOTGOTGOTGOTGOTGOTGOTGOTGOTGOTGOTGOTGOTGOTGOTGOTGOTGOTGOTGOTGOTGOTGOTGOTGOTGOTGOTGOTGOTGOTGOTGOTGOTGOTGOTGOTGOTGOTGOTGOTGO
-20
24
Per
Cap
ital
Rea
l GD
P G
row
th(I
n pe
rcen
t; a
vg 1
960-
2010
)
0 2 4 6Progress on Structural Policies
(CPIA Indicator; avg 2005-2009)
BENBENBENBENBENBENBENBENBENBENBENBENBENBENBENBENBENBENBENBENBENBENBENBENBENBENBENBENBENBENBENBENBENBENBENBENBENBENBENBENBENBENBENBENBENBENBENBDIBDIBDIBDIBDIBDIBDIBDIBDIBDIBDIBDIBDIBDIBDIBDIBDIBDIBDIBDIBDIBDIBDIBDIBDIBDIBDIBDIBDIBDIBDIBDIBDIBDIBDIBDIBDIBDIBDIBDIBDIBDIBDIBDIBDIBDI
CMRCMRCMRCMRCMRCMRCMRCMRCMRCMRCMRCMRCMRCMRCMRCMRCMRCMRCMRCMRCMRCMRCMRCMRCMRCMRCMRCMRCMRCMRCMRCMRCMRCMRCMRCMRCMRCMRCMRCMRCMRCMRCMRCMRCMRCMRCMR
CPVCPVCPVCPVCPVCPVCPVCPVCPVCPVCPVCPVCPVCPVCPVCPVCPVCPVCPVCPVCPVCPVCPVCPVCPVCPVCPVCPVCPVCPVCPVCPVCPVCPVCPVCPVCPVCPVCPVCPVCPVCPVCPVCPVCPVCPV
CAFCAFCAFCAFCAFCAFCAFCAFCAFCAFCAFCAFCAFCAFCAFCAFCAFCAFCAFCAFCAFCAFCAFCAFCAFCAFCAFCAFCAFCAFCAFCAFCAFCAFCAFCAFCAFCAFCAFCAFCAFCAFCAFCAFCAFCAF
TCDTCDTCDTCDTCDTCDTCDTCDTCDTCDTCDTCDTCDTCDTCDTCDTCDTCDTCDTCDTCDTCDTCDTCDTCDTCDTCDTCDTCDTCDTCDTCDTCDTCDTCDTCDTCDTCDTCDTCDTCDTCDTCDTCDTCDTCD
COMCOMCOMCOMCOMCOMCOMCOMCOMCOMCOMCOMCOMCOMCOMCOMCOMCOMCOMCOMCOMCOMCOMCOMCOMCOMCOMCOMCOMCOMCOMCOMCOMCOMCOMCOMCOMCOMCOMCOMCOMCOMCOMCOMCOMCOM
ZARZARZARZARZARZARZARZARZARZARZARZARZARZARZARZARZARZARZARZARZARZARZARZARZARZARZARZARZARZARZARZARZARZARZARZARZARZARZARZARZARZARZARZARZARZARZAR
COGCOGCOGCOGCOGCOGCOGCOGCOGCOGCOGCOGCOGCOGCOGCOGCOGCOGCOGCOGCOGCOGCOGCOGCOGCOGCOGCOGCOGCOGCOGCOGCOGCOGCOGCOGCOGCOGCOGCOGCOGCOGCOGCOGCOGCOG
CIVCIVCIVCIVCIVCIVCIVCIVCIVCIVCIVCIVCIVCIVCIVCIVCIVCIVCIVCIVCIVCIVCIVCIVCIVCIVCIVCIVCIVCIVCIVCIVCIVCIVCIVCIVCIVCIVCIVCIVCIVCIVCIVCIVCIVCIVCIV
GMBGMBGMBGMBGMBGMBGMBGMBGMBGMBGMBGMBGMBGMBGMBGMBGMBGMBGMBGMBGMBGMBGMBGMBGMBGMBGMBGMBGMBGMBGMBGMBGMBGMBGMBGMBGMBGMBGMBGMBGMBGMBGMBGMBGMBGMB
GHAGHAGHAGHAGHAGHAGHAGHAGHAGHAGHAGHAGHAGHAGHAGHAGHAGHAGHAGHAGHAGHAGHAGHAGHAGHAGHAGHAGHAGHAGHAGHAGHAGHAGHAGHAGHAGHAGHAGHAGHAGHAGHAGHAGHAGHAGHA
KENKENKENKENKENKENKENKENKENKENKENKENKENKENKENKENKENKENKENKENKENKENKENKENKENKENKENKENKENKENKENKENKENKENKENKENKENKENKENKENKENKENKENKENKENKENKENLSOLSOLSOLSOLSOLSOLSOLSOLSOLSOLSOLSOLSOLSOLSOLSOLSOLSOLSOLSOLSOLSOLSOLSOLSOLSOLSOLSOLSOLSOLSOLSOLSOLSOLSOLSOLSOLSOLSOLSOLSOLSOLSOLSOLSOLSO
MDGMDGMDGMDGMDGMDGMDGMDGMDGMDGMDGMDGMDGMDGMDGMDGMDGMDGMDGMDGMDGMDGMDGMDGMDGMDGMDGMDGMDGMDGMDGMDGMDGMDGMDGMDGMDGMDGMDGMDGMDGMDGMDGMDGMDGMDGMDG
MWIMWIMWIMWIMWIMWIMWIMWIMWIMWIMWIMWIMWIMWIMWIMWIMWIMWIMWIMWIMWIMWIMWIMWIMWIMWIMWIMWIMWIMWIMWIMWIMWIMWIMWIMWIMWIMWIMWIMWIMWIMWIMWIMWIMWIMWIMLIMLIMLIMLIMLIMLIMLIMLIMLIMLIMLIMLIMLIMLIMLIMLIMLIMLIMLIMLIMLIMLIMLIMLIMLIMLIMLIMLIMLIMLIMLIMLIMLIMLIMLIMLIMLIMLIMLIMLIMLIMLIMLIMLIMLIMLIMLIMRTMRTMRTMRTMRTMRTMRTMRTMRTMRTMRTMRTMRTMRTMRTMRTMRTMRTMRTMRTMRTMRTMRTMRTMRTMRTMRTMRTMRTMRTMRTMRTMRTMRTMRTMRTMRTMRTMRTMRTMRTMRTMRTMRTMRTMRT
MOZMOZMOZMOZMOZMOZMOZMOZMOZMOZMOZMOZMOZMOZMOZMOZMOZMOZMOZMOZMOZMOZMOZMOZMOZMOZMOZMOZMOZMOZMOZMOZMOZMOZMOZMOZMOZMOZMOZMOZMOZMOZMOZMOZMOZMOZ
NERNERNERNERNERNERNERNERNERNERNERNERNERNERNERNERNERNERNERNERNERNERNERNERNERNERNERNERNERNERNERNERNERNERNERNERNERNERNERNERNERNERNERNERNERNERNER
NGANGANGANGANGANGANGANGANGANGANGANGANGANGANGANGANGANGANGANGANGANGANGANGANGANGANGANGANGANGANGANGANGANGANGANGANGANGANGANGANGANGANGANGANGANGANGA
RWARWARWARWARWARWARWARWARWARWARWARWARWARWARWARWARWARWARWARWARWARWARWARWARWARWARWARWARWARWARWARWARWARWARWARWARWARWARWARWARWARWARWARWARWARWARWASTPSTPSTPSTPSTPSTPSTPSTPSTPSTPSTPSTPSTPSTPSTPSTPSTPSTPSTPSTPSTPSTPSTPSTPSTPSTPSTPSTPSTPSTPSTPSTPSTPSTPSTPSTPSTPSTPSTPSTPSTPSTPSTPSTPSTPSTP
SENSENSENSENSENSENSENSENSENSENSENSENSENSENSENSENSENSENSENSENSENSENSENSENSENSENSENSENSENSENSENSENSENSENSENSENSENSENSENSENSENSENSENSENSENSENSLESLESLESLESLESLESLESLESLESLESLESLESLESLESLESLESLESLESLESLESLESLESLESLESLESLESLESLESLESLESLESLESLESLESLESLESLESLESLESLESLESLESLESLESLESLE
SDNSDNSDNSDNSDNSDNSDNSDNSDNSDNSDNSDNSDNSDNSDNSDNSDNSDNSDNSDNSDNSDNSDNSDNSDNSDNSDNSDNSDNSDNSDNSDNSDNSDNSDNSDNSDNSDNSDNSDNSDNSDNSDNSDNSDNSDNSDN
TGOTGOTGOTGOTGOTGOTGOTGOTGOTGOTGOTGOTGOTGOTGOTGOTGOTGOTGOTGOTGOTGOTGOTGOTGOTGOTGOTGOTGOTGOTGOTGOTGOTGOTGOTGOTGOTGOTGOTGOTGOTGOTGOTGOTGOTGOTGO
-20
24
Per
Cap
ital
Rea
l GD
P G
row
th(I
n pe
rcen
t; a
vg 1
960-
2010
)
0 2 4 6Quality of Business Environment(CPIA Indicator; avg 2005-2009)
III. Sub-Saharan Africa
BENBENBENBENBENBENBENBENBENBENBENBENBENBENBENBENBENBENBENBENBENBENBENBENBENBENBENBENBENBENBENBENBENBENBENBENBENBENBENBENBENBENBENBENBENBENBENBDIBDIBDIBDIBDIBDIBDIBDIBDIBDIBDIBDIBDIBDIBDIBDIBDIBDIBDIBDIBDIBDIBDIBDIBDIBDIBDIBDIBDIBDIBDIBDIBDIBDIBDIBDIBDIBDIBDIBDIBDIBDIBDIBDIBDIBDI
CMRCMRCMRCMRCMRCMRCMRCMRCMRCMRCMRCMRCMRCMRCMRCMRCMRCMRCMRCMRCMRCMRCMRCMRCMRCMRCMRCMRCMRCMRCMRCMRCMRCMRCMRCMRCMRCMRCMRCMRCMRCMRCMRCMRCMRCMRCMR
CPVCPVCPVCPVCPVCPVCPVCPVCPVCPVCPVCPVCPVCPVCPVCPVCPVCPVCPVCPVCPVCPVCPVCPVCPVCPVCPVCPVCPVCPVCPVCPVCPVCPVCPVCPVCPVCPVCPVCPVCPVCPVCPVCPVCPVCPV
CAFCAFCAFCAFCAFCAFCAFCAFCAFCAFCAFCAFCAFCAFCAFCAFCAFCAFCAFCAFCAFCAFCAFCAFCAFCAFCAFCAFCAFCAFCAFCAFCAFCAFCAFCAFCAFCAFCAFCAFCAFCAFCAFCAFCAFCAF
TCDTCDTCDTCDTCDTCDTCDTCDTCDTCDTCDTCDTCDTCDTCDTCDTCDTCDTCDTCDTCDTCDTCDTCDTCDTCDTCDTCDTCDTCDTCDTCDTCDTCDTCDTCDTCDTCDTCDTCDTCDTCDTCDTCDTCDTCD
COMCOMCOMCOMCOMCOMCOMCOMCOMCOMCOMCOMCOMCOMCOMCOMCOMCOMCOMCOMCOMCOMCOMCOMCOMCOMCOMCOMCOMCOMCOMCOMCOMCOMCOMCOMCOMCOMCOMCOMCOMCOMCOMCOMCOMCOM
ZARZARZARZARZARZARZARZARZARZARZARZARZARZARZARZARZARZARZARZARZARZARZARZARZARZARZARZARZARZARZARZARZARZARZARZARZARZARZARZARZARZARZARZARZARZARZAR
COGCOGCOGCOGCOGCOGCOGCOGCOGCOGCOGCOGCOGCOGCOGCOGCOGCOGCOGCOGCOGCOGCOGCOGCOGCOGCOGCOGCOGCOGCOGCOGCOGCOGCOGCOGCOGCOGCOGCOGCOGCOGCOGCOGCOGCOG
CIVCIVCIVCIVCIVCIVCIVCIVCIVCIVCIVCIVCIVCIVCIVCIVCIVCIVCIVCIVCIVCIVCIVCIVCIVCIVCIVCIVCIVCIVCIVCIVCIVCIVCIVCIVCIVCIVCIVCIVCIVCIVCIVCIVCIVCIVCIV
GMBGMBGMBGMBGMBGMBGMBGMBGMBGMBGMBGMBGMBGMBGMBGMBGMBGMBGMBGMBGMBGMBGMBGMBGMBGMBGMBGMBGMBGMBGMBGMBGMBGMBGMBGMBGMBGMBGMBGMBGMBGMBGMBGMBGMBGMB
GHAGHAGHAGHAGHAGHAGHAGHAGHAGHAGHAGHAGHAGHAGHAGHAGHAGHAGHAGHAGHAGHAGHAGHAGHAGHAGHAGHAGHAGHAGHAGHAGHAGHAGHAGHAGHAGHAGHAGHAGHAGHAGHAGHAGHAGHAGHA
KENKENKENKENKENKENKENKENKENKENKENKENKENKENKENKENKENKENKENKENKENKENKENKENKENKENKENKENKENKENKENKENKENKENKENKENKENKENKENKENKENKENKENKENKENKENKENLSOLSOLSOLSOLSOLSOLSOLSOLSOLSOLSOLSOLSOLSOLSOLSOLSOLSOLSOLSOLSOLSOLSOLSOLSOLSOLSOLSOLSOLSOLSOLSOLSOLSOLSOLSOLSOLSOLSOLSOLSOLSOLSOLSOLSOLSO
MDGMDGMDGMDGMDGMDGMDGMDGMDGMDGMDGMDGMDGMDGMDGMDGMDGMDGMDGMDGMDGMDGMDGMDGMDGMDGMDGMDGMDGMDGMDGMDGMDGMDGMDGMDGMDGMDGMDGMDGMDGMDGMDGMDGMDGMDGMDG
MWIMWIMWIMWIMWIMWIMWIMWIMWIMWIMWIMWIMWIMWIMWIMWIMWIMWIMWIMWIMWIMWIMWIMWIMWIMWIMWIMWIMWIMWIMWIMWIMWIMWIMWIMWIMWIMWIMWIMWIMWIMWIMWIMWIMWIMWIMLIMLIMLIMLIMLIMLIMLIMLIMLIMLIMLIMLIMLIMLIMLIMLIMLIMLIMLIMLIMLIMLIMLIMLIMLIMLIMLIMLIMLIMLIMLIMLIMLIMLIMLIMLIMLIMLIMLIMLIMLIMLIMLIMLIMLIMLIMLIMRTMRTMRTMRTMRTMRTMRTMRTMRTMRTMRTMRTMRTMRTMRTMRTMRTMRTMRTMRTMRTMRTMRTMRTMRTMRTMRTMRTMRTMRTMRTMRTMRTMRTMRTMRTMRTMRTMRTMRTMRTMRTMRTMRTMRTMRT
MOZMOZMOZMOZMOZMOZMOZMOZMOZMOZMOZMOZMOZMOZMOZMOZMOZMOZMOZMOZMOZMOZMOZMOZMOZMOZMOZMOZMOZMOZMOZMOZMOZMOZMOZMOZMOZMOZMOZMOZMOZMOZMOZMOZMOZMOZ
NERNERNERNERNERNERNERNERNERNERNERNERNERNERNERNERNERNERNERNERNERNERNERNERNERNERNERNERNERNERNERNERNERNERNERNERNERNERNERNERNERNERNERNERNERNERNER
NGANGANGANGANGANGANGANGANGANGANGANGANGANGANGANGANGANGANGANGANGANGANGANGANGANGANGANGANGANGANGANGANGANGANGANGANGANGANGANGANGANGANGANGANGANGANGA
RWARWARWARWARWARWARWARWARWARWARWARWARWARWARWARWARWARWARWARWARWARWARWARWARWARWARWARWARWARWARWARWARWARWARWARWARWARWARWARWARWARWARWARWARWARWARWASTPSTPSTPSTPSTPSTPSTPSTPSTPSTPSTPSTPSTPSTPSTPSTPSTPSTPSTPSTPSTPSTPSTPSTPSTPSTPSTPSTPSTPSTPSTPSTPSTPSTPSTPSTPSTPSTPSTPSTPSTPSTPSTPSTPSTPSTP
SENSENSENSENSENSENSENSENSENSENSENSENSENSENSENSENSENSENSENSENSENSENSENSENSENSENSENSENSENSENSENSENSENSENSENSENSENSENSENSENSENSENSENSENSENSENSLESLESLESLESLESLESLESLESLESLESLESLESLESLESLESLESLESLESLESLESLESLESLESLESLESLESLESLESLESLESLESLESLESLESLESLESLESLESLESLESLESLESLESLESLESLE
SDNSDNSDNSDNSDNSDNSDNSDNSDNSDNSDNSDNSDNSDNSDNSDNSDNSDNSDNSDNSDNSDNSDNSDNSDNSDNSDNSDNSDNSDNSDNSDNSDNSDNSDNSDNSDNSDNSDNSDNSDNSDNSDNSDNSDNSDNSDN
TGOTGOTGOTGOTGOTGOTGOTGOTGOTGOTGOTGOTGOTGOTGOTGOTGOTGOTGOTGOTGOTGOTGOTGOTGOTGOTGOTGOTGOTGOTGOTGOTGOTGOTGOTGOTGOTGOTGOTGOTGOTGOTGOTGOTGOTGOTGO
-20
24
Per
Cap
ital
Rea
l GD
P G
row
th(I
n pe
rcen
t; a
vg 1
960-
2010
)
0 2 4 6Progress on Structural Policies
(CPIA Indicator; avg 2005-2009)
Source: IMF World Economic Outlook; and authors' calculations.
Figure 5. Per Capita Real GDP Growth and Structural Reforms, 1960–2010
SIERRA LEONE
INTERNATIONAL MONETARY FUND 101
C. Relevance for Macroeconomic Policy in Sierra Leone
25. The search for inclusive growth in Sierra Leone has to incorporate stylized facts from
the literature: while capital accumulation and the pursuit of macroeconomic stability are important,
the quality of institutions and economic policy do matter. Dividends from steadfast pursuit of
macroeconomic stability cannot be overemphasized. Not only does it help maintain the value of
money (and dampen the burden of instability on the poor in society) but it also helps maintain a
stable and predictable economic environment for private sector planning and operations that go to
boost economic growth and employment. In addition, Sierra Leone, as in most LICs (although initial
conditions and the nature of policy challenges may differ across countries) structural impediments
to growth—(i) weak and unreliable infrastructure; (ii) institutional weaknesses; and (iii) low quality of
human capital—should be addressed through deep-going reforms. At the same time, effective
sectoral policies would be required, particularly in agriculture and mining, to promote economic
activity and create jobs.
26. Low quality of human capital does not only limit labor employment opportunities in
the private sector but it also constraints public sector capacity. Public service delivery is
weakened by the brain drain experienced during the conflict, which resulted in the recruitment of a
large number of low-skilled labor force motivated by a poor political agenda. Furthermore, the drop
in educational standards and skills mismatch limits the capacity of new graduates in filling the
capacity gap. As a result, there remains a huge capacity gap in the public sector and most of the
technical jobs are secured by local and foreign consultants. This has warranted the need for urgent
civil service reform in order to enhance capacity for implementation of the Agenda for Change.
Some efforts have been made under the Free Healthcare Initiative with the increment of the salaries
for healthcare workers in 2010, but much remains to be done in other sectors, particularly within the
context of the new initiative to comprehensively reform public sector pay structure to promote the
attractiveness of public sector employment. The pay reform agenda of government is expected to
address the overhang from the period of near irrational employment in the public sector.
Specifically, the reform is expected to be implemented over a five-year period (2011–15) with the
following features: a) minimum wage pay policy, b) classification of jobs into job elements, c) a
composite clean wage structure, and d) a unified single spine salary structure.
27. Building human capacity and addressing infrastructure bottlenecks would help boost
TFP and hence per capita real GDP growth and job creation. For now, total factor productivity
remains negative and two sectors (agriculture and mining) continue dominate economic activities.
Except for recent boom in FDI for iron ore mining in 2009–12, private sector participation in

SIERRA LEONE
102 INTERNATIONAL MONETARY FUND
economic activity remains generally low across all sectors of the economy mainly on account of the
high cost of doing business and other public sector inefficiencies.
28. A robust social safety net and employment-enhancing labor market policies would be
necessary. While specific labor market initiatives such as on-the-job training and job placements for
qualified but unemployed youth would help enhance the chances of employment and employability
and promote inclusive growth, well-targeted social support or safety net would ensure access to a
decent living standard for all citizens.
D. Concluding Remarks
29. Following the 2008 financial crisis and subsequent global economic slowdown, many
economies have weakened and unemployment has soared. These developments have
heightened the search for economic policies to help recovery of the global economy, create jobs,
and reduce poverty. For Sierra Leone, the quest for these goals transcends recent developments—it
has been there even prior to the onset of the civil conflict in 1991. The global economic slowdown,
coupled with increasing democratization and quest for social inclusiveness only heightened the
search for jobs and poverty reduction. Thus, initial conditions do matter.
30. The literature underscores the role of economic institutions and policy in boosting
growth and reducing poverty. One lesson that Sierra Leone can take home from these findings is
the significance of sound macroeconomic policies that reduce inflation and create a predictable
economic environment for private sector growth. The quality of institutions matter too: progress
should be maintained in structural reforms focused at improving public sector efficiency, as well as
addressing the infrastructure gap and lapses in human development (i.e., in health, education, and
social support services generally). Initiatives in these areas should be complemented with
sector-specific interventions (for example, in the labor market) to boost economic growth and create
jobs. At the same time, a strengthening of the existing social protection floor would be required to
dampen the adverse impact of efficiency-enhancing economic policies on vulnerable households.

SIERRA LEONE
INTERNATIONAL MONETARY FUND 103
References
Acemoglu, Daron, Simon Johnson and James Robinson (2001), “Colonial Origins of Comparative Development: An Empirical Investigation,” American Economic Review, December, 91(5): pp. 1369–1401.
Arellano, M. and Bond, S.R. (1991), “Some Tests of Specification for Panel Data: Monte Carlo Evidence and an Application to Employment equations,” Review of Economic Studies, Vol. 58, pp. 277–97.
Bloom, D. and J. Sachs (1998), “Geography, Demography and Economic Growth in Africa”, Brookings Papers in Economic Activity, 2: pp. 207–273.
Bosworth, Barry P. and Susan M. Collins (2003), “The Empirics of Growth: An Update,” Brookings Papers on Economic Activity, 0(2), pp. 113–179.
Dollar, David and Aart Kraay (2001), “Trade, Growth and Poverty,” mimeo., Development Research Group, World Bank.
Country Policy and Institutional Assessment (World Bank), 2010
Fosu, Augustine Kwasi (2012), “Growth of African Economies: Productivity, Policy Syndromes and the Importance of Institutions,” CSAE Working Paper, WPS/2012_11
Hulten, Charles R. (2001), “Total factor productivity: A Short Biography.” In Charles
Hulten, Edward R. Dean, Michael Harper (editors) New Developments in Productivity Analysis, Studies in Income and Wealth, Vol. 63, Chicago, Chicago university Press: pp 1–54.
Ianchovichina, Elena and Susanna Lundstrum (2009), “Inclusive Growth Analytics: Framework and Application,” Policy Research Working Paper, Number 4851, World Bank.
Islam, Narzul (1995), “Growth Empirics: A Panel Data Approach,” Quarterly Journal of Economics, 110(4), pp. 1127–1170.
Kumah, Francis Y. and Mathew Sandy (2013), In Search of Inclusive Growth: The Role of Economic Institutions and Policy,” IMF Working Papers (forthcoming). Forthcoming in a Special Edition (Economic Growth and Business Cycles) of the Journal of Modern Economy.
Nunn, N. (2008). “The Long-term Effects of Africa’s Slave Trades,” Quarterly Journal of Economics, 123(1), pp. 139–176.
Pinkovskiy, M. and Xavier Sala-i-Martin (2010), “African Poverty is Falling …Much Faster Than You Think!” NBER Working Paper No. 15775, February 2010.

SIERRA LEONE
104 INTERNATIONAL MONETARY FUND
Rodrik, Dani (2000), “Growth versus Poverty Reduction: A Hollow Debate,” Finance and Development, December 2000, pp. 8–9.
Rodrik, Danny and Arvind Subramanian (2002), “Institutions Rule: The Primacy of Institutions over Integration and Geography in Economic Development”, IMF Working Papers, No. 02/189, November 2002.
Solow, Robert M. (1957), “Technical Change and the Aggregate Production Function,” Review of Economics and Statistics, Vol. 39, pp. 312–320.
Sonja Fagernäs and Lindsay Wallace (2007), “Determinants of Poverty in Sierra Leone, 2003”, ODI ESAU Working Paper, No. 19.

SIERRA LEONE
INTERNATIONAL MONETARY FUND 105
A. Full Sample
Dependent variable: log. Real GDP per capita
Below Average Above Average Below Average Above Average Below Average Above Average
One-period lagged per capita real GDP 0.923*** 0.864*** 0.923*** 0.848*** 0.923*** 0.898***(0.000) (0.000) (0.000) (0.001) (0.000) (0.000)
Capital stock 0.064** 0.024* 0.064** 0.0053 0.064*** 0.034***(0.054) (0.101) (0.054) (0.391) (0.054) (0.020)
Inflation variability -0.002* -0.000 -0.002* 0.0003 -0.002* -0.0003(0.060) (0.853) (0.060) (0.816) (0.060) (0.810)
REER -0.001 -0.0012 -0.0006 -0.005** -0.0006 -0.003**(0.056) (0.567) (0.563) (0.144) (0.563) (0.066)
Credit boom 0.0185 -0.0079 0.0185 -0.0054 0.0185 -0.0013(0.125) (0.257) (0.125) (0.449) (0.125) (0.795)
Government consumption 0.0092 0.029** 0.0092 0.046*** 0.0092 0.027***(0.414) (0.057) (0.414) (0.051) (0.414) (0.001)
Constant 0.668* 1.259*** 0.668* 1.334*** 0.668* 0.933***(0.063) (0.002) (0.063) (0.067) (0.063) (0.000)
Number of observations 933 222 933 86 933 331
R-squared 0.9801 0.9256 0.9801 0.937 0.9801 0.9246
F statistic 6595.87 822.14 6595.87 .... 6595.87 1304.23Prob > F 0.0000 0.0000 0.0000 …. 0.0000 0.0000
Source: IMF World Economic Outlook (WEO) database; and authors' estimations using panel methods in Stata.
Notes: All variables are expressed in logarithms. Figures in parenthesis are probability values; note: *** p<0.01, ** p<0.05, * p<0.1.
Quality of Structural Policies Business Regulatory Environment Overall Economic Management
Table 1a. Role of Institutions in Growth, 1960–2010
B. Low Income Countries
Dependent variable: log. Real GDP per capita
Below Average Above Average Below Average Above Average Below Average Above Average
One-period lagged per capita real GDP 0.895*** 0.840*** 0.895*** 0.711*** 0.895*** 0.871***(0.061) (0.000) (0.061) (0.001) (0.061) (0.000)
Capital stock 0.088* 0.026* 0.088* 0.0073 0.088* 0.033***(0.046) (0.091) (0.046) (0.216) (0.046) (0.023)
Inflation variability -0.003** -0.000** -0.003** -0.0027 -0.003** -0.000(0.001) (0.082) (0.001) (0.930) (0.001) (0.814)
REER -0.001 -0.0003 -0.001 -0.006** -0.001 -0.003**-0.001 (0.877) (0.001) (0.220) (0.001) (0.090)
Credit boom (0.001) 0.009* 0.050* -0.0034 0.050* -0.0013(0.027) (0.247) (0.027) (0.670) (0.027) (0.792)
Government consumption 0.004 0.0290 0.004 0.050*** 0.004 0.027***(0.013) (0.082) (0.013) (0.171) (0.013) (0.002)
Constant 0.868 1.4704 0.868 2.455*** 0.868 0.983***(0.561) (0.001) (0.561) (0.001) (0.561) (0.000)
Number of observations … 194 … 58 … 303
R-squared … 0.8977 … 0.8084 … 0.9246
F statistic … 82336.05 … .... … 904.47Prob > F … 0.0000 … …. … 0.0000
Source: IMF World Economic Outlook (WEO) database; and authors' estimations using panel methods in Stata.
Notes: All variables are expressed in logarithms. Figures in parenthesis are standard errors; ; note: *** p<0.01, ** p<0.05, * p<0.1
Quality of Structural Policies Business Regulatory Environment Overall Economic Management
Table 1b. Role of Institutions in Growth, 1960–2010

SIERRA LEONE
106 INTERNATIONAL MONETARY FUND
C. Sub-Saharan African Countries
Dependent variable: log. Real GDP per capita
Below Average Above Average Below Average Above Average Below Average Above Average
One-period lagged per capita real GDP 0.735*** 0.865*** 0.735*** 0.711*** 0.735*** 0.903***(0.034) (0.000) (0.034) (0.001) (0.034) (0.000)
Capital stock 0.206*** 0.030** 0.206*** 0.007* 0.206*** 0.357***(0.060) (0.079) (0.060) (0.216) (0.060) (0.280)
Inflation variability 0.0007 0.0082 0.0007 -0.0003 0.0007 -0.0014(0.932) (0.705) (0.932) (0.930) (0.932) (0.942)
REER 0.0018 -0.0069 0.0018 -0.006* 0.0018 -0.028*(0.851) (0.787) (0.851) (0.220) (0.851) (0.090)
Credit boom 0.156*** -0.0098 0.156*** -0.003** 0.156*** -0.0026(0.111) (0.295) (0.111) (0.670) (0.111) (0.604)
Government consumption -0.0957 0.0173 -0.0096 0.0500 -0.0066 0.025***(0.842) (0.330) (0.842) (0.171) (0.842) (0.004)
Constant 1.941*** 1.325*** 1.941*** 2.455*** 1.941*** 0.912***(-0.121) (0.003) (0.121) (0.001) (0.121) (0.000)
Number of observations 55 145 55 58 55 236
R-squared 0.9874 0.9150 0.9874 0.8084 0.9874 0.9243
F statistic … … … .... … 1775.60Prob > F … … … … . … 0.0000
Notes: All variables are expressed in logarithms. Figures in parenthesis are probability values; note: *** p<0.01, ** p<0.05, * p<0.1
Quality of Structural Policies Business Regulatory Environment Overall Economic Management
Source: IMF World Economic Outlook (WEO) database, and authors’ estimations using panel methods in Stata.
Table 1c. Role of Institutions in Growth, 1960–2010

SIERRA LEONE STAFF REPORT FOR THE 2013 ARTICLE IV CONSULTATION AND REQUEST FOR A THREE-YEAR ARRANGEMENT UNDER THE EXTENDED CREDIT FACILITY—INFORMATIONAL ANNEX Prepared By
The African Department (In consultation with other departments)
RELATIONS WITH THE FUND ____________________________________________________________ 2
JOINT WORLD BANK-IMF WORK PROGRAM, 2013–14 ________________________________ 7
STATISTICAL ISSUES ______________________________________________________________________ 9
CONTENTS
October 7, 2013

SIERRA LEONE
2 INTERNATIONAL MONETARY FUND
RELATIONS WITH THE FUND (As of August 31, 2013)
Membership Status: Joined 9/10/62; Article VIII
General Resources Account: SDR Million % Quota Quota 103.70 100.00 Fund holdings of currency 103.69 99.99 Reserve position 0.02 0.02
SDR Department: SDR Million % Allocation Net cumulative allocation 99.51 100.00 Holdings 109.50 110.04
Outstanding Purchases and Loans: SDR Million % Quota ECF Arrangements 76.48 73.75
Latest Financial Arrangements:
Type Date of
Arrangement Expiration Date
Amount Approved
(SDR Million)
Amount Drawn
(SDR Million ECF1 July 01, 2010 June 30, 2013 31.11 22.20 ECF1 May 10, 2006 June 22, 2010 51.88 51.88 ECF1 Sept. 26, 2001 June 25, 2005 130.84 130.84
Projected Payments to Fund2
(SDR million; based on current use of resources and present holdings of SDRs): Forthcoming 2013 2014 2015 2016 2017 Principal 2.31 8.12 9.86 11.68 12.11 Charges/Interest 0.00 0.00 0.16 0.13 0.10 Total 2.31 8.12 10.01 11.81 12.20
Implementation of HIPC Initiative:
Enhanced Framework Commitment of HIPC Initiative assistance Decision point date March 2002
1Formerly PRGF.
2 When a member has overdue financial obligations outstanding for more than three months, the amount will be shown in this section.

SIERRA LEONE
INTERNATIONAL MONETARY FUND 3
Assistance committed (NPV terms) By all creditors (US$ million)3 675.20 Of which: IMF assistance (US$ million) 125.21 (SDR equivalent in millions) 100.00 Completion point date December 2006 Disbursement of IMF assistance (SDR million) Amount disbursed 100.00 Interim assistance 66.03 Completion point balance 33.97 Additional disbursement of interest income4 6.58 Total disbursements 106.58 Implementation of Multilateral Debt Relief Initiative (MDRI):
I. MDRI-eligible debt (SDR Million)51 117.34
Financed by: MDRI Trust 76.75 Remaining HIPC resources 40.59 II. Debt Relief by facility (SDR Million) Eligible Debt Delivery Date GRA PRGT Total December 2006 N/A 117.34 117.34
Safeguards Assessment:
The latest safeguards assessment for the Bank of Sierra Leone was completed on November 24, 2010. The assessment concluded that the BSL continues to maintain important elements of the safeguards framework; financial statements are prepared and audited in accordance with international standards and are published in a timely manner on the BSL website. Currently, the BSL is still in the process of strengthening staff capacity in its internal audit function. The next update will be completed by the first review of the proposed ECF arrangement.
3 Assistance committed under the original framework is expressed in net present value (NPV) terms at the completion point, and assistance committed under the enhanced framework is expressed in NPV terms at the decision point. Hence these two amounts cannot be added. 4 Under the enhanced framework, an additional disbursement is made at the completion point corresponding to interest income earned on the amount committed at the decision point but not disbursed during the interim. 5 The MDRI provides 100 percent debt relief to eligible member countries that qualified for the assistance. Grant assistance from the MDRI Trust and HIPC resources provide debt relief to cover the full stock of debt owed to the Fund as of 2004 that remains outstanding at the time the member qualifies for debt relief.

SIERRA LEONE
4 INTERNATIONAL MONETARY FUND
Exchange Rate Arrangement:
For customs valuation purposes and for official transactions, the Bank of Sierra Leone (BSL) calculates an official exchange rate every Friday morning as the weighted average of the auction rate, the commercial bank mid-rate, and the bureau mid-rate in the previous week. Commercial banks may buy foreign exchange from and sell it to individual customers and may trade among themselves or with the BSL on a freely negotiable basis. As of October 3, 2013, the BSL mid rate was Le 4,333.53=US$1.
Sierra Leone’s de jure exchange rate regime is classified as floating, with the value of the leone determined by the market. Furthermore, effective November 1, 2008, the de facto exchange rate arrangement has been reclassified to ‘floating’ from a ‘stabilized arrangement’.
With effect December 14, 1995, Sierra Leone has accepted the obligations of Article VIII, Sections 2, 3, and 4, and maintains an exchange system free of restrictions on the making of payments and transfers for current international transactions. Sierra Leone maintains one multiple currency practice subject to Fund jurisdiction arising from the applied multiple-price Dutch auction system, as there is no formal mechanism in place to prevent spreads of effective rates between winning bids from exceeding 2 percent.
Article IV Consultation:
The Executive Board concluded the 2010 Article IV consultation on December 6, 2010. The next Article IV consultation will be held in accordance with the 2010 decision on consultation cycles.
Technical Assistance:
Department Purpose Date
FAD EI Macro-Fiscal, PFM, and Expenditure Policy April 2013
EI Revenue Administration August 2012
EI Macro-Fiscal, PFM, and Expenditure Policy February/Sept. 2012
EI Fiscal Regimes Follow-Up February/Aug. 2012
Post-GST Implementation Review February 2012
Terms of Draft EI Revenue Act (EIRA) January/July 2012
Extractive Industry Fiscal Regimes October/November 2011
Tax Administration October/November 2011
Mining and Oil Tax Policy, and Macro-fiscal and Forecasting
July 2011
Fiscal Regimes for Extractive Industries July 2011

SIERRA LEONE
INTERNATIONAL MONETARY FUND 5
Department Purpose Date
Advancing Public Financial Management Reforms June 2011
Advancing Public Financial Management Reforms April 2011
Petroleum Product Prices April 2011
Reform Progress update September 2010
Review of petroleum pricing mechanism February 2010
Tax administration January 2010
Evaluation of progress in PFM reforms March 2009
Follow-up assessment on TA needs June 2009
Assistance in designing a simplified regime for small taxpayers
January 2009
Evaluation of progress on tax administration reform and VAT preparation
September 2008
Evaluation of progress on PFM reforms July 2008
Implementation of public financial management reforms
March 2008
Tax administration reforms for successful VAT implementation
February 2008
MCM Financial Stability Analysis February 2013
Medium-term Debt management Strategy January 2013
Liquidity Forecasting and Development of Interbank Foreign Exchange Market
July 2012, January 2013
TA Needs Assessment Mission February 2012
Financial Stability Analysis April/May 2011
Banking Supervision and Banking Regulation April 2010
Needs assessment and monetary operations and foreign exchange auction system
March 2010
Follow-up assessment of banking supervision processes at BSL
March 2009
Follow-up assessment on progress in strengthening central bank internal auditing
March 2009
BSL: Internal audit and management of the central bank
October 2008

SIERRA LEONE
6 INTERNATIONAL MONETARY FUND
Department Purpose Date Monetary policy, banking supervision, and
recapitalization of the BSL April/May 2008
Recapitalization of the BSL February 2008
STA Annual National Accounts Statistics Module Mission within the Enhanced Data Dissemination Initiative Project for Africa
July/August 2013
National Accounts under Module 5 within the Managing Natural Resource Wealth (MNRW) project,
April/May 2013
Consumer Price Index August 2012
SRF Data Development August 2012
Monetary and Financial Statistics Mission under the Enhanced Data Dissemination Initiative (EDDI) Project for Africa.
August 2012
Annual National Accounts Statistics Module Mission within the Enhanced Data Dissemination Initiative Project for Africa
December 2011
Producer Price Index Mission November 2011
Producer Price Index Mission June/July 2011
Annual National Accounts Statistics Module Mission within the Enhanced Data Dissemination Initiative Project for Africa
May/June 2011
Annual National Accounts Statistics Module Mission within the Enhanced Data Dissemination Initiative Project for Africa
February/March 2011
Standardized Report Form Data Development for Other Financial Corporations
October 2010
Producer Price Index Mission October 2010
Assist the authorities in implementing the international standards recommended in the Monetary and Financial Statistics Manual
April 2009
National accounts statistics mission March 2009
National accounts statistics mission September/October 2008
National accounts statistics mission January 2008
Resident Representative:
Mr. Francis Kumah assumed responsibility for the Fund office in Freetown in November 2010.
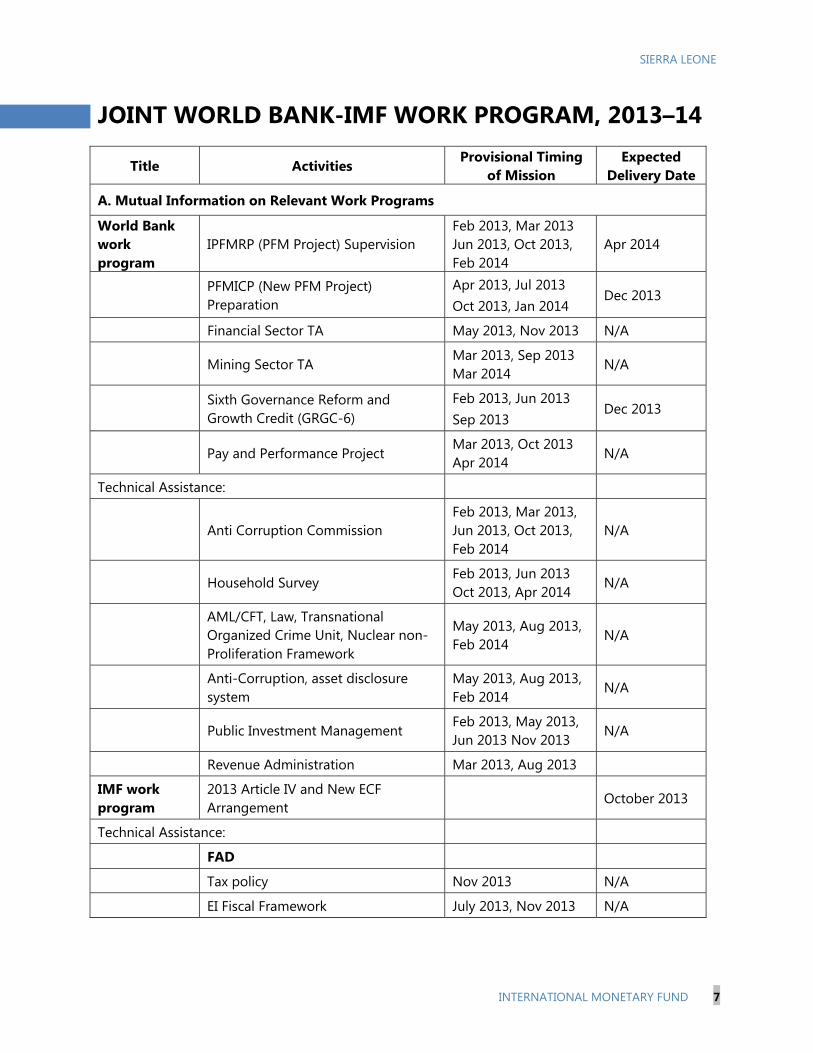
SIERRA LEONE
INTERNATIONAL MONETARY FUND 7
JOINT WORLD BANK-IMF WORK PROGRAM, 2013–14
Title Activities Provisional Timing
of Mission Expected
Delivery Date
A. Mutual Information on Relevant Work Programs
World Bank work program
IPFMRP (PFM Project) Supervision Feb 2013, Mar 2013 Jun 2013, Oct 2013, Feb 2014
Apr 2014
PFMICP (New PFM Project) Preparation
Apr 2013, Jul 2013 Oct 2013, Jan 2014
Dec 2013
Financial Sector TA May 2013, Nov 2013 N/A
Mining Sector TA Mar 2013, Sep 2013 Mar 2014
N/A
Sixth Governance Reform and Growth Credit (GRGC-6)
Feb 2013, Jun 2013 Sep 2013
Dec 2013
Pay and Performance Project Mar 2013, Oct 2013 Apr 2014
N/A
Technical Assistance:
Anti Corruption Commission Feb 2013, Mar 2013, Jun 2013, Oct 2013, Feb 2014
N/A
Household Survey Feb 2013, Jun 2013 Oct 2013, Apr 2014
N/A
AML/CFT, Law, Transnational Organized Crime Unit, Nuclear non-Proliferation Framework
May 2013, Aug 2013, Feb 2014
N/A
Anti-Corruption, asset disclosure system
May 2013, Aug 2013, Feb 2014
N/A
Public Investment Management Feb 2013, May 2013, Jun 2013 Nov 2013
N/A
Revenue Administration Mar 2013, Aug 2013
IMF work program
2013 Article IV and New ECF Arrangement
October 2013
Technical Assistance:
FAD
Tax policy Nov 2013 N/A
EI Fiscal Framework July 2013, Nov 2013 N/A

SIERRA LEONE
8 INTERNATIONAL MONETARY FUND
Title Activities Provisional Timing
of Mission Expected
Delivery Date EI Revenue Administration August 2013 N/A
EI PFM Legal framework and TSA September 2013 N/A
EI PFM TSA and natural resource fund management
December 2013 N/A
EI Fiscal Framework February 2014 N/A
MCM
Reserve management capacity building
October 2013 N/A
Monetary and Foreign Exchange Operations
October 2013 N/A
STA
National Accounts Apr 2013, July 2013, Apr 2014
N/A
Price Statistics November 2013 N/A
B. Agreement on Joint Products and Missions Joint products in 2013
MTDS—Medium-Term Debt Management Strategy
December 2013 N/A
Joint Staff Advisory Note Nov 2013
Assisting the authorities with the implementation of their financial sector reform strategy
Continuous

SIERRA LEONE
INTERNATIONAL MONETARY FUND 9
STATISTICAL ISSUES As of September 5, 2013
I. Assessment of Data Adequacy for Surveillance
General: Data provision is broadly adequate for surveillance purposes. Data management advanced since the end of the civil conflict that resulted in a virtual collapse of statistical systems in the late 1990s. However, deficiencies still affect balance of payments (BOP) and international investment position (IIP) statistics, national accounts, government finance statistics, and social indicators. A major and sustained improvement in the coverage and timeliness of economic data will require greater interagency coordination and restructuring of the institutional framework.
National Accounts: Improvements have been made in the compilation of construction, estimation of informal sector activity, measurement of government services, agricultural production, household final consumption, and constant price gross domestic product (GDP). Under a new DFID-funded project five technical assistance missions have visited Freetown since 2010 to improve annual estimates of GDP. In 2012, national accounts were rebased using 2006 prices. Remaining issues concern developing better data sources for agricultural and mineral production, and generally continuing the improvement of informal sector measurement. However, shortages of resources and staff continue to pose major constraints to the statistical development undertaken by Statistics Sierra Leone (SSL).
Price Statistics: The SSL compiles the CPI monthly and publishes it with a lag of about three weeks. It has been rebased to 2007 using the 2007 Sierra Leone integrated household survey and continues to cover the capital city and three main districts. While a national CPI is being compiled, the authorities continue to publish the old CPI (1992=100). The authorities have requested technical assistance for the preparation and adoption of a single index.
Technical assistance missions visited Freetown in August 2012 to review the CPI and to advice on the development of a producer price index (PPI). The authorities are working to improve the index calculation methods for the CPI and procedures to aggregate regional CPIs to obtain the national index.
The Authorities have developed PPI weights, selected a representative sample of establishments, and selected representative products and transaction for price collection. A work plan, in the form of Project Framework Summary, was drafted for the preparation of the new PPI.
Government Finance Statistics: The budget reporting system was established with assistance from the Fund/UNDP technical assistance project. Monthly cash flow data on central government revenue, current expenditure, and financing are provided. The transaction coverage of the central government cash flow is incomplete. There is an urgent need for more timely and accurate data on foreign-financed development projects. Reports on implementation of the development budget and its financing are currently not produced in a format that is suitable for budget analysis because the necessary data are not available.
The authorities are currently considering introduction of a flash reporting system for government expenditure in general and for foreign aid-financed projects. As part of the GDDS regional project for Anglophone African countries, work has been undertaken to reconcile fiscal and monetary data and to improve the coverage and classification of the two data sets. With the current drive towards decentralization and the growing role of local government, there is an urgent need to compile and monitor the operations (and financial balance sheet data) for the consolidated general government.
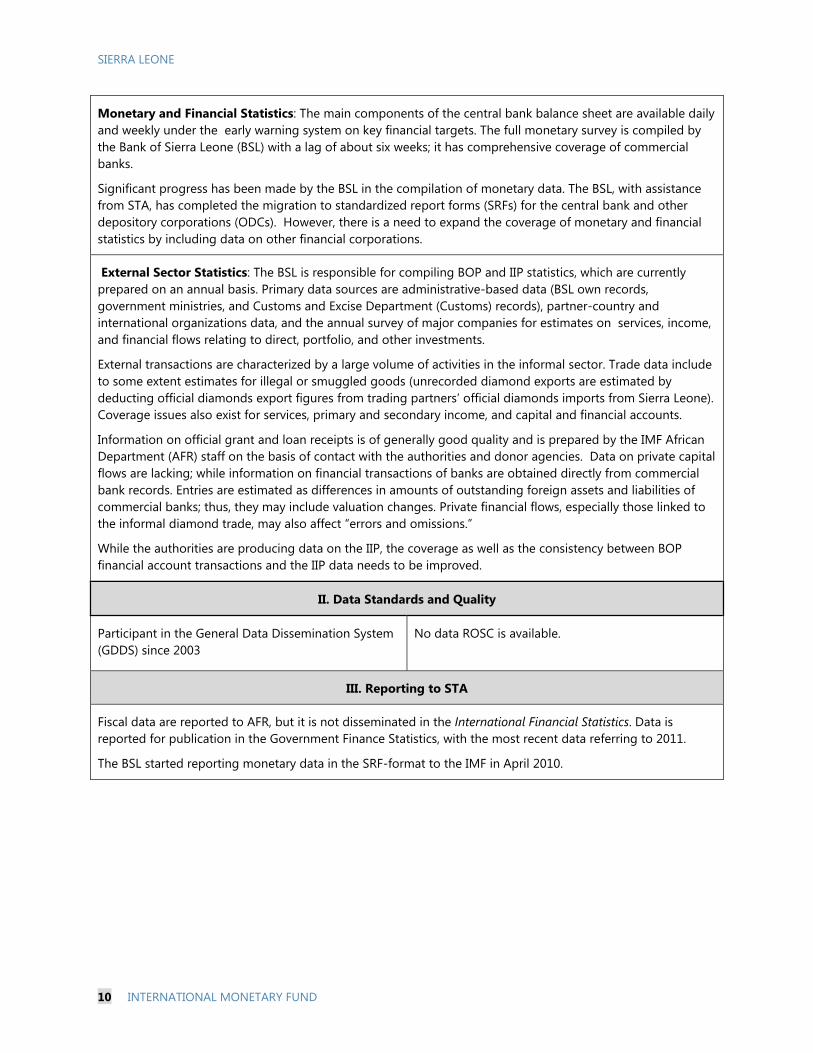
SIERRA LEONE
10 INTERNATIONAL MONETARY FUND
Monetary and Financial Statistics: The main components of the central bank balance sheet are available daily and weekly under the early warning system on key financial targets. The full monetary survey is compiled by the Bank of Sierra Leone (BSL) with a lag of about six weeks; it has comprehensive coverage of commercial banks.
Significant progress has been made by the BSL in the compilation of monetary data. The BSL, with assistance from STA, has completed the migration to standardized report forms (SRFs) for the central bank and other depository corporations (ODCs). However, there is a need to expand the coverage of monetary and financial statistics by including data on other financial corporations.
External Sector Statistics: The BSL is responsible for compiling BOP and IIP statistics, which are currently prepared on an annual basis. Primary data sources are administrative-based data (BSL own records, government ministries, and Customs and Excise Department (Customs) records), partner-country and international organizations data, and the annual survey of major companies for estimates on services, income, and financial flows relating to direct, portfolio, and other investments.
External transactions are characterized by a large volume of activities in the informal sector. Trade data include to some extent estimates for illegal or smuggled goods (unrecorded diamond exports are estimated by deducting official diamonds export figures from trading partners’ official diamonds imports from Sierra Leone). Coverage issues also exist for services, primary and secondary income, and capital and financial accounts.
Information on official grant and loan receipts is of generally good quality and is prepared by the IMF African Department (AFR) staff on the basis of contact with the authorities and donor agencies. Data on private capital flows are lacking; while information on financial transactions of banks are obtained directly from commercial bank records. Entries are estimated as differences in amounts of outstanding foreign assets and liabilities of commercial banks; thus, they may include valuation changes. Private financial flows, especially those linked to the informal diamond trade, may also affect “errors and omissions.”
While the authorities are producing data on the IIP, the coverage as well as the consistency between BOP financial account transactions and the IIP data needs to be improved.
II. Data Standards and Quality
Participant in the General Data Dissemination System (GDDS) since 2003
No data ROSC is available.
III. Reporting to STA
Fiscal data are reported to AFR, but it is not disseminated in the International Financial Statistics. Data is reported for publication in the Government Finance Statistics, with the most recent data referring to 2011.
The BSL started reporting monetary data in the SRF-format to the IMF in April 2010.

SIERRA LEONE
INTERNATIONAL MONETARY FUND 11
Sierra Leone: Table of Common Indicators Required for Surveillance September 2013
1 Daily (D), Weekly (W), Monthly (M), Quarterly (Q), Annually (A); Irregular (I); Not Available (NA). 2 Any reserve assets that are pledged or otherwise encumbered should be specified separately. Also, data should comprise short-term liabilities linked to a foreign currency but settled by other means as well as the notional values of financial derivatives to pay and to receive foreign currency, including those linked to a foreign currency but settled by other means.
3 Both market-based and officially-determined, including discount rates, money market rates, rates on treasury bills, notes and bonds. 4 Includes external gross financial asset and liability positions vis-à-vis nonresidents.
Date of latest observation
Date received Frequency of Data1
Frequency of Reporting1
Frequency of Publication1
Exchange Rates 10/03/2013 10/10/2013 W W W
International Reserve Assets and Reserve Liabilities of the Monetary Authorities2
07/31/2013 09/4/2013 M M M
Reserve/Base Money 07/31/2013 09/4/2013 M M M
Broad Money 07/31/2013 09/4/2013 M M M
Central Bank Balance Sheet 07/31/2013 09/4/2013 M M M
Consolidated Balance Sheet of the Banking System
07/31/2013 09/4/2013 M M M
Interest Rates3 07/31/2013 09/4/2013 M M M
Consumer Price Index 08/31/2013 09/30/2013 M M M
Revenue, Expenditure, Balance and Composition of Financing – General Government
07/31/2013 09/4/2013 M M M
Revenue, Expenditure, Balance and Composition of Financing– Central Government
07/31/2013 09/4/2013 M M M
Stocks of Central Government and Central Government-Guaranteed Debt
06/30/2013 09/4/2013 Q Q Q
External Current Account Balance
12/31/2012 05/08/2013 A A A
Exports and Imports of Goods and Services
12/30/2012 05/08/2013 A A A
GDP/GNP 12/30/2012 05/08/2013 A A A
Gross External Debt 12/30/2013 09/4/2013 A A A
International Investment Position4
31/12/2012 05/08/2013 A A A


SIERRA LEONE STAFF REPORT FOR THE 2013 ARTICLE IV CONSULTATION AND REQUEST FOR A THREE-YEAR ARRANGEMENT UNDER THE EXTENDED CREDIT FACILITY—DEBT SUSTAINABILITY ANALYSIS
Staff’s assessment of Sierra Leone’s debt sustainability indicates that the risk of debt distress remains moderate.1 All debt indicators are below their policy-dependent indicative thresholds under the baseline scenario.2 However, stress tests point to vulnerability to adverse shocks affecting key macroeconomic variables, particularly exports in view of Sierra Leone’s narrow export base. To contain the risk of debt distress emanating from these shocks and support long-term debt sustainability, it is critical to maintain prudent borrowing policies, sustain fiscal consolidation efforts, continue implementation of growth-enhancing structural reforms, and promote economic diversification. The authorities agreed with Staff’s assessment and policy recommendations.
1 This Debt Sustainability Analysis (DSA) is based on the Debt Sustainability Framework (DSF) for low-income countries (LICs), approved by the Executive Boards of the IMF and World Bank. It updates the previous joint DSA dated September 5, 2012; and takes into account the recent decision by the Executive Boards of the IMF and the WB to adopt a unified discount rate of 5 percent for the purpose of calculating the present value of the external debt of LICs and assessing the concessionality of individual loans. 2 Sierra Leone is a medium performer under the World Bank’s Country Policy and Institutional Assessment (CPIA) classification, with an average rating of 3.28 for 2010–12. As a medium performer, the debt and debt service thresholds under the joint IMF-WB DSF for LICs applied for Sierra Leone are: (i) 150 percent for the Present Value (PV) of debt-to-exports ratio; (ii) 40 percent for the PV of debt-to-GDP ratio; and (iii) 250 percent for the PV of debt-to-revenue ratio. The relevant thresholds for debt service are: (i) 20 percent for debt service-to-exports ratio, and (ii) 20 percent for debt service-to-revenue ratio.
Approved By Michel Lazare and Dhaneshwar Ghura (IMF) and Mark Roland Thomas and Sudarshan Gooptu (IDA)
Prepared by the staff of the International Monetary Fund and the World Bank.
October 18, 2013

SIERRA LEONE
2 INTERNATIONAL MONETARY FUND
INTRODUCTION 1. This debt sustainability analysis (DSA) updates the joint IMF-World Bank DSA presented to the Boards of both institutions in September 2012 and uses a unified discount rate of 5 percent to calculate the present value of external debt and assess concessionality.3 At that time, the DSA results showed that under the baseline scenario, all debt indicators were below their respective policy-dependent indicative thresholds throughout the projection period (2012–32). The analysis also indicated that the medium- to long-term debt outlook was vulnerable to adverse shocks to several macroeconomic variables, notably exports, prices, foreign direct investment (FDI) inflows, government revenue, and borrowing conditions. Although the long term macroeconomic outlook is somewhat better than under the September 2012 DSA, the current analysis reaches the same conclusion.
BACKGROUND AND ASSUMPTIONS 2. The stock of public and publicly guaranteed external debt4 amounted to US$0.98 billion at end-2012, and was mostly owed to multilateral creditors. It declined from 142 percent of GDP at end–2005 to 26 percent of GDP at end–2012, mainly reflecting the impact of debt relief under the Heavily Indebted Poor Countries Initiative (HIPC) and the Multilateral Debt Relief Initiative (MDRI).5 Multilateral creditors account for the largest share of public and publicly guaranteed debt; and debt to commercial creditors, estimated at US$221 million (23 percent of total external debt), consists of arrears accumulated prior to and during the civil conflict. The authorities have been making goodwill payments to some commercial creditors to avoid litigation, and they are preparing a debt-buy-back operation with support from the World Bank. A road map to fast track the process has been agreed upon and preparatory work could be initiated in 2014.
3. Domestic debt amounted to 10.8 percent of GDP at end-2012, and 29.4 percent of total public and publicly guaranteed debt. While there has been a trend decline in domestic debt in relation to GDP, the portfolio has become increasingly concentrated in treasury securities, which have increased from some 55 percent of total domestic debt end–2007 to 71 percent at end–2012. The remaining domestic debt is comprised of the Government’s overdraft facility at the Bank of Sierra Leone (BoSL), verified domestic payments arrears, and non-negotiable, non-interest bearing securities held by the BoSL. The issuance of marketable securities rose sharply in 2012 as fiscal slippages boosted borrowing needs. The new issuance was largely absorbed by commercial banks
3 The 2012 DSA can be found at: http://www.imf.org/external/pubs/cat/longres.aspx?sk=40051.0 4 Public sector refers to the Central Government, regional government, all public enterprises, and the Bank of Sierra Leone. 5 Sierra Leone has received debt relief under the MDRI Initiatives from the IMF, IDA, AfDB, EIB, IFAD, BADEA, IDB, and OPEC Fund. Under the HIPC Initiative, bilateral agreements have been signed with all participating creditors, except China, Kuwait, and Saudi Arabia.

SIERRA LEONE
INTERNATIONAL MONETARY FUND 3
and the non-bank public, which respectively held 69 percent and 20 percent of marketable securities at end–2012. The authorities have actively sought to lengthen maturities by increasing issuance of 364-day treasury bills, which has increased the weighted average maturity from around 6 months at end–2010 to 8.3 months at end–2012. Nonetheless, roughly half of the portfolio has a maturity of a half year or less, highlighting significant rollover and refinancing risks. Domestic interest payments increased from 1.4 percent of GDP in 2010 to 1.6 percent in 2012.
4. The baseline macroeconomic assumptions underlying this DSA are summarized in Box 1. The key changes from the previous DSA are as follows (Text Table 1):
Better growth prospects. Real GDP growth is expected to be higher than in the 2012 DSA, reflecting a combination of a smoother iron ore production profile, and the authorities’ efforts through their third-generation Poverty Reduction Strategy (PRS) to scale up public investment and create a better business environment.
Weaker fiscal position. The current DSA assumes a higher primary deficit, particularly in the short run, mostly because of the anticipated scaling up of infrastructure investment as the implementation of the new PRS starts in 2014.
Higher external borrowing. The current DSA assumes a higher level of external borrowing, in line with the implementation of the new PRSP. It also provides some room for nonconcessional borrowing for priority projects.
Stronger external position. In the current DSA, the external current account deficit is expected to be stronger in the medium-to-long run, mostly due to better export prospects in extractive industries and agriculture.
Real GDP Growth
Current DSA 15.2 13.3 14.0 12.4 7.7 5.2 5.3 5.4
Previous DSA 21.3 7.5 13.0 4.9 4.9 5.0 5.0 5.3
Primary fiscal deficit (in percent of GDP)
Current DSA 3.4 1.5 2.6 2.3 2.2 1.8 1.6 1.6
Previous DSA 0.6 1.1 1.4 1.6 1.6 1.6 1.7 1.3
Current account deficit (in percent of GDP)
Current DSA 36.4 16.5 8.7 6.2 5.8 5.8 5.1 4.1
Previous DSA 12.9 9.1 6.5 6.2 6.5 6.4 5.5 5.9
Foreign direct investment (in percent of GDP)
Current DSA 32.9 13.4 6.0 3.8 3.5 4.1 3.5 2.4
Previous DSA 10.6 6.5 4.5 4.5 4.4 4.2 4.2 4.1
External debt (in percent of GDP)
Current DSA 25.8 24.2 23.5 22.8 23.2 23.6 24.1 27.3
Previous DSA 25.2 25.4 23.5 23.4 23.3 23.2 23.2 23.2
Domestic debt (in percent of GDP)
Current DSA 10.8 11 10.3 9.9 9.9 9.9 9.6 9.6
Previous DSA 9.3 9.0 8.8 9.5 10.3 10.9 11.6 15.4
Sources: The Sierra Leone Authorities and IMF staff projections.
1/ All GDP ratios include iron ore activity
2/ For the current DSA, the long term covers the period 2019-33, and for the previous DSA it covers the period 2018-32.
2012 2013 2014 2015 2016 2017 2018Long Term2
Text Table 1. Selected Economic Indicators, 2012–33(In percent of GDP, unless otherwise indicated)1

SIERRA LEONE
4 INTERNATIONAL MONETARY FUND
Box 1. Baseline Macroeconomic Assumptions
The economy is expected to grow by 13.3 percent in 2013, and by an average rate of about 9 percent for 2014–18, driven by public investment scaling up in the context of the authorities’ new PRS, iron ore production and output expansion in agriculture. Over the long-term, growth would moderate to about 5.5 percent.
Inflation is projected to decline to single-digit levels starting in 2014. Assuming that monetary policy will remain prudent and fiscal consolidation efforts will be sustained, the twelve-month inflation rate would decline from 12 percent in 2012 to 9 percent in 2013; and hover around 5.5 percent over the long-term.
The overall fiscal deficit is projected to improve over the medium-to-long term, with the domestic primary deficit forecast to decline from 3.4 percent of GDP in 2012 to 1.6 percent in 2018; and to stabilize at that level during 2019–2033. Revenue and grants are projected to remain in the 15–16 percent of GDP range during the projection period, as a modest increase in revenue compensates for the projected decline in grants. Primary (non-interest) expenditure is projected to decline from 18.7 percent of GDP in 2012 to roughly 15.5 percent over the medium term, reflecting a break with past spending patterns as fiscal consolidation takes hold.
The external current account deficit is forecast to narrow over the medium-to-long-term consistent with the projected increase in iron ore and other exports, as well as favorable terms of trade. Import dynamics broadly reflect the projected overall real GDP growth.
New external loans are projected to average 2.3 percent of GDP over the medium-term and long term, consistent with the authorities’ objectives under the new PRS. The DSA also assumes some nonconcessional borrowing limited at 0.5 percent of GDP (US$30 million) per year, during the projection period to finance key priority projects for which the authorities would not be able to secure concessional funding.
Domestic debt is projected to decline from 11 percent of GDP in 2013, to 10 percent by the end of the projection period, consistent with the expected improvement in the fiscal position.
This period of fiscal consolidation does not see the emergence of broader fiscal risks.

SIERRA LEONE
INTERNATIONAL MONETARY FUND 5
EXTERNAL DEBT SUSTAINABILITY 5. The external DSA indicates that Sierra Leone is at a moderate risk of debt distress, similar to the conclusion of the previous DSA. Under the baseline scenario, all debt indicators remain well below their respective policy-dependent indicative thresholds (Figure 1 and Table 1) during the projection period. Nonetheless, as in the previous DSA, there is a rising trend in all indicators, during the period 2019–33, consistent with a steady increase in debt accumulation and a conservative assumption on future iron ore production. Debt service ratios are expected to remain significantly below their relevant policy-dependent indicative thresholds, partly reflecting the decline in Sierra Leone’s debt burden thanks to past debt relief initiatives, and the favorable impact of iron ore production on exports and government revenue.
6. Stress tests results highlight Sierra Leone’s vulnerability to adverse exogenous shocks affecting exports, exchange rate, and borrowing terms (Figure 1 and Table 2). The most extreme shock stemming from lower export growth6 shows a greater impact on debt indicators related to exports and government revenue. The PV of debt-to-exports ratio rises continuously over the medium to long term, but stabilizes at the policy-dependent threshold during 2025–33. This is consistent with the structural break in key macroeconomic variables created by the onset of large-scale iron ore production in 2012. The PV of debt-to-revenue ratio, although elevated, remains below the indicative threshold, and trends downward after an initial increase in 2014–15. Since revenue performance is projected to strengthen in the long run, the increase in vulnerability on revenue compared with the baseline scenario is triggered by the impact of the shock on borrowing. Compared with the 2012 DSA, the improvement in Sierra Leone’s ranking to medium performer, and the use of the new discount rate of 5 percent recently adopted by the IMF and World Bank Executive Boards also contributes to a better long-term debt outlook. Under the alternative scenarios involving a one-time 30 percent nominal depreciation in 2014, additional external borrowing on less favorable borrowing terms,7 or a combination of the abovementioned shocks, all debt indicators increase continuously through 2033 while remaining under their indicative thresholds.
PUBLIC SECTOR DEBT SUSTAINABILITY 7. DSA results for total public sector debt indicate that there are no significant vulnerabilities linked to domestic debt (Figure 2 and Table 3). Under the baseline scenario, the PV of public debt-to-GDP and to revenue ratios are both expected to modestly increase in the long run, consistent with results from the external DSA. Stress tests point to vulnerability to shocks affecting economic growth (See Figure 2 and Table 4): under an alternative scenario assuming a real GDP growth shock,8 both the PV of public debt-to-GDP ratio and the PV of public debt-to-revenue ratio
6 The shock is defined as the exports value growth at historical average minus one standard deviation in 2014–15. 7 This scenario assumes that the interest rate on new borrowing is 200 basis points higher than in the baseline scenario, while the grace period and the maturity are the same as in the baseline scenario. 8 This scenario assumes that real GDP growth is at baseline minus one standard deviation in 2014–15.

SIERRA LEONE
6 INTERNATIONAL MONETARY FUND
would increase continuously through 2033 with the former reaching 50 percent in 2033 (27 percent under the baseline scenario) and the latter rising to 309 percent (171 percent under the baseline scenario).
CONCLUSIONS 8. Sierra Leone remains at a moderate risk of debt distress. This assessment is similar to that reached under the September 2012 DSA. In the baseline scenario, all debt indicators remain below their respective policy-dependent indicative thresholds throughout the projection period. However, results for alternative scenarios show that, although debt indicators remain below their indicative thresholds during the projection period, the long-term debt outlook is vulnerable to various shocks that could conceivably lead to a breach of thresholds, particularly for exports. An additional source of vulnerability is the short-term maturity structure of public domestic debt, which creates roll-over risks. To support long-term debt sustainability it will be important for the authorities to enhance revenue collection, particularly in the non-mineral economy, strengthen expenditure and debt management, implement growth-enhancing policies, promote export diversification, and maintain prudent borrowing policies.
9. The authorities agreed with staff’s assessment, and reiterated the call for more flexibility in borrowing conditions to facilitate access to nonconcessional borrowing for priority projects.

SIERRA LEONE
INTERNATIONAL MONETARY FUND 7
Sources: Country authorities; and staff estimates and projections.1/ The most extreme stress test is the test that yields the highest ratio in 2023. In figure b. it corresponds to a Exports shock; in c. to a Exports shock; in d. to a Exports shock; in e. to a Exports shock and in figure f. to a One-time depreciation shock
0
5
10
15
20
25
2013 2018 2023 2028 2033
Baseline Historical scenario Most extreme shock 1/ Threshold
f.Debt service-to-revenue ratio
46
47
48
49
50
51
52
53
0.00.51.01.52.02.53.03.54.04.55.0
2013 2018 2023 2028 2033Rate of Debt Accumulation
Grant-equivalent financing (% of GDP)
Grant element of new borrowing (% right scale)
a. Debt Accumulation
0
5
10
15
20
25
30
35
40
45
2013 2018 2023 2028 2033
b.PV of debt-to GDP ratio
0
20
40
60
80
100
120
140
160
2013 2018 2023 2028 2033
c.PV of debt-to-exports ratio
0
50
100
150
200
250
300
2013 2018 2023 2028 2033
d.PV of debt-to-revenue ratio
0
5
10
15
20
25
2013 2018 2023 2028 2033
e.Debt service-to-exports ratio
Figure 1. Sierra Leone: Indicators of Public and Publicly Guaranteed External Debt Under Alternative Scenarios, 2013–331

SIERRA LEONE
8 INTERNATIONAL MONETARY FUND
Sources: Country authorities; and staff estimates and projections.1/ The most extreme stress test is the test that yields the highest ratio in 2023. 2/ Revenues are defined inclusive of grants.
0
50
100
150
200
250
300
350
2013 2015 2017 2019 2021 2023 2025 2027 2029 2031 2033
PV of Debt-to-Revenue Ratio 2/
0
10
20
30
40
50
60
2013 2015 2017 2019 2021 2023 2025 2027 2029 2031 2033
Baseline Fix Primary Balance Most extreme shock Growth Historical scenario
PV of Debt-to-GDP Ratio
0
2
4
6
8
10
12
14
16
18
20
2013 2015 2017 2019 2021 2023 2025 2027 2029 2031 2033
Debt Service-to-Revenue Ratio 2/
Figure 2. Sierra Leone: Indicators of Public Debt Under Alternative Scenarios, 2013–331

SIERRA LEON
E
INTERN
ATION
AL MO
NETARY FU
ND
9
Historical 6/ Standard 6/
Average Deviation 2013-2018 2019-20332010 2011 2012 2013 2014 2015 2016 2017 2018 Average 2023 2033 Average
External debt (nominal) 1/ 32.0 32.8 25.8 24.2 23.5 22.8 23.2 23.6 24.1 26.4 28.9of which: public and publicly guaranteed (PPG) 32.0 32.8 25.8 24.2 23.5 22.8 23.2 23.6 24.1 26.4 28.9
Change in external debt -0.1 0.7 -6.9 -1.7 -0.7 -0.6 0.3 0.5 0.5 0.4 0.1Identified net debt-creating flows 4.4 2.3 -3.7 0.4 -0.1 0.0 0.9 0.7 0.6 0.7 0.3
Non-interest current account deficit 19.5 44.7 36.4 13.1 15.5 16.5 8.7 6.2 5.8 5.8 5.1 4.7 3.0 4.1Deficit in balance of goods and services 25.9 52.1 38.8 19.8 7.8 1.6 -1.8 -1.9 0.4 5.2 7.8
Exports 16.4 18.6 29.0 36.3 39.8 42.0 42.8 41.9 39.4 33.1 26.6Imports 42.3 70.7 67.8 56.1 47.6 43.6 41.1 40.0 39.8 38.4 34.4
Net current transfers (negative = inflow) -8.2 -8.5 -5.8 -7.1 2.3 -5.2 -4.9 -4.8 -4.8 -4.8 -4.8 -4.8 -5.0 -4.8of which: official -6.3 -3.8 -1.8 -1.3 -1.1 -1.1 -1.1 -1.2 -1.2 -1.3 -1.7
Other current account flows (negative = net inflow) 1.8 1.0 3.4 1.8 5.9 9.4 12.4 12.4 9.4 4.2 0.2Net FDI (negative = inflow) -13.7 -38.7 -32.9 -10.9 13.7 -13.4 -6.0 -3.8 -3.5 -4.1 -3.5 -2.9 -1.5 -2.4Endogenous debt dynamics 2/ -1.4 -3.7 -7.2 -2.7 -2.8 -2.4 -1.4 -1.0 -1.0 -1.1 -1.2
Contribution from nominal interest rate 0.2 0.2 0.2 0.1 0.1 0.2 0.2 0.2 0.2 0.2 0.3Contribution from real GDP growth -1.6 -1.7 -3.8 -2.8 -2.9 -2.5 -1.6 -1.1 -1.2 -1.3 -1.6Contribution from price and exchange rate changes 0.1 -2.2 -3.6 … … … … … … … …
Residual (3-4) 3/ -4.5 -1.6 -3.2 -2.1 -0.6 -0.6 -0.5 -0.2 -0.1 -0.3 -0.2of which: exceptional financing 0.0 0.0 0.0 0.0 0.0 0.0 0.0 0.0 0.0 0.0 0.0
PV of external debt 4/ ... ... 14.5 13.6 13.2 12.8 12.9 13.2 13.4 14.9 16.7In percent of exports ... ... 50.0 37.5 33.1 30.4 30.2 31.4 34.0 44.9 62.8
PV of PPG external debt ... ... 14.5 13.6 13.2 12.8 12.9 13.2 13.4 14.9 16.7In percent of exports ... ... 50.0 37.5 33.1 30.4 30.2 31.4 34.0 44.9 62.8In percent of government revenues ... ... 127.3 126.0 126.2 117.9 117.1 112.5 110.8 119.3 127.1
Debt service-to-exports ratio (in percent) 3.3 3.3 2.3 2.0 2.0 2.0 1.9 1.9 1.9 2.1 3.2PPG debt service-to-exports ratio (in percent) 3.3 3.3 2.3 2.0 2.0 2.0 1.9 1.9 1.9 2.1 3.2PPG debt service-to-revenue ratio (in percent) 5.4 5.3 6.0 6.7 7.8 7.8 7.5 6.7 6.2 5.7 6.5Total gross financing need (Billions of U.S. dollars) 0.2 0.2 0.2 0.2 0.2 0.2 0.2 0.2 0.2 0.3 0.5Non-interest current account deficit that stabilizes debt ratio 19.6 43.9 43.4 18.1 9.4 6.8 5.5 5.3 4.6 4.3 2.9
Key macroeconomic assumptions
Real GDP growth (in percent) 5.3 6.0 15.2 6.8 3.5 13.3 14.0 12.4 7.7 5.2 5.3 9.7 5.3 5.8 5.4GDP deflator in US dollar terms (change in percent) -0.3 7.3 12.2 4.9 6.1 7.3 2.6 2.4 1.9 1.8 1.7 3.0 1.3 1.4 1.3Effective interest rate (percent) 5/ 0.5 0.7 0.8 0.9 0.4 0.6 0.7 0.7 0.8 0.7 0.8 0.7 1.0 1.2 1.0Growth of exports of G&S (US dollar terms, in percent) 30.6 28.9 101.4 23.7 30.7 52.0 28.5 21.4 11.9 4.7 0.9 19.9 3.4 6.0 4.1Growth of imports of G&S (US dollar terms, in percent) 90.2 90.1 23.8 26.5 35.7 0.6 -0.7 5.5 3.3 4.3 6.8 3.3 5.5 6.7 5.8Grant element of new public sector borrowing (in percent) ... ... ... ... ... 49.8 48.7 48.6 48.7 51.9 51.8 49.9 51.5 51.1 51.3Government revenues (excluding grants, in percent of GDP) 9.9 11.5 11.4 10.8 10.4 10.8 11.1 11.7 12.1 12.5 13.1 12.7Aid flows (in Billions of US dollars) 7/ 0.2 0.3 0.3 0.2 0.3 0.3 0.3 0.3 0.4 0.5 1.0
of which: Grants 0.1 0.2 0.1 0.1 0.1 0.2 0.2 0.2 0.2 0.3 0.5of which: Concessional loans 0.1 0.1 0.1 0.1 0.1 0.1 0.1 0.2 0.2 0.2 0.4
Grant-equivalent financing (in percent of GDP) 8/ ... ... ... 4.6 4.3 4.1 3.9 3.8 3.8 3.7 3.8 3.8Grant-equivalent financing (in percent of external financing) 8/ ... ... ... 75.3 70.6 71.8 71.6 75.2 75.2 75.5 75.5 75.4
Memorandum items:Nominal GDP (Billions of US dollars) 2.6 2.9 3.8 4.6 5.4 6.2 6.8 7.3 7.8 10.7 21.1Nominal dollar GDP growth 5.1 13.8 29.2 21.6 17.0 15.1 9.7 7.2 7.1 12.9 6.7 7.3 6.8PV of PPG external debt (in Billions of US dollars) 0.6 0.6 0.7 0.8 0.9 0.9 1.0 1.6 3.5(PVt-PVt-1)/GDPt-1 (in percent) 1.7 1.8 1.5 1.4 1.1 1.2 1.5 1.2 1.2 1.3Gross workers' remittances (Billions of US dollars) 0.0 0.0 0.0 0.0 0.0 0.0 0.0 0.0 0.0 0.0 0.1PV of PPG external debt (in percent of GDP + remittances) ... ... 14.3 13.5 13.1 12.7 12.9 13.1 13.3 14.8 16.6PV of PPG external debt (in percent of exports + remittances) ... ... 48.2 36.6 32.5 29.9 29.8 31.0 33.5 44.2 62.1Debt service of PPG external debt (in percent of exports + remittances) ... ... 2.3 1.9 2.0 2.0 1.9 1.8 1.9 2.1 3.2
Sources: Country authorities; and staff estimates and projections.
1/ Includes both public and private sector external debt.2/ Derived as [r - g - ρ(1+g)]/(1+g+ρ+gρ) times previous period debt ratio, with r = nominal interest rate; g = real GDP growth rate, and ρ = growth rate of GDP deflator in U.S. dollar terms. 3/ Includes exceptional financing (i.e., changes in arrears and debt relief); changes in gross foreign assets; and valuation adjustments. For projections also includes contribution from price and exchange rate changes.4/ Assumes that PV of private sector debt is equivalent to its face value.5/ Current-year interest payments divided by previous period debt stock. 6/ Historical averages and standard deviations are generally derived over the past 10 years, subject to data availability. 7/ Defined as grants, concessional loans, and debt relief.8/ Grant-equivalent financing includes grants provided directly to the government and through new borrowing (difference between the face value and the PV of new debt).
Actual Projections
Table 1. Sierra Leone: External Debt Sustainability Framework, Baseline Scenario, 2010–331
(In percent of GDP, unless otherwise indicated)

SIERRA LEONE
10 INTERNATIONAL MONETARY FUND
2013 2014 2015 2016 2017 2018 2023 2033
Baseline 14 13 13 13 13 13 15 17
A. Alternative Scenarios
A1. Key variables at their historical averages in 2013-2033 1/ 14 13 13 13 13 13 12 14A2. New public sector loans on less favorable terms in 2013-2033 2 14 14 14 15 16 17 21 27
B. Bound Tests
B1. Real GDP growth at historical average minus one standard deviation in 2014-2015 14 14 15 15 16 16 18 20B2. Export value growth at historical average minus one standard deviation in 2014-2015 3/ 14 19 27 26 26 26 26 21B3. US dollar GDP deflator at historical average minus one standard deviation in 2014-2015 14 13 14 14 14 14 16 18B4. Net non-debt creating flows at historical average minus one standard deviation in 2014-2015 4/ 14 17 20 20 20 20 20 19B5. Combination of B1-B4 using one-half standard deviation shocks 14 19 25 25 25 25 26 23B6. One-time 30 percent nominal depreciation relative to the baseline in 2014 5/ 14 18 18 18 18 19 21 23
Baseline 38 33 30 30 31 34 45 63
A. Alternative Scenarios
A1. Key variables at their historical averages in 2013-2033 1/ 38 33 31 30 31 33 37 52A2. New public sector loans on less favorable terms in 2013-2033 2 38 35 34 35 38 43 64 102
B. Bound Tests
B1. Real GDP growth at historical average minus one standard deviation in 2014-2015 38 33 30 30 31 34 44 62B2. Export value growth at historical average minus one standard deviation in 2014-2015 3/ 38 64 116 111 113 119 142 145B3. US dollar GDP deflator at historical average minus one standard deviation in 2014-2015 38 33 30 30 31 34 44 62B4. Net non-debt creating flows at historical average minus one standard deviation in 2014-2015 4/ 38 44 48 46 47 50 62 71B5. Combination of B1-B4 using one-half standard deviation shocks 38 51 68 66 67 72 87 98B6. One-time 30 percent nominal depreciation relative to the baseline in 2014 5/ 38 33 30 30 31 34 44 62
Baseline 126 126 118 117 113 111 119 127
A. Alternative Scenarios
A1. Key variables at their historical averages in 2013-2033 1/ 126 127 121 117 110 107 99 105A2. New public sector loans on less favorable terms in 2013-2033 2 126 133 131 136 136 139 170 207
B. Bound Tests
B1. Real GDP growth at historical average minus one standard deviation in 2014-2015 126 137 139 138 133 131 141 150B2. Export value growth at historical average minus one standard deviation in 2014-2015 3/ 126 177 250 239 224 216 209 163B3. US dollar GDP deflator at historical average minus one standard deviation in 2014-2015 126 129 125 124 119 118 127 135B4. Net non-debt creating flows at historical average minus one standard deviation in 2014-2015 4/ 126 167 185 179 169 164 164 144B5. Combination of B1-B4 using one-half standard deviation shocks 126 178 234 227 214 207 205 175B6. One-time 30 percent nominal depreciation relative to the baseline in 2014 5/ 126 175 164 163 157 154 166 177
PV of debt-to-exports ratio
PV of debt-to-revenue ratio
PV of debt-to GDP ratio
Projections
Table 2. Sierra Leone: Sensitivity Analysis for Key Indicators of Public and Publicly Guaranteed External Debt, 2013–33
(In percent)

SIERRA LEONE
INTERNATIONAL MONETARY FUND 11
Baseline 2 2 2 2 2 2 2 3
A. Alternative Scenarios
A1. Key variables at their historical averages in 2013-2033 1/ 2 2 2 2 2 2 2 2A2. New public sector loans on less favorable terms in 2013-2033 2 2 2 2 2 2 2 3 5
B. Bound Tests
B1. Real GDP growth at historical average minus one standard deviation in 2014-2015 2 2 2 2 2 2 2 3B2. Export value growth at historical average minus one standard deviation in 2014-2015 3/ 2 3 4 5 5 5 5 9B3. US dollar GDP deflator at historical average minus one standard deviation in 2014-2015 2 2 2 2 2 2 2 3B4. Net non-debt creating flows at historical average minus one standard deviation in 2014-2015 4/ 2 2 2 2 2 2 2 4B5. Combination of B1-B4 using one-half standard deviation shocks 2 2 3 3 3 3 3 6B6. One-time 30 percent nominal depreciation relative to the baseline in 2014 5/ 2 2 2 2 2 2 2 3
Baseline 7 8 8 8 7 6 6 6
A. Alternative Scenarios
A1. Key variables at their historical averages in 2013-2033 1/ 7 8 8 8 7 6 4 4A2. New public sector loans on less favorable terms in 2013-2033 2 7 8 8 8 8 8 8 11
B. Bound Tests
B1. Real GDP growth at historical average minus one standard deviation in 2014-2015 7 9 9 9 8 7 7 8B2. Export value growth at historical average minus one standard deviation in 2014-2015 3/ 7 8 9 10 9 8 7 10B3. US dollar GDP deflator at historical average minus one standard deviation in 2014-2015 7 8 8 8 7 7 6 7B4. Net non-debt creating flows at historical average minus one standard deviation in 2014-2015 4/ 7 8 9 9 8 7 7 8B5. Combination of B1-B4 using one-half standard deviation shocks 7 9 10 11 10 9 8 10B6. One-time 30 percent nominal depreciation relative to the baseline in 2014 5/ 7 11 11 11 9 9 8 9
Memorandum item:Grant element assumed on residual financing (i.e., financing required above baseline) 6/ 49 49 49 49 49 49 49 49
Sources: Country authorities; and staff estimates and projections.
1/ Variables include real GDP growth, growth of GDP deflator (in U.S. dollar terms), non-interest current account in percent of GDP, and non-debt creating flows. 2/ Assumes that the interest rate on new borrowing is by 2 percentage points higher than in the baseline, while grace and maturity periods same as in the baseline.3/ Exports values are assumed to remain permanently at the lower level, but the current account as a share of GDP is assumed to return to its baseline level after the shock (implicitly assuming an offsetting adjustment in import levels). 4/ Includes official and private transfers and FDI.5/ Depreciation is defined as percentage decline in dollar/local currency rate, such that it never exceeds 100 percent.6/ Applies to all stress scenarios except for A2 (less favorable financing) in which the terms on all new financing are as specified in footnote 2.
Debt service-to-revenue ratio
Debt service-to-exports ratio
Table 2. Sierra Leone: Sensitivity Analysis for Key Indicators of Public and Publicly Guaranteed External Debt, 2013–33 (concluded)
(In percent)

Estimate
2010 2011 2012 Average5/ Standard
Deviation
5/
2013 2014 2015 2016 2017 20182013-18 Average 2023 2033
2019-33 Average
Public sector debt 1/ 46.8 44.4 36.7 35.2 33.8 32.8 33.1 33.5 33.7 35.9 39.0of which: foreign-currency denominated 32.3 33.0 25.9 24.2 23.5 22.8 23.2 23.6 24.1 26.4 28.9
Change in public sector debt -1.2 -2.5 -7.7 -1.5 -1.4 -1.0 0.4 0.4 0.2 0.4 0.1Identified debt-creating flows -2.0 -4.3 -5.9 -3.3 -1.8 -1.2 0.4 0.7 0.4 0.5 0.1
Primary deficit 3.5 2.6 3.4 -1.3 7.5 1.5 2.6 2.3 2.2 1.8 1.6 2.0 1.7 1.6 1.6Revenue and grants 15.2 17.0 15.2 13.9 13.0 13.4 13.5 14.1 14.5 14.9 15.7
of which: grants 5.3 5.6 3.8 3.1 2.6 2.6 2.4 2.4 2.4 2.4 2.5Primary (noninterest) expenditure 18.7 19.6 18.7 15.4 15.6 15.7 15.7 16.0 16.1 16.6 17.2
Automatic debt dynamics -5.3 -6.1 -8.5 -4.6 -4.1 -3.4 -1.9 -1.2 -1.2 -1.2 -1.4Contribution from interest rate/growth differential -3.5 -3.3 -5.6 -3.9 -3.9 -3.2 -1.9 -1.2 -1.3 -0.8 -0.9
of which: contribution from average real interest rate -1.0 -0.7 0.2 0.5 0.4 0.5 0.5 0.4 0.4 0.9 1.2of which: contribution from real GDP growth -2.4 -2.6 -5.8 -4.3 -4.3 -3.7 -2.3 -1.6 -1.7 -1.8 -2.1
Contribution from real exchange rate depreciation -1.8 -2.8 -2.9 -0.8 -0.2 -0.1 0.0 0.0 0.1 ... ...Other identified debt-creating flows -0.2 -0.7 -0.8 -0.2 -0.3 -0.1 0.0 0.0 0.0 0.0 0.0
Privatization receipts (negative) 0.0 -0.3 -0.1 -0.1 -0.2 0.0 0.0 0.0 0.0 0.0 0.0Recognition of implicit or contingent liabilities 0.0 0.0 0.0 0.0 0.0 0.0 0.0 0.0 0.0 0.0 0.0Debt relief (HIPC and other) -0.2 -0.5 -0.8 -0.2 -0.1 -0.1 0.0 0.0 0.0 0.0 0.0Other (specify, e.g. bank recapitalization) 0.0 0.0 0.0 0.0 0.0 0.0 0.0 0.0 0.0 0.0 0.0
Residual, including asset changes 0.8 1.8 -1.8 1.8 0.5 0.2 0.0 -0.3 -0.2 -0.1 0.0
Other Sustainability IndicatorsPV of public sector debt ... ... 25.3 24.6 23.5 22.7 22.9 23.0 23.0 24.3 26.7
of which: foreign-currency denominated ... ... 14.5 13.6 13.2 12.8 12.9 13.2 13.4 14.9 16.7of which: external ... ... 14.5 13.6 13.2 12.8 12.9 13.2 13.4 14.9 16.7
PV of contingent liabilities (not included in public sector debt) ... ... ... ... ... ... ... ... ... ... ...Gross financing need 2/ 5.4 5.0 5.7 3.7 4.6 4.4 4.3 3.8 3.4 3.5 3.5PV of public sector debt-to-revenue and grants ratio (in percent) … … 166.4 177.2 180.4 169.4 169.6 162.9 158.0 163.3 170.6PV of public sector debt-to-revenue ratio (in percent) … … 222.6 228.0 225.1 209.5 207.1 196.9 189.8 195.0 203.7
of which: external 3/ … … 127.3 126.0 126.2 117.9 117.1 112.5 110.8 119.3 127.1Debt service-to-revenue and grants ratio (in percent) 4/ 12.6 14.0 14.7 15.6 15.6 15.5 14.9 13.8 12.6 12.0 12.7Debt service-to-revenue ratio (in percent) 4/ 19.4 20.8 19.6 20.1 19.4 19.2 18.1 16.6 15.2 14.3 15.2Primary deficit that stabilizes the debt-to-GDP ratio 4.7 5.1 11.1 3.1 4.0 3.3 1.9 1.4 1.4 1.3 1.4
Key macroeconomic and fiscal assumptionsReal GDP growth (in percent) 5.3 6.0 15.2 6.8 3.5 13.3 14.0 12.4 7.7 5.2 5.3 9.7 5.3 5.8 5.4Average nominal interest rate on forex debt (in percent) 0.5 0.7 0.8 1.1 0.5 0.6 0.7 0.7 0.8 0.7 0.8 0.7 1.0 1.2 1.0Average real interest rate on domestic debt (in percent) -5.3 -1.9 4.9 -1.9 3.5 6.7 6.5 7.8 7.9 7.6 7.1 7.3 7.8 7.9 7.9Real exchange rate depreciation (in percent, + indicates depreciation) -5.8 -9.2 -10.1 -2.4 8.9 -3.4 ... ... ... ... ... ... ... ... ...Inflation rate (GDP deflator, in percent) 17.2 17.3 12.1 12.6 3.7 9.1 6.5 5.9 5.1 4.9 4.7 6.0 4.4 4.5 4.4Growth of real primary spending (deflated by GDP deflator, in percent) 0.2 0.1 0.1 0.1 0.1 -0.1 0.2 0.1 0.1 0.1 0.1 0.1 0.1 0.1 0.1Grant element of new external borrowing (in percent) ... ... ... … … 49.8 48.7 48.6 48.7 51.9 51.8 49.9 51.5 51.1 ...
Sources: Country authorities; and staff estimates and projections.1/ Public sector comprises central government, regional government, and the BoSL. Debt is calculated on gross terms.2/ Gross financing need is defined as the primary deficit plus debt service plus the stock of short-term debt at the end of the last period. 3/ Revenues excluding grants.4/ Debt service is defined as the sum of interest and amortization of medium and long-term debt.5/ Historical averages and standard deviations are generally derived over the past 10 years, subject to data availability.
Actual Projections
Table 3. Sierra Leone: Public Sector Debt Sustainability Framework, Baseline Scenario, 2010–33(In percent of GDP, unless otherwise indicated)
SIERRA LEON
E
12 IN
TERNATIO
NAL M
ON
ETARY FUN
D

SIERRA LEONE
INTERNATIONAL MONETARY FUND 13
2013 2014 2015 2016 2017 2018 2023 2033
Baseline 25 24 23 23 23 23 24 27
A. Alternative scenarios
A1. Real GDP growth and primary balance are at historical averages 25 23 22 20 19 17 11 4A2. Primary balance is unchanged from 2013 25 23 22 22 22 22 23 25A3. Permanently lower GDP growth 1/ 25 24 23 24 24 24 28 39
B. Bound tests
B1. Real GDP growth is at historical average minus one standard deviations in 2014-2015 25 26 29 30 31 32 39 50B2. Primary balance is at historical average minus one standard deviations in 2014-2015 25 25 26 26 26 26 27 28B3. Combination of B1-B2 using one half standard deviation shocks 25 25 26 27 28 29 35 45B4. One-time 30 percent real depreciation in 2014 25 28 26 25 25 25 24 26B5. 10 percent of GDP increase in other debt-creating flows in 2014 25 28 27 27 27 27 28 29
Baseline 177 180 169 170 163 158 163 171
A. Alternative scenarios
A1. Real GDP growth and primary balance are at historical averages 177 175 158 148 131 117 75 29A2. Primary balance is unchanged from 2013 177 176 163 161 154 150 154 163A3. Permanently lower GDP growth 1/ 177 182 172 174 169 166 188 244
B. Bound tests
B1. Real GDP growth is at historical average minus one standard deviations in 2014-2015 177 199 207 215 214 215 254 309B2. Primary balance is at historical average minus one standard deviations in 2014-2015 177 194 195 194 185 179 182 181B3. Combination of B1-B2 using one half standard deviation shocks 177 191 189 196 194 195 229 278B4. One-time 30 percent real depreciation in 2014 177 216 195 189 177 168 164 166B5. 10 percent of GDP increase in other debt-creating flows in 2014 177 218 202 200 191 185 187 184
Baseline 16 16 16 15 14 13 12 13
A. Alternative scenarios
A1. Real GDP growth and primary balance are at historical averages 16 16 17 16 14 12 10 7A2. Primary balance is unchanged from 2013 16 16 15 15 14 12 12 12A3. Permanently lower GDP growth 1/ 16 16 16 15 14 13 13 16
B. Bound tests
B1. Real GDP growth is at historical average minus one standard deviations in 2014-2015 16 17 18 18 16 15 15 19B2. Primary balance is at historical average minus one standard deviations in 2014-2015 16 16 16 16 14 13 12 13B3. Combination of B1-B2 using one half standard deviation shocks 16 17 17 17 16 15 14 17B4. One-time 30 percent real depreciation in 2014 16 17 18 18 16 15 14 16B5. 10 percent of GDP increase in other debt-creating flows in 2014 16 16 16 16 14 13 12 14
Sources: Country authorities; and staff estimates and projections.1/ Assumes that real GDP growth is at baseline minus one standard deviation divided by the square root of the length of the projection period.2/ Revenues are defined inclusive of grants.
PV of Debt-to-GDP Ratio
Projections
PV of Debt-to-Revenue Ratio 2/
Debt Service-to-Revenue Ratio 2/
Table 4. Sierra Leone: Sensitivity Analysis for Key Indicators of Public Debt, 2013–33

Press Release No. 13/410 FOR IMMEDIATE RELEASE October 21, 2013 IMF Executive Board Approves Three-Year, US$95.9 Million ECF Arrangement for
Sierra-Leone
The Executive Board of the International Monetary Fund (IMF) today approved a three-year arrangement under the Extended Credit Facility (ECF) for Sierra Leone in an amount equivalent to SDR 62.22 million (about US$95.9 million). The overall amount of the program represents 60 percent of Sierra Leone’s quota in the IMF and enables the immediate disbursement of SDR 8.89 million (about US$13.7 million). The ECF-supported program seeks to underpin the government’s economic program and aims to facilitate high-quality public investment and growth enhancing reforms in the context of macroeconomic stability.
The Executive Board also concluded the 2013 Article IV consultations with Sierra Leone, which will be detailed in a separate press release in due course.
Following the Executive Board’s discussion, Mr. Min Zhu, Deputy Managing Director and Acting Chair, made the following statement.
“Sierra Leone has achieved strong macroeconomic gains in recent years. Bolstered by iron production, economic growth has been robust, while inflation has been falling on the back of a tight monetary stance, a stable exchange rate, and lower food prices. The medium-term outlook is favorable, with policy focused on achieving strong broad-based growth, further disinflation, and an improved external position.
“Continued efforts will be needed to strengthen policy implementation, particularly in the fiscal area. The authorities’ plans to strengthen public financial management appropriately aim to enhance revenue mobilization, improve spending controls, and reduce domestic debt. Key revenue components in their fiscal strategy include improvements in tax administration, reductions in tax exemptions, and the adoption of a comprehensive fiscal regime for the natural resources sector. Timely implementation of these reforms will be critical to buttress macroeconomic stability and the credibility of fiscal policy.
“The new Fund-supported program aims to underpin the authorities’ development and poverty-reduction strategy. This strategy aims at entrenching macroeconomic stability and promoting inclusive growth through further infrastructure investments and economic diversification. The program calls for continued fiscal consolidation, strong monetary and exchange rate policies to support the single-digit inflation target, prudent borrowing policies, and growth-enhancing structural reforms.”
ANNEX
International Monetary Fund Washington, D.C. 20431 USA

Recent economic developments
Sierra Leone has made significant progress in the implementation of the ECF-supported program that was cancelled prior to its expiration at end-June. Reform measures and policies put in place have helped improve macroeconomic stability, advance social policies, and enhance prospects for broad and inclusive growth.
Economic growth accelerated and inflation declined in 2012. Real GDP growth is estimated at 15.2 percent, reflecting increased iron ore production, from 137,000 tons in 2011 to 6.6 million tons in 2012. Non-iron ore growth is estimated at 5.3 percent (5.8 percent in 2011), driven by output expansion in agriculture, manufacturing, construction, and services. In agriculture growth has been sustained since 2010 with the introduction of the government and donor-supported Small Holder Commercialization Program (SHCP).
Good progress has been made in containing consumer price inflation, and price pressures have eased. Inflation declined from 16.9 percent at end-2011 to 12 percent at end-2012, and 9.1 percent at end-September 2013. A significant increase in foreign direct investment flows during 2011 and 2012 has led to a surge in investment-driven imports, and helped finance the resultant external current account deficit. Revenue collection reached 12.2 percent of non-iron ore GDP compared with 11.5 percent in 2011 reflecting higher than anticipated taxes from the extractive sector that helped compensate for weak performance in other tax categories.
In spite of the progress noted, the country faces important challenges. Poverty, and unemployment are still high, and access to public and social services is limited. In addition, growth prospects are hindered by numerous obstacles, including insufficient power supply and road networks, and limited access to financial services, particularly for the small and medium-sized enterprises (SME).
Program and key medium term policy objectives
Although significant progress has been made since the end of the civil conflict toward social stability and a sustainable macroeconomic position, Sierra Leone needs more durable poverty reduction and growth efforts. The government intends to address remaining challenges and accelerate Sierra Leone’s development through steadfast implementation of the new Poverty Reduction Strategy, the Agenda for Prosperity (AfP). The ECF-supported program seeks to underpin this effort by facilitating high quality public investment and growth enhancing reforms in a stable macroeconomic environment.
The medium-term objectives are to: (i) achieve a real GDP growth (excluding iron ore) of 7 percent by 2017; (ii) reduce inflation from 12 percent in 2012 to about 5.4 percent by 2017; and (iii) improve gross reserve coverage to about 4 months of non iron-ore related imports by the end of the program period.
Economic growth will be driven by continued public investment scaling up, increased productivity, notably in agriculture, and sustained activity in construction and services. Non-iron ore activity will also benefit from upstream activity in iron ore mining where production (under phase I of the largest mine) is expected to increase through 2015, and level off starting in 2016. Inflation is projected to decline from 9 percent in 2013 to 5.4 percent in 2017, on account of continued prudent monetary and exchange rate policies. In addition, monetary policy would be adequately calibrated to contain

inflationary pressures, and macro-prudential measures would be geared towards a healthy expansion of private credit.
The government’s medium-term fiscal strategy aims to strengthen revenue collection, improve expenditure management, and reduce domestic debt. Revenue performance will be supported by continuing sustained economic activity in the non-iron ore economy, and the projected increase in royalties from the mineral sector. The government will continue implementing measures needed to improve public financial management, notably to enhance expenditure commitment monitoring and capital expenditure management.
Monetary policy will continue to target price stability over the medium term. The Bank of Sierra Leone recognizes the need to build up foreign exchange reserves in light of the economy’s vulnerability to external shocks. It will also actively pursue initiatives aimed at strengthening the financial system.
The government intends to accelerate implementation of structural reforms to support private sector development and enhance growth prospects in the non-mineral economy. In this regard, the government plans to rehabilitate the Bumbuna hydroelectric power plant and thermal power generators to increase energy supply; complete the teacher biometric verification exercise and the civil service remuneration survey; and implement measures to strengthen the Public Service Commission. It also intends to establish an SME Fund to finance new centers for training and skills development, including business management, accounting, and project design and introduce a one-stop window for imports clearance.

Press Release No. 13/450 FOR IMMEDIATE RELEASE November 14, 2013
IMF Executive Board Concludes the 2013 Article IV Consultation with Sierra Leone
On October 21, 2013, the Executive Board of the International Monetary Fund (IMF) concluded the Article IV consultation with Sierra Leone,1 and approved a three–year arrangement under the Extended Credit Facility (ECF) in support of the authorities’ economic and financial program for 2013–2016 (see Press Release No. 13/410).
Sierra Leone has made significant progress in macroeconomic stabilization over the last five years. Real Gross Domestic Product growth averaged some 7 percent, driven by output expansion in agriculture, mining, and services; as well as the scaling-up of infrastructure investment. Nonetheless, important impediments to broad-based growth remain, including large infrastructure gaps, insufficient energy supply, and limited access to safe water and sanitation.
To address the country’s remaining challenges, the authorities have prepared a new Poverty Reduction Strategy–Agenda for Prosperity–that focuses on measures to advance economic diversification, improve public service delivery and social protection for the most vulnerable, and increase employment opportunities. The new strategy aims to achieve economic transformation through increased investment in energy, roads, transportation, and agriculture; as well as growth-enhancing structural reforms.
Recent economic and financial developments were encouraging. The inflation rate (year-on-year) declined from 12.1 percent in 2012 to 9.1 percent at end-September 2013, partly reflecting a tighter monetary policy stance. With the onset of iron ore exports, and better terms of trade, the external position improved in 2012, and gross international reserves rose to about 3 months of imports. The fiscal deficit stood at 5.6 percent of non-iron ore GDP in 2012, well above the original budget target because of expenditure overruns partly linked to the November elections. However, the fiscal position improved in the first half of 2013 thanks to revenue-enhancing
1 Under Article IV of the IMF's Articles of Agreement, the IMF holds bilateral discussions with members, usually every year. A staff team visits the country, collects economic and financial information, and discusses with officials the country's economic developments and policies. On return to headquarters, the staff prepares a report, which forms the basis for discussion by the Executive Board. At the conclusion of the discussion, the Managing Director, as Chairman of the Board, summarizes the views of Executive Directors, and this summary is transmitted to the country's authorities. An explanation of any qualifiers used in summings up can be found here: http://www.imf.org/external/np/sec/misc/qualifiers.htm.
International Monetary Fund Washington, D.C. 20431 USA

measures, expenditure restraint, and enhanced Treasury cash management. Monetary and banking sector developments have been broadly satisfactory and risks to financial sector stability appear contained.
Medium-term prospects are positive. Growth is projected to remain robust, mainly driven by iron ore production and continued high public investment; while inflation is expected to decline further as monetary and fiscal policies remain prudent. The main risks to the outlook are related to possible adverse fluctuations in global commodity prices and uncertainties on iron ore production.
Executive Board Assessment
Executive Directors welcomed the progress made by Sierra Leone in recent years but noted that poverty remains widespread and improvement in social indicators has been modest. Accordingly, Directors emphasized that strong commitment to sound policies and structural reforms under the new ECF-supported program will be important to consolidate macroeconomic stability, build policy buffers, and foster sustainable and inclusive growth.
Directors stressed the importance of continued efforts to strengthen the fiscal position. They welcomed the authorities’ renewed focus on revenue mobilization and their plans to improve expenditure controls and avoid further spending overruns. They looked forward to the authorities’ medium-term expenditure framework which should guide the implementation of the new Poverty Reduction Strategy, including giving priority to infrastructure investment and pro-poor spending. To boost revenue, Directors called for measures to increase efficiency in tax administration, broaden the tax base, and establish a comprehensive tax regime for the natural resources sector. Accelerating public financial reforms should help strengthen budget processes and expenditure management, especially management of capital expenditure.
Directors welcomed efforts to improve debt management capacity and urged the authorities to continue to cover Sierra Leone’s financing needs mainly with grants and concessional loans. They also called for a careful prioritization of large-scale infrastructure projects envisioned in their Poverty Reduction Strategy. Directors advised the authorities to ensure that large projects are consistent with macroeconomic stability and debt sustainability.
Directors encouraged the authorities to maintain a tight monetary policy to reduce inflation further. The monetary authorities should stand ready to raise the policy rate and mop up excess liquidity, if inflationary pressures intensify. Given Sierra Leone’s vulnerability to external shocks, Directors saw merit in increasing international reserves over the medium term and maintaining a flexible exchange rate.
Directors noted that, while the financial sector has expanded significantly, the provision of financial services remains limited. They encouraged the authorities to take additional steps to broaden access and facilitate intermediation. Addressing gaps in banking supervision and

strengthening the Anti-Money Laundering and Combating the Financing of Terrorism (AML/CFT) framework will also be important.
Directors emphasized that deeper structural reforms remain necessary to foster broad-based growth and reduce poverty. Key priorities should focus on improving the business environment, investing in infrastructure, including energy sector, and advancing economic diversification.

Table 1. Sierra Leone: Selected Economic Indicators, 2010–18
2010
2011
20121 Prel.
2013
2014
2015
2016
2017
2018
(Annual percent change, unless otherwise indicated) National account and prices
GDP at constant prices 5.3 6.0 15.2 13.3 14.0 12.4 7.7 5.2 5.3 Excluding Iron ore 5.3 5.8 5.3 6.0 6.3 6.6 6.6 7.0 7.0
GDP deflator 17.2 17.3 12.1 9.1 6.5 5.9 5.1 4.9 4.7 Excluding Iron ore 17.2 17.3 14.3 8.8 10.6 9.5 6.7 4.8 4.5
Consumer prices (end-of-period) 18.4 16.9 12.0 9.0 7.5 6.0 5.4 5.4 5.4 Consumer prices (average) 17.8 18.5 13.8 10.3 7.7 6.7 5.7 5.4 5.4
External sector Terms of trade (deterioration -) 6.8 -0.7 4.9 -1.6 -4.9 -0.6 -0.2 0.3 0.1 Exports of goods 33.9 6.2 147.3 56.9 29.9 22.0 12.2 4.5 0.2 Imports of goods 92.3 85.2 -3.6 18.6 5.8 3.5 4.5 7.0 6.9 Average exchange rate (leone per US$) 3,978 4,349 4,344 … … … … … … Nominal effective exchange rate change (end-period, depreciation -) -8.2 -4.1 1.0 … … … … … … Real effective exchange rate (end-period, depreciation -) 11.5 8.7 14.7 … … … … … … Gross international reserves, months of imports2 2.0 1.8 2.0 2.1 2.2 2.4 2.6 2.8 3.1
Excluding iron ore-related imports, months of imports3 3.4 2.8 3.1 3.2 3.4 3.6 3.9 4.1 4.4 Money and credit
Domestic credit to the private sector 31.5 21.8 6.3 10.8 11.0 12.6 12.1 11.9 11.8 Base money 34.6 13.0 18.5 14.2 17.1 15.2 13.8 12.0 11.3 M2 21.8 20.0 23.1 14.8 18.8 16.5 15.0 13.3 11.9 91-day treasury bill rate (in percent) 24.5 23.4 19.0 … … … … … …
(Percent of non-iron ore GDP, unless otherwise indicated) National accounts
Gross capital formation 31.1 42.2 28.6 18.2 19.1 19.3 19.3 19.3 19.3 Government 7.7 9.0 8.2 7.2 8.1 8.3 8.3 8.3 8.3 Private 23.4 33.1 20.3 11.0 11.0 11.0 11.0 11.0 11.0
National savings 11.4 -2.8 -10.8 -0.8 8.6 11.7 12.2 12.4 13.8 External sector
Current account balance (including official grants) -19.7 -45.0 -39.4 -19.1 -10.5 -7.7 -7.2 -7.0 -6.2 (excluding official grants) -26.0 -48.8 -41.2 -20.6 -11.9 -9.1 -8.6 -8.4 -7.6
External public debt (including IMF) 30.4 32.6 27.8 27.3 27.4 27.3 27.6 27.7 27.9 Central government budget
Domestic primary balance4 -5.9 -3.8 -3.8 -1.8 -2.3 -2.1 -1.9 -1.6 -1.3 Overall balance -5.0 -4.6 -5.6 -3.1 -4.5 -4.3 -4.2 -3.7 -3.4
(excluding grants) -10.3 -10.1 -9.7 -6.6 -7.6 -7.4 -7.1 -6.7 -6.2 Revenue 9.9 11.5 12.2 12.4 12.4 13.1 13.4 13.9 14.2 Grants 5.3 5.6 4.1 3.6 3.1 3.1 2.9 2.9 2.9 Total expenditure and net lending 20.2 21.6 21.9 19.1 20.0 20.5 20.5 20.6 20.4
Memorandum item:
GDP at market prices (billions of Leone)5 10,256 12,755 16,459 20,357 24,713 29,421 33,298 36,752 40,535
Excluding iron ore 10,256 12,725 15,330 17,673 20,775 24,248 27,571 30,903 34,563
Excluding iron ore in millions of US$ 2,578 2,926 3,529 4,000 4,531 5,112 5,637 6,134 6,661
Per capita GDP (US$) 441 489 615 729 832 933 998 1,042 1,088
Sources: Sierra Leonean authorities; and Fund staff estimates and projections. 1 The commencement of iron ore mining causes a structural break in key macroeconomic variables in 2012. 2 Refers to reserves in current year and imports in following year. 3 Excludes import of capital goods and service related to the iron ore project that is externally financed. 4 Revenue less expenditures and net lending adjusted for interest payments. 5 Statistics Sierra Leone revised the National Accounts Statistics, based on IMF TA recommendations. This resulted in approximately a 30 percent increase in nominal GDP for the period 2001–11.

Statement by Momodou Bamba Saho, Executive Director for Sierra Leone
October 21, 2013
Background
1. The implementation of successive Fund-supported financing arrangements under the Poverty Reduction and Growth Trust, following the end of the civil conflict in 2002, has helped Sierra Leone maintain macroeconomic stability and return to a high and sustainable growth trajectory. In spite of the daunting challenges posed by adverse exogenous shocks from the global food and fuel crisis and the global financial crisis, the Sierra Leone authorities successfully completed implementation of their poverty reduction strategy (PRS), the ‘Agenda for Change’, spanning 2008–2012. Significant progress was accomplished in the delivery of public services, the deepening of the financial sector, the strengthening of state institutions, and in reducing poverty.
2. To consolidate the progress made thus far, the authorities have commenced the process of addressing the residual socio-economic challenges and accelerating the country’s development through steadfast implementation of a successor PRS, the ‘Agenda for Prosperity’ (AfP). The AfP defines the country’s development path for the period 2013–18, with the key objective of attaining inclusive, diversified, and sustainable economic growth, in tandem with employment generation and significantly reducing income inequality. To advance these objectives, the authorities decided to negotiate a new Fund arrangement that is aligned with the priorities set out in the AfP. It is against this background that my authorities request the Executive Board’s approval of a new three-year program supported under the Extended Credit Facility (ECF).
3. My authorities appreciate the continued support of the Executive Board and Management throughout the years, including in the area of technical assistance. They are particularly grateful for the productive policy dialogue and advice proffered by the staff team during the negotiations for a new ECF arrangement. Mindful of the many challenges going forward, continued engagement with the Fund and other development partners is considered crucial to sustaining the growth momentum and reducing poverty. My authorities broadly share the thrust of the staff report, which they consider a balanced account of recent economic developments and policy challenges going forward.
Recent economic developments
4. Macroeconomic performance in 2013 has so far been impressive, with declining inflationary pressures, stable exchange rate, improving current account position, and sustainable public debt levels. Real GDP growth is projected at about 13.3 percent in 2013, driven mostly by increasing value-added from iron ore production. The non-iron ore economy is also projected to register a healthy 6 percent growth, with key contributions from agriculture, services, tourism, and sustained investment in infrastructure.
5. To address the fiscal slippages and domestic debt overhang which had come to characterize budget execution in recent years, my authorities instituted stringent measures to ensure fiscal discipline. A policy stance of zero domestic securities market borrowing was adopted; outstanding arrears, including ways and means advances carried over from the previous year, were cleared; a memorandum of understanding was signed with commercial banks to reduce delays in transferring

balances on the National Revenue Authority’s transit accounts to the Treasury account at the central bank; and a decision was taken to terminate the 2013 expenditure commitments and issuance of payment orders at end-October and end-November, respectively, with a view to limit float transactions at the end of the year. Fiscal consolidation was rigorously pursued, through enhanced revenue mobilization and expenditure control. Total domestic revenue mobilized during the first half of 2013 amounted to 6.3 percent of GDP, exceeding the target for the period and actual collections for the corresponding period in 2012. Total expenditures and net lending, on the other hand, amounted to 6.8 percent of GDP, well within the budgeted amount of 7.5 percent of GDP.
6. The tight fiscal management in the first half of the year occasioned partly by the authorities’ zero domestic borrowing stance, culminated in the significant decline in domestic interest rates translating into substantial savings in interest payments, thereby creating much needed fiscal space for productive spending. The 3-month Treasury bills rate plummeted to 5.4 percent at end-June 2013 from 19.0 percent in December 2012. Similarly, the Treasury bearer bonds rate fell to 9 percent at end-June 2013 from 20 percent in December 2012. Accordingly, the monetary policy rate was lowered from 20 percent to 15 percent. Inflationary pressures have continued to moderate with consumer price inflation falling to 9.3 percent (year-on-year) at end-August from 12 percent in December 2012. The decline reflects moderation in international food and fuel prices, the relative stability of the exchange rate, and pro-active monetary policy supported by fiscal restraint. The country’s gross international reserves amounted to about 3 months of import coverage by end-August 2013.
Medium-term outlook and policies
7. The policy interventions over the medium term will be defined by the priorities outlined in the AfP. Over the period, policy will focus on preserving macroeconomic stability and strengthening public finances, while promoting private-sector, export-led growth and generating employment opportunities.
8. The growth prospects over the medium term are quite favorable, with real GDP growth averaging 10.5 percent, driven mostly by increased iron ore mining activities. Excluding iron ore, growth is projected to attain 7 percent by 2017 on account of continued scaling up of public investment, increased agricultural productivity, and sustained activity in construction and services. Exports are projected to increase significantly over the period culminating in the narrowing of the current account deficit by 13 percentage points of non-iron ore GDP. With the improved external current account coupled with unremitting capital inflows, gross international reserves is expected to increase from 3.2 months of imports in 2013 to 4.1 months by 2017. Inflation is projected to decline from 9 percent in 2013 to 5.4 percent in 2017 on the back of a stable exchange rate and continued prudent monetary policy.
Fiscal policy and public financial management
9. The authorities’ demonstrable commitment to prudent fiscal management will underpin their fiscal strategy over the medium term. The efforts at fiscal consolidation will be sustained through enhanced domestic revenue mobilization, increased efficiency in expenditure management, and a reduction in the stock of domestic debt. On the revenue front, my authorities will seek to broaden the tax base, minimize discretionary duty exemptions, and strengthen revenue administration. The

legal, operational and institutional framework for efficient management of mining revenues will be strengthened. Amendments to the Government Budgeting and Accountability Act (GBAA) will be effected to provide for the establishment of a Natural Resource Revenue Fund and the incorporation of a countercyclical fiscal rule that regulates budgetary utilization of natural resource revenues.
10. On expenditures, the authorities will continue to restrain non-statutory recurrent expenditures while rationalizing capital spending, with increased allocations to priority sectors consistent with the country’s AfP. Public financial management reforms and fiscal governance will continue to be strengthened within the context of the Integrated Public Financial Management Programme (IPFMRP). The further roll out of the Integrated Financial Management Information System (IFMIS) to government ministries, departments and agencies (MDAs) and the Petra financial management information system to local councils will strengthen budget preparation, budget execution, cash management and financial reporting. The establishment of a Treasury Single Account and improvement in the operational efficiency of the Cash Management Committee constitute important priorities going forward. In addition, my authorities will work on operationalizing the recently established Public Investment Management Unit (PIMU) with a view to expediting preparation of a public investment plan (PIP) that is fully integrated with the budget process and consistent with the MTEF.
Debt management policy
11. The Sierra Leone authorities intend to fast-track preparation of a comprehensive Medium-Term Debt Management Strategy (MTDS) that prioritizes the use of grants and highly concessional resources for project financing. Given the daunting challenges of securing concessional external financing for critical transformative infrastructure and social development projects outlined under the country’s AfP, they would appreciate flexibility under the new ECF-supported program for the financing, on nonconcessional terms, of some socially and economically viable projects for which concessional funding could not be secured.
12. The latest update of staffs’ debt sustainability analysis which affirms that Sierra Leone remains at a moderate risk of debt distress is welcomed. Mindful of the vulnerability of the long-term debt outlook to adverse shocks affecting key macroeconomic variables and roll-over risks from the short-term maturity structure of public domestic debt, my authorities agree with the policy prescriptions proffered by staff and will seek to maintain prudent borrowing policies.
Monetary and exchange rate policies
13. Monetary policy will continue to be implemented within the context of the monetary targeting framework which has proven to be appropriate in achieving price stability. To further enhance the efficacy of monetary policy in containing potential inflationary pressures and in attaining and maintaining single-digit inflation levels, the liquidity forecasting and management framework of the Bank of Sierra Leone (BSL) will be further strengthened. Efforts to deepen the secondary market and the interbank market for government securities will be enhanced in order to amplify the signaling effect and thus the monetary policy transmission mechanism.

14. The current flexible exchange rate regime will be maintained over the medium term to help facilitate rapid adjustments to exogenous shocks. The BSL’s intervention in the foreign exchange market will continue to be limited to smoothening short-term exchange rate volatility. Going forward, the BSL will introduce new measures in the management of foreign exchange to ensure greater efficiency in the functioning of the inter-bank foreign exchange market, prevent loss of foreign exchange reserves and limit potential risk to liquidity and exchange rate volatility. This would include a new guideline for foreign exchange operations as well as a revised Foreign Exchange Act.
Financial sector reforms
15. The resilience of the financial sector to adverse domestic and external shocks will be further enhanced through effective implementation of the Financial Sector Development Plan (FSDP) that aims, amongst others, to safeguard financial sector stability, improve efficiency in financial intermediation, and expand access to financial services. The supervisory framework of the banking system will continue to be reinforced, including through an accelerated transition to risk-based supervision and full implementation of the Basel II Core Principles. Moreover, efforts will be made to strengthen the legal framework of the financial sector by instituting appropriate prudential regulations including enactment, over the near term, of the Borrowers and Lenders Bill, the Securities and Exchange Bill, and the Collective Investment Bill. Progress accomplished in modernizing the payments system will be further consolidated. With the promotion of financial inclusion an overarching medium-term goal, the BSL will work closely with development partners and fulfill its commitments under the Maya Declaration to the Alliance for Financial Inclusion geared towards scaling up access to financial services.
Other structural reforms
16. My authorities consider far-reaching structural reforms critical to the successful implementation of the new ECF-supported program and to achieving their medium-term objective as stated in the AfP. To this end, in addition to the structural fiscal and financial sector reform measures highlighted above, they will, over the near to medium term, seek to consolidate progress accomplished in modernizing the business regulatory framework and eliminating administrative barriers to investment; boost energy supply by rehabilitating the Bumbuna hydroelectric power plant and thermal power generators; achieve the Extractive Industries Transparency Initiative-compliant status by expediting the validation exercise; and strengthen the public procurement process by ensuring transparency in procurement activities and information dissemination, including through online access to procurement opportunities and contract awards.
The Agenda for Prosperity
17. As highlighted above, my authorities have embarked on a program of socio-economic transformation and development through judicious implementation of the AfP, on which the new ECF-supported program is to be predicated. While addressing the country’s huge infrastructure deficit remains an integral part of the strategy, my authorities will maintain close engagement with development partners, notably the IMF and the World Bank, in assessing the economic feasibility and macroeconomic impacts of the financing options for key transformative projects prior to their implementation.
18. Finally, my authorities have initiated a series of global road shows to sensitize development partners and potential investors about the funding requirements and available investment opportunities in the country. A Consultative Group meeting and Investment Forum will be organized in Freetown later this year to effectively mobilize the resources needed to finance key projects identified under the AfP. My authorities count on the continued support of development partners in fulfilling the development aspirations of the people of Sierra Leone.