siemens in china – accelerating our success · u.s. dollar and the currencies of emerging markets...
TRANSCRIPT

Copyright © Siemens AG 2011. All rights reserved.
Siemens in China –Accelerating our successMei-Wei Cheng President and CEO of Siemens Ltd., China CEO of Siemens North East Asia
Capital Market Days "Emerging Markets"Shanghai, June 28, 2011

Capital Market Days "Emerging Markets", Shanghai, June 28, 2011Page 2 Copyright © Siemens AG 2011. All rights reserved.
Safe Harbour StatementThis document contains forward-looking statements and information – that is, statements related to future, not past, events. These statements may be identified by words such as “expects,” “looks forward to,” “anticipates,” “intends,” “plans,” “believes,” “seeks,” “estimates,” “will,” “project” or words of similar meaning. Such statements are based on the current expectations and certain assumptions of Siemens’ management, and are, therefore, subject to certain risks and uncertainties. A variety of factors, many of which are beyond Siemens’ control, affect Siemens’ operations, performance, business strategy and results and could cause the actual results, performance or achievements of Siemens to be materially different from any future results, performance or achievements that may be expressed or implied by such forward-looking statements. In particular, Siemens is strongly affected by changes in general economic and business conditions as these directly impact its processes, customers and suppliers. This may negatively impact our revenue development and the realization of greater capacity utilization as a result of growth. Yet due to their diversity, not all of Siemens’ businesses are equally affected by changes in economic conditions; considerable differences exist in the timing and magnitude of the effects of such changes. This effect is amplified by the fact that, as a global company, Siemens is active in countries with economies that vary widely in terms of growth rate. Uncertainties arise from, among other things, the risk of customers delaying the conversion of recognized orders into revenue or cancelling recognized orders, of prices declining as a result of adverse market conditions by more than is currently anticipated by Siemens’ management or of functional costs increasing in anticipation of growth that is not realized as expected. Other factors that may cause Siemens’ results to deviate from expectations include developments in the financial markets, including fluctuations in interest and exchange rates (in particular in relation to the U.S. dollar and the currencies of emerging markets such as China, India and Brazil), in commodity and equity prices, in debt prices (credit spreads) and in the value of financial assets generally. Any changes in interest rates or other assumptions used in calculating obligations for pension plans and similar commitments may impact Siemens’ defined benefit obligations and the anticipated performance of pension plan assets resulting in unexpected changes in the funded status of Siemens’ pension and other post-employment benefit plans. Any increase in market volatility, deterioration in the capital markets, decline in the conditions for the credit business, uncertainty related to the subprime, financial market and liquidity crises, or fluctuations in the future financial performance of the major industries served by Siemens may have unexpected effects on Siemens’ results. Furthermore, Siemens faces risks and uncertainties in connection with: disposing of business activities, certain strategic reorientation measures; the performance of its equity interests and strategic alliances; the challenge of integrating major acquisitions, implementing joint ventures and other significant portfolio measures; the introduction of competing products or technologies by other companies or market entries by new competitors; changing competitive dynamics (particularly in developing markets); the risk that new products or services will not be accepted by customers targeted by Siemens; changes in business strategy; the interruption of our supply chain, including the inability of third parties to deliver parts, components and services on time resulting for example from natural disasters; the outcome of pending investigations, legal proceedings and actions resulting from the findings of, or related to the subject matter of, such investigations; the potential impact of such investigations and proceedings on Siemens’ business, including its relationships with governments and other customers; the potential impact of such matters on Siemens’ financial statements, and various other factors. More detailed information about certain of the risk factors affecting Siemens is contained throughout this report and in Siemens’ other filings with the SEC, which are available on the Siemens website, www.siemens.com, and on the SEC’s website, www.sec.gov. Should one or more of these risks or uncertainties materialize, or should underlying assumptions prove incorrect, actual results may vary materially from those described in the relevant forward-looking statement as expected, anticipated, intended, planned, believed, sought, estimated or projected. Siemens neither intends to, nor assumes any obligation to, update or revise these forward-looking statements in light of developments which differ from those anticipated.New orders and order backlog; adjusted or organic growth rates of Revenue and new orders; book-to-bill ratio; Total Sectors Profit; return on equity (after tax), or ROE (after tax); return on capital employed (adjusted), or ROCE (adjusted); Free cash flow; cash conversion rate, or CCR; adjusted EBITDA; adjusted EBIT; adjusted EBITDA margins, earnings effect from purchase price allocation, or PPA effects; net debt and adjusted industrial net debt are or may be non-GAAP financial measures. These supplemental financial measures should not be viewed in isolation as alternatives to measures of Siemens’ financial condition, results of operations or cash flows as presented in accordance with IFRS in its Consolidated Financial Statements. Other companies that report or describe similarly titled financial measures may calculate them differently. Definitions of these supplemental financial measures, a discussion of the most directly comparable IFRS financial measures, information regarding the usefulness of Siemens’ supplemental financial measures, the limitations associated with these measures and reconciliations to the most comparable IFRS financial measures are available on Siemens’ Investor Relations website at www.siemens.com/nonGAAP. For additional information, see “Supplemental financial measures” and the related discussion in Siemens’ annual report on Form 20-F for fiscal 2010, which can be found on our Investor Relations website or via the EDGAR system on the website of the United States Securities and Exchange Commission.

Capital Market Days "Emerging Markets", Shanghai, June 28, 2011Page 3 Copyright © Siemens AG 2011. All rights reserved.
Siemens China key facts in FY10 1)
Siemens is significantly present and deeply rooted in China
Premier Wen visited Siemens Signaling Company Xi’an (SSCX) on Jul. 17, 2010
1) Scope: Siemens Ltd. China plus majority-owned Joint-Ventures and wholly-owned enterprises, excl. COM, OSRAM, SIS, BSH
Premier Wen visited Siemens Electrical Drives Ltd. (SEDL) on May 14, 2010
Total revenue of € 5.5 bn in FY10 thereof67% Industry21% Energy12% Healthcare
Continuous strong growth: 19% CAGR since ’05
69 joint ventures & wholly owned enterprises 64 regional sales offices 16 R&D centers~ 25,800 employees
China is the 3rd largest Siemens market globallyHistory of 139 years in ChinaWell recognized as a reliable partner for China
Capital Market Days "Emerging Markets", Shanghai, June 28, 2011Page 4 Copyright © Siemens AG 2011. All rights reserved.
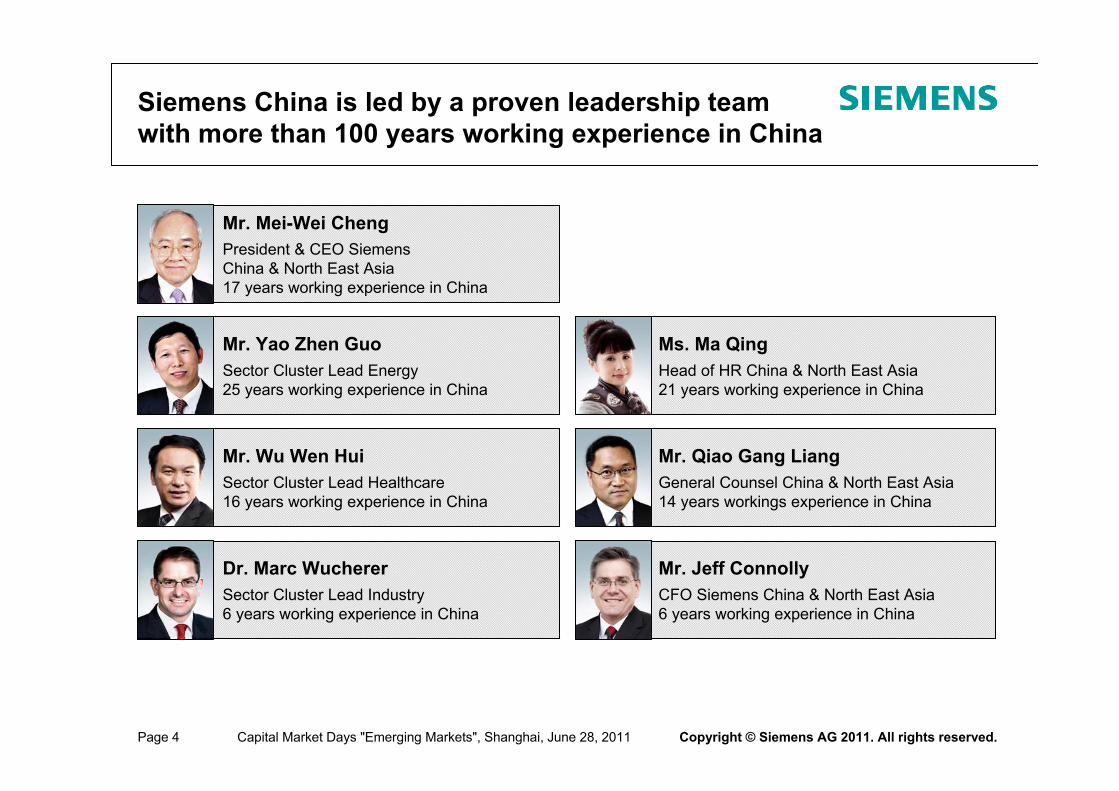
Siemens China is led by a proven leadership team with more than 100 years working experience in China
Mr. Jeff ConnollyCFO Siemens China & North East Asia6 years working experience in China
Mr. Wu Wen HuiSector Cluster Lead Healthcare16 years working experience in China
Mr. Mei-Wei ChengPresident & CEO Siemens China & North East Asia17 years working experience in China
Mr. Yao Zhen GuoSector Cluster Lead Energy 25 years working experience in China
Ms. Ma QingHead of HR China & North East Asia 21 years working experience in China
Dr. Marc WuchererSector Cluster Lead Industry6 years working experience in China
Mr. Qiao Gang LiangGeneral Counsel China & North East Asia14 years workings experience in China

Capital Market Days "Emerging Markets", Shanghai, June 28, 2011Page 5 Copyright © Siemens AG 2011. All rights reserved.
Continuous development of local talent is a key factor for our success in China
Our people approach Our building blocks of people excellence
Development programs for young talent
Global assignments
Focused employer branding
Identify / Assess / Develop
internal talent continuously
Clear differentiation of individual performance
University recruiting
Siemens Management
Institute
Reward performance
Attractive incentive and
retention schemes
Attract talent
Develop talent
Retain talent
Live a high-performance culture
Develop competenciesby leveraging the local and global organization
Drive people programsto support employees at all career stages
No. 1 in medical appliances & pharmaceutical industry No. 4 in manufacturing industry One of the most attractive employers in China overall
~3,000
16,370
<8%
New hires by Siemens China per
year since 2005
Employees trained by Siemens Mgmt Institute in 2010
Low turn over rate: We develop & retain people successfully

Capital Market Days "Emerging Markets", Shanghai, June 28, 2011Page 6 Copyright © Siemens AG 2011. All rights reserved.
Continuous GDP growth of 7-10% p.a. forecasted2nd largest economy after USA
Siem
ens
mar
kets
~150 cities with >1 m habitantsTier 2 & 3 cities with highest growth rate
Energy efficiency and automation of production as future key growth driver
Strong demand for clean energy generationStrong & Smart grids to power China
Government target: Universal healthcare access to all people
GDP+ 11%
CAGR 06-10
Siemens is well positioned in China's most attractive growth markets
FAI: Fixed Asset Investment
Electricity consumption
+11%
Industrial FAI+15%
Healthcare spending
+20%
Urban FAI+27%

Capital Market Days "Emerging Markets", Shanghai, June 28, 2011Page 7 Copyright © Siemens AG 2011. All rights reserved.
Our strategy & portfolio is addressing fundamental development needs in China 12th Five-Year Plan
Key themes in 12th Five-Year Plan
Strategy and portfolioChina challenges
Improve standard of living
Scientific development
Balanced development
Full local value-chain incl. R&D & emerging market product management
Outstanding portfolio to meet China needs in - Industry- Energy- Healthcare
Increased investment in China Center & West
Clean energy generationEfficient consumption
Affordable healthcareDevelop center & west
Rapid urbanizationEfficient public mobility
Industrial efficiency & productivityAccelerate local innovation
Siemens Complete & Green Mobility concept is part of
12th Five-Year Plan.First ever MNC contribution
to a Five-Year Plan.

Capital Market Days "Emerging Markets", Shanghai, June 28, 2011Page 8 Copyright © Siemens AG 2011. All rights reserved.
China's 12th Five-Year Plan investments will further accelerate our business success
Siemens proven track record China challenges Planned investments until 2015
Push for high efficient power plants Add. 5 GW Solar & 70 GW Wind5 UHV & 17 inter-provincial HVDC lines
SHA Waigaoqiao – phase III: Best environmental & energy performance
Yunnan-Guangdong 800kV HVDC: Energy transmission at highest level
Additional 900 km of urban rail~30 new airports in the next five yearsSMART grid & e-car infrastructure
Guangzhou Metro Line 3:Fastest subway in China
Beijing Airport T3: Asia's most advanced Baggage handling
Industrial automation as driver to push efficiency, productivity & competitivenessUSD 600 bn in 7 new strategic industries
High speed Motor & LCI for West-East Gas longest Pipeline
Baosteel COREX C-3000 – world largest high efficiency iron-smelting
Speed-up of China's healthcare reformHealth services expenditures to double
Leading hospital supplier, e.g. for Peking Union Medical College
Clean Energy
Affordable Healthcare
Rapid Urbanization
Industrial Efficiency

Capital Market Days "Emerging Markets", Shanghai, June 28, 2011Page 9 Copyright © Siemens AG 2011. All rights reserved.
Customer Focus:Our strong regional sales setup is benchmark
Our sales setup Selected key wins of last 12 months
HRB
CC
SYJZAS
DLTS
TGTJ
TYSJZ
JNZB QD
YT
YZXZ
ZZLY NJWXCZ
SZHFWHYC
ZZCS NC
NBWZ
HZSX
FZXM
STSZ
DGFSZH
ZJHK
NN
GYYB
CQ
KM
PZH
CD
MYXA
LZ YC
BTHHT
URMQHLD
NT
BJ
SH
GZ
64 regional and provincial sales offices
Strong sales team with >4,000 on the groundExtensive coverage of tier 1 and tier 2 cities Additional strong coverage via a large number of distributors across all product businesses
€ 36 m Shanghai Line 11 South ExtensionChina's first inter-provincial public transportation (Shanghai-Jiangsu)One of the fastest mass transit system in China. Start of operation in 2012
€12.4 m Ministry of Healthcare of China7 advanced Pet mCTs of high image quality, low dose, and fast imaging processing
€ 250 m Southern Grid HVDC: Nuozhadu –Guangdong and Xiluodu-Guangdong
World benchmark in green long-distance mega capacity transmission

Capital Market Days "Emerging Markets", Shanghai, June 28, 2011Page 10 Copyright © Siemens AG 2011. All rights reserved.
Siemens manufactures products of global quality at local cost – for China and the World
~16,800 production headcount
69 joint-ventures & wholly-owned enterprises – many with high-tech status
€100 –150 m equity investment p.a. over last five years
Every second Siemens CT sold globally is produced in Shanghai
Established in 1992 – 833 employees100% Siemens ownedSiemens' only CT R&D and manufacturing center outside Germany.
SEPG holds 50% market share in >1,000 MW steam power generation
Established in 1995 – 5,839 employees 40% Siemens ownedProduction of Ultra-supercritical steam turbines for Chinese and (via majority owned export JV) global market
Majority-JVs and wholly-owned enterprises (#58)
Partnerships for strategic infrastructure markets (#11)
Siemens Shanghai Med. Equipment
Shanghai Electric Power Generation Equipment

Capital Market Days "Emerging Markets", Shanghai, June 28, 2011Page 11 Copyright © Siemens AG 2011. All rights reserved.
China is a global innovation center for Siemensand key pillar for SMART product development
Successful local product developmentStrong local R&D setup
16 local R&D Centers14 Division R&D centers2 Corporate Technology Centers
~180 top-notch innovatorsSiemens Innovation pillar, next to Munich and Berkeley (USA)
>4,100 R&D experts & engineers
Strong patent portfolio: ~7,000 patents & patent applications
Innovation mindsetDedicated R&D training & people development
R&D cooperation with 10 top universities
FY10
>120
FY05
~ 5
>30 in
pipeline
SMART Product Ramp-up
SOMATOM Emotion 16No. 1 market position in China since launch70% of units sold outside China
S7-200 CNNo. 1 in China Market with 39% share in 2010
S 700 K-C Point Machine35% cost reduction No.1 in China with 45% market share in 2010
Capital Market Days "Emerging Markets", Shanghai, June 28, 2011Page 12 Copyright © Siemens AG 2011. All rights reserved.Capital Market Days "Emerging Markets", Shanghai, June 28, 2011Page 12
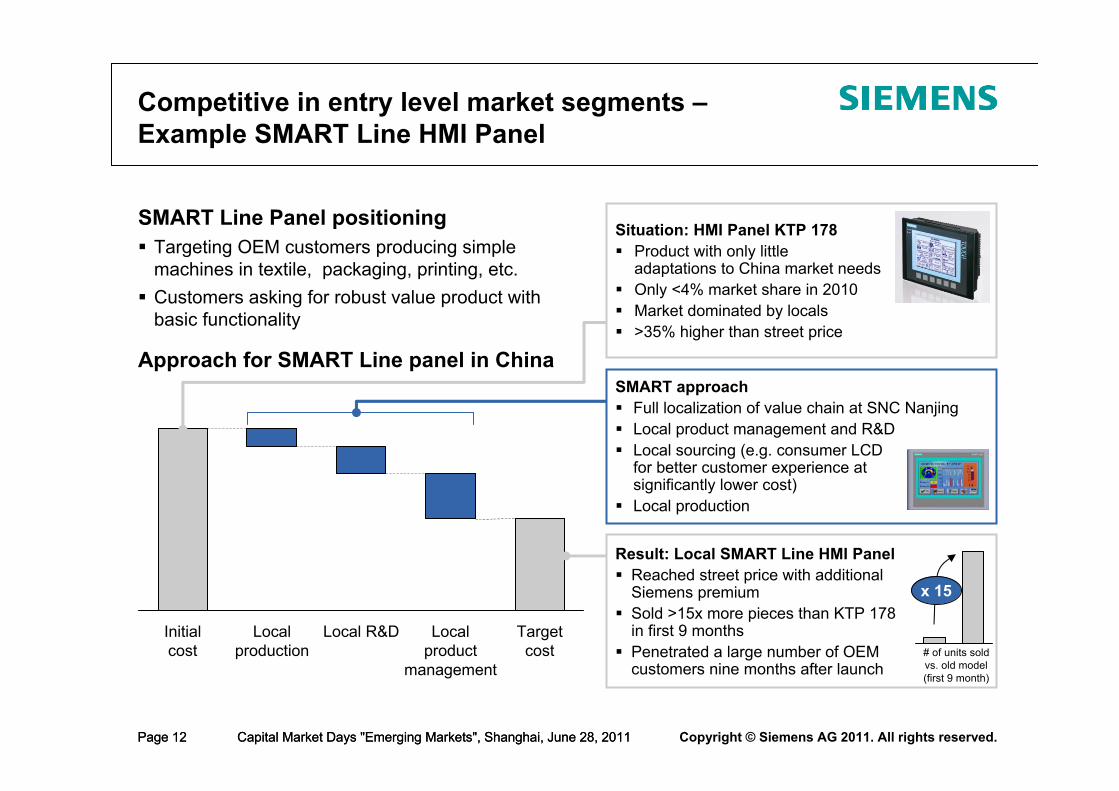
Competitive in entry level market segments –Example SMART Line HMI Panel
SMART Line Panel positioningTargeting OEM customers producing simple machines in textile, packaging, printing, etc.Customers asking for robust value product with basic functionality
Targetcost
Local product
management
Local R&DLocal production
Initial cost
Approach for SMART Line panel in China
Situation: HMI Panel KTP 178Product with only little adaptations to China market needsOnly <4% market share in 2010Market dominated by locals>35% higher than street price
Result: Local SMART Line HMI PanelReached street price with additional Siemens premiumSold >15x more pieces than KTP 178 in first 9 monthsPenetrated a large number of OEM customers nine months after launch
SMART approachFull localization of value chain at SNC NanjingLocal product management and R&DLocal sourcing (e.g. consumer LCDfor better customer experience at significantly lower cost)Local production
# of units sold vs. old model(first 9 month)
x 15

Capital Market Days "Emerging Markets", Shanghai, June 28, 2011Page 13 Copyright © Siemens AG 2011. All rights reserved.
With our local setup & capabilities, we can react fast to changes in the market – Example NXAirS
Medium voltage switchgear business NXAirS – Business impact
>20% additional cost downMarket Share quadrupled to ~10% within 3 years NXAirS powered the EXPO 2010Platform developed in Shanghai used for global NXAirS products
Siem
ens
Sale
s
1994 2006 2008 2010
8BK20 switchgearLocally produced switchgear based on global standard designYears of strong growth and profit contribution
Market challenges8BK20 under increasing competitive pressure from localsStrong pressure on top and bottom line
NXAirS – SMART productDeveloped at Siemens Switchgear Ltd. R&D Center in ShanghaiDeveloped in <12 monthDesign for easysourcing standard parts and OEM concept
Capital Market Days "Emerging Markets", Shanghai, June 28, 2011Page 14 Copyright © Siemens AG 2011. All rights reserved.
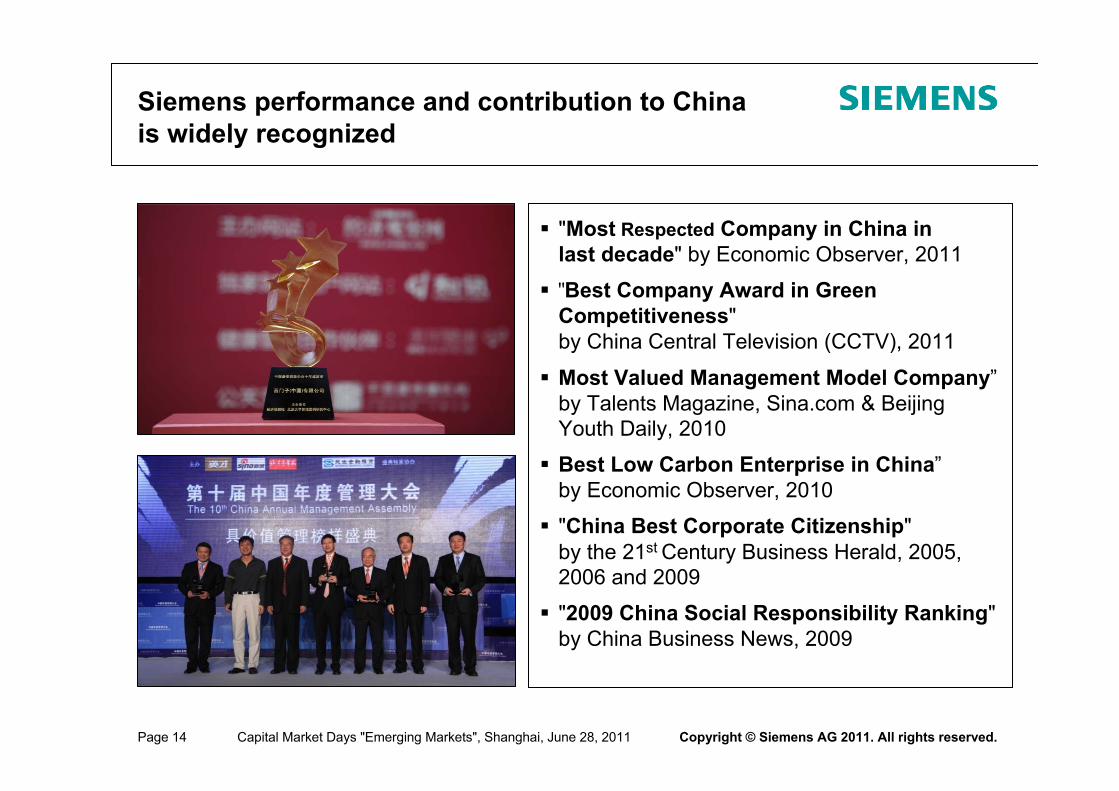
"Most Respected Company in China in last decade" by Economic Observer, 2011
"Best Company Award in Green Competitiveness" by China Central Television (CCTV), 2011
Most Valued Management Model Company”by Talents Magazine, Sina.com & Beijing Youth Daily, 2010
Best Low Carbon Enterprise in China”by Economic Observer, 2010
"China Best Corporate Citizenship" by the 21st Century Business Herald, 2005, 2006 and 2009
"2009 China Social Responsibility Ranking" by China Business News, 2009
Siemens performance and contribution to China is widely recognized

Capital Market Days "Emerging Markets", Shanghai, June 28, 2011Page 15 Copyright © Siemens AG 2011. All rights reserved.Capital Market Days "Emerging Markets", Shanghai, June 28, 2011Page 15
Fiscal year First half year
Orders(in € bn)
Revenue(in € bn)
Employees
FY10
5.5
FY05
2.3
FY10
5.3
FY05
3.1
+19%
CAGR
FY10
~25,800
FY05
~12,000 +16%
CAGR
H1 FY11
3.1
H1 FY10
2.4 +31%
yoy
H1 FY11
2.9
H1 FY10
2.4 +24%
yoy
~26,900
H1 FY11H1 FY10
~24,100 +11%yoy
+11%
CAGR
Siemens China – First half year of 2011 even outperformed our strong growth in recent years

Capital Market Days "Emerging Markets", Shanghai, June 28, 2011Page 16 Copyright © Siemens AG 2011. All rights reserved.
Key take-away's
Siemens is well positioned in China's mostattractive growth market 1
Our strategy and portfolio is addressing fundamental development needs in China; and 12th Five-Year Plan investments will further accelerate our success
Siemens strong local competitiveness is driven by our "zero distance to customer“our extensive local production base our strong local innovation capabilities
China is already a global innovation center for Siemens & a pillar of SMART product development
Continuous outstanding performance – First half year of 2011 even outperformed our strong growth in recent years
2
3
4
5
Siemens Center Beijing opened May 2008
Siemens Center Shanghaito be opened August 2011

Capital Market Days "Emerging Markets", Shanghai, June 28, 2011Page 17 Copyright © Siemens AG 2011. All rights reserved.
Reconciliation and Definitions forNon-GAAP Measures (I)
To supplement Siemens’ Consolidated Financial Statements presented in accordance with International Financial Reporting Standards, or IFRS, Siemens presents the following supplemental financial measures:
New orders and order backlog;Adjusted or organic growth rates of Revenue and new orders;Book-to-bill ratio;Total Sectors Profit;Return on equity (after tax), or ROE (after tax);Return on capital employed (adjusted), or ROCE (adjusted);Free cash flow and cash conversion rate, or CCR;Adjusted EBITDA, adjusted EBIT and adjusted EBITDA margins;Earnings effect from purchase price allocation , or PPA effects;Net debt; andAdjusted industrial net debt.
These supplemental financial measures are or may be “non-GAAP financial measures,” as defined in the rules of the U.S. Securities and Exchange Commission, or SEC. They may exclude or include amounts that are included or excluded, as applicable, in the calculation of the most directly comparable financial measures calculated in accordance with IFRS, and their usefulness is therefore subject to limitations, which are described below under “Limitations on the usefulness of Siemens’ supplemental financial measures.” Accordingly, they should not be viewed in isolation or as alternatives to the most directly comparable financial measures calculated in accordance with IFRS, as identified in the following discussion, and they should be considered in conjunction with Siemens’ Consolidated Financial Statements presented in accordance with IFRS and the Notes thereto. Siemens’ most recent annual Consolidated Financial Statements at any given time (the “Annual Financial Statements”) can be found in the most recent Annual Report on Form 20-F filed with the SEC (the “Annual Report”), which can also be accessed at www.siemens.com/annual-report. Siemens’ most recent interim Consolidated Financial Statements at any given time (the “Interim Financial Statements”) can be found in the most recent Interim Report on Form 6-K furnished to the SEC (the “Interim Report”), which can also be accessed at www.siemens.com/quarterly-reports. Alternatively, the reports can be found at www.siemens.com/investors under the heading “Financials.”
In addition, in considering these supplemental financial measures, investors should bear in mind that other companies that report or describe similarly titled financial measures may calculate them differently. Accordingly, investors should exercise appropriate caution in comparing these supplemental financial measures to similarly titled financial measures reported by other companies.
Definitions, most directly comparable IFRS financial measures and usefulness of Siemens’ supplemental financial measuresSiemens’ supplemental financial measures are designed to measure growth, capital efficiency, cash and profit generation and optimization of Siemens’ capital structure and therefore may be used to formulate targets for Siemens. The following discussion provides definitions of these supplemental financial measures, the most directly comparable IFRS financial measures and information regarding the usefulness of these supplemental financial measures.
New orders and order backlogUnder its policy for the recognition of new orders, Siemens generally recognizes a new order when we enter into a contract that we consider “legally effective and compulsory” based on a number of different criteria. In general, if a contract is considered legally effective and compulsory, Siemens recognizes the total contract value. The contract value is the agreed price or fee for that portion of the contract for which the delivery of goods and/or the provision of services has been irrevocably agreed. Future revenues from service, maintenance and outsourcing contracts are recognized as new orders in the amount of the total contract value only if there is adequate assurance that the contract will remain in effect for its entire duration (e.g., due to high exit barriers for the customer).New orders are generally recognized immediately when the relevant contract becomes legally effective and compulsory. The only exceptions are orders with short overall contract terms. In this case, a separate reporting of new orders would provide no significant additional information regarding our performance. For orders of this type the recognition of new orders thus occurs when the underlying revenue is recognized.

Capital Market Days "Emerging Markets", Shanghai, June 28, 2011Page 18 Copyright © Siemens AG 2011. All rights reserved.
Reconciliation and Definitions forNon-GAAP Measures (II)New orders and order backlog (continued)Order backlog represents an indicator for the future revenues of our Company resulting from already recognized new orders. Order backlog is calculated by adding the new orders of the current fiscal year to the balance of the order backlog from the prior fiscal year and by subtracting the revenue recognized in the current fiscal year. If an order from the current fiscal year is cancelled or its amount is modified, Siemens adjusts its new order total for the current quarter accordingly, but does not retroactively adjust previously published new order totals. However, if an order from a previous fiscal year is cancelled, new orders of the current quarter and, accordingly, the current fiscal year are generally not adjusted, instead, if the adjustment exceeds a certain threshold, the existing order backlog is revised. Aside from cancellations, the order backlog is also subject to changes in the consolidation group and to currency translation effects.Adjusted or organic growth rates of Revenue and new ordersSiemens presents, on a worldwide basis and for Sectors and Divisions, the percentage change from period to period in Revenue and new orders as adjusted for currency translation effects and portfolio effects. The adjusted percentage changes are called adjusted or organic growth rates. The IFRS financial measure most directly comparable to the adjusted or organic growth rate of Revenue is the unadjusted growth rate calculated based on the actual Revenue figures presented in the Consolidated Statements of Income. There is no comparable IFRS financial measure for the adjusted or organic growth rate of new orders.Siemens presents its Consolidated Financial Statements in euros; however, a significant proportion of the operations of its Sectors, Divisions and Cross-Sector Business takes place in a functional currency other than the euro and is therefore subject to foreign currency translation effects. Converting figures from these currencies into euros affects the comparability of Siemens’ results and financial position when the exchange rates for these currencies fluctuate. Some Divisions are significantly affected due to the large proportion of international operations, particularly in the U.S. In addition, the effect of acquisitions and dispositions on Siemens’ consolidated revenues and expenses affects the comparability ofthe Consolidated Financial Statements between different periods.The adjusted or organic growth rates of Revenue and new orders, as the case may be, are calculated by subtracting currency translation effects and portfolio effects from the relevant actual growth rates. The currency translation effect is calculated as (1) (a) Revenues or new orders, as the case may be, for the current period, based on the currency exchange rate of the current period minus (b) Revenues or new orders for the current period, based on the currency exchange rate of the previous period, divided by (2) Revenues or new orders for the previous period, based on the currency exchange rate of the previous period. The portfolio effect is calculated, in the case of acquisitions, as the percentage change in Revenues or new orders, as the case may be, attributable to the acquired business and, in the case of dispositions, as the percentage change in Revenues or new orders on the assumption that the disposed business had not been part of Siemens in the previous period. Portfolio effects are always considered in the calcuation of adjusted or organic growth rates for a period of twelve months. Siemens is making portfolio adjustments for certain carve-in and carve-out transactions, including the carve-outs of Siemens Home and Office Communication Devices GmbH & Co. KG and the Wireless Modules business, as well as for other minor transactions and reclassifications in the Sectors, Cross-Sector Business and Centrally managed portfolio activities. For further information regarding major acquisitions and dispositions, see “Notes to Consolidated Financial Statements” in the Annual Report or in the Interim Report.Siemens believes that the presentation of an adjusted or organic growth rate of Revenue and new orders provides useful information to investors because a meaningful analysis of trends in Revenue and new orders from one period to the next requires comparable data and therefore an understanding of the developments in the operational business net of the impact of currency translation and portfolio effects. Siemens’ management considers adjusted or organic rates of growth in its management of Siemens’ business. For this reason, Siemens believes that investors’ ability to assess Siemens’ overall performance may be improved by disclosure of this information.Book-to-bill ratioThe book-to-bill ratio measures the relationship between orders received and the amount of products and services shipped and billed. A book-to-bill ratio of above 1 indicates that more orders were received than billed, indicating stronger demand, whereas a book-to-bill ratio of below 1 points to weaker demand. The book-to-bill ratio is not required or defined by IFRS.Total Sectors ProfitSiemens uses Total Sectors Profit to measure the sum of Profit of the three Sectors Industry, Energy and Healthcare. Profit of the Sectors is earnings before financing interest, certain pension costs and income taxes. Certain other items not considered performance indicative by management may be excluded. Profit or loss for each reportable segment is the measure reviewed by the chief operating decision maker in accordance with IFRS 8, “Operating Segments.” The IFRS financial measure most directly comparable to Total Sectors Profit is Income from continuing operations.Siemens believes that investors’ ability to assess Siemens’ overall performance may be improved by disclosure of Total Sectors Profit as a measure of the operational performance of the three Sectors representing the core industrial activities of Siemens.

Capital Market Days "Emerging Markets", Shanghai, June 28, 2011Page 19 Copyright © Siemens AG 2011. All rights reserved.
Reconciliation and Definitions forNon-GAAP Measures (III)
Return on equity (after tax), or ROE (after tax)In line with common practice in the financial services industry, Financial Services, or SFS uses return on equity (after tax), or ROE (after tax), as one of its key (after tax) profitability measures. Starting with fiscal 2011, we define ROE (after tax) as SFS Profit after tax (annualized for purposes of interim reporting), divided by SFS average allocated equity. SFS Profit as reported in the Segment Information is defined as Income before income taxes, or IBIT. For purposes of calculating ROE (after tax), however, the relevant income taxes are calculated on a simplified basis, by applying an assumed flat tax rate of 30% to SFS Profit, excluding Income (loss) from investments accounted for using the equity method, net, which is basically net of tax already, and tax-free income components and other components which have already been taxed or are basically tax free. The allocated equity for SFS is determined and influenced by the size and quality of its portfolio of commercial finance assets (primarily leases and loans) and equity investments. This allocation is designed to cover the risks of the underlying business and is in line with common credit risk management standards in banking and applicable regulatory requirements, respectively. The actual risk of the SFS portfolio is evaluated and controlled monthly and is reflected in the quarterly (commercial finance) and annual (equity investments) adjustments of allocated equity.ROE (after tax) is reported only for the SFS segment. Siemens believes that the presentation of ROE (after tax) and average allocated equity provides useful information to investors because management uses ROE (after tax) as a supplement to Siemens’ Consolidated Financial Statements in evaluating the business performance of SFS, and therefore the measure could assist investors in assessing Siemens’ overall performance.
ROCE (adjusted)Return on capital employed (adjusted), or ROCE (adjusted), is Siemens’ measure of capital efficiency and sustainable value creation. Siemens presents ROCE (adjusted) at the Siemens group level and uses this financial performance ratio in order to assess its income generation from the point of view of its shareholders and creditors, who provide Siemens with equity and debt. Siemens believes that the presentation of ROCE (adjusted) and the various supplemental financial measures involved in its calculation provides useful information to investors because ROCE (adjusted) can be used to determine whether capital invested in the Company yields competitive returns. In addition, achievement of predetermined targets relating to ROCE (adjusted) is one of the factors Siemens takes into account in determining the amount of performance-based compensation received by its management.
ROCE (adjusted) at the Siemens group level on a continuing operations basisIncome from continuing operations before interest after tax, the numerator in the ROCE (adjusted) (continuing operations) calculation, is defined as Income from continuing operations, excluding Other interest income (expense), net (but not Other interest income (expense) of SFS) (both as reported in “Consolidated Financial Statements” or in the “Notes to Consolidated Financial Statements” in the Annual Report or Interim Report), and excluding interest cost on Pension plans and similar commitments and taxes thereon. SFS Other income (expense) is included in Other interest income (expense), net. Adding back SFS Other income (expense) in the numerator corresponds to the adjustment for SFS debt in the denominator. For fiscal 2011 and 2010, interest cost on Pension plans and similar commitments is calculated using the weighted average discount rate of our principal pension benefit plans at period-end for the fiscal year ended September 30, 2010 (4.2%) and for the fiscal year ended September 30, 2009 (5.3%) (both as reported in “Notes to Consolidated Financial Statements” in the Annual Report 2010) applied to Pension plans and similar commitments as reported in the “Consolidated Statements of Financial Position” as of September 30, 2010 and 2009, respectively. Pension plans and similar commitments primarily represents the funded status of pension plans and other post-employment benefits as well as the liabilities for other long-term post-employment benefits and for deferred compensation.Average capital employed (continuing operations), or CE (continuing operations), the denominator in the ROCE (adjusted) calculation, is defined as the average of Total equity plus Long-term debt, plus Short-term debt and current maturities of long-term debt, less Cash and cash equivalents, plus Pension plans and similar commitments, less SFS Debt, less Fair value hedge accounting adjustment and less Assets classified as held for disposal presented as discontinued operations, net of Liabilities associated with assets held for disposal presented as discontinued operations . For further information on fair value hedges, see “Adjusted industrial net debt” within this document and “Notes to Consolidated Financial Statements” in the Annual Report. Each of the components of capital employed appears on the face of the “Consolidated Statements of Financial Position” or in the “Notes to Consolidated Financial Statements” or in the relevant tables of Item 5: “Operating and financial review and prospects” in the Annual Report or in the “Interim group management report” of the Interim Report.
ROCE (adjusted) at the Siemens group level on a continuing and discontinued operations basisSiemens also presents group ROCE (adjusted) on a continuing and discontinued operations basis. For this purpose, the numerator is Income before interest after tax and the denominator is CE (continuing operations) plus Assets classified as held for disposal presented as discontinued operations, net of Liabilities associated with assets held for disposal presented as discontinued operations.

Capital Market Days "Emerging Markets", Shanghai, June 28, 2011Page 20 Copyright © Siemens AG 2011. All rights reserved.
Reconciliation and Definitions forNon-GAAP Measures (IV)
Free cash flow and cash conversion rateSiemens defines Free cash flow as Net cash provided by (used in) operating activities less Additions to intangible assets and property, plant and equipment. The IFRS financial measure most directly comparable to Free cash flow is Net cash provided by (used in) operating activities.Siemens believes that the presentation of Free cash flow provides useful information to investors because it is a measure of cash generated by our operations after deducting cash outflows for Additions to intangible assets and property, plant and equipment. Therefore, the measure gives an indication of the long-term cash generating ability of our business. In addition, because Free cash flow is not impacted by portfolio activities, it is less volatile than the total of Net cash provided by (used in) operating activities and Net cash provided by (used in) investing activities. For this reason, Free cash flow is reported on a regular basis to Siemens’ management, who uses it to assess and manage cash generation among the various reportable segments of Siemens and for the worldwide Siemens group. Achievement of predetermined targets relating to Free cash flow generation is one of the factors Siemens takes into account in determining the amount of performance-based compensation received by its management, both at the level of the worldwide Siemens group and at the level of individual reportable segments. Cash conversion rate, or CCR, is defined as Free cash flow divided by Net income. Siemens believes that the presentation of the CCR provides useful information to investors because it is an operational performance measure that shows how much of its income Siemens converts into Free cash flow. CCR is reported on a regular basis to Siemens’management.
Adjusted EBITDA, adjusted EBIT and adjusted EBITDA margins
Adjusted EBITDA and adjusted EBIT at the Siemens group levelSiemens reports adjusted EBITDA and adjusted EBIT on a continuing basis. Siemens defines adjusted EBITDA as adjusted EBIT before amortization (which in turn is defined as Amortization and impairments of intangible assets other than goodwill) and Depreciation and impairment of property, plant and equipment and goodwill. Siemens defines adjusted EBIT as Income from continuing operations before income taxes less Other financial income (expense), net, plus Interest expense, less Interest income, as well as less Income (loss) from investments accounted for using the equity method, net. Each of the components of adjusted EBIT appears on the face of the “Consolidated Financial Statements,” and each of the additional components of adjusted EBITDA appears in the “Consolidated Financial Statements” in the Annual Report or Interim Report and in “—Reconciliation to adjusted EBITDA (continuing operations)” within Item 5: “Operating and financial review and prospects” of the Annual Report on Form 20-F, within “Interim group management report” in the Interim Report or within this document for the current quarter. We disclose adjusted EBITDA and EBIT as supplemental non-GAAP financial performance measures, as we believe they are useful metrics by which to compare the performance of our business from period to period. We understand that these measures are broadly used by analysts, rating agencies and investors in assessing our performance. The IFRS financial measure most directly comparable to adjusted EBIT and adjusted EBITDA is Net income.Adjusted EBITDA is included in the ratio of adjusted industrial net debt to adjusted EBITDA, a measure of our capital structure. Measures similar to adjusted EBITDA and adjusted EBIT are also broadly used by analysts, rating agencies and investors to assess the performance of a company. Accordingly, Siemens believes that the presentation of adjusted EBITDA and adjusted EBIT provides useful information to investors. For further information regarding the ratio of adjusted industrial net debt to adjusted EBITDA, see “—Adjusted industrial net debt.”
Adjusted EBITDA and adjusted EBIT at the Sector level Siemens also presents adjusted EBITDA and adjusted EBIT on the Sector level on a continuing basis. Siemens defines adjusted EBITDA on the Sector level as adjusted EBIT before amortization (which in turn is defined as Amortization and impairments of intangible assets other than goodwill) and Depreciation and impairment of property, plant and equipment and goodwill on the Sector level. Siemens defines adjusted EBIT on the Sector level as Profit as presented in the Segment Information less Other financial income (expense), net, plus Interest expense, less Interest income, as well as less Income (loss) from investments accounted for using the equity method, net. Each of the components of adjusted EBITDA and adjusted EBIT on the level of each Sector, respectively, is presented in the table “— Reconciliation to adjusted EBITDA (continuing operations)” within Item 5: “Operating and financial review and prospects” of the Annual Report, within “Interim group management report” in the Interim Report or within this document for the current quarter. The IFRS financial measure most directly comparable to adjusted EBITDA and adjusted EBIT on the Sector level is Profit of the relevant Sector as presented in the “Notes to Consolidated Financial Statements” in the Annual Report or Interim Report.Accordingly, we believe that reporting adjusted EBITDA and adjusted EBIT on a segment level enhances the ability of investors to compare performance across segments.

Capital Market Days "Emerging Markets", Shanghai, June 28, 2011Page 21 Copyright © Siemens AG 2011. All rights reserved.
Reconciliation and Definitions forNon-GAAP Measures (V)
Adjusted EBITDA margins at the Sector levelSiemens defines adjusted EBITDA margins on the Sector level as the ratio of adjusted EBITDA to revenue (as presented in the “Notes to Consolidated Financial Statements”). Siemens intends to maintain and further improve the profitability of its businesses and to achieve margins on the level of the best competitors in our industries – throughout the complete business cycle. Accordingly, within One Siemens we defined adjusted EBITDA margin ranges for the respective industries of our three Sectors. Siemens believes that the presentation of adjusted EBITDA margins as a part of One Siemens provides useful information on how successfully Siemens operated in its markets and enhances the ability of investors to compare profitability across segments.
Earnings effect from purchase price allocationThe purchase price paid for an acquired business is allocated to the assets, liabilities and contingent liabilities acquired based on their fair values. The fair value step-ups result in an earnings effect over time, e.g. additional amortization of fair value step-ups of intangible assets, which is defined as PPA effects. Siemens believes that the presentation of PPA effects provides useful information to investors as it allows investors to consider earnings impacts related to business combination accounting in the performance analysis.
Net debtSiemens defines net debt as total debt less total liquidity. Total debt is defined as Short-term debt and current maturities of long-term debt plus Long-term debt. Total liquidity is defined as Cash and cash equivalents plus current Available-for-sale financial assets. Each of these components appears in the Consolidated Statements of Financial Position. The IFRS financial measure most directly comparable to net debt is the total of Short-term debt and current maturities of long-term debt and Long-term debt as reported in the Notes to Consolidated Financial Statements.Siemens believes that the presentation of net debt provides useful information to investors because its management reviews net debt as part of its management of Siemens’ overall liquidity, financial flexibility, capital structure and leverage. In particular, net debt is an important component of adjusted industrial net debt. Furthermore, certain debt rating agencies, creditors and credit analysts monitor Siemens’ net debt as part of their assessments of Siemens’ business.
Adjusted industrial net debtWithin One Siemens, we manage adjusted industrial net debt as one component of our capital. Siemens defines adjusted industrial net debt as net debt less SFS Debt; less 50% of the nominal amount of our hybrid bond, plus Pension plans and similar commitments (as presented in the “Consolidated Financial Statements”), plus credit guarantees; and less fair value hedge accounting adjustments. The adjustment for our hybrid bond considers the calculation of this financial ratio applied by rating agencies to classify 50% of our hybrid bond as equity and 50% as debt. This assignment follows the characteristics of our hybrid bond such as a long maturity date and subordination to all senior and debt obligations. Debt is generally reported with a value representing approximately the amount to be repaid. However for debt designated in a hedging relationship (fair value hedges), this amount is adjusted by changes in market value mainly due to changes in interest rates. Accordingly, we deduct these changes in market value in order to end up with an amount of debt that approximately will be repaid, which we believe is a more meaningful figure for the calculation. For further information on fair value hedges see, “Notes to Consolidated Financial Statements” in the Annual Report. Further information concerning adjusted industrial net debt can be found in Item 5: “Operating and financial review and prospects – Liquidity and capital resources – Capital structure” in the Annual Report or in “Liquidity, capital resources and requirements” within “Interim group management report” in the Interim Report.A key consideration in managing our capital structure is the maintenance of ready access to the capital markets through various debt products and the preservation of our ability to repay and service our debt obligations over time. In order to assist it in managing its business and achieving these goals. Siemens has therefore set a capital structure target that is measured by adjusted industrial net debt divided by adjusted EBITDA. We believe that adopting a metric comparing our earnings-based performance relative to our indebtedness (“leverage”) assists us in managing our business to achieve these goals. We have selected adjusted EBITDA from continuing operations as the performance element of the metric because we believe our earnings-based performance is a key determinant of the willingness of lenders to provide us with debt on favorable conditions and our ability to meet our debt obligations in future periods. Siemens believes that using the ratio of adjusted industrial net debt to adjusted EBITDA as a measure of its capital structure provides useful information to investors because management uses it to manage our debt-equity ratio in order to promote access to debt financing instruments in the capital markets and our ability to meet scheduled debt service obligations.

Capital Market Days "Emerging Markets", Shanghai, June 28, 2011Page 22 Copyright © Siemens AG 2011. All rights reserved.
Reconciliation and Definitions forNon-GAAP Measures (VI)
Limitations on the usefulness of Siemens’ supplemental financial measuresThe supplemental financial measures reported by Siemens may be subject to limitations as analytical tools. In particular:
With respect to new orders and order backlog: In particular, new order reporting for the current period may include adjustments to new orders added in previous quarters of the current fiscal year and prior fiscal years (except for cancellations). Order backlog is based on firm commitments which may be cancelled in future periods. There is no standard system for compiling and calculating new orders and order backlog information that applies across companies. Accordingly, Siemens’ new orders and order backlog may not be comparable with new orders and order backlog as reported by other companies. Siemens subjects its new orders and its order backlog to internal documentation and review requirements. Siemens may change its policies for recognizing new orders and order backlog in the future without prior notice. With respect to adjusted or organic growth rates of Revenue and new orders: These measures are not adjusted for other effects, such as increases or decreases in prices or quantity/volume.With respect to book-to-bill ratio: The use of this measure is inherently limited by the fact that it is a ratio and thus does not provide information as to the absolute number of orders received by Siemens or the absolute amount of products and services shipped and billed by it.With respect to Total Sectors Profit: Profit of Equity Investments, Cross-Sector Business, Centrally managed portfolio activities, Siemens Real Estate, Corporate items and pensions as well as of Eliminations, Corporate Treasury and other reconciling items can have a material impact on Siemens’ Income from continuing operations in any given period. In addition, Total Sectors Profit does not eliminate profit earned by one Sector on intragroup transactions with another Sector.With respect to ROE (after tax): as defined and as reported in the “Notes to Consolidated Financial Statements,” SFS Profit after tax (used in the numerator) may exclude certain items not considered performance indicative by management. The relevant income taxes used to derive SFS Profit after tax are calculated by applying an assumed flat tax rate to SFS Profit, excluding Income (loss) from investments accounted for using the equity method, which are net of tax already, and tax-free income components derived from financing products. Accordingly, the actual amount of income taxes payable is likely to vary from the amount calculated by means of this simplified procedure. In addition, the use of ROE (after tax) is inherently limited by the fact that it is a ratio and thus does not provide information as to the absolute amount of Siemens’ income.With respect to ROCE (adjusted): The use of this measure is inherently limited by the fact that it is a ratio and thus does not provide information as to the absolute amount of Siemens’ income.With respect to Free cash flow and CCR: Free cash flow is not a measure of cash generated by operations that is available exclusively for discretionary expenditures. This is, because in addition to capital expenditures needed to maintain or grow its business, Siemens requires cash for a wide variety of non-discretionary expenditures, such as interest and principal payments on outstanding debt, dividend payments or other operating expenses. In addition, the use of CCR is inherently limited by the fact that it is a ratio and thus does not provide information about the amount of Siemens’ Free cash flow or cash generated by operations.With respect to adjusted EBITDA, adjusted EBIT and adjusted EBITDA margins: As adjusted EBITDA excludes non-cash items such as depreciation, amortization and impairment, it does not reflect the expense associated with, and accordingly the full economic effect of, the loss in value of Siemens’ assets over time. Similarly, neither adjusted EBITDA, adjusted EBIT nor adjusted EBITDA margins reflects the impact of Other financial income (expense), net, Interest expense, Interest income, Income (loss) from investments accounted for using the equity method, net and Income taxes.With respect to PPA effects: The fact that these effects are stated separately does not mean that they do not impact profit of the relevant segment in the “Consolidated Financial Statements.”With respect to net debt and the ratio of adjusted industrial net debt to adjusted EBITDA: Siemens typically uses a considerable portion of its cash, cash equivalents and available-for-sale financial assets at any given time for purposes other than debt reduction. Therefore, the fact that these items are excluded from net debt does not mean that they are used exclusively for debt repayment. The use of the ratio adjusted industrial net debt to adjusted EBITDA is inherently limited by the fact that it is a ratio.
Compensation for limitations associated with Siemens’ supplemental financial measuresInformation regarding the quantitative reconciliation of each supplemental financial measure to the most directly comparable IFRS financial measures are available on Siemens’Investor Relations website at www.siemens.com/nonGAAP. Siemens encourages investors to review these reconciliations carefully.
Capital Market Days "Emerging Markets", Shanghai, June 28, 2011Page 23 Copyright © Siemens AG 2011. All rights reserved.
Revenue growth - Performance against competitionDefinition
Revenue growth - Performance against competitionTo illustrate management’s perspective on the Company’s performance against competition, Siemens compares its own revenue growth rate with the weighted average revenue growth rate of its Sectors’ most relevant competitors, including, among others, ABB, GE, Philips, Rockwell and Schneider. Revenue growth for Siemens and its competitors is calculated as the actual growth rate over a rolling four quarter period compared to the same period a year earlier. Siemens competitors revenue growth is derived as the weighted average growth rate of dedicated competitor baskets defined for each Siemens Sector. Each Sector basket's growth rate is based upon the most recent reported competitor revenues publicly available at the time of calculation. The Sector competitor baskets revenue growth rates are weighted by the revenue of the respective Siemens Sector.
This measure may provide useful information to investors with respect to management’s view on Siemens’ growth compared to competitor growth. However, we caution investors, that this measure is subject to certain limitations, which include the following: The metric is defined by Siemens and, as such, is not based on a generally accepted framework that is also relevant for other companies; accordingly, other companies may define a similarly titled measure differently. In calculating this measure, Siemens relies on data published by its competitors for which Siemens assumes no responsibility. In addition, the data may not be directly comparable as a result of differing presentation currencies and reporting standards being used by our competitors in the data’s presentation. Furthermore, subject to limited exceptions, no adjustments are made for currency translation effects, portfolio changes and changes in reporting structure for either the Siemens or the competitor data. Because the public availability of relevant competitors’ data at the time of calculation may not coincide with the availability of Siemens’ data, some competitor data used may relate to a different time period than the Siemens data.