s.id.1, s.id.2, s.id.3, s.id.5, s.id.6, s.id.8 the ... · assessment title: the hunger games...
TRANSCRIPT
S.ID.1, S.ID.2, S.ID.3, S.ID.5, S.ID.6, S.ID.8
In this experiment, we will investigate and make observations on our favorite colors of Skittles® and
the amount of each color that is found in a bag.
PART 1: One Variable Statistics
I CAN calculate the central tendencies of Skittle colors & represent the data in many ways.
I CAN compare box plots and draw conclusions.
PART A: Collect the Data on Favorite Colors
Go to the board and rate your favorite color of Skittles. After every student has gone to the board,
record the sum for each color below.
Red:
Orange:
Yellow:
Green:
Purple:
1. What was the most popular Skittle? What was the least popular Skittle?
2. Are there any outliers? Explain.
3. Do you feel that there is a relationship between our favorite Skittle and the amount that we
will find in each bag? Explain.
The Distribution of the Rainbow
Top Rated Skittles Colors of the Class
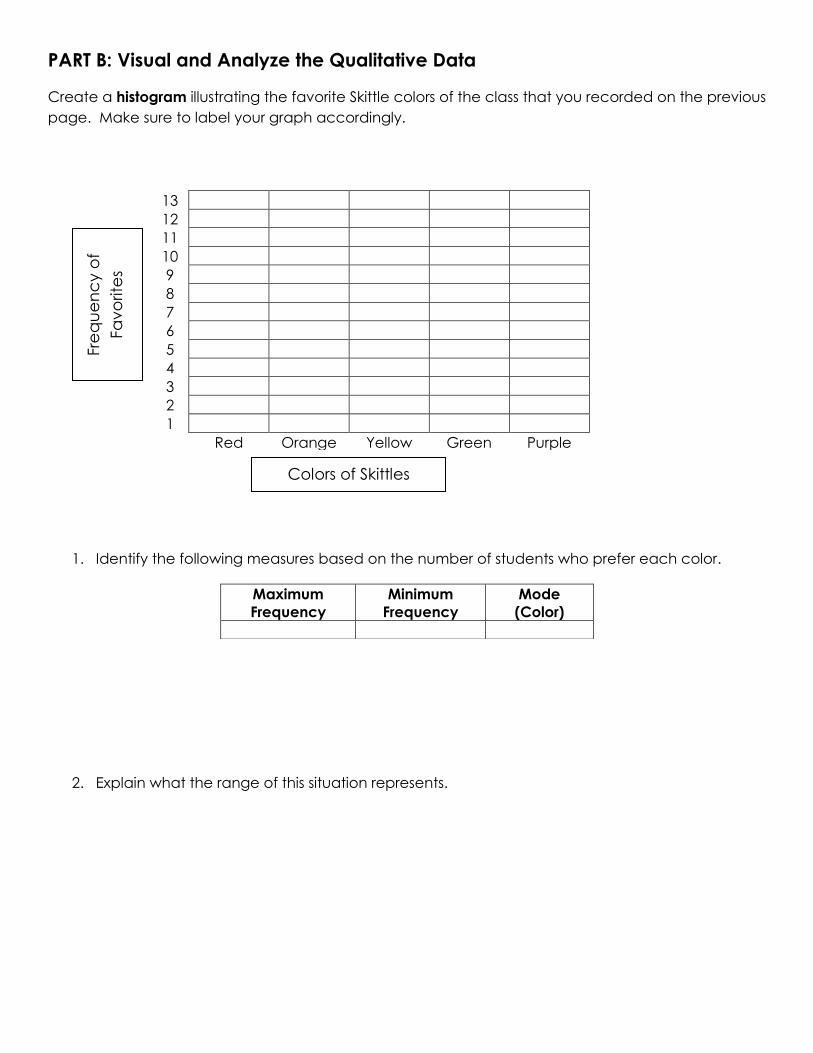
PART B: Visual and Analyze the Qualitative Data
Create a histogram illustrating the favorite Skittle colors of the class that you recorded on the previous
page. Make sure to label your graph accordingly.
1. Identify the following measures based on the number of students who prefer each color.
2. Explain what the range of this situation represents.
13
12
11
10
9
8
7
6
5
4
3
2
1
Red Orange Yellow Green Purple
Maximum
Frequency
Minimum
Frequency
Mode
(Color)
Colors of Skittles
Fre
qu
en
cy o
f
Fa
vo
rite
s
PART C: Collecting Data on the Distribution of the Colors
1. Open your bag of Skittles and record how many of each color is in your bag.
Total Colors of Skittles Counted from Your Bag
Red: Orange: Yellow: Green: Purple: Total:
2. Find members of your class with the same color sheet as you, collect the necessary
data for your color and complete the information.
Red
Student Name Number of my color in the bag
Color Group Data
Orange
Student Name Number of my color in the bag
Color Group Data
Gre
G
Yellow
Student Name Number of my color in the bag
Color Group Data
Green
Student Name Number of my color in the bag
Color Group Data
Purple
Student Name Number of my color in the bag
Color Group Data
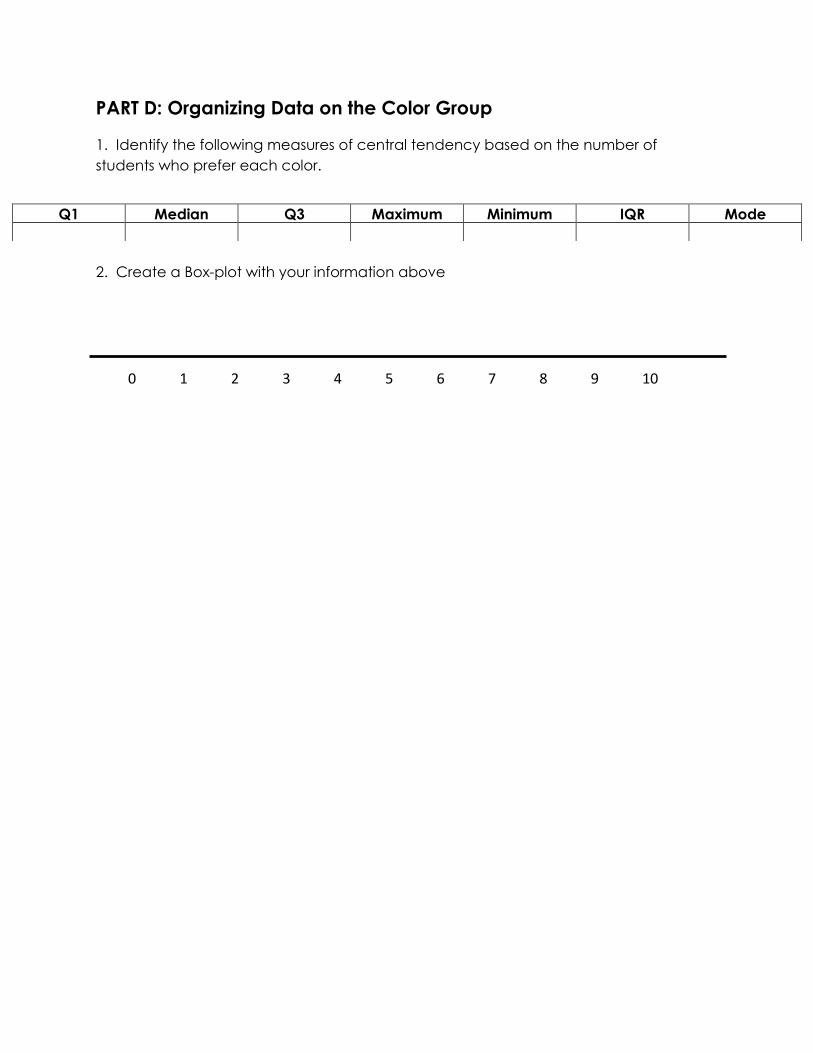
PART D: Organizing Data on the Color Group
1. Identify the following measures of central tendency based on the number of
students who prefer each color.
2. Create a Box-plot with your information above
Q1 Median Q3 Maximum Minimum IQR Mode
0 1 2 3 4 5 6 7 8 9 10
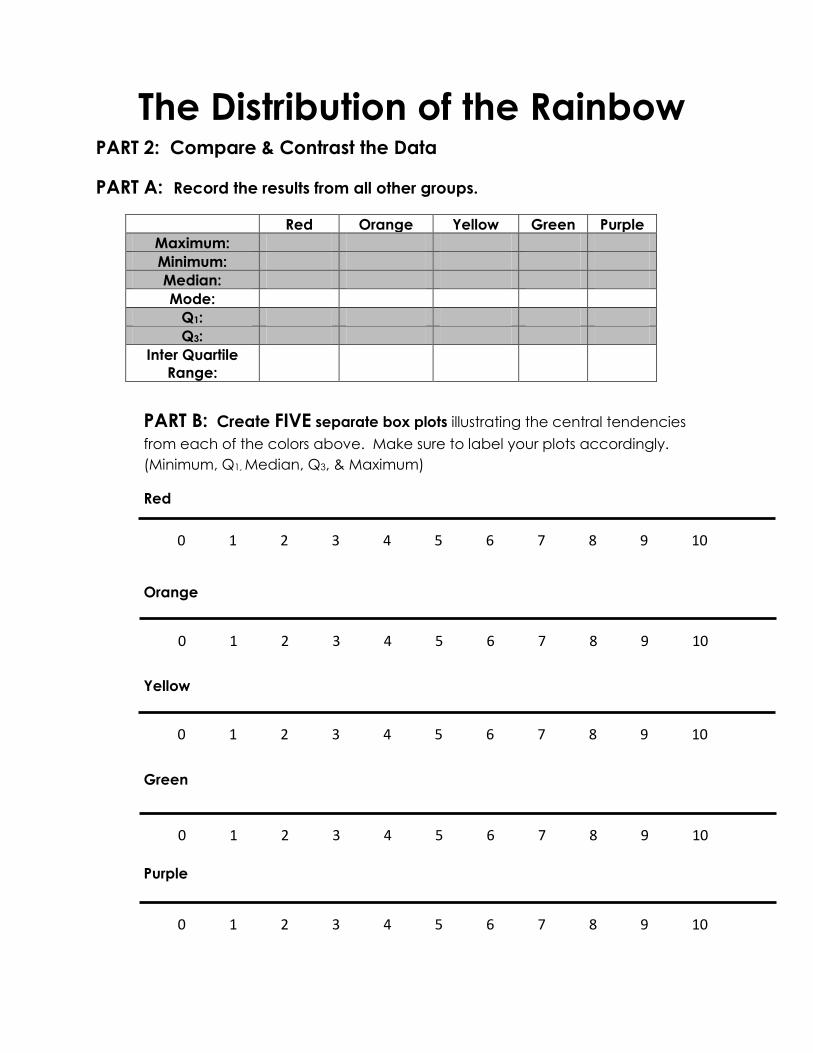
PART 2: Compare & Contrast the Data
PART A: Record the results from all other groups.
Red Orange Yellow Green Purple
Maximum:
Minimum:
Median:
Mode:
Q1:
Q3:
Inter Quartile
Range:
PART B: Create FIVE separate box plots illustrating the central tendencies
from each of the colors above. Make sure to label your plots accordingly.
(Minimum, Q1, Median, Q3, & Maximum)
Red
Orange
Yellow
Green
Purple
The Distribution of the Rainbow
0 1 2 3 4 5 6 7 8 9 10
0 1 2 3 4 5 6 7 8 9 10
0 1 2 3 4 5 6 7 8 9 10
0 1 2 3 4 5 6 7 8 9 10
0 1 2 3 4 5 6 7 8 9 10
Math 2 S.CP.3, S.CP.5, S.CP.6 Assessment Title: The Hunger Games Probability
Unit 8: Probability
PART C: ANALYZE THE DATA
1. Compare and contrast the data from your color and the other colors? Describe
your observations.
2. Do you feel there is a correlation between the colors of Skittles distributed vs. the
colors that are favored by the consumer? Explain.
3. If you were the distributor, how can you utilize statistics to help you ensure
customer satisfaction?
4. Do you feel the data you collected accurately represents the most popular
Skittles flavors among all consumers? Explain your reasoning.
Math 2 S.CP.3, S.CP.5, S.CP.6 Assessment Title: The Hunger Games Probability
Unit 8: Probability
Distracted driving
Are drivers more distracted when using a cell phone than when talking to a passenger in the car?
Researchers wanted to find out, so they designed an experiment. Here are the details.
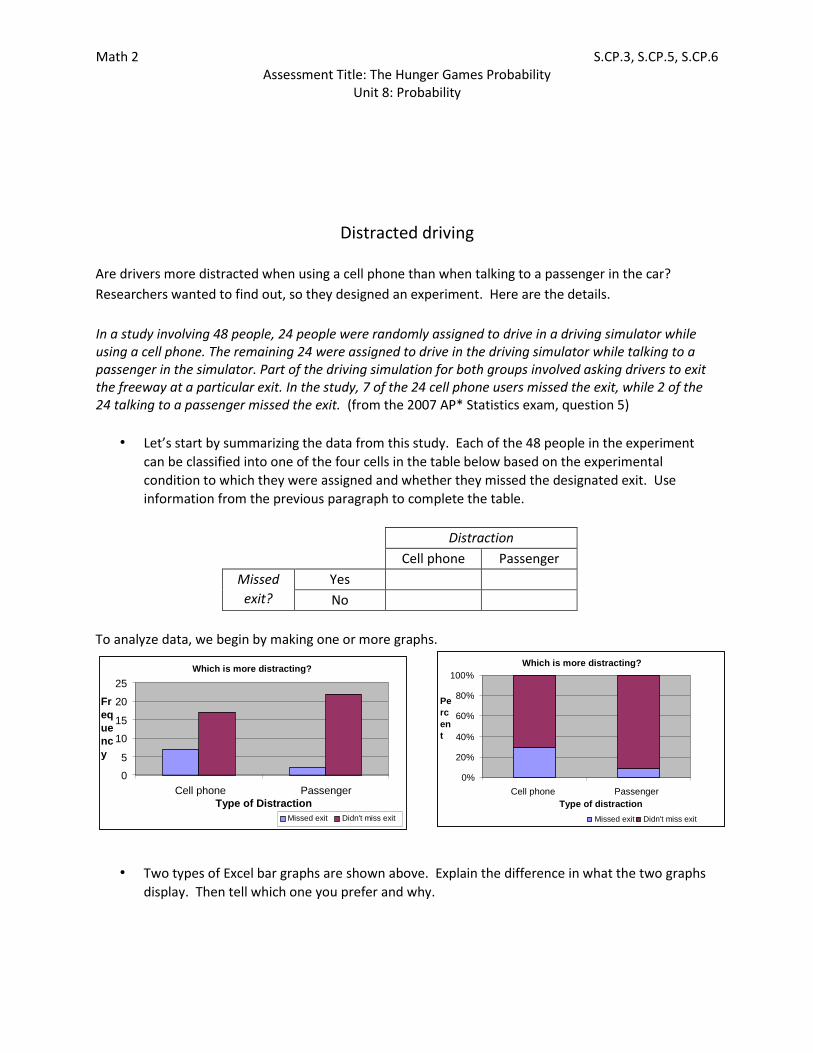
In a study involving 48 people, 24 people were randomly assigned to drive in a driving simulator while using a cell phone. The remaining 24 were assigned to drive in the driving simulator while talking to a passenger in the simulator. Part of the driving simulation for both groups involved asking drivers to exit the freeway at a particular exit. In the study, 7 of the 24 cell phone users missed the exit, while 2 of the 24 talking to a passenger missed the exit. (from the 2007 AP* Statistics exam, question 5)
• Let’s start by summarizing the data from this study. Each of the 48 people in the experiment
can be classified into one of the four cells in the table below based on the experimental
condition to which they were assigned and whether they missed the designated exit. Use
information from the previous paragraph to complete the table.
Distraction
Cell phone Passenger
Missed
exit?
Yes
No
To analyze data, we begin by making one or more graphs.
• Two types of Excel bar graphs are shown above. Explain the difference in what the two graphs
display. Then tell which one you prefer and why.
Which is more distracting?
0 5
10 15 20 25
Cell phone Passenge r Type of Distraction
Fr
eq
ue
nc
y
Missed exit Didn't miss exit
Which is more distracting?
% 0
20 %
40 %
60 %
% 80
% 100
Cell phone Passenger Type of distraction
Pe
rc
en
t
Missed exit Didn't miss exit
Math 2 S.CP.3, S.CP.5, S.CP.6 Assessment Title: The Hunger Games Probability
Unit 8: Probability
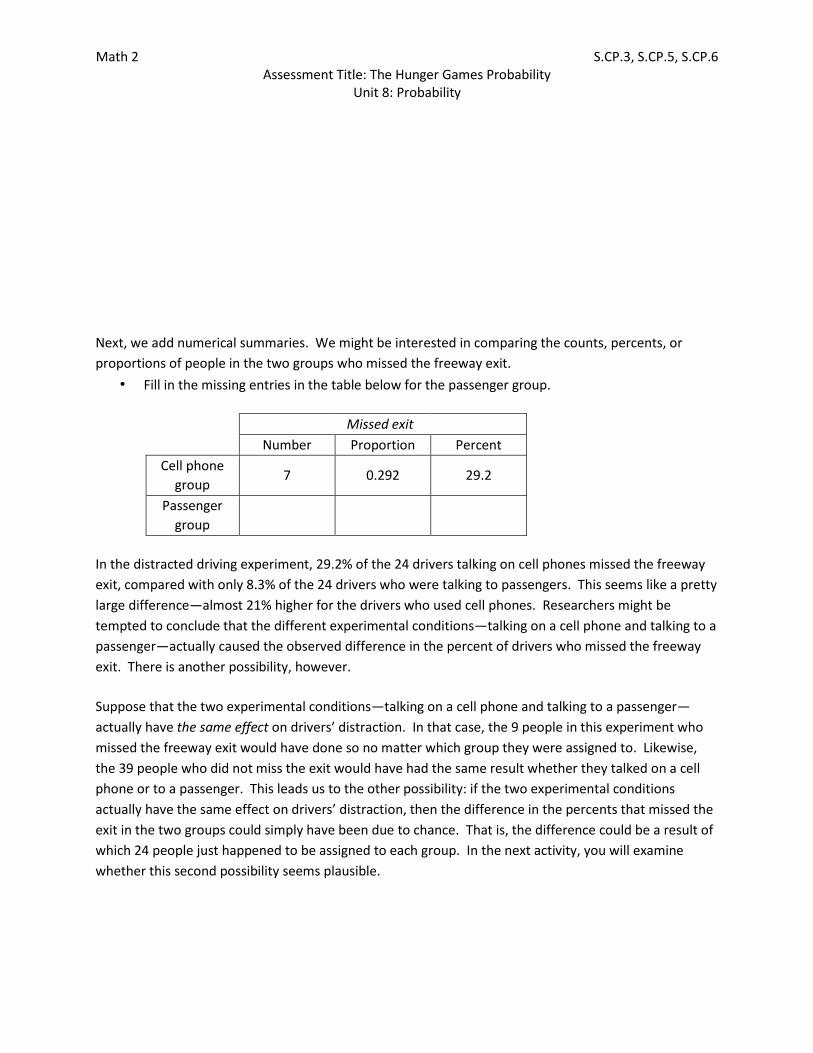
Next, we add numerical summaries. We might be interested in comparing the counts, percents, or
proportions of people in the two groups who missed the freeway exit.
• Fill in the missing entries in the table below for the passenger group.
Missed exit
Number Proportion Percent
Cell phone
group 7 0.292 29.2
Passenger
group
In the distracted driving experiment, 29.2% of the 24 drivers talking on cell phones missed the freeway
exit, compared with only 8.3% of the 24 drivers who were talking to passengers. This seems like a pretty
large difference—almost 21% higher for the drivers who used cell phones. Researchers might be
tempted to conclude that the different experimental conditions—talking on a cell phone and talking to a
passenger—actually caused the observed difference in the percent of drivers who missed the freeway
exit. There is another possibility, however.
Suppose that the two experimental conditions—talking on a cell phone and talking to a passenger—
actually have the same effect on drivers’ distraction. In that case, the 9 people in this experiment who
missed the freeway exit would have done so no matter which group they were assigned to. Likewise,
the 39 people who did not miss the exit would have had the same result whether they talked on a cell
phone or to a passenger. This leads us to the other possibility: if the two experimental conditions
actually have the same effect on drivers’ distraction, then the difference in the percents that missed the
exit in the two groups could simply have been due to chance. That is, the difference could be a result of
which 24 people just happened to be assigned to each group. In the next activity, you will examine
whether this second possibility seems plausible.
Math 2 S.CP.3, S.CP.5, S.CP.6 Assessment Title: The Hunger Games Probability
Unit 8: Probability
Activity: Could the observed difference be due to the chance assignment of people to groups? Materials: Standard deck of playing cards for each group of 3-4 students
What would happen if we reassigned the 48 people in this experiment to the cell phone and passenger
groups many times, assuming that the group assignment had no effect on whether each driver missed
the exit? Let’s try it and see.
1. Get a standard deck of playing cards from your teacher. Make sure that your deck has 52 cards,
not including jokers.
2. We need 48 cards to represent the 48 drivers in this study. In the original experiment, 9 people
missed the exit and 39 people didn’t miss the exit. If the group assignment had no effect on drivers’
distraction, these results wouldn’t change if we reassigned 24 people to each group at random. For a
physical simulation of these reassignments, we need 9 cards to represent the people who will miss the
exit and 39 cards to represent the people who won’t miss the exit. With your group members, discuss
which cards should represent which outcomes. When you have settled on a plan, designate one
member of your group to share your plan with the class.
3. After each group presents its plan, the class as a whole will decide which plan to use. Record
the details here.
Math 2 S.CP.3, S.CP.5, S.CP.6 Assessment Title: The Hunger Games Probability
Unit 8: Probability
4. Now you’re ready to simulate the process of reassigning people to groups. “Shuffle up and
deal” two piles of 24 cards—the first pile representing the cell phone group and the second pile
representing the passenger group. Record the number of drivers who missed the exit in each group.
5. Repeat this process 9 more times so that you have a total of 10 trials. Record your results in the
table provided.
Trial Number who missed exit in
cell phone group
Number who missed exit in
passenger group
1
2
3
4
5
6
7
8
9
10
In the original experiment, 7 of the 24 drivers using cell phones missed the freeway exit, compared to
only 2 of the 24 drivers who were talking to a passenger. How surprising would it be to get a difference
this large or larger simply due to chance if the effects of the two experimental conditions on drivers’
distraction were actually the same? You can estimate the chance of this happening with the results of
your simulation.
6. In how many of your 10 simulation trials did 7 or more drivers in the cell phone group miss the
exit? Why don’t you need to consider the number of people in the “talking to a passenger group” who
missed the exit?
Math 2 S.CP.3, S.CP.5, S.CP.6 Assessment Title: The Hunger Games Probability
Unit 8: Probability
7. Combine results with your classmates. In what percent of the class’s simulation trials did 7 or
more people in the cell phone group miss the freeway exit?
8. Based on the class’s simulation results, do you think it’s possible that cell phones and
passengers are equally distracting to drivers, and that the difference observed in the original experiment
could have been due to the chance assignment of people to the two groups? Why or why not?
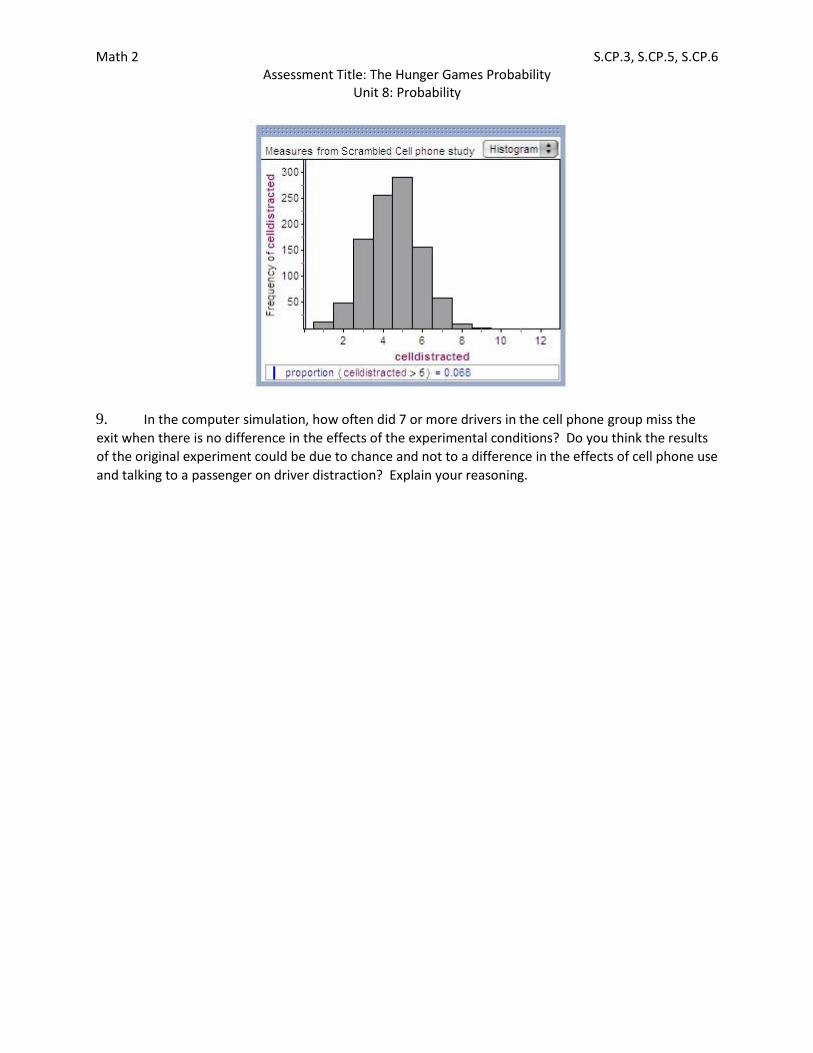
Here are the results of 1000 trials of a computer simulation, like the one you did with the playing cards,
showing the number of drivers who missed the exit in the cell phone group.
Math 2 S.CP.3, S.CP.5, S.CP.6 Assessment Title: The Hunger Games Probability
Unit 8: Probability
9. In the computer simulation, how often did 7 or more drivers in the cell phone group miss the
exit when there is no difference in the effects of the experimental conditions? Do you think the results
of the original experiment could be due to chance and not to a difference in the effects of cell phone use
and talking to a passenger on driver distraction? Explain your reasoning.
Math 2 S.CP.3, S.CP.5, S.CP.6 Assessment Title: The Hunger Games Probability
Unit 8: Probability
Introduction:
In the book and movie series, The Hunger Games ©, the author sets up a futuristic society that is
separated into 12 districts and a capital. A rule of this society is that each of the 12 districts has to
provide one male and one female tribute from the ages of 12-18 to fight to the death in an arena each
year.
Only one individual from the tribute pool will survive the games and be crowned the champion. The
individuals are chosen during a ceremony called “The Reaping.” The reaping process is as follows:
- When an individual turns 12, their name is placed into the drawing one time
- Every birthday afterwards, their name is added into the drawing one additional time so, at the
very least, an 18 year old would have their name in the drawing 7 times
- If an individual chooses to, they may exchange additional entries into the drawing for rations
(food). Generally, the poorer a person is, the more entries that person has in the drawing
This year, the following entry count for District 12 was obtained:
a. There are 252 children between the ages of 12-18
b. There are 784 names in the female drawing
c. There are 978 names in the male drawing
Part I: Let’s use the above situation and this year’s entry data to calculate some probabilities:
1. Calculate the chances of Katniss (the main character of the story) being chosen, if she is 16 years
old and has 15 ration entries in the drawing.
P(Katniss) = ________________
2. If Prim, Katniss’s little sister, just turned 12 and has no ration entries, what is the probability that
she will be chosen?
P(Prim) = ________________
Math 2 S.CP.3, S.CP.5, S.CP.6 Assessment Title: The Hunger Games Probability
Unit 8: Probability
3. Gale, Katniss’s best guy friend, is 18 years old. Because he has been single-handedly supporting
his family since turning 12, he has exchanged rations for 35 additional entries. What are his
chances of being chosen during The Reaping?
P(Gale) = ________________
4. Peeta, who is relatively well off, has no ration entries. If he is 16 years old, what are the chances
that his name would be chosen?
P(Peeta) = ________________
5. Using what you know about the number of entries for Katniss and Prim, what is the probability
that Katniss OR Prim is chosen?
P(Katniss or Prim) = _____________
6. Using what you know about the number of entries for Gale and Peeta, what is the probability
that Gale OR Peeta is chosen?
P(Gale or Peeta) = _______________
Part II: Using the probabilities you calculated in Part I, determine the following:
7. What is the probability that both Gale and Katniss are chosen?
P(Katniss and Gale) = __________________
8. What is the probability that Katniss and Peeta are chosen?
P(Katniss and Peeta) = ______________
Math 2 S.CP.3, S.CP.5, S.CP.6 Assessment Title: The Hunger Games Probability
Unit 8: Probability
9. What is the probability that Prim and Katniss are chosen?
P(Katniss and Prim) = _______________
10. What is the probability that Prim and Peeta are chosen?
P(Prim and Peeta) = ________________
Math 2 S.CP.3, S.CP.5, S.CP.6 Assessment Title: The Hunger Games Probability
Unit 8: Probability
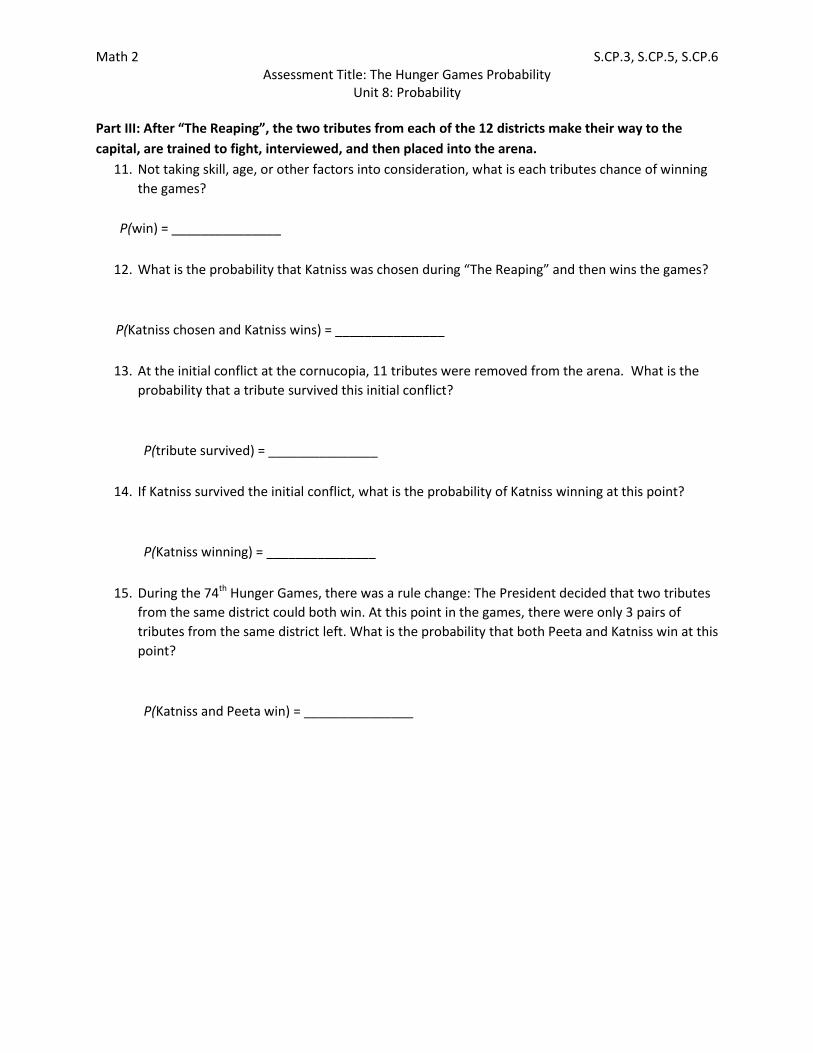
Part III: After “The Reaping”, the two tributes from each of the 12 districts make their way to the
capital, are trained to fight, interviewed, and then placed into the arena.
11. Not taking skill, age, or other factors into consideration, what is each tributes chance of winning
the games?
P(win) = _______________
12. What is the probability that Katniss was chosen during “The Reaping” and then wins the games?
P(Katniss chosen and Katniss wins) = _______________
13. At the initial conflict at the cornucopia, 11 tributes were removed from the arena. What is the
probability that a tribute survived this initial conflict?
P(tribute survived) = _______________
14. If Katniss survived the initial conflict, what is the probability of Katniss winning at this point?
P(Katniss winning) = _______________
15. During the 74th Hunger Games, there was a rule change: The President decided that two tributes
from the same district could both win. At this point in the games, there were only 3 pairs of
tributes from the same district left. What is the probability that both Peeta and Katniss win at this
point?
P(Katniss and Peeta win) = _______________

Math 2 S.CP.3, S.CP.5, S.CP.6 Assessment Title: The Hunger Games Probability
Unit 8: Probability
Part IV: You want to write a letter to the author of the book series describing the chances of different
outcomes of The 74th Hunger Games. The table shows various pieces of information about each of the
tributes.
Tribute District
(Name, if applicable)
Male? Female? Career? Age 12-15
Age 16-18
Wealthy District?
Poor District?
Volunteer? Ability Score
1 (Glimmer) X X X X X 9
1 (Marvel) X X X X X 9
2 (Clove) X X X X X 10
2 (Cato) X X X X X 10
3 X X X 9
3 X X X 8
4 X X X X X 5
4 X X X X X 8
5 (Foxface) X X X 7
5 X X X 5
6 X X X 9
6 X X X 8
7 X X X 7
7 X X X 9
8 X X X 8
8 X X X 7
9 X X X 5
9 X X X 6
10 X X X 4
10 X X X 8
11 (Rue) X X X 7
11 (Thresh) X X X 10
12 (Katniss) X X X X 11
12 (Peeta) X X X 8
Using the information above, calculate the following probabilities that a person is chosen at random
with the indicated characteristics:
16. P(Career | Female) = ________
17. P(Ability score over 8 | Male) = ______
18. P(Ability score over 8 | Female) = _____
19. P(Ability score over 8 | Poor) = _____
20. P(Not career | Volunteer) = ______
Math 2 S.CP.3, S.CP.5, S.CP.6 Assessment Title: The Hunger Games Probability
Unit 8: Probability
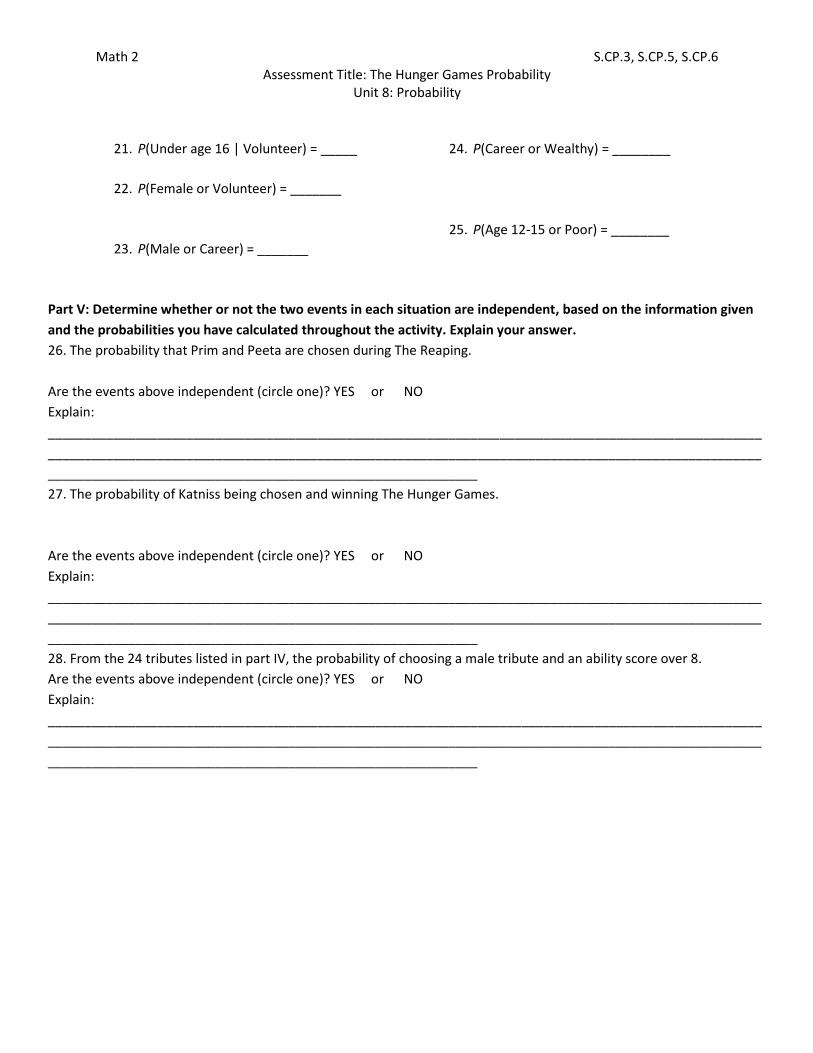
21. P(Under age 16 | Volunteer) = _____
22. P(Female or Volunteer) = _______
23. P(Male or Career) = _______
24. P(Career or Wealthy) = ________
25. P(Age 12-15 or Poor) = ________
Part V: Determine whether or not the two events in each situation are independent, based on the information given
and the probabilities you have calculated throughout the activity. Explain your answer.
26. The probability that Prim and Peeta are chosen during The Reaping.
Are the events above independent (circle one)? YES or NO
Explain:
__________________________________________________________________________________________________
__________________________________________________________________________________________________
___________________________________________________________
27. The probability of Katniss being chosen and winning The Hunger Games.
Are the events above independent (circle one)? YES or NO
Explain:
__________________________________________________________________________________________________
__________________________________________________________________________________________________
___________________________________________________________
28. From the 24 tributes listed in part IV, the probability of choosing a male tribute and an ability score over 8.
Are the events above independent (circle one)? YES or NO
Explain:
__________________________________________________________________________________________________
__________________________________________________________________________________________________
___________________________________________________________