sics cfs q2.2016 8.8 · name of contact person email address telephone number/s mobile number mr....
TRANSCRIPT

C O V E R S H E E T for
AUDITED FINANCIAL STATEMENTS
SEC Registration Number
1 6 3 4 2
C O M P A N Y N A M E
S M I N V E S T M E N T S C O R P O R A T I O N A N D
S U B S I D I A R I E S
PRINCIPAL OFFICE ( No. / Street / Barangay / City / Town / Province )
1 0 t h F l o o r , O n e E - C o m C e n t e r ,
H a r b o r D r i v e , M a l l o f A s i a C o m
p l e x , C B P - 1 A , P a s a y C i t y 1 3 0 0
Form Type Department requiring the report Secondary License Type, If Applicable
1 7 - Q
C O M P A N Y I N F O R M A T I O N
Company’s Email Address Company’s Telephone Number Mobile Number
– 857-0100 –
No. of Stockholders Annual Meeting (Month / Day) Fiscal Year (Month / Day)
1,244 04/27 06/30
CONTACT PERSON INFORMATION
The designated contact person MUST be an Officer of the Corporation
Name of Contact Person Email Address Telephone Number/s Mobile Number
Mr. Jose T. Sio – 857-0100 –
CONTACT PERSON’s ADDRESS
10th Floor, One E-Com Center, Harbor Drive, Mall of Asia Complex, CBP-1A, Pasay City 1300
NOTE 1 : In case of death, resignation or cessation of office of the officer designated as contact person, such incident shall be reported to the Commission within thirty (30) calendar days from the occurrence thereof with information and complete contact details of the new contact person designated. 2 : All Boxes must be properly and completely filled-up. Failure to do so shall cause the delay in updating the corporation’s records with the Commission and/or non-receipt of Notice of Deficiencies. Further, non-receipt of Notice of Deficiencies shall not excuse the corporation from liability for its deficiencies.

SEC Number 16342
PSE Disclosure Security Code
SM INVESTMENTS CORPORATION (Company’s Full Name)
10th Floor, One E-Com Center, Harbor Drive, Mall of Asia Complex, CBP-IA, Pasay City 1300
(Company’s Address)
857- 0100 (Telephone Number)
December 31 (Year Ending) (month & day)
SEC Form 17-Q 2nd Quarter Report
Form Type
Amendment Designation (If applicable)
June 30, 2016 Period Ended Date
(Secondary License Type and File Number)

SECURITIES AND EXCHANGE COMMISSION
SEC FORM 17-Q
QUARTERLY REPORT PURSUANT TO SECTION 17 OF THE SECURITIES REGULATION CODE AND SRC RULE 17(2)(b) THEREUNDER
1. For the quarterly period ended June 30, 2016 2. Commission Identification Number 016342 3. BIR Tax Identification No. 169-020-000 4. Exact name of registrant as specified in its charter SM INVESTMENTS CORPORATION 5. PHILIPPINES Province, Country or other jurisdiction of incorporation or organization 6. Industry Classification Code: (SEC Use Only) 7. 10th Floor, One E-Com Center, Harbor Drive, Mall of Asia Complex, CBP-IA, Pasay
City 1300 Address of principal office Postal Code 8. 857-0100 Registrant's telephone number, including area code 9. Former name, former address, and former fiscal year, if changed since last report. 10. Securities registered pursuant to Sections 8 and 12 of the Code, or Sections 4 and 8 of the
RSA Title of Each Class Number of Shares Amount of Debt Outstanding of Common Stock Outstanding COMMON STOCK P10 PAR VALUE 803,055,405 N.A. 11. Are any or all of these securities listed on the Philippine Stock Exchange. Yes [X] No [ ] 12. Indicate by check mark whether the registrant: (a) has filed all reports required to be filed by Section 11 of the Securities Regulation Code
(SRC)and SRC Rule 11(a)-1 thereunder and Sections 26 and 141 of The Corporation Code of the Philippines during the preceding 12 months (or for such shorter period that the registrant was required to file such reports);
Yes [X] No [ ] (b) has been subject to such filing requirements for the past 90 days. Yes [X] No [ ]

TABLE OF CONTENTS PART I – FINANCIAL INFORMATION Item 1. Consolidated Financial Statements
Consolidated Balance Sheets as of June 30, 2016 (Unaudited), December 31, 2015 (Audited)
Consolidated Statements of Income for the Six Months Ended June 30, 2016 and 2015 (Unaudited)
Consolidated Statements of Changes in Stockholders’ Equity for the Six Months Ended June 30, 2016 and 2015 (Unaudited) Consolidated Statements of Cash Flows for the Six Months Ended June 30, 2016 and 2015 (Unaudited)
Notes to Consolidated Financial Statements Item 2. Management Discussion and Analysis of Financial Condition as of
June 30, 2016 and December 31, 2015 and Result of Operations for the Six Months ended June 30, 2016 and 2015
Item 3. Aging of Accounts Receivable – Trade as of June 30, 2016 PART II – SIGNATURE

PART I FINANCIAL INFORMATION
Item 1. Consolidated Financial Statements
SM INVESTMENTS CORPORATION AND SUBSIDIARIES Consolidated Financial Statements June 30, 2016 and December 31, 2015 and for the Six Months Ended June 30, 2016 and 2015

SM INVESTMENTS CORPORATION AND SUBSIDIARIES CONSOLIDATED BALANCE SHEETS (Amounts in Thousands)
June 30, 2016
(Unaudited)
December 31, 2015
(Audited)
ASSETS
Current Assets Cash and cash equivalents (Notes 5, 20 and 24) P=29,516,339 P=53,910,071 Time deposits (Notes 6 and 24) 11,399,755 9,611,405 Investments held for trading and sale (Notes 7 and 24) 1,245,224 1,100,915 Receivables (Notes 8 and 25) 32,990,168 32,133,508 Merchandise inventories - at cost (Note 21) 17,952,012 16,262,228 Other current assets (Note 9) 52,282,760 51,312,145 Total Current Assets 145,386,258 164,330,272
Noncurrent Assets Available-for-sale investments (Note 10) 23,264,246 21,175,695 Investments in associate companies and joint ventures (Note 11) 176,068,761 169,869,391 Time deposits (Note 6) 51,068,610 53,127,769 Property and equipment (Note 12) 19,259,048 19,399,788 Investment properties (Note 13) 258,754,728 249,583,502 Land and development (Note 14) 24,410,046 27,386,708 Intangibles (Note 15) 24,643,605 24,707,221 Deferred tax assets (Note 22) 2,543,619 2,569,800 Other noncurrent assets (Notes 15 and 25) 44,770,540 38,927,352 Total Noncurrent Assets 624,783,203 606,747,226
P=770,169,461 P=771,077,498
LIABILITIES AND EQUITY
Current Liabilities Bank loans (Notes 16 and 24) P=6,694,783 P=9,923,215 Accounts payable and other current liabilities (Note 17) 66,304,799 77,546,739 Income tax payable 1,864,369 2,023,824 Current portion of long-term debt (Notes 18 and 20) 6,677,987 25,994,800 Dividends payable 378,634 346,281 Total Current Liabilities 81,920,572 115,834,859
Noncurrent Liabilities Long-term debt - net of current portion (Notes 18, 20 and 25) 266,081,197 245,167,269 Deferred tax liabilities (Note 22) 7,167,258 7,434,777 Tenants’ deposits and others (Notes 13, 23 and 25) 22,252,192 20,941,307 Total Noncurrent Liabilities 295,500,647 273,543,353 Total Liabilities 377,421,219 389,378,212
Equity Attributable to Owners of the Parent Capital stock (Note 19) 8,030,554 8,030,554 Additional paid-in capital (Note 19) 76,399,625 76,399,625 Equity adjustments from common control transactions (Note 19) (1,902,024) (1,902,024) Cost of Parent common shares held by subsidiaries (25,386) (25,386) Cumulative translation adjustment 461,991 1,057,751 Re-measurement gain on defined benefit asset/obligation 117,738 117,738 Net unrealized gain on available-for-sale investments 14,733,490 12,724,360 Retained earnings (Note 19): Appropriated 36,000,000 36,000,000 Unappropriated 158,454,650 152,004,710 Total Equity Attributable to Owners of the Parent 292,270,638 284,407,328
Non-controlling Interests 100,477,604 97,291,958 Total Equity 392,748,242 381,699,286
P=770,169,461 P=771,077,498
See accompanying Notes to Consolidated Financial Statements.

SM INVESTMENTS CORPORATION AND SUBSIDIARIES CONSOLIDATED STATEMENTS OF INCOME (Amounts in Thousands Except Per Share Data) Six months Ended June 30
2016
(Unaudited) 2015
(Unaudited)
REVENUE Sales: Merchandise P=105,080,984 P=96,728,307 Real estate 13,119,810 12,454,732 Rent (Notes 13, 20 and 23) 19,507,003 17,604,292 Equity in net earnings of associate companies and joint ventures (Note 11) 7,446,392 6,721,876 Cinema ticket sales, amusement and others 3,270,287 3,179,958 Dividend, management fees and others 2,663,517 2,556,188 151,087,993 139,245,353
COST AND EXPENSES Cost of sales: Merchandise (Note 21) 80,522,550 74,179,439 Real estate 7,001,812 6,775,432 Selling, general and administrative expenses 32,770,555 29,987,827 120,294,917 110,942,698
OTHER INCOME (CHARGES) Interest expense (5,495,528) (5,613,240) Interest income 1,633,631 1,552,415 Gain (loss) on fair value changes on derivatives - net 33,085 (137,787) Foreign exchange gain and others 77,823 183,270 (3,750,989) (4,015,342)
INCOME BEFORE INCOME TAX 27,042,087 24,287,313
PROVISION FOR INCOME TAX (Note 22) Current 4,988,678 4,374,405 Deferred 99,299 97,471 5,087,977 4,471,876
NET INCOME P=21,954,110 P=19,815,437
Attributable to Owners of the Parent (Note 26) P=14,986,407 13,494,480 Non-controlling interests 6,967,703 6,320,957 P=21,954,110 P=19,815,437
Basic/Diluted Earnings Per Common Share Attributable to Owners of the Parent (Note 26) P=18.66 P=16.92
See accompanying Notes to Consolidated Financial Statements.

SM INVESTMENTS CORPORATION AND SUBSIDIARIES CONSOLIDATED STATEMENTS OF INCOME (Amounts in Thousands Except Per Share Data) Three Months Ended June 30
2016
(Unaudited) 2015
(Unaudited)
REVENUE Sales: Merchandise P=56,324,441 P=51,796,463 Real estate and others 7,519,668 6,983,916Rent 9,938,627 9,059,354Equity in net earnings of associate companies and joint ventures 4,321,821 3,120,968Cinema ticket sales, amusement and others 1,782,627 1,772,342Dividend, management fees and others 1,368,611 1,291,579 81,255,795 74,024,622
COST AND EXPENSES Cost of sales: Merchandise 43,350,360 39,982,451 Real estate 4,052,468 3,840,251Selling, general and administrative expenses 17,406,968 15,485,524 64,809,796 59,308,226
OTHER INCOME (CHARGES) Interest expense (2,796,250) (2,901,090)Interest income 828,598 797,149Gain (loss) on fair value changes on derivatives - net 33,085 (13,311)Foreign exchange gain (loss) and others (19,204) 76,041 (1,953,771) (2,041,211)
INCOME BEFORE INCOME TAX 14,492,228 12,675,185
PROVISION FOR INCOME TAX Current 2,765,491 2,248,445Deferred (46,047) 238,945 2,719,444 2,487,390
NET INCOME P=11,772,784 P=10,187,795
Attributable to Owners of the Parent P=7,999,186 P=6,751,348Non-controlling interests 3,773,598 3,436,447 P=11,772,784 P=10,187,795
Basic/Diluted Earnings Per Common Share Attributable to Owners of the Parent P=9.96 P=8.47
See accompanying Notes to Consolidated Financial Statements.

SM INVESTMENTS CORPORATION AND SUBSIDIARIES CONSOLIDATED STATEMENTS OF COMPREHENSIVE INCOME (Amounts in Thousands) Six months Ended June 30
2016
(Unaudited)2015
(Unaudited)
NET INCOME P=21,954,110 P=19,815,437
OTHER COMPREHENSIVE INCOME (LOSS) Items that will be reclassified to profit or loss in subsequent periods Net unrealized gain on available-for-sale investments 1,661,724 1,417,859 Share in unrealized gain (loss) on available-for-sale investments of associates - net 510,339 (1,516,770) Cumulative translation adjustment (952,249) 236,238 Income tax relating to items to be reclassified to profit or loss in subsequent periods 340,636 (71,216) 1,560,450 66,111
TOTAL COMPREHENSIVE INCOME P=23,514,560 P=19,881,548
Attributable to Owners of the Parent P=16,399,777 P=16,889,581 Non-controlling interests 7,114,783 2,991,967 P=23,514,560 P=19,881,548
See accompanying Notes to Consolidated Financial Statements.

SM INVESTMENTS CORPORATION AND SUBSIDIARIES CONSOLIDATED STATEMENTS OF COMPREHENSIVE INCOME (Amounts in Thousands) Three Months Ended June 30
2016
(Unaudited)2015
(Unaudited)
NET INCOME P=11,772,784 P=10,187,795
OTHER COMPREHENSIVE INCOME (LOSS) Items that will be reclassified to profit or loss in subsequent periods Net unrealized gain (loss) on available-for-sale investments 1,693,965 (241,384)Share in unrealized gain (loss) on available-for-sale investments of associates - net 322,813 (1,306,934)Cumulative translation adjustment (307,634) 302,090 Income tax relating to items to be reclassified to profit or loss in subsequent periods 414,205 (4,593) 2,123,349 (1,250,821)
TOTAL COMPREHENSIVE INCOME P=13,896,133 P=8,936,974
Attributable to Owners of the Parent P=9,726,361 P=5,448,370 Non-controlling interests 4,169,772 3,488,604 P=13,896,133 P=8,936,974
See accompanying Notes to Consolidated Financial Statements.

SM INVESTMENTS CORPORATION AND SUBSIDIARIES CONSOLIDATED STATEMENTS OF CHANGES IN EQUITY (Amounts in Thousands Except Per Share Data) Equity Attributable to Owners of the Parent
Capital Stock Additional
Paid-in Capital
Equity Adjustments
from Common Control
Transactions
Cost of Parent Common
Shares Held by Subsidiaries
Cumulative Translation Adjustment
Net Unrealized Gain on
Available- for-Sale
Investments
Re-measurement Gain (Loss) on
Defined Benefit Asset/
Obligation
Appropriated Retained Earnings
Unappropriated Retained Earnings Total
Non-controlling Interests
Total Equity
Balance at December 31, 2015 P=8,030,554 P=76,399,625 (P=1,902,024) (P=25,386) P=1,057,751 P=12,724,360 P=117,738 P=36,000,000 P=152,004,710 P=284,407,328 P=97,291,958 P=381,699,286 Net income – – – – – – – – 14,986,407 14,986,407 6,967,703 21,954,110 Other comprehensive income – – – – (595,760) 2,009,130 – – – 1,413,370 147,080 1,560,450 Total comprehensive income – – – – (595,760) 2,009,130 – – 14,986,407 16,399,777 7,114,783 23,514,560 Cash dividends - P=10.63 per share – – – – – – – – (8,536,467) (8,536,467) – (8,536,467) Cash dividends received by non-controlling interests – – – – – – – – – – (3,400,433) (3,400,433) Decrease in previous year’s non-controlling interests – – – – – – – – – – (528,704) (528,704) Balance at June 30, 2016 P=8,030,554 P=76,399,625 (P=1,902,024) (P=25,386) P=461,991 P=14,733,490 P=117,738 P=36,000,000 P=158,454,650 P=292,270,638 P=100,477,604 P=392,748,242
Balance at December 31, 2014 P=7,963,406 P=71,952,082 (P=1,902,933) (P=25,386) P=866,360 P=10,207,259 (P=126,530) P=27,000,000 P=141,069,856 P=257,004,114 P=92,944,295 P=349,948,409 Net income – – – – – – – – 13,494,480 13,494,480 6,320,957 19,815,437 Other comprehensive income – – – – 114,725 3,280,376 – – – 3,395,101 (3,328,990) 66,111 Total comprehensive income – – – – 114,725 3,280,376 – – 13,494,480 16,889,581 2,991,967 19,881,548 Conversion of convertible bonds 67,148 4,833,081 – – – – – – – 4,900,229 – 4,900,229 Cash dividends - P=10.61 per share – – – – – – – – (8,520,406) (8,520,406) – (8,520,406) Decrease in previous year’s non-controlling interests – – – – – – – – – – (347,086) (347,086) Cash dividends received by non-controlling interests – – – – – – – – – – (3,057,051) (3,057,051) Balance at June 30, 2015 P=8,030,554 P=76,785,163 (P=1,902,933) (P=25,386) P=981,085 P=13,487,635 (P=126,530) P=27,000,000 P=146,043,930 P=270,273,518 P=92,532,125 P=362,805,643
See accompanying Notes to Consolidated Financial Statements.

SM INVESTMENTS CORPORATION AND SUBSIDIARIES CONSOLIDATED STATEMENTS OF CASH FLOWS (Amounts in Thousands) Six months Ended June 30
2016
(Unaudited) 2015
(Unaudited)
CASH FLOWS FROM OPERATING ACTIVITIES Income before income tax P=27,042,087 P=24,287,313 Adjustments for: Equity in net earnings of associate companies and joint ventures (Note 11) (7,446,392) (6,721,876) Interest expense 5,495,528 5,613,240 Depreciation and amortization (Notes 12 and 13) 5,980,832 5,557,204 Interest income (1,633,631) (1,552,415) Dividend, management fees and others (122,172) (111,930) Unrealized foreign exchange loss and others 95,044 84,383 Gain (loss) on fair value changes on derivatives - net (33,085) 137,787 Income before working capital changes 29,378,211 27,293,706 Decrease (increase) in: Land and development (6,709,950) (5,230,162) Other current assets 5,035,487 6,093,196 Merchandise inventories (1,689,784) (1,000,566) Receivables 1,264,835 (2,241,412) Increase (decrease) in: Accounts payable and other current liabilities (11,027,546) (7,420,716) Tenants’ deposits and others 1,491,198 1,574,297 Net cash generated from operations 17,742,451 19,068,343 Income tax paid (5,145,086) (4,188,994) Net cash provided by operating activities 12,597,365 14,879,349
CASH FLOWS FROM INVESTING ACTIVITIES Proceeds from sale of: Available-for-sale and held for trading investments 1,872,451 50,173 Property and equipment 242,937 40,130 Investment properties – 11,159 Additions to: Investment properties (Note 13) (13,441,574) (20,478,526) Investments in associate companies and joint ventures (Note 11) (188,050) (15,508,476) Property and equipment (Note 12) (2,141,235) (2,087,273) Available-for-sale and held for trading investments (2,156,539) (534,891) Decrease (increase) in: Time deposits 270,808 (2,419,446) Other noncurrent assets (4,803,742) 821,458 Dividends received 2,024,418 2,315,382 Interest received 1,638,861 1,536,252 Net cash used in investing activities (16,681,665) (36,254,058)
(Forward)

- 2 -
Six months ended June 30
2016
(Unaudited) 2015
(Unaudited)
CASH FLOWS FROM FINANCING ACTIVITIES Availments of: Long-term debt P=31,795,532 P=5,324,809 Bank loans 1,825,000 10,720,000 Payments of: Long-term debt (30,097,993) (3,463,955) Bank loans (5,053,433) (6,265,000) Interest (6,637,985) (5,746,443) Dividends (11,904,547) (11,669,774) Net cash provided by (used in) financing activities (20,073,426) (11,100,363)
NET DECREASE IN CASH AND CASH EQUIVALENTS (24,157,726) (32,475,072)
EFFECT OF EXCHANGE RATE CHANGES ON CASH AND CASH EQUIVALENTS (236,006) (14,996)
CASH AND CASH EQUIVALENTS AT BEGINNING OF YEAR 53,910,071 69,133,381
CASH AND CASH EQUIVALENTS AT END OF PERIOD P=29,516,339 P=36,643,313
See accompanying Notes to Consolidated Financial Statements.

*SGVFS015746*
SM INVESTMENTS CORPORATION AND SUBSIDIARIES NOTES TO CONSOLIDATED FINANCIAL STATEMENTS
1. Corporate Information
SM Investments Corporation (SMIC or Parent Company) was incorporated in the Philippines on January 15, 1960. On June 3, 2009, the Philippine Securities and Exchange Commission (SEC) approved the amendment of SMIC’s articles of incorporation for the extension of the Parent Company’s corporate life for another 50 years from January 15, 2010. Its registered office address is 10th Floor, One E-Com Center, Harbor Drive, Mall of Asia Complex, CBP-1A, Pasay City 1300.
The Parent Company and its subsidiaries (collectively referred to as the Group), and its associates and joint ventures are involved primarily in the property, retail and financial services and other businesses.
The Parent Company’s shares of stock are publicly traded in the Philippine Stock Exchange (PSE).
2. Basis of Preparation and Statement of Compliance
Basis of Preparation The consolidated financial statements of the Group have been prepared on a historical cost basis, except for derivative financial instruments, investments held for trading and available-for-sale (AFS) investments which have been measured at fair value. The consolidated financial statements are presented in Philippine Peso, which is the Parent Company’s functional and presentation currency under Philippine Financial Reporting Standards (PFRS). All values are rounded to the nearest thousands except when otherwise indicated.
Statement of Compliance The consolidated financial statements have been prepared in compliance with PFRS.
Basis of Consolidation The Group is considered to have control over an investee, if and only if, the Group has: � Power over the investee (i.e. existing rights that give it the current ability to direct the relevant
activities of the investee); � Exposure, or rights, to variable returns from its involvement with the investee; and, � The ability to use its power over the investee to affect its returns.
When the Group has less than a majority of the voting or similar rights of an investee, the Group considers all relevant facts and circumstances in assessing whether it has power over an investee, including:
� The contractual arrangement with the other vote holders of the investee; � Rights arising from other contractual arrangements; and, � The Group’s voting rights and potential voting rights.

- 2 -
The Group re-assesses whether or not it controls an investee if facts and circumstances indicate that there are changes to one or more of the three elements of control. Consolidation of a subsidiary begins when the Group obtains control over the subsidiary and ceases when the Group loses control of the subsidiary. Assets, liabilities, income and expenses of a subsidiary acquired or disposed of during the year are included or excluded in the consolidated financial statements from the date the Group gains control until the date the Group ceases to control the subsidiary.
Profit or loss and each component of other comprehensive income (OCI) are attributed to the equity holders of the parent of the Group and to the non-controlling interests, even if this results in the non-controlling interests having a deficit balance. When necessary, adjustments are made to the financial statements of subsidiaries to bring their accounting policies in line with the Group’s accounting policies. All intra-group assets and liabilities, equity, income, expenses and cash flows relating to transactions between members of the Group are eliminated in full on consolidation.
A change in the ownership interest of a subsidiary, without loss of control, is accounted for as an equity transaction. If the Group loses control over a subsidiary, it:
� Derecognizes the assets (including goodwill) and liabilities of the subsidiary; � Derecognizes the carrying amount of any non-controlling interests; � Derecognizes the cumulative translation adjustments recorded in equity; � Recognizes the fair value of the consideration received; � Recognizes the fair value of any investment retained; � Recognizes any surplus or deficit in profit or loss; and, � Reclassifies the Parent Company’s share of components previously recognized in OCI to
profit or loss or retained earnings, as appropriate.
The consolidated financial statements include the accounts of the Parent Company and the subsidiaries listed below:
Percentage of Ownership
June 30,
2016December 31,
2015Company Principal Activities Direct Indirect Direct Indirect Property SM Prime Holdings, Inc. (SM Prime) and
Subsidiaries Real estate development 50 – 50 – SM Development Corporation (SMDC)
and Subsidiaries Real estate development – 100 – 100 Magenta Legacy, Inc. Real estate development – 100 – 100 Associated Development Corporation Real estate development – 100 – 100 Highlands Prime, Inc. (HPI) Real estate development – 100 – 100 Summerhills Home Development Corp. Real estate development – 100 – 100 CHAS Realty and Development Corporation
(CHAS) and Subsidiaries Real estate development – 100 – 100 Costa del Hamilo, Inc. (Costa) and
Subsidiaries Real estate development – 100 – 100 Prime Metro Estate, Inc. (PMI) and Subsidiary Real estate development – 100 – 100 Rappel Holdings, Inc. and Subsidiaries Real estate development – 100 – 100 SM Arena Complex Corporation (SM Arena) Conventions – 100 – 100 SM Hotels and Conventions Corp. and
Subsidiaries Hotel and conventions – 100 – 100 Tagaytay Resort Development Corporation Real estate development – 100 – 100 MOA Esplanade Port, Inc. Port terminal operations – 100 – 100 Mountain Bliss Resort and Development
Corporation and Subsidiary Real estate development 100 – 100 – Intercontinental Development Corporation (ICDC) Real estate development 97 3 97 3 Prime Central, Inc. and Subsidiaries Real estate development 100 – 100 –

- 3 -
Percentage of Ownership
June 30,
2016December 31,
2015Company Principal Activities Direct Indirect Direct Indirect Bellevue Properties, Inc. Real estate development 62 – 62 – Net Group Real estate development 90 – 90 – Nagtahan Property Holdings, Inc.
(formerly AD Farming) Real estate development 100 – 100 – Retail SM Retail, Inc. (SM Retail) and Subsidiaries Retail 100 – 100 – Others Primebridge Holdings, Inc. (Primebridge) Investment 80 20 80 20 Asia Pacific Computer Technology Center, Inc. Education 52 – 52 – Multi-Realty Development Corporation (MRDC) Investment 91 – 91 – Henfels Investments Corp. Investment 99 – 99 – Belleshares Holdings, Inc. and Subsidiaries
(formerly SM Commercial Properties, Inc.) Investment 59 40 59 40 Sto. Roberto Marketing Corp. Investment 100 – 100 –
The principal place of business and country of incorporation of the subsidiaries listed above is in the Philippines. 3. Summary of Significant Accounting Policies, Changes and Improvements
The significant accounting policies adopted in the preparation of the consolidated financial statements are summarized below.
Cash and Cash Equivalents Cash includes cash on hand and in banks. Cash equivalents are short-term, highly liquid investments that are readily convertible to known amounts of cash with original maturities of three months or less and are subject to an insignificant risk of change in value.
Time Deposits Time deposits are cash placements with original maturities of more than three months but less than one year. Time deposits with maturities of more than twelve months after the reporting period are presented under noncurrent assets.
Determination of Fair Value Fair value is the price that would be received to sell an asset or paid to transfer a liability in an orderly transaction between market participants at the measurement date. The fair value measurement is based on the presumption that the transaction to sell the asset or transfer the liability takes place either:
� in the principal market for the asset or liability, or � in the absence of a principal market, in the most advantageous market for the asset or liability.
The fair value of an asset or a liability is measured using the assumptions that market participants would use when pricing the asset or liability, assuming that the market participants act in their best economic interest.
Assets and liabilities for which fair value is measured or disclosed in the consolidated financial statements are categorized within the fair value hierarchy, described as follows, based on the lowest level input that is significant to the fair value measurement as a whole:

- 4 -
� Level 1 - Quoted (unadjusted) market prices in active markets for identical assets or liabilities; � Level 2 - Valuation techniques for which the lowest level input that is significant to the fair
value measurement is directly or indirectly observable; and, � Level 3 - Valuation techniques for which the lowest level input that is significant to the fair
value measurement is unobservable.
For assets and liabilities that are recognized in the consolidated financial statements on a recurring basis, the Group determines whether transfers have occurred between Levels in the hierarchy by re-assessing categorization (based on the lowest level input that is significant to the fair value measurement as a whole) at the end of each reporting period.
The Group determines the policies and procedures for both recurring and non-recurring fair value measurements. For the purpose of fair value disclosures, the Group has determined classes of assets and liabilities on the basis of the nature, characteristics and risks of the asset or liability and the level of the fair value hierarchy.
The Group recognizes transfers into and transfers out of fair value hierarchy levels by re-assessing categorization (based on the lowest level input that is significant to the fair value measurement as a whole) as at the date of the event or change in circumstances that caused the transfer.
Financial Instruments
Date of Recognition The Group recognizes a financial asset or a financial liability in the consolidated balance sheet when it becomes a party to the contractual provisions of the instrument. Purchases or sales of financial assets, recognition and de-recognition, as applicable, that require delivery of assets within the time frame established by regulation or convention in the market place are recognized on the settlement date. Derivatives are recognized on a trade date basis.
Initial Recognition of Financial Instruments Financial instruments are recognized initially at fair value, which is the fair value of the consideration given (in case of an asset) or received (in case of a liability). The initial measurement of financial instruments, except for those classified as fair value through profit or loss (FVPL), includes transaction cost.
Subsequent to initial recognition, the Group classifies its financial instruments in the following categories: financial assets and financial liabilities at FVPL, loans and receivables, held-to-maturity (HTM) investments, AFS investments and other financial liabilities. The classification depends on the purpose for which the instruments are acquired and whether they are quoted in an active market. Management determines the classification at initial recognition and, where allowed and appropriate, re-evaluates this classification at every reporting date.
“Day 1” Difference Where the transaction price in a non-active market is different from the fair value of other observable current market transactions in the same instrument or based on a valuation technique whose variables include only data from observable market, the Group recognizes the difference between the transaction price and fair value (a “Day 1” difference) in the consolidated statement of income unless it qualifies for recognition as some other type of asset or liability. In cases where use is made of data which is not observable, the difference between the transaction price and model value is only recognized in the consolidated statement of income when the inputs become observable or when the instrument is derecognized. For each transaction, the Group determines the appropriate method of recognizing the “Day 1” difference amount.

- 5 -
Financial Assets and Liabilities at FVPL Financial assets and liabilities at FVPL include financial assets and liabilities held for trading and financial assets and liabilities designated upon initial recognition as at FVPL.
Financial assets and liabilities are classified as held for trading if they are acquired for the purpose of selling or repurchasing in the near term. Gains or losses on investments held for trading are recognized in the consolidated statement of income under “Gain (loss) on sale of available-for-sale investments and fair value changes on investments held for trading - net” account. Interest income earned on investment held for trading are recognized in “Interest income” account in the consolidated statement of income.
Financial assets and liabilities may be designated by management at initial recognition as FVPL when any of the following criteria is met:
� the designation eliminates or significantly reduces the inconsistent treatment that would otherwise arise from measuring the assets and liabilities or recognizing gains or losses on a different basis; or,
� the assets and liabilities are part of a group of financial assets, financial liabilities or both which are managed and their performance are evaluated on a fair value basis, in accordance with a documented risk management or investment strategy; or,
� the financial instrument contains an embedded derivative, unless the embedded derivative does not significantly modify the cash flows or it is clear, with little or no analysis, that it would not be separately recorded.
The Group’s investments held for trading and derivative assets are classified as financial assets at FVPL, while the Group’s derivative liabilities arising from issuance of convertible bonds and derivative financial instruments with negative fair values are also included as financial liabilities at FVPL.
Loans and Receivables Loans and receivables are non-derivative financial assets with fixed or determinable payments that are not quoted in an active market. They are not entered into with the intention of immediate or short-term resale and are not designated as AFS investments or financial assets at FVPL.
After initial measurement, loans and receivables are subsequently measured at amortized cost using the effective interest method, less allowance for impairment. Amortized cost is calculated by taking into account any discount or premium on acquisition and fees that are an integral part of the effective interest rate. Gains and losses are recognized in the consolidated statement of income when the loans and receivables are derecognized and impaired, as well as through the amortization process. Loans and receivables are included under current assets if realizability or collectibility is within twelve months after the reporting period. Otherwise, these are classified as noncurrent assets.
The Group’s cash and cash equivalents, time deposits, receivables (including noncurrent portion of receivables from real estate buyers), advances and other receivables (included under “Other current assets” account), long-term notes (included under “Other noncurrent assets” account) are classified under this category.
AFS Investments AFS investments are non-derivative financial assets that are designated under this category or are not classified in any of the other categories. These are purchased and held indefinitely, and may be sold in response to liquidity requirements or changes in market conditions. Subsequent to

- 6 -
initial recognition, AFS investments are carried at fair value in the consolidated balance sheet. Changes in the fair value of such assets are reported as net unrealized gain or loss on AFS investments in the consolidated statement of comprehensive income under “Net unrealized gain (loss) on available-for-sale investments” account until the investment is derecognized or the investment is determined to be impaired. On de-recognition or impairment, the cumulative gain or loss previously reported in consolidated statement of comprehensive income is transferred to the consolidated statement of income. Interest earned on holding AFS investments are recognized in the consolidated statement of income using the effective interest method. Assets under this category are classified as current if expected to be disposed of within 12 months after the reporting period. Otherwise, they are classified as noncurrent.
The Group’s investments in shares of stock, bonds and corporate notes, redeemable preferred shares and club shares are classified under this category. The current portion is included under “Investments held for trading and sale” account in the consolidated balance sheet.
Other Financial Liabilities This category pertains to financial liabilities that are not held for trading or not designated as at FVPL upon the inception of the liability. These include liabilities arising from operations or borrowings.
Other financial liabilities are recognized initially at fair value and are subsequently carried at amortized cost, taking into account the impact of applying the effective interest method of amortization (or accretion) for any related premium, discount and any directly attributable transaction costs. Gains and losses on other financial liabilities are recognized in the consolidated statement of income when the liabilities are derecognized, as well as through the amortization process.
The Group’s bank loans, accounts payable and other current liabilities, dividends payable, long-term debt and tenants’ deposits and others are classified under this category.
Classification of Financial Instruments between Liability and Equity A financial instrument is classified as liability if it provides for a contractual obligation to:
� deliver cash or another financial asset to another entity; or, � exchange financial assets or financial liabilities with another entity under conditions that are
potentially unfavorable to the Group; or, � satisfy the obligation other than by the exchange of a fixed amount of cash or another financial
asset for a fixed number of own equity shares.
If the Group does not have an unconditional right to avoid delivering cash or another financial asset to settle its contractual obligation, the obligation meets the definition of a financial liability.
The components of issued financial instruments that contain both liability and equity elements are accounted for separately, with the equity component being assigned the residual amount, after deducting from the instrument, as a whole, the amount separately determined as the fair value of the liability component on the date of issue.
Debt Issue Cost Debt issue cost is presented as a reduction in long-term debt and amortized over the term of the related borrowings using the effective interest method.

- 7 -
Derivative Financial Instruments The Group uses derivative financial instruments such as long-term cross-currency swaps, foreign currency call options, interest rate swaps, options and non-deliverable forwards to hedge the risks associated with foreign currency and interest rate fluctuations. Derivative financial instruments, including bifurcated embedded derivatives, are initially recognized at fair value on the date on which the derivative contract is entered into and are subsequently re-measured at fair value. Derivatives are carried as assets when the fair value is positive and as liabilities when the fair value is negative.
Cash Flow Hedges Cash flow hedges are hedges of the exposure to variability in cash flows that is attributable to a particular risk associated with a recognized asset, liability or a highly probable forecast transaction and could affect the consolidated statement of income. Changes in the fair value of a hedging instrument that qualifies as a highly effective cash flow hedge are recognized as “Cumulative translation adjustment” account in the consolidated statement of comprehensive income, whereas any hedge ineffectiveness is immediately recognized in the consolidated statement of income under “Loss on fair value changes on derivatives - net” account.
Amounts taken to equity are transferred to the consolidated statement of income when the hedged transaction affects profit or loss, such as when the hedged financial income or financial expense is recognized. However, if an entity expects that all or a portion of a loss recognized in OCI will not be recovered in one or more future periods, it shall reclassify from equity to profit or loss as a reclassification adjustment the amount that is not expected to be recovered.
Hedge accounting is discontinued prospectively when the hedge ceases to be highly effective. When hedge accounting is discontinued, the cumulative gains or losses on the hedging instrument that has been reported as “Cumulative translation adjustment” is retained in the OCI until the hedged transaction impacts the consolidated statement of income. When the forecasted transaction is no longer expected to occur, any net cumulative gains or losses previously reported in the consolidated statement of comprehensive income is recognized immediately in the consolidated statement of income.
Other Derivative Instruments Not Accounted for as Hedges Certain freestanding derivative instruments that provide economic hedges under the Group’s policies either do not qualify for hedge accounting or are not designated as accounting hedges. Changes in the fair values of derivative instruments not designated as hedges are recognized immediately under “Loss on fair value changes on derivatives - net” account in the consolidated statement of income. Derivatives are carried as assets when the fair value is positive and as liabilities when the fair value is negative.
Embedded Derivative An embedded derivative is a component of a hybrid (combined) instrument that also includes a non-derivative host contract with the effect that some of the cash flows of the combined instrument vary, in a way similar to a stand-alone derivative. The Group assesses whether embedded derivatives are required to be separated from host contracts when the Group first becomes a party to the contract. An embedded derivative is separated from the host contract and accounted for as a derivative if all of the following conditions are met: a) the economic characteristics and risks of the embedded derivative are not closely related to the economic characteristics and risks of the host contract; b) a separate instrument with the same terms as the embedded derivative would meet the definition of a derivative; and c) the hybrid or combined instrument is not recognized as at FVPL.

- 8 -
Subsequent reassessment is prohibited unless there is a change in the terms of the contract that significantly modifies the cash flows that otherwise would be required under the contract, in which case, a reassessment is required. The Group determines whether a modification to cash flows is significant by considering the extent to which the expected future cash flows associated with the embedded derivative, the host contract or both, have changed and whether the change is significant relative to the previously expected cash flows on the contract.
Options arising from the Group’s long-term note (recorded under “Noncurrent Assets”) and convertible bonds payable are the Group’s bifurcated embedded derivatives.
De-recognition of Financial Assets and Liabilities
Financial Assets. A financial asset is derecognized when:
� the rights to receive cash flows from the asset have expired; � the Group retains the right to receive cash flows from the asset, but has assumed an
obligation to pay them in full without material delay to a third party under a “pass-through” arrangement; or,
� the Group has transferred its rights to receive cash flows from the asset and either (a) has transferred substantially all the risks and rewards of the asset, or (b) has neither transferred nor retained substantially all the risks and rewards of the asset, but has transferred control of the asset.
When the Group has transferred its rights to receive cash flows from an asset and has neither transferred nor retained substantially all the risks and rewards of the asset, the asset is recognized to the extent of the Group’s continuing involvement in the asset. Continuing involvement that takes the form of a guarantee over the transferred asset is measured at the lower of original carrying amount of the asset and the maximum amount of consideration that the Group could be required to repay.
Financial Liabilities. A financial liability is derecognized when the obligation under the liability is discharged or cancelled or has expired.
When an existing financial liability is replaced by another from the same lender on substantially different terms, or the terms of an existing liability are substantially modified, such modification is treated as a de-recognition of the original liability and the recognition of a new liability, and the difference in the respective carrying amounts is recognized in profit or loss.
Impairment of Financial Assets The Group assesses at each reporting period whether a financial asset or a group of financial assets is impaired. A financial asset or a group of financial assets is deemed to be impaired, if and only if, there is objective evidence of impairment as a result of one or more events that occurred after the initial recognition of the asset (an incurred loss event) and that loss event has an impact on the estimated future cash flows of the financial asset or a group of financial assets that can be reliably estimated. Objective evidence of impairment may include indications that the borrower or a group of borrowers is experiencing significant financial difficulty, default or delinquency in interest or principal payments, the probability that they will enter bankruptcy or other financial reorganization and where observable data indicate that there is measurable decrease in the estimated future cash flows, such as changes in arrears or economic conditions that correlate with defaults.

- 9 -
Financial Assets Carried at Amortized Cost. The Group first assesses whether objective evidence of impairment exists for financial assets that are individually significant, and individually or collectively for financial assets that are not individually significant. If it is determined that no objective evidence of impairment exists for an individually assessed financial asset, whether significant or not, the asset is included in a group of financial assets with similar credit risk characteristics and that group of financial assets is collectively assessed for impairment. Assets that are individually assessed for impairment and for which an impairment loss is or continues to be recognized are not included in the collective impairment assessment.
If there is objective evidence that an impairment loss on loans and receivables carried at amortized cost has been incurred, the amount of the loss is measured as the difference between the asset’s carrying amount and the present value of estimated future cash flows (excluding future credit losses that have not been incurred) discounted at the financial asset’s original effective interest rate (i.e., the effective interest rate computed at initial recognition).
The carrying amount of the impaired asset shall be reduced through the use of an allowance account. The amount of the loss shall be recognized in the consolidated statement of income. Interest income continues to be accrued on the reduced carrying amount based on the original effective interest rate of the asset. Loans and receivables together with the associated allowance are written off when there is no realistic prospect of future recovery and all collateral, if any, has been realized or has been transferred to the Group. If in a subsequent period, the amount of the impairment loss increases or decreases because of an event occurring after the impairment was recognized, the previously recognized impairment loss is increased or decreased by adjusting the allowance account. If a future write off is later recovered, the recovery is recognized in the consolidated statement of income to the extent of the carrying amount that would have been determined had no impairment loss been recognized.
Financial Assets Carried at Cost. If there is objective evidence that an impairment loss has been incurred in an unquoted equity instrument that is not carried at fair value because its fair value cannot be reliably measured, or on a derivative asset that is linked to and must be settled by delivery of such an unquoted equity instrument, the amount of the loss is measured as the difference between the asset’s carrying amount and the present value of estimated future cash flows discounted at the current market rate of return for a similar financial asset.
AFS Investments. The Group assesses at each reporting period whether there is objective evidence that an investment or a group of investments is impaired. In the case of equity investments classified as AFS investments, an objective evidence of impairment would include a significant or prolonged decline in the fair value of the investments below its cost. Significant decline in fair value is evaluated against the original cost of the investment, while prolonged decline is assessed against the periods in which the fair value has been below its original cost. Where there is evidence of impairment, the cumulative loss, measured as the difference between the acquisition cost and the current fair value, less any impairment loss on that financial asset previously recognized in the consolidated statement of income, is removed from the consolidated statement of comprehensive income and recognized in the consolidated statement of income. Impairment losses on equity investments are not reversed through the consolidated statement of income; increases in fair value after impairment are recognized directly in the consolidated statement of comprehensive income.

- 10 -
In the case of debt instruments classified as AFS investments, impairment is assessed based on the same criteria as financial assets carried at amortized cost. Future interest income is based on the reduced carrying amount of the asset and is accrued based on the rate of interest used to discount future cash flows for the purpose of measuring impairment loss. Such accrual is recorded as part of “Interest income” account in the consolidated statement of income. If in subsequent years, the fair value of a debt instrument should increase and the increase can be objectively related to an event occurring after the impairment loss was recognized in the consolidated statement of income, the impairment loss is reversed through the consolidated statement of income.
Offsetting Financial Instruments Financial assets and financial liabilities are offset and the net amount is reported in the consolidated balance sheet if, and only if, there is a currently enforceable legal right to offset the recognized amounts and there is an intention to settle on a net basis, or to realize the asset and settle the liability simultaneously.
Merchandise Inventories Merchandise inventories are valued at the lower of cost and net realizable value. Cost, which includes all costs directly attributable to acquisition, such as purchase price and transport costs, is primarily determined using the weighted average method. Net realizable value is the estimated selling price in the ordinary course of business, less estimated costs necessary to make the sale.
Land and Development and Condominium and Residential Units for Sale Land and development and condominium and residential units for sale are stated at the lower of cost and net realizable value. Cost includes those costs incurred for development and improvement of the properties. Net realizable value is the selling price in the ordinary course of business less costs to complete and the estimated cost to make the sale.
Land and development includes properties held for future development and properties being constructed for sale in the ordinary course of business, rather than to be held for rental or capital appreciation. Cost incurred for the development and improvement of the properties includes the following:
� Land cost; � Amounts paid to contractors for construction and development; and, � Borrowing costs, planning and design costs, costs of site preparation, professional fees,
property transfer taxes, construction overheads and other related costs.
Investments in Associate Companies and Joint Ventures An associate is an entity over which the Group has significant influence. Significant influence is the power to participate in the financial and operating policy decisions of the investee, but is not control or joint control over those policies.
A joint venture is a joint arrangement whereby the parties that have joint control of the arrangement have rights to the net assets of the joint venture. Joint control is the contractually agreed sharing of control of an arrangement, which exists only when decisions about the relevant activities require unanimous consent of the parties sharing control.
The considerations made in determining significant influence or joint control is similar to those necessary to determine control over subsidiaries.

- 11 -
The Group’s investments in associate companies and joint ventures are accounted for under the equity method of accounting. Under the equity method, investment in associate companies and joint ventures is carried in the consolidated balance sheet at cost plus post-acquisition changes in the Group’s share in net assets of the associate or joint venture.
On acquisition of the investment, any difference between the cost of the investment and the investor’s share in the net fair value of the associate’s or joint venture’s identifiable assets, liabilities and contingent liabilities is accounted for as follows:
a. goodwill relating to an associate or joint venture is included in the carrying amount of the investment. However, amortization of that goodwill is not permitted and is therefore not included in the determination of the Group’s share in the associate’s or joint venture’s profits or losses; and,
b. any excess of the Group’s share in the net fair value of the associate’s and joint venture’s identifiable assets, liabilities and contingent liabilities over the cost of the investment is included as income in the determination of the investor's share of the associate's or joint venture’s profit or loss in the period in which the investment is acquired.
The consolidated statement of income reflects the share in the results of operations of the associate or joint venture. Where there has been a change recognized directly in the equity of the associate or joint venture, the Group recognizes its share in any changes and discloses this in the consolidated statement of comprehensive income. Profits and losses resulting from transactions between the Group and the associate or joint venture are eliminated to the extent of the Group’s interest in the associate or joint venture.
Appropriate adjustments to the investor’s share of the associate’s or joint venture’s profit or loss after acquisition are made to account for the depreciation of the depreciable assets based on their fair values at the acquisition date and for impairment losses recognized by the associate or joint venture, such as for goodwill or property, plant and equipment.
After application of the equity method, the Group determines whether it is necessary to recognize any impairment loss with respect to the Group’s net investment in the associate companies and joint ventures. At each reporting date, the Group determines whether there is objective evidence that the investment in the associate companies and joint ventures is impaired. If there is such evidence, the Group calculates the amount of impairment as the difference between the recoverable amount of the associate companies and joint ventures and its carrying value, then, recognizes the loss in the statement of income.
Upon loss of significant influence over the associate or joint control over the joint venture, the Group measures and recognizes any retained investment at its fair value. Any difference between the carrying amount of the associate companies and joint ventures upon loss of significant influence or joint control and the fair value of the retained investment and proceeds from disposal is recognized in profit or loss.
Property and Equipment Property and equipment, except land, is stated at cost less accumulated depreciation and amortization and any accumulated impairment in value. Land is stated at cost less any impairment in value.

- 12 -
The initial cost of property and equipment consists of its purchase price, including import duties, taxes and any directly attributable costs necessary in bringing the asset to its working condition and location for its intended use. Cost also includes any related asset retirement obligation and related interest incurred during the construction.
Major repairs are capitalized as part of property and equipment only when it is probable that future economic benefits associated with the item will flow to the Group and the cost of the items can be measured reliably. All other repairs and maintenance are charged against current operations as incurred.
Depreciation and amortization are calculated on a straight-line basis over the following estimated useful lives of the assets:
Buildings and improvements 5–25 years Store equipment and improvements 5–10 years Data processing equipment 5–8 years Furniture, fixtures and office equipment 3–10 years Machinery and equipment 5–10 years Leasehold improvements 5–10 years or term of the lease,
whichever is shorter Transportation equipment 5–10 years
The residual values, useful lives and method of depreciation and amortization of the assets are reviewed and adjusted, if appropriate, at the end of each reporting period. The carrying values of the assets are reviewed for impairment when events or changes in circumstances indicate that the carrying values may not be recoverable.
Fully depreciated assets are retained in the accounts until they are no longer in use and no further depreciation and amortization is credited or charged to current operations.
When property and equipment are retired or otherwise disposed of, the cost and related accumulated depreciation and amortization and accumulated provision for impairment losses are removed from the accounts and any resulting gain or loss is charged to profit or loss.
Investment Properties Investment properties include property that are held to earn rentals and for capital appreciation and property under construction or re-development. Investment properties, except land, are measured at cost, less accumulated depreciation and amortization and accumulated impairment in value. Land is stated at cost less any impairment in value.
Expenditures incurred after the investment property has been put in operation such as repairs and maintenance costs are charged to current operations.
Depreciation and amortization are calculated on a straight-line basis over the following estimated useful lives of the assets:
Land improvements 3–5 years Buildings and improvements 10–40 years Building equipment, furniture and others 3–15 years Building and leasehold improvements 5 years or term of the lease,
whichever is shorter

- 13 -
The residual values, useful lives and method of depreciation and amortization of the assets are reviewed and adjusted, if appropriate, at the end of each reporting period.
Investment property is derecognized when disposed or permanently withdrawn from use and no future economic benefit is expected from its disposal. Any gains or losses on the retirement or disposal of an investment property are charged to profit or loss.
Transfers are made to (from) investment property when there is a change in use evidenced by ending (commencement) of owner-occupation, or, commencement of an operating lease to another party (commencement of development with a view to sell).
For a transfer from investment property to owner-occupied property or inventories, the cost of property for subsequent accounting is its carrying value at the date of change in use. If the property occupied by the Group as an owner-occupied property becomes an investment property, the Group accounts for such property in accordance with the policy stated under property and equipment up to the date of change in use.
Construction in Progress Construction in progress represents structures under construction and is stated at cost. This includes cost of construction and other direct costs. Cost also includes interest on borrowed funds incurred during the construction period. Construction in progress is not depreciated until such time that the relevant assets are completed and are ready for use.
Tenants’ Deposits Tenants’ deposits are measured at amortized cost. Tenants’ deposits refer to security deposits received from various tenants upon inception of the respective lease contracts on the Group’s investment properties. At the termination of the lease contracts, the deposits received by the Group are returned to tenants, reduced by unpaid rental fees, penalties and/or deductions from repairs of damaged leased properties, if any. The related lease contracts usually have a term of more than twelve months.
Property Acquisitions, Business Combinations and Acquisitions of Non-controlling Interests
Property Acquisitions and Business Combinations. When property is acquired through corporate acquisitions or otherwise, management considers the substance of the assets and activities of the acquired entity in determining whether the acquisition represents an acquisition of a business.
When such an acquisition is not judged to be an acquisition of a business, it is not treated as a business combination. Rather, the cost to acquire the entity is allocated between the identifiable assets and liabilities of the entity based on their relative fair values at the acquisition date. Accordingly, no goodwill or additional deferred tax arises. Otherwise, the acquisition is accounted for as a business combination.
Business combinations are accounted for using the acquisition method except for business combinations under common control in which an accounting similar to pooling of interest method is used. Business combinations under common control are those in which all of the combining entities or businesses are controlled by the same party or parties both before and after the business combination, and that control is not transitory. Under the acquisition method, the cost of an acquisition is measured as the aggregate of the consideration transferred, measured at acquisition date fair value and the amount of any non-controlling interest in the acquiree. For each business combination, the acquirer measures the non-controlling interest in the acquiree either at fair value or at the proportionate share of the acquiree’s identifiable net assets. Transaction costs incurred

- 14 -
are expensed and included in “Selling, general and administrative expenses” account in the consolidated statement of income.
For accounting similar to pooling of interest method, the assets, liabilities and equity of the acquired companies for the reporting period in which the common control business combinations occur, and for any comparative periods presented, are included in the consolidated financial statements of the Group at their carrying amounts as if the combinations had occurred from the date when the acquired companies first became under the control of the Group. The excess of the cost of business combinations over the net carrying amounts of the assets and liabilities of the acquired companies is recognized under “Equity adjustments from common control transactions” account in the equity section of the consolidated balance sheet.
When the Group acquires a business, it assesses the financial assets and liabilities assumed for appropriate classification and designation in accordance with the contractual terms, economic circumstances and pertinent conditions as at the acquisition date. This includes the separation of embedded derivatives in host contracts by the acquiree.
If the business combination is achieved in stages, the acquisition date fair value of the acquirer’s previously held equity interest in the acquiree is re-measured at its acquisition date fair value and any resulting gain or loss is recognized in profit or loss. It is then considered in the determination of goodwill.
Any contingent consideration to be transferred by the acquirer will be recognized at fair value at the acquisition date. Subsequent changes to the fair value of the contingent consideration which is deemed to be an asset or liability, will be recognized in accordance with Philippine Accounting Standard (PAS) 39, Financial Instruments: Recognition and Measurement either in profit or loss or as a change to OCI. If the contingent consideration is classified as equity, it should not be re-measured and subsequent settlement is accounted for within equity.
Acquisitions of Non-controlling Interests. Changes in the Parent Company’s ownership interest in a subsidiary that do not result in a loss of control are accounted for as equity transactions (i.e., transactions with owners in their capacity as owners). In such circumstances, the carrying amounts of the controlling and non-controlling interests shall be adjusted to reflect the changes in their relative interests in the subsidiary. Any difference between the amount by which the non-controlling interests are adjusted and the fair value of the consideration paid shall be recognized directly in equity.
Goodwill
Initial Measurement of Goodwill or Gain on a Bargain Purchase. Goodwill is initially measured by the Group at cost being the excess of the aggregate of the consideration transferred and the amount recognized for non-controlling interest over the net identifiable assets acquired and liabilities assumed. If this consideration is lower than the fair value of the net assets of the subsidiary acquired, the difference is recognized in profit or loss as gain on a bargain purchase.
Subsequent Measurement of Goodwill. Following initial recognition, goodwill is measured at cost less any accumulated impairment losses.
Impairment Testing of Goodwill. For the purpose of impairment testing, goodwill acquired in a business combination is, from the acquisition date, allocated to each of the Group’s cash-generating units (CGU), or groups of CGUs, that are expected to benefit from the synergies

- 15 -
of the combination, irrespective of whether other assets or liabilities of the acquiree are assigned to those units or groups of units. Each unit or group of units to which the goodwill is allocated:
� represents the lowest level within the Group at which the goodwill is monitored for internal management purposes; and,
� is not larger than an operating segment as defined in PFRS 8, Operating Segments, before aggregation.
Frequency of Impairment Testing. Irrespective of whether there is any indication of impairment, the Group tests goodwill acquired in a business combination for impairment at least annually.
Allocation of Impairment Loss. An impairment loss is recognized for a CGU if the recoverable amount of the unit or group of units is less than the carrying amount of the unit or group of units. The impairment loss is allocated to reduce the carrying amount of the assets of the unit or group of units first to reduce the carrying amount of goodwill allocated to the CGU or group of units and then to the other assets of the unit or group of units pro rata on the basis of the carrying amount of each asset in the unit or group of units.
Measurement Period. If the initial accounting for a business combination is incomplete by the end of the reporting period in which the combination occurs, the Group reports in its consolidated financial statements provisional amounts for the items for which the accounting is incomplete. The measurement period ends as soon as the Group receives the information it was seeking about facts and circumstances that existed as of the acquisition date or learns that more information is not obtainable. The measurement period shall not exceed one year from the acquisition date.
Intangible Assets The cost of trademarks and brand names acquired in a business combination is the fair value as at the date of acquisition. The Group assessed the useful life of the trademarks and brand names to be indefinite because based on an analysis of all of the relevant factors, there is no foreseeable limit to the period over which the asset is expected to generate cash inflows for the Group.
Trademarks and brand names with indefinite useful lives are not amortized but are tested for impairment annually either individually or at the cash generating unit level. The useful life of an intangible asset is reviewed annually to determine whether the indefinite life assessment continues to be supportable. If not, the change in the useful life assessment from indefinite to finite is made on a prospective basis.
The cost of trademarks acquired as an asset is its acquisition cost and amortized over useful life.
Gains or losses arising from de-recognition of an intangible asset are measured as the difference between the net disposal proceeds and the carrying amount of the asset at the date of disposal and are recognized in profit or loss when the asset is derecognized.
Other Noncurrent Assets Other noncurrent assets include land use rights which are amortized over its useful life of 40–60 years.

- 16 -
Impairment of Nonfinancial Assets The carrying values (property and equipment, investment properties and investments in associate companies and joint ventures, intangibles with definite useful life and other noncurrent assets) are reviewed for impairment when events or changes in circumstances indicate that the carrying value may not be recoverable. If any such indication exists, and if the carrying value exceeds the estimated recoverable amount, the assets or CGUs are written-down to their recoverable amounts. The recoverable amount of the asset is the greater of fair value less costs to sell or value in use. The fair value less costs to sell is the amount obtainable from the sale of an asset in an arm’s length transaction between knowledgeable, willing parties, less costs of disposal. In assessing value in use, the estimated future cash flows are discounted to their present value using a pre-tax discount rate that reflects current market assessments of the time value of money and the risks specific to the asset. For an asset that does not generate largely independent cash inflows, the recoverable amount is determined for the CGU to which the asset belongs. Impairment losses are recognized in the consolidated statement of income in those expense categories consistent with the function of the impaired asset.
An assessment is made at each reporting date as to whether there is any indication that previously recognized impairment loss may no longer exist or may have decreased. If such indication exists, the recoverable amount is estimated. A previously recognized impairment loss is reversed only if there has been a change in the estimates used to determine the asset’s recoverable amount since the last impairment loss was recognized. If that is the case, the carrying amount of the asset is increased to its recoverable amount. That increased amount cannot exceed the carrying amount that would have been determined, net of depreciation and amortization, had no impairment loss been recognized for the asset in prior years. Such reversal is recognized in the consolidated statement of income. After such a reversal, the depreciation or amortization charge is adjusted in future periods to allocate the asset’s revised carrying amount, less any residual value, on a systematic basis over its remaining useful life.
Capital Stock Capital stock is measured at par value for all shares issued. Incremental costs incurred directly attributable to the issuance of new shares are shown in equity as deduction from proceeds, net of tax. Proceeds and/or fair value of considerations received in excess of par value, if any, are recognized as additional paid-in capital.
Revenue and Cost Recognition Revenue is recognized when it is probable that the economic benefits associated with the transaction will flow to the Group and the amount of the revenue can be reliably measured. Revenue is measured at the fair value of the consideration received or receivable, excluding discounts, rebates and sales taxes or duties. The Group assesses its revenue arrangements against specific criteria to determine if it is acting as a principal or as an agent. The Group has concluded that it is acting as principal in majority of its revenue arrangements.
Sale of Merchandise Inventories. Revenue is recognized when the significant risks and rewards of ownership of the goods have passed to the buyer, which is normally upon delivery. Sales returns and sales discounts are deducted from sales to arrive at sales shown in the consolidated statement of income.
Sale of goods under consignment arrangements with suppliers is recognized as revenue upon billing, delivery and transfer of goods to customers.

- 17 -
Sale of Real Estate. The Group assesses whether it is probable that the economic benefits will flow to the Group when the sales prices are collectible. Collectibility of the sales price is demonstrated by the buyer’s commitment to pay, which is supported by the buyer’s initial and continuous investments that motivates the buyer to honor its obligation. Collectibility is also assessed by considering factors such as collections, credit standing of the buyer and location of the property.
Revenue from sales of completed real estate projects is accounted for using the full accrual method. In accordance with Philippine Interpretations Committee Q&A No. 2006-01, the percentage-of-completion (POC) method is used to recognize income from sales of projects where the Group has material obligations under the sales contract to complete the project after the property is sold, the equitable interest has been transferred to the buyer, construction is beyond preliminary stage (i.e., engineering, design work, construction contracts execution, site clearance and preparation, excavation and the building foundation are finished), and the costs incurred or to be incurred can be measured reliably. Under this method, revenue is recognized as the related obligations are fulfilled, measured principally on the basis of the estimated completion of a physical proportion of the contract work.
Any excess of collections over the recognized receivables are included in the “Tenants’ deposits and others” account in the consolidated balance sheet. If any of the criteria under the full accrual or POC method is not met, the deposit method is applied until all the conditions for recording a sale are met. Pending recognition of sale, cash received from buyers are presented under the “Tenants’ deposits and others” account in the consolidated balance sheet.
Cost of real estate sales is recognized consistent with the revenue recognition method applied. Cost of condominium and residential units sold before the completion of the development is determined on the basis of the acquisition cost of the land plus its full development costs, which include estimated costs for future development works.
The cost of inventory recognized in the consolidated statement of income upon sale is determined with reference to the specific costs incurred on the property, allocated to saleable area based on relative size and takes into account the POC used for revenue recognition purposes.
Revenue from construction contracts are recognized using the POC method, measured principally on the basis of the estimated physical completion of the contract work.
Expected losses on contracts are recognized immediately when it is probable that the total contract costs will exceed total contract revenue. Changes in the estimated cost to complete the condominium project which affects cost of real estate sold and gross profit are recognized in the year in which changes are determined.
Rent. Revenue is recognized on a straight-line basis over the lease term or based on the terms of the lease as applicable.
Sale of Cinema and Amusement Tickets. Revenue is recognized upon receipt of cash from the customer which coincides with the rendering of services.
Gain on Sale of Investments in Associate Companies and Joint Ventures and Available-for-Sale Investments. Revenue is recognized upon delivery of the securities to and confirmation of the sale by the broker.

- 18 -
Dividend. Revenue is recognized when the Group’s right as a shareholder to receive the payment is established.
Management and Service Fees. Revenue and expense is recognized when earned and incurred, respectively, in accordance with the terms of the agreements.
Interest. Revenue is recognized as the interest accrues, taking into account the effective yield on the asset.
Selling, General, Administrative and Other Expenses. Costs and expenses are recognized as incurred.
Pension Benefits The net defined benefit liability or asset is the aggregate of the present value of the defined benefit obligation at the end of the reporting period reduced by the fair value of plan assets, adjusted for any effect of limiting a net defined benefit asset to the asset ceiling. The asset ceiling is the present value of any economic benefits available in the form of refunds from the plan or reductions in future contributions to the plan.
The cost of providing benefits under the defined benefit plans is actuarially determined using the projected unit credit method.
Defined benefit costs comprise the following:
� Service cost; � Net interest on the net defined benefit liability or asset; and, � Re-measurements of net defined benefit liability or asset.
Service costs which include current service costs, past service costs and gains or losses on non-routine settlements are recognized as expense in profit or loss. Past service costs are recognized on the earlier of the date of the plan amendment or curtailment, and the date the Group recognizes restructuring-related costs.
Net interest on the net defined benefit liability or asset is the change during the period in the net defined benefit liability or asset that arises from the passage of time which is determined by applying the discount rate based on government bonds to the net defined benefit liability or asset. Net interest on the net defined benefit liability or asset is recognized as expense or income in profit or loss.
Re-measurements comprising actuarial gains and losses, return on plan assets and any change in the effect of the asset ceiling (excluding net interest on defined benefit liability) are recognized immediately in OCI in the period in which they arise. Re-measurements are not reclassified to profit or loss in subsequent periods.
Plan assets are assets that are held by a long-term employee benefit fund. Plan assets are not available to the creditors of the Group, nor can they be paid directly to the Group. Fair value of plan assets is based on market price information. When no market price is available, the fair value of plan assets is estimated by discounting expected future cash flows using a discount rate that reflects both the risk associated with the plan assets and the maturity or expected disposal date of those assets (or, if they have no maturity, the expected period until the settlement of the related obligations). If the fair value of the plan assets is higher than the present value of the defined benefit obligation, the measurement of the resulting defined benefit asset is limited to the present

- 19 -
value of economic benefits available in the form of refunds from the plan or reductions in future contributions to the plan.
Foreign Currency-denominated Transactions Transactions in foreign currencies are initially recorded in the functional currency rate at the date of the transaction. Monetary assets and liabilities denominated in foreign currencies are restated at the functional currency rate of exchange as at reporting date. Nonmonetary items denominated in foreign currency are translated using the exchange rates as at the date of initial recognition. All differences are recognized in profit or loss.
Foreign Currency Translation The assets and liabilities of foreign operations are translated into Philippine peso at the rate of exchange as at reporting date and their respective statements of income are translated at the weighted average rates for the year. The exchange differences arising on the translation are included in the consolidated statement of comprehensive income and are presented within the “Cumulative translation adjustment” account in the consolidated statement of changes in equity. On disposal of a foreign entity, the deferred cumulative amount of exchange differences recognized in equity relating to that particular foreign operation is recognized in profit or loss.
Leases The determination of whether an arrangement is, or contains a lease is based on the substance of the arrangement and requires an assessment of whether the fulfillment of the arrangement is dependent on the use of a specific asset or assets and the arrangement conveys a right to use the asset.
Group as Lessee. Finance leases, which transfer to the Group substantially all the risks and benefits incidental to ownership of the leased item, are capitalized at the inception of the lease at the fair value of the leased property or, if lower, at the present value of the minimum lease payments. Lease payments are apportioned between the finance charges and reduction of the lease liability so as to achieve a constant rate of interest on the remaining balance of the liability. Finance charges are reflected in the consolidated statement of income.
Capitalized lease assets are depreciated over the shorter of the estimated useful life of the asset and the lease term, if there is no reasonable certainty that the Group will obtain ownership by the end of the lease term.
Leases which do not transfer to the Group substantially all the risks and benefits of ownership of the asset are classified as operating leases. Operating lease payments are recognized as expense in the consolidated statement of income on a straight-line basis over the lease term. Associated costs, such as maintenance and insurance, are expensed as incurred.
Group as Lessor. Leases where the Group does not transfer substantially all the risks and benefits of ownership of the asset are classified as operating leases. Lease income from operating leases is recognized as income on a straight-line basis over the lease term. Initial direct costs incurred in negotiating an operating lease are added to the carrying amount of the leased asset and recognized over the lease term on the same basis as rental income. Contingent rents are recognized as revenue in the period in which they are earned.

- 20 -
Provisions Provisions are recognized when the Group has a present obligation (legal or constructive) as a result of a past event, it is probable that an outflow of resources embodying economic benefits will be required to settle the obligation, and a reliable estimate can be made of the amount of the obligation. If the effect of the time value of money is material, provisions are determined by discounting the expected future cash flows at a pre-tax rate that reflects current market assessments of the time value of money and, where appropriate, the risks specific to the liability. Where discounting is used, the increase in the provision due to the passage of time is recognized as interest expense. Where the Group expects a provision to be reimbursed, the reimbursement is recognized as a separate asset but only when the receipt of the reimbursement is virtually certain.
Borrowing Cost Borrowing cost is capitalized as part of the cost of the asset if they are directly attributable to the acquisition or construction of a qualifying asset. Capitalization of borrowing cost commences when the activities to prepare the asset are in progress and expenditures and borrowing cost is being incurred. Borrowing cost is capitalized until the assets are substantially ready for their intended use. Borrowing cost is capitalized when it is probable that they will result in future economic benefits to the Group. All other borrowing costs are expensed as incurred. For borrowing associated with a specific asset, the actual rate on that borrowing is used. Otherwise, a weighted average cost of borrowings is used.
Taxes
Current Tax. Current tax assets and liabilities for the current and prior periods are measured at the amount expected to be recovered from or paid to the taxation authorities. The tax rates and tax laws used to compute the amount are those that are enacted or substantively enacted as at the end of the reporting period.
Deferred Tax. Deferred tax assets are recognized for all deductible temporary differences and carryforward benefits of excess Minimum Corporate Income Tax (MCIT) and Net Operating Loss Carryover (NOLCO), to the extent that it is probable that taxable profit will be available against which the deductible temporary differences and the carryforward benefits of excess MCIT and NOLCO can be utilized, except:
� where the deferred tax asset relating to the deductible temporary difference arises from the initial recognition of an asset or liability in a transaction that is not a business combination and, at the time of the transaction, affects neither the accounting profit nor taxable profit or loss; and,
� with respect to deductible temporary differences associated with investments in subsidiaries, associates and interests in joint ventures, deferred tax assets are recognized only to the extent that it is probable that the temporary differences will reverse in the foreseeable future and taxable profit will be available against which the temporary differences can be utilized.
The carrying amount of deferred tax assets is reviewed at the end of each reporting period and reduced to the extent that it is no longer probable that sufficient taxable profit will be available to allow all or part of the deferred income tax assets to be utilized. Unrecognized deferred tax assets are reassessed at the end of each reporting period and are recognized to the extent that it has become probable that future taxable profit will allow the deferred tax assets to be recovered.
Deferred tax assets and liabilities are measured at the tax rates that are expected to apply to the period the asset is realized or the liability is settled, based on tax rates and tax laws that have been enacted or substantively enacted as at reporting date.

- 21 -
Income tax relating to items recognized directly in the consolidated statement of comprehensive income is recognized in the consolidated statement of comprehensive income and not in the consolidated statement of income.
Deferred tax assets and deferred tax liabilities are offset, if a legally enforceable right exists to offset current tax assets against current tax liabilities and the deferred taxes relate to the same taxable entity and the same taxation authority.
Value-added Tax (VAT). Revenue, expenses and assets are recognized net of the amount of VAT, except:
� where the tax incurred on a purchase of assets or services is not recoverable from the taxation authority, in which case the tax is recognized as part of the cost of acquisition of the asset or as part of the expense item as applicable; and,
� for receivables and payables that are stated with the amount of tax included.
The net amount of VAT recoverable from, or payable to, the taxation authority is included as part of “Other current assets” or “Accounts payable and other current liabilities” accounts in the consolidated balance sheet.
Business Segments The Group is organized and managed separately according to the nature of business. The three major operating businesses of the Group are property, retail and financial services and others. These operating businesses are the basis upon which the Group reports its segment information in the consolidated financial statements.
Basic/Diluted Earnings Per Common Share (EPS) Basic EPS is computed by dividing the net income for the period attributable to owners of the Parent by the weighted-average number of issued and outstanding common shares during the period, with retroactive adjustment for any stock dividends declared.
For the purpose of computing diluted EPS, the net income for the period attributable to owners of the Parent and the weighted-average number of issued and outstanding common shares are adjusted for the effects of all dilutive potential ordinary shares.
Contingencies Contingent liabilities are not recognized in the consolidated financial statements. They are disclosed unless the possibility of an outflow of resources embodying economic benefits is remote. Contingent assets are not recognized in the consolidated financial statements but are disclosed when an inflow of economic benefits is probable.
Events after the Reporting Period Post year-end events that provide additional information about the Group’s financial position at the end of the reporting period (adjusting events) are reflected in the consolidated financial statements. Post year-end events that are not adjusting events are disclosed in the notes to the consolidated financial statements when material.
Cha nges in Accounting Policies and Disclosures The accounting policies adopted are consistent with those of the previous year except for the adoption of the following amendments to standards and improvements, starting January 1, 2015. The adoption did not have any significant impact on the Group’s consolidated financial statements.

- 22 -
� Amendments to PAS 19, Defined Benefit Plans: Employee Contributions
� Annual Improvements to PFRSs 2010–2012 Cycle • PFRS 2, Share-based Payment – Definition of Vesting Condition • PFRS 3, Business Combinations – Accounting for Contingent Consideration in a Business
Combination • PFRS 8, Operating Segments – Aggregation of Operating Segments and Reconciliation of
the Total of the Reportable Segments’ Assets to the Entity’s Assets • PAS 16, Property, Plant and Equipment, and PAS 38, Intangible Assets – Revaluation
Method – Proportionate Restatement of Accumulated Depreciation and Amortization • PAS 24, Related Party Disclosures – Key Management Personnel
� Annual Improvements to PFRSs 2011–2013 Cycle • PFRS 3, Business Combinations – Scope Exceptions for Joint Arrangements • PFRS 13, Fair Value Measurement – Portfolio Exception • PAS 40, Investment Property
Future Changes in Accounting Policies The following are the new standards, amendments and improvements to PFRS that were issued but are not yet effective as at December 31, 2015. The Group intends to adopt the applicable standards, interpretations, amendments and improvements when these become effective.
Deferred
� Philippine Interpretation IFRIC 15, Agreements for the Construction of Real Estate
Effective January 1, 2016
� PFRS 10, Consolidated Financial Statements, and PAS 28, Investments in Associates and Joint Ventures – Investment Entities: Applying the Consolidation Exception (Amendments)
� PAS 27, Separate Financial Statements - Equity Method in Separate Financial Statements (Amendments)
� PFRS 11, Joint Arrangements - Accounting for Acquisitions of Interests (Amendments)
� PAS 1, Presentation of Financial Statements – Disclosure Initiative (Amendments)
� PFRS 14, Regulatory Deferral Accounts
� PAS 16, Property, Plant and Equipment, and PAS 41, Agriculture - Bearer Plants (Amendments)
� PAS 16, Property, Plant and Equipment, and PAS 38, Intangible Assets - Clarification of Acceptable Methods of Depreciation and Amortization (Amendments)
Annual Improvements to PFRSs (2012–2014 cycle)
The Annual Improvements to PFRSs (2012–2014 cycle) are effective for annual periods beginning on or after January 1, 2016 and are not expected to have a material impact on the Group. They include:
• PFRS 5, Non-current Assets Held for Sale and Discontinued Operations – Changes in Methods of Disposal
• PFRS 7, Financial Instruments: Disclosures – Servicing Contracts
• PFRS 7 - Applicability of the Amendments to PFRS 7 to Condensed Interim Financial Statements
• PAS 19, Employee Benefits – Regional Market Issue Regarding Discount Rate

- 23 -
• PAS 34, Interim Financial Reporting – Disclosure of Information ‘elsewhere in the interim financial report’
Effective January 1, 2018
� PFRS 9, Financial Instruments
Standards issued by the IASB but not yet adopted locally by SEC and FRSC
� IFRS 15, Revenue from Contracts with Customers
� IFRS 16, Leases 4. Segment Information
The Group has identified three reportable operating segments as follows: property, retail, and financial services and others.
The property segment is involved in mall, residential and commercial development and hotels and convention centers operations. The mall segment develops, conducts, operates and maintains the business of modern commercial shopping centers and all businesses related thereto such as the conduct, operation and maintenance of shopping center spaces for rent, amusement centers, or cinema theaters within the compound of the shopping centers. Residential and commercial segments are involved in the development and transformation of major residential, commercial, entertainment and tourism districts through sustained capital investments in buildings and infrastructure. The hotels and convention centers segment engages in and carries on the business of hotels and convention centers and operates and maintains any and all services and facilities incident thereto.
The retail segment is engaged in the retail/wholesale trading of merchandise, such as dry goods, wearing apparels, food and other merchandise.
The financial services and others segment primarily includes the Parent Company which engages in asset management and capital investments, and associates which are involved in financial services.
The Board of Directors (BOD) monitors the operating results of its business units separately for the purpose of making decisions about resource allocation and performance assessment. Segment performance is evaluated based on operating profit or loss and is measured consistently with the operating profit or loss in the consolidated financial statements.

- 24 -
Operating Segment Financial Data
June 30, 2016
Property Retail
Financial Services
and Others Eliminations Consolidated (In Thousands) Revenue: External customers P=37,340,878 P=106,718,618 P=7,028,497 P=– P=151,087,993 Inter-segment 4,455,804 33,634 7,171,157 (11,660,595) – P=41,796,682 P=106,752,252 P=14,199,654 (P=11,660,595) P=151,087,993
Segment results: Income before income tax P=17,221,254 P=5,300,749 P=3,438,051 P=1,082,033 P=27,042,087 Provision for income tax (3,391,970) (1,590,589) (47,121) (58,297) (5,087,977) Net income P=13,829,284 3,710,160 P=3,390,930 P=1,023,736 P=21,954,110
Net income attributable to: Owners of the Parent P=13,531,104 P=3,523,683 P=3,390,930 (P=5,459,310) P=14,986,407 Non-controlling interests 298,180 186,477 – 6,483,046 6,967,703
June 30, 2015
Property Retail
Financial Services
and Others Eliminations Consolidated (In Thousands) Revenue: External customers P=34,480,530 P=98,169,111 P=6,595,712 P=– P=139,245,353 Inter-segment 10,804,333 17,198 11,203,259 (22,024,790) – P=45,284,863 P=98,186,309 P=17,798,971 (P=22,024,790) P=139,245,353
Segment results: Income before income tax P=23,028,433 P=4,612,885 P= 7,482,811 (P=10,836,816) P=24,287,313 Provision for income tax (3,084,701) (1,350,401) (36,774) – (4,471,876) Net income P=19,943,732 P=3,262,484 P=7,446,037 (P=10,836,816) P=19,815,437
Net income attributable to: Owners of the Parent P=19,641,992 P=3,104,595 P=7,446,037 (P=16,698,144) P=13,494,480 Non-controlling interests 301,740 157,889 – 5,861,328 6,320,957
5. Cash and Cash Equivalents
This account consists of:
June 30,
2016 December 31,
2015
(In Thousands)
Cash on hand and in banks (Note 20) P=3,913,165 P=9,790,556 Temporary investments (Note 20) 25,603,174 44,119,515 P=29,516,339 P=53,910,071
Cash in banks earn interest at the respective bank deposit rates. Temporary investments are made for varying periods of up to three months depending on the immediate cash requirements of the Group. These investments earn interest at prevailing temporary investment rates.
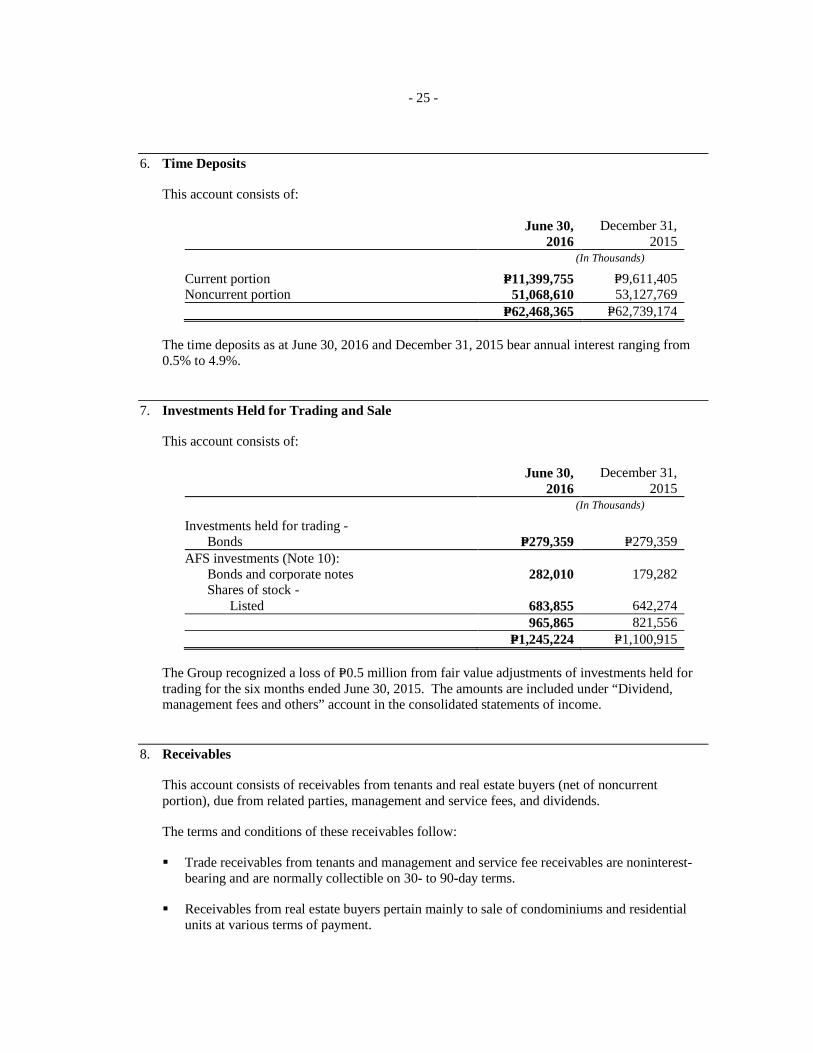
- 25 -
6. Time Deposits
This account consists of:
June 30,
2016 December 31,
2015
(In Thousands)
Current portion P=11,399,755 P=9,611,405 Noncurrent portion 51,068,610 53,127,769 P=62,468,365 P=62,739,174
The time deposits as at June 30, 2016 and December 31, 2015 bear annual interest ranging from 0.5% to 4.9%.
7. Investments Held for Trading and Sale
This account consists of:
June 30,
2016 December 31,
2015
(In Thousands)
Investments held for trading - Bonds P=279,359 P=279,359 AFS investments (Note 10): Bonds and corporate notes 282,010 179,282 Shares of stock - Listed 683,855 642,274 965,865 821,556 P=1,245,224 P=1,100,915
The Group recognized a loss of P=0.5 million from fair value adjustments of investments held for trading for the six months ended June 30, 2015. The amounts are included under “Dividend, management fees and others” account in the consolidated statements of income.
8. Receivables
This account consists of receivables from tenants and real estate buyers (net of noncurrent portion), due from related parties, management and service fees, and dividends.
The terms and conditions of these receivables follow:
� Trade receivables from tenants and management and service fee receivables are noninterest-bearing and are normally collectible on 30- to 90-day terms.
� Receivables from real estate buyers pertain mainly to sale of condominiums and residential units at various terms of payment.

- 26 -
� Dividends receivables are noninterest-bearing and are normally collectible within the next financial year.
� The terms and conditions relating to due from related parties are discussed in Note 20.
Allowance for impairment loss amounting to P=1,019.5 million and P=361.9 million as at June 30, 2016 and December 31, 2015, respectively, pertains to receivables from tenants which were identified to be impaired based on specific assessment.
Receivables other than those identified as impaired, are assessed by the Group’s management as good and collectible.
9. Other Current Assets
This account consists of:
June 30,
2016 December 31,
2015
(In Thousands)
Land and development (Note 14) P=24,322,178 P=19,814,615 Prepaid taxes and other prepayments 7,082,751 7,611,911 Condominium and residential units for sale (Note 14) 6,640,821 8,294,523 Advances and deposits 6,216,768 5,825,915 Input tax 2,413,607 2,951,332 Non-trade receivables 2,245,009 2,259,735 Notes receivable (Note 20) 981,435 981,435 Receivable from banks 679,071 1,911,701 Accrued interest receivable (Note 20) 539,845 545,075 Escrow fund (Notes 15 and 20) 484,151 437,639 Others 677,124 678,264 P=52,282,760 P=51,312,145
� Prepaid taxes and other prepayments consist of creditable tax certificates received by the Group and prepayments for insurance, real property taxes, rent, and other expenses which are normally utilized within the next financial period.
� Advances and deposits pertain to downpayments made to suppliers or contractors to cover preliminary expenses of the contractors in construction projects. The amounts are noninterest-bearing and are recouped upon every progress billing payment depending on the percentage of project accomplishment.
� Non-trade receivables include interest-bearing advances to third parties which are normally collectible within the next financial year.
� Notes receivable pertains to the loan extended by the Parent Company to Atlas Consolidated Mining and Development Corporation (Atlas) on September 17, 2015 amounting to P=981.4 million. The loan bears interest at 5.0%, payable quarterly, and is renewable for 90-day periods for a maximum of five years at the option of the Parent Company. Receivable from banks and credit cards are noninterest-bearing and are normally collectible on 30- to 90-day terms.

- 27 -
� Accrued interest receivable relates mostly to time deposits and are normally collected within the next financial year.
� Escrow fund pertains to amounts deposited in the account of an escrow agent as required by the Housing and Land Use Regulatory Board (HLURB) in connection with SMDC’s temporary license to sell properties for specific projects prior to HLURB’s issuance of a license to sell and certificate of registration. Under this temporary license to sell, all payments, inclusive of down payments, reservation and monthly amortization, among others, made by buyers within the selling period shall be deposited in the escrow account.
10. Available-for-sale Investments
This account consists of investments in shares of stock, corporate bonds and notes, net of allowance for impairment losses amounting to nil and P=31.3 million as at June 30, 2016 and December 31, 2015, respectively. Investments in bonds and corporate notes bear fixed annual interest rates ranging from 3.9% to 7.5% as at June 30, 2016 and December 31, 2015, respectively. These investments will mature on various dates beginning March 2017 to October 2023. Investments in shares of stock pertain to stocks of private as well as publicly-listed companies.
11. Investments in Associate Companies and Joint Ventures
The movements in this account follow:
June 30,
2016 December 31,
2015 (In Thousands) Cost: Balance at beginning of year P=112,416,544 P=95,151,355 Additions 188,050 15,546,154 Reclassification – 1,719,035 Balance at end of period 112,604,594 112,416,544 Accumulated equity in net earnings: Balance at beginning of year 57,458,474 50,334,664 Equity in net earnings 7,446,392 14,070,301 Dividends received (1,919,661) (5,173,241) Balance at end of period 62,985,205 59,231,724 Share in net unrealized gain (loss) on AFS investments
of associate companies 510,339 (1,773,250) 63,495,544 57,458,474 Translation adjustment (31,377) (5,627) P=176,068,761 P=169,869,391
There were no impairment losses for investments in associate companies and joint ventures in 2016 and 2015.

- 28 -
The associate companies and joint ventures of the Group follow:
Percentage of Ownership
June 30,
2016 December 31,
2015
Company Gross Effective Gross Effective Principal Activities
Associates BDO Unibank, Inc. and Subsidiaries (BDO) 46 44 46 44 Financial services China Banking Corporation and Subsidiaries
(China Bank) 23 20 23 20 Financial services Belle Corporation and Subsidiaries (Belle) 32 28 32 28 Real estate development and tourism Atlas and Subsidiaries 29 29 29 29 Mining Sodexo Benefits and Rewards Services
Philippines, Inc. (formerly Sodexo Motivation Solutions Philippines, Inc.) 40 40 40 40 Retail
Fast Retailing Philippines, Inc. 25 25 25 25 Retail CityMall Commercial Centers, Inc. (CityMall) 34 34 34 34 Real estate development and tourism Premium Leisure Corp. (PLC) 4 4 3 3 Gaming OCLP Holdings, Inc. (OHI) 40 20 40 20 Real estate development Fei Hua Real Estate Company (FHREC) 50 25 50 25 Real estate development Joint Venture Waltermart Mall 51 25 51 25 Shopping mall development
China Bank In May 2016, China Bank declared stock dividends equivalent to 8% of its outstanding capital stock which increased the number of common shares held by the Group by 33.5 million. The said shares were issued on June 3, 2016.
In August 2015, China Bank declared stock dividends equivalent to 8% of its outstanding capital stock which increased the number of common shares held by the Group by 31.0 million. The said shares were issued on September 9, 2015.
BDO SMIC’s equity interest in BDO was reduced by 1% as a result of BDO’s issuance of 64.5 million shares relative to its acquisition of One Network Bank on July 20, 2015.
Atlas At various dates in 2015, Primebridge acquired 7.4 million shares of Atlas for a total consideration of P=64.2 million.
OHI On May 7, 2015, SMPH acquired 39.96% collective ownership interest in OHI, through acquisition of 100% interest in six (6) holding entities, for a total consideration of P=15,433.0 million, which approximates the proportionate share of SMPH in the fair value of the identifiable net assets of OHI. OHI owns strategic residential, commercial and landbank areas in key cities in Metro Manila.
PLC At various dates in 2016, the Parent Company acquired a total of 243.6 million shares of PLC equivalent to 0.77% of the outstanding common shares, at an average price of P=0.56 per share for a total cost of P=137.1 million.

- 29 -
The fair value of investments in associate companies which are listed in the PSE follows:
June 30,
2016 December 31,
2015
(In Thousands)
BDO P=200,886,793 P=188,408,619 China Bank 17,163,361 15,557,433 Belle 11,290,194 9,720,256 Atlas 2,694,409 2,492,329 PLC 1,503,927 666,777

- 30 -
12. Property and Equipment
The movements in this account follow:
Buildings and Improvements
Store Equipment and
Improvements
Data Processing Equipment
Furniture, Fixtures
and Office Equipment
Machinery and
Equipment Leasehold
Improvements Transportation
Equipment Construction
in Progress Total (In Thousands) Cost Balance as at December 31, 2014 P=11,053,405 P=2,703,364 P=5,075,569 P=5,825,770 P=4,411,577 P=11,946,625 P=755,867 P=1,266,503 P=43,038,680 Additions 800,872 152,336 650,808 610,826 742,385 752,260 101,792 731,878 4,543,157 Reclassifications (289,467) (867,136) (21,409) (414,655) 1,016,637 37,516 8,723 (887,056) (1,416,847) Disposals/retirements (41,571) (41,964) (581,556) (46,750) (51,510) (11,200) (6,365) (6,506) (787,422) Balance as at December 31, 2015 11,523,239 1,946,600 5,123,412 5,975,191 6,119,089 12,725,201 860,017 1,104,819 45,377,568 Additions 190,552 93,450 363,747 276,292 274,434 415,476 85,082 442,202 2,141,235 Reclassifications 17,854 (15,030) 19,913 (32,469) 136,404 (131,540) 3,220 (160,265) (161,913) Disposals/retirements (1,512) (32) (42,557) (2,473) (24,138) (2,379) (1,804) (177,170) (252,065) Balance as at June 30, 2016 P=11,730,133 P=2,024,988 P=5,464,515 P=6,216,541 P=6,505,789 P=13,006,758 P=946,515 P=1,209,586 P=47,104,825
Accumulated Depreciation and Amortization Balance as at December 31, 2014 P=2,893,140 P=1,668,968 P=3,711,879 P=3,317,564 P=2,831,563 P=8,262,181 P=450,371 P=– P=23,135,666 Depreciation and amortization 847,044 214,937 588,416 569,906 645,372 1,236,659 68,713 – 4,171,047 Reclassifications (256,195) (496,178) (83,987) (350,202) 456,284 (167,450) 15,590 – (882,138) Disposals/retirements (19,623) (41,725) (314,281) (21,546) (35,086) (9,925) (4,609) – (446,795) Balance as at December 31, 2015 3,464,366 1,346,002 3,902,027 3,515,722 3,898,133 9,321,465 530,065 – 25,977,780 Depreciation and amortization 428,312 98,347 289,925 293,395 321,536 585,664 35,968 – 2,053,147 Reclassifications (2,271) (8,975) 1,894 (9,265) 19,068 (166,878) 2,419 – (164,008) Disposals/retirements – (174) (6,864) (551) (9,993) (1,756) (1,804) – (21,142) Balance as at June 30, 2016 P=3,890,407 P=1,435,200 P=4,186,982 P=3,799,301 P=4,228,744 P=9,738,495 P=566,648 P=– P=27,845,777
Net Book Value As at June 30, 2016 P=7,839,726 P=589,788 P=1,277,533 P=2,417,240 P=2,277,045 P=3,268,263 P=379,867 P=1,209,586 P=19,259,048 As at December 31, 2015 8,058,873 600,598 1,221,385 2,459,469 2,220,956 3,403,736 329,952 1,104,819 19,399,788

- 31 -
13. Investment Properties
The movements in this account follow:
Land and
Improvements
Buildings and
Improvements
Building Equipment,
Furniture and Others
Construction in Progress Total
(In Thousands)
Cost Balance as at December 31, 2014 P=46,567,657 P=146,933,481 P=25,125,352 P=38,807,826 P=257,434,316 Additions 18,590,095 16,989,356 1,814,237 9,480,701 46,874,389 Reclassifications 335,349 14,738,719 2,229,377 (16,059,390) 1,244,055 Translation adjustment 64,091 99,036 12,795 72,742 248,664 Disposals (311,144) (2,833,882) (87,659) (6,071) (3,238,756) Balance as at December 31, 2015 65,246,048 175,926,710 29,094,102 32,295,808 302,562,668 Additions 2,655,712 5,335,755 1,556,536 3,893,571 13,441,574 Reclassifications (129,946) 6,966,725 406,937 (6,439,790) 803,926 Translation adjustment (27,161) (520,470) (58,768) (311,696) (918,095) Disposals (170,991) – (21,373) (364,637) (557,001) Balance as at June 30, 2016 P=67,573,662 P=187,708,720 P=30,977,434 P=29,073,256 P=315,333,072
Accumulated Depreciation, Amortization and Impairment Loss
Balance as at December 31, 2014 P=1,492,584 P=29,872,293 P=14,057,448 P=123,564 P=45,545,889 Depreciation and amortization 229,824 4,681,811 2,279,957 – 7,191,592 Reclassifications (18,722) 398,055 446,328 – 825,661 Translation adjustment 4,041 16,752 18,563 – 39,356 Reversal of impairment loss – – – (123,564) (123,564) Disposals (41,085) (360,637) (98,046) – (499,768) Balance as at December 31, 2015 1,666,642 34,608,274 16,704,250 – 52,979,166 Depreciation and amortization 122,933 2,604,637 1,136,479 – 3,864,049 Reclassifications 59,977 (44,436) (66,219) – (50,678) Translation adjustment (18,143) (73,420) (26,774) – (118,337) Reversal of impairment loss – – – – – Disposals (77,921) – (17,935) – (95,856) Balance as at June 30, 2016 P=1,753,488 P=37,095,055 P=17,729,801 P=– P=56,578,344
Net Book Value As at June 30, 2016 P=65,820,174 P=150,613,665 P=13,247,633 P=29,073,256 P=258,754,728 As at December 31, 2015 63,579,406 141,318,436 12,389,852 32,295,808 249,583,502
Construction in progress pertains to costs incurred for the construction of new malls and renovation and expansion of existing malls.
14. Land and Development and Condominium and Residential Units for Sale
This account consists of:
June 30,
2016 December 31,
2015
(In Thousands)
Condominium and residential units for sale (Note 9) P=6,640,821 P=8,294,523 Land and development 48,732,224 47,201,323 P=55,373,045 P=55,495,846
Condominium units for sale pertain to the completed projects of SMDC, HPI, Costa and ICDC.

- 32 -
Land and development include the cost of land as well as construction cost of ongoing residential projects. Land and Development The movements in this account follow:
June 30,
2016 December 31,
2015
(In Thousands)
Balance at beginning of year P=47,201,323 P=46,201,390 Development cost incurred 6,157,274 11,827,278 Cost of real estate sold (3,871,337) (6,600,008) Transfer to condominium and residential units
for sale (1,506,193) (6,149,228) Land acquisition 552,676 1,534,242 Borrowing cost capitalized 167,414 407,549 Transfer to property and equipment and others 31,067 (19,900) Balance at end of period 48,732,224 47,201,323 Less current portion 24,322,178 19,814,615 Noncurrent portion P=24,410,046 P=27,386,708
Included in Land and development is Land held for future development with details as follows:
June 30,
2016 December 31,
2015 (In Thousands) Balance at beginning of year P=1,866,660 P=1,601,748 Acquisition and transferred-in costs and others (47,896) 264,912 Balance at end of period P=1,818,764 P=1,866,660
The average rates used to determine the amount of borrowing costs eligible for capitalization range from 3.8% to 5.1% in 2016 and 4.2% to 5.2% in 2015.
15. Intangibles and Other Noncurrent Assets
Intangibles and other noncurrent assets include Goodwill and Trademarks and brandnames with carrying values of P=16.2 billion and P=8.5 billion as at June 30, 2016 and December 31, 2015, respectively.
Goodwill is allocated to SM Prime, Supervalue, Inc. (SVI), Super Shopping Market, Inc. (SSMI), PMI, the Net Group, WSI and others as separate CGUs.

- 33 -
Other Noncurrent Assets This account consists of:
June 30,
2016 December 31,
2015
(In Thousands)
Deposits and advance rentals P=10,738,451 P=10,867,776 Receivables from real estate buyers 10,019,826 7,962,615 Land use rights 9,644,221 9,563,565 Long-term notes (Note 25) 5,215,203 927,000 Derivative assets (Note 25) 3,515,934 3,964,807 Deferred input VAT 2,916,086 3,287,375 Defined benefit asset 653,536 553,543 Escrow fund (Note 20) 132,460 132,460 Others 1,934,823 1,668,211 P=44,770,540 P=38,927,352
� Deposits and advance rentals substantially pertain to the lease agreements entered into by SM Prime for certain parcels of land where some of its malls are constructed. The lease agreements provide that security deposits will be applied to future rentals. Consequently, said deposits and advance rentals are not re-measured at amortized cost.
� Long-term notes pertain to loans extended by the Parent Company to Atlas at various dates in 2016 and 2015. The loans bear interest ranging from 4.0% to 5.0% per annum, payable quarterly and semi-annually within five years, subject to repricing at prevailing market rate and with prepayment option in full or in part, prior to maturity.
� Escrow fund pertains mainly to funds deposited by the Parent Company in the account of an escrow agent as required by the SEC in connection with the corporate restructuring in 2013. The escrow fund also include deposits made by SMDC for payments of liability arising from acquisition of land (see Note 9).
16. Bank Loans
This account consists of unsecured Philippine peso-denominated loans obtained from local banks amounting to P=6,694.8 million and P=9,923.2 million as at June 30, 2016 and December 31, 2015, respectively, with maturities of less than one year. The peso-denominated loans bear annual interest rates ranging from 2.40% to 3.00% and 2.00% to 4.15% in June 30, 2016 and December 31, 2015, respectively.

- 34 -
17. Accounts Payable and Other Current Liabilities
This account consists of:
June 30,
2016 December 31,
2015
(In Thousands)
Trade P=35,904,744 P=43,599,678 Accrued expenses 13,010,616 12,149,516 Nontrade 3,952,547 3,674,874 Tenants and customers’ deposits 3,586,538 4,423,313 Payable arising from acquisition of land 3,296,921 3,188,749 Payable to government agencies 1,808,000 3,544,674 Accrued interest (Note 20) 1,741,463 1,870,031 Due to related parties (Note 20) 712,412 2,444,429 Gift checks redeemable and others 2,291,558 2,651,475 P=66,304,799 P=77,546,739
The terms and conditions of the above liabilities follow:
� Trade payables primarily consist of liabilities to suppliers and contractors. These are noninterest-bearing and are normally settled on 30-to 60-day terms.
� Accrued expenses pertain to accrual for selling, general and administrative expenses which are normally settled within the next financial year.
� Nontrade payables, accrued interest and others are expected to be settled within the next financial year.
� Payable arising from acquisition of land is expected to be settled within the next financial year.
� Payable to government agencies mainly consists of output tax which is normally settled within the next financial year.
� The terms and conditions relating to due to related parties is discussed in Note 20.
� Gift checks are redeemable at face value.

- 35 -
18. Long-term Debt
This account consists of:
Availment Maturity Interest rate/Term Security June 30,
2016 December 31,
2015 (In Thousands)
Parent Company U.S. dollar-denominated: Fixed rate bonds US$350.0 million senior bonds June 10, 2014 June 10, 2024 Fixed 4.88%; semi-annual Unsecured P=16,471,000 P=16,471,000
US$500.0 million senior bonds October 17, 2012 October 17, 2019 Fixed 4.25%; semi-annual Unsecured 23,530,000 23,530,000
US$400.0 million exchanged bonds October 13, 2010 October 13, 2017 Fixed 5.50%; semi-annual Unsecured 17,689,620 18,277,891
US$300.0 million five-year term loans June 19, 2013 - July 2, 2013
May 15, 2018 Floating six-month LIBOR + margin; semi-annual
Unsecured 14,118,000 14,118,000
Peso-denominated:
Seven-year and ten-year retail bonds
Series C Bonds July 16, 2012 July 16, 2019 Fixed 6.00%; semi-annual Unsecured 4,648,460 4,648,460
Series D Bonds July 16, 2012 July 16, 2022 Fixed 6.94%; semi-annual Unsecured 7,683,810 7,683,810
Series E Bonds May 19, 2014 May 19, 2021 Fixed 5.30%; semi-annual Unsecured 11,669,620 11,669,620
Series F Bonds May 19, 2014 May 19, 2024 Fixed 5.61%; semi-annual Unsecured 3,330,380 3,330,380
Five-year and seven-year retail bond
Series B Bonds June 25, 2009 June 25, 2016 Fixed 9.10%; semi-annual Unsecured – 1,000,000
Other peso bank loans April 23, 2013 - June 30, 2014
January 14, 2019 - June 23, 2024
Fixed 4.39%-5.4% and PDST-R2 + margin; semi-annual and quarterly
Unsecured 18,997,950 19,000,300
Subsidiaries
U.S. dollar-denominated:
Five-year term loans May 6, 2011 - March 21, 2016
March 21, 2016 - January 29, 2021
LIBOR + spread; semi-annual Unsecured 50,286,334 50,354,200
Five-year bilateral loans December 7, 2012 - August 5, 2013
August 30, 2017 LIBOR + spread; semi-annual Unsecured 2,353,000 2,353,000
Other U.S. dollar loans November 20, 2013 September 17, 2018 LIBOR + spread; semi-annual Unsecured 1,176,500 1,176,500
(Forward)

- 36 -
Availment Maturity Interest rate/Term Security June 30,
2016 December 31,
2015 (In Thousands)
China Yuan Renminbi-denominated: Five-year loan July 28, 2015 -
June 7, 2016 December 31, 2019 -
June 1, 2020 CBC rate less 10%; quarterly Secured P=518,145 P=32,249
Peso-denominated:
Five-year, seven-year and ten-year retail bonds September 1, 2014 - November 25, 2015
March 1, 2020 - November 25, 2025
Fixed 4.51%-5.74%; quarterly Unsecured 38,324,206 38,324,206
Fixed rate term loans June 3, 2013 - June 29, 2016
October 4, 2016 - June 27, 2023
Fixed 3.84%-5.94%; semi-annual and quarterly
Unsecured 19,707,500 21,443,500
July 12, 2014 - July 31, 2014
July 12, 2021 - July 31, 2021
Fixed 5.25%-5.27%; quarterly
Secured 2,893,044 2,893,044
Five-year and ten-year notes June 19, 2012 June 20, 2017 - June 19, 2022
Fixed 5.91%-6.74%; PDST-R2 + margin; quarterly
Unsecured 6,528,000 7,226,500
Five-year, seven-year and ten-year notes January 12, 2012 January 13, 2017 - January 12, 2022
Fixed 5.86%-6.10%; PDST-R2 + margin; quarterly
Unsecured 3,993,600 4,229,200
Seven-year and ten-year corporate notes June 13, 2011 - December 21, 2015
December 20, 2020 - December 21, 2022
Fixed 6.65%; PDST-R2 + margin; quarterly
Unsecured 5,760,000 6,520,000
Four-year and five-year floating rate notes October 31, 2013 - May 11, 2016
October 31, 2017 - May 11, 2023
PDST-R2 + margin; quarterly Unsecured 14,200,000 3,200,000
Five-year floating rate notes March 18, 2011 - June 17, 2011
March 19, 2016 - June 18, 2016
PDST-R2 + margin; quarterly Unsecured – 4,800,000
Fixed rate corporate notes June 3, 2013 - June 28, 2014
June 3, 2020 - June 3, 2023
Fixed 5.25%-5.88%; semi-annual Unsecured 8,674,900 8,683,100
Five-year bilateral loans October 24, 2011 October 24, 2016 PDST-R2 + margin; quarterly Unsecured 500,000 500,000
Other bank loans August 15, 2006 - June 8, 2015
August 15, 2016 - June 8, 2020
Fixed 5.00%-9.75%; PDST-R2 + margin; semi-annual and quarterly
Unsecured 1,525,000 1,525,000
274,579,069 272,989,960
Less debt issue cost 1,819,885 1,827,891
272,759,184 271,162,069
Less current portion 6,677,987 25,994,800
P=266,081,197 P=245,167,269
LIBOR – London Interbank Offered Rate PDST-R2 – Philippine Dealing System Treasury Reference Rate – PM CBC – Central Bank of China

- 37 -
Subsidiaries
China Yuan Renminbi-denominated Five-Year Loan
¥74.0 million and ¥66.0 million loans as of June 30, 2016 and December 31, 2015, respectively, taken out of a ¥400.0 million loan facility obtained on July 28, 2015 to finance the construction of shopping malls. The loans are payable in quarterly installments until December 2019 and June 2020. These loans bear floating rates with quarterly re-pricing at prevailing rates dictated by the People’s Bank of China. The loans carry interest rates of 4.75% to 5.00% and are secured by a portion of investment properties in China.
Repayment Schedule
Gross Loan Debt Issue Cost Net
(In Thousands)
2016 P=2,327,094 (P=3,003) P=2,324,091 2017 25,080,356 (76,381) 25,003,975 2018 43,963,187 (373,315) 43,589,872 2019 56,011,799 (402,691) 55,609,108 2020 28,874,886 (127,701) 28,747,185 2021 57,715,597 (463,830) 57,251,767 2022 19,063,170 (70,601) 18,992,569 2023 15,508,860 (77,425) 15,431,435 2024 24,003,080 (208,338) 23,794,742 2025 2,031,040 (16,600) 2,014,440 P=274,579,069 (P=1,819,885) P=272,759,184
Covenants The long-term debts of the Group contain certain covenants including adherence to financial ratios. The Parent Company’s loan covenants include adherence with financial ratios namely, (1) debt-to-equity ratio not to exceed 80:20, and, (2) current ratio at a minimum of 0.30, and, certain restrictions with respect to material change in ownership or control. As at June 30, 2016 and December 31, 2015, the Group is in compliance with the terms of its debt covenants.

- 38 -
19. Equity
Capital Stock
a. Common stock
Number of Shares
June 30,
2016 December 31,
2015 Authorized - P=10 par value per share 1,190,000,000 1,190,000,000
Issued and subscribed: Balance at beginning of year 803,055,405 796,340,646 Issuances – 6,714,759 Balance at end of period 803,055,405 803,055,405
On various dates in 2015, additional 6,714,759 common shares were issued as a result of conversion of the Parent Company’s convertible bonds. The excess of the conversion price over par value totaling P=4,833.1 million in 2015 is presented under “Additional paid-in capital” account in the consolidated balance sheets.
As at June 30, 2016 and December 31 2015, the Parent Company is compliant with the minimum public float as required by the PSE.
Information on the Parent Company’s registration of securities under the Securities Regulation Code follows:
Date of SEC Approval Authorized
Shares Number of
Shares Issued Issue/Offer
Price March 22, 2005 105,000,000 P=250 November 6, 2007 56,000,000 218 June 14, 2007 100,000,000 10 April 25, 2007 25,023,038 10 October 4, 2010 to March 13, 2012
Conversion of convertible bonds 2,851,582 453 September 24, 2012 9,100,000 700 January 23, 2013 to July 5, 2013
Conversion of convertible bonds 7,651,851 781 June 14, 2013 500,000,000 10 June 24, 2013 157,000,000 10 July 12, 2013 657,314 10 July 18, 2013 to November 1, 2013
Conversion of convertible bonds 738,483 625 August 1, 2013 7,250,000 900 August 27, 2014
Conversion of convertible bonds 68,378 625 January 15, 2015 to April 9, 2015
Conversion of convertible bonds 6,714,759 625

- 39 -
The Parent Company declared stock dividends in 2013 and 2007. The total number of shareholders of the Parent Company is 1,244 as at June 30, 2016 and December 31, 2015.
b. Redeemable preferred shares
Number of shares
June 30,
2016 December 31,
2015 Authorized - P=10 par value per share 10,000,000 10,000,000
There are no issued and subscribed preferred shares as at June 30, 2016 and December 31, 2015.
Equity Adjustments from Common Control Transactions Equity adjustments from common control transactions mainly pertains to the acquisition of various SM China Companies by SM Prime in 2007 and various service companies by SM Retail in 2009. These acquisitions were considered as business reorganizations of companies under common control. Thus, the acquisitions were accounted for similar to the pooling of interest method.
In 2013, the Group executed a corporate restructuring to consolidate the Group’s real estate subsidiaries and real estate assets in SM Prime. At the consolidated level, all transactions with the subsidiaries were considered as equity transactions.
Retained Earnings
a. Appropriated
Following are the appropriations approved by the BOD:
Date of BOD Approval Amount
(In Thousands)
Initial appropriation November 5, 2003 P=5,000,000 Additional appropriation December 14, 2012 30,000,000 Reversal of appropriation April 25, 2013 (8,000,000) Reversal of appropriation November 4, 2015 (18,000,000) Additional appropriation November 4, 2015 27,000,000
Retained earnings appropriated as at June 30, 2016 is intended for the payment of certain long-term debts and new investments as follows: Timeline Amount (In Thousands) Debt servicing US$400.0 million 2017 P=18,800,000 US$180.0 million 2018 8,200,000 New investments 2016–2020 9,000,000
P=36,000,000

- 40 -
b. Unappropriated
The Parent Company’s cash dividend declarations in 2016 and 2015 follow: Declaration Date Record Date Payment Date Per Share Total (In Thousands) April 27, 2016 May 12, 2016 May 26, 2016 P=10.63 P=8,536,467 April 29, 2015 May 14, 2015 June 9, 2015 P=10.61 P=8,520,406
On March 2, 2016, the BOD approved the Parent Company’s:
• Increase in authorized capital stock from P=12,000.0 million, consisting of 1,190.0 million common shares and 10.0 million redeemable preferred shares both with a par value of P=10 per share, to P=28,000.0 million, consisting 2,790.0 million common shares and 10.0 million redeemable preferred shares both with a par value of P=10 per share.
• Declaration of 50% stock dividends in favor of stockholders on record as of August 3, 2016.
On April 27, 2016, the stockholders, which represent at least two-thirds of the outstanding capital stock of the Parent Company, approved the amendment of its articles of incorporation for the increase in its authorized capital stock as well as the declaration of 50% stock dividends.
Unappropriated retained earnings include the accumulated equity in net earnings of subsidiaries, associates and joint ventures amounting to P=158,598.2 million and P=147,055.7 million as at June 30, 2016 and December 31, 2015, respectively, that is not available for distribution until such time that the Parent Company receives the dividends from the respective subsidiaries, associates and joint ventures.
20. Related Party Disclosures
Parties are considered to be related if one party has the ability, directly and indirectly, to control the other party or exercise significant influence over the other party in making financial and operating decisions. Parties are also considered to be related if they are subject to common control.
The significant transactions with related parties follow:
a. Rent
The Group has existing lease agreements for office and commercial spaces with related companies (retail and banking group and other related parties under common stockholders).
b. Management and Service Fees
The Group pays management fees to Shopping Center Management Corporation and SM Lifestyle Entertainment, Inc. (related parties under common stockholders) for the management of certain office and mall premises.
SMIC and SM Retail also receive management and service fees from retail entities under common stockholders for management, consultancy, manpower and other services.

- 41 -
c. Dividend Income
The Group earns dividend income from certain related parties under common stockholders.
d. Cash Placements and Loans
The Group has certain bank accounts and cash placements as well as bank loans and debts with BDO and China Bank. Such accounts earn interest based on prevailing market interest rates.
e. Others
The Group, in the normal course of business, has outstanding receivables from and payables to related companies which are unsecured and normally settled in cash.
The related party transactions and outstanding balances as at and for the periods ended June 30, 2016 and 2015 and December 31, 2015 follow:
Transaction Amount Outstanding Amount June 30,
2016 June 30,
2015 June 30,
2016 December 31,
2015
Terms
Conditions (In Thousands) Banking Group Cash placement and investment in
debt securities P=– P=– P=83,527,155 P=106,498,300 Interest-bearing 0.50% to
4.90% Unsecured;
no impairment Interest receivable – – 381,954 396,819 Interest-bearing 0.50% to
4.90% Unsecured;
no impairment Interest income 1,150,567 1,229,838 – – Interest-bearing debt – – 7,994,938 8,361,170 Interest-bearing 1.63% to
9.75% Unsecured
Interest payable – – 29,530 30,330 Interest-bearing 1.63% to 9.75%
Unsecured Interest expense 233,544 283,957 – – Rent receivable – – 215,852 181,225 Noninterest-bearing Unsecured;
no impairment Rent income 374,061 323,927 – – Management fee receivable – – 28,257 29,405 Noninterest-bearing Unsecured;
no impairment Management fee income 624 2,005 – – Service fee receivable – – 44,508 129,418 Noninterest-bearing Unsecured;
no impairment Service fee income 322 124 – – Escrow fund – – 614,151 567,639 Interest-bearing 1.3% to
1.4% Unsecured;
no impairment Retail and Other Entities Rent receivable – – 643,929 896,132 Noninterest-bearing Unsecured;
no impairment Rent income 2,062,775 1,981,754 – – Management fee receivable – – 149,607 226,124 Noninterest-bearing Unsecured;
no impairment Management fee income 198,818 165,512 – – Management fee payable – – 56,869 117,402 Noninterest-bearing Unsecured Management fee expense 578,338 598,985 – – Service fee receivable – – 115,857 149,232 Noninterest-bearing Unsecured;
no impairment Service fee income 313,531 303,395 Dividend receivable – – 489,265 487,427 Noninterest-bearing Unsecured;
no impairment Dividend income 27,463 – – – Due from related parties – – 959,529 1,350,612 Noninterest-bearing Unsecured;
no impairment Due to related parties – – 712,412 2,444,429 Noninterest-bearing Unsecured Interest receivable – – 31,916 9,467 Interest-bearing 4.0% to
5.0% Unsecured;
no impairment Interest income 129,400 9,863 – – Notes receivable/
Long-term notes – – 6,196,638 1,908,435 Interest-bearing 4.0% to
5.0% Unsecured;
no impairment
Terms and Conditions of Transactions with Related Parties The Group did not make any provision for impairment loss relating to amounts owed by related parties. There have been no guarantees provided or received for any related party receivables or payables.
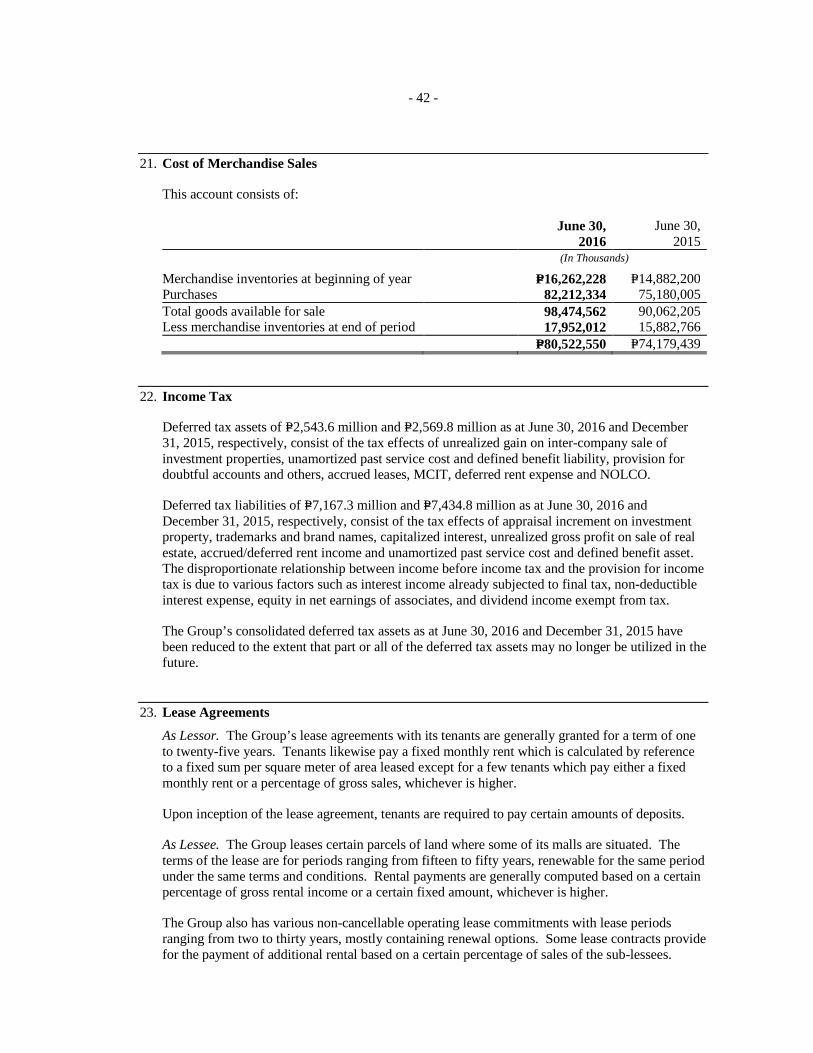
- 42 -
21. Cost of Merchandise Sales
This account consists of:
June 30,
2016 June 30,
2015
(In Thousands)
Merchandise inventories at beginning of year P=16,262,228 P=14,882,200 Purchases 82,212,334 75,180,005 Total goods available for sale 98,474,562 90,062,205 Less merchandise inventories at end of period 17,952,012 15,882,766 P=80,522,550 P=74,179,439
22. Income Tax
Deferred tax assets of P=2,543.6 million and P=2,569.8 million as at June 30, 2016 and December 31, 2015, respectively, consist of the tax effects of unrealized gain on inter-company sale of investment properties, unamortized past service cost and defined benefit liability, provision for doubtful accounts and others, accrued leases, MCIT, deferred rent expense and NOLCO.
Deferred tax liabilities of P=7,167.3 million and P=7,434.8 million as at June 30, 2016 and December 31, 2015, respectively, consist of the tax effects of appraisal increment on investment property, trademarks and brand names, capitalized interest, unrealized gross profit on sale of real estate, accrued/deferred rent income and unamortized past service cost and defined benefit asset. The disproportionate relationship between income before income tax and the provision for income tax is due to various factors such as interest income already subjected to final tax, non-deductible interest expense, equity in net earnings of associates, and dividend income exempt from tax.
The Group’s consolidated deferred tax assets as at June 30, 2016 and December 31, 2015 have been reduced to the extent that part or all of the deferred tax assets may no longer be utilized in the future.
23. Lease Agreements
As Lessor. The Group’s lease agreements with its tenants are generally granted for a term of one to twenty-five years. Tenants likewise pay a fixed monthly rent which is calculated by reference to a fixed sum per square meter of area leased except for a few tenants which pay either a fixed monthly rent or a percentage of gross sales, whichever is higher.
Upon inception of the lease agreement, tenants are required to pay certain amounts of deposits.
As Lessee. The Group leases certain parcels of land where some of its malls are situated. The terms of the lease are for periods ranging from fifteen to fifty years, renewable for the same period under the same terms and conditions. Rental payments are generally computed based on a certain percentage of gross rental income or a certain fixed amount, whichever is higher.
The Group also has various non-cancellable operating lease commitments with lease periods ranging from two to thirty years, mostly containing renewal options. Some lease contracts provide for the payment of additional rental based on a certain percentage of sales of the sub-lessees.

- 43 -
Tenant’s deposits amounted to P=18,794.8 million and P=14,014.7 million as at June 30, 2016 and December 31, 2015, respectively.
24. Financial Risk Management Objectives and Policies
The Group’s principal financial instruments, other than derivatives, consist of bank loans, long-term debt, AFS investments, investments held for trading, time deposits, cash and cash equivalents, non-trade receivables, advances and deposits, receivable from banks, accrued interest receivable, and advances for project development. The main purpose of these financial instruments is to finance the Group’s operations. The Group has other financial assets and liabilities such as receivables and accounts payable and other current liabilities, which arise directly from its operations.
The Group also enters into derivative transactions, principally, cross-currency swaps, interest rate swaps, foreign currency call options, non-deliverable forwards and foreign currency range options. The purpose is to manage the interest rate and foreign currency risks arising from the Group’s operations and its sources of finance.
The main risks arising from the Group’s financial instruments are as follows:
� Interest rate risk. Fixed rate financial instruments are subject to fair value interest rate risk while floating rate financial instruments are subject to cash flow interest rate risk. Repricing of floating rate financial instruments is mostly done at intervals of three months or six months.
� Foreign currency risk. The Group’s exposure to foreign currency risk arises as the Parent Company and SM Prime have significant investments and debt issuances which are denominated in U.S. dollars and China Yuan Renminbi.
� Liquidity risk. Liquidity risk arises from the possibility that the Group may encounter difficulties in raising funds to meet commitments from financial instruments.
� Credit risk. Refers to the risk that a borrower will default on any type of debt by failing to make required payments.
� Equity price risk. The Group’s exposure to equity price risk pertains to its investments in quoted equity shares which are classified as AFS investments in the consolidated balance sheets. Equity price risk arises from the changes in the levels of equity indices and the value of individual stocks traded in the stock exchange.
The BOD reviews and approves policies for managing each of these risks. The Group’s accounting policies in relation to derivatives are set out in Note 3.
Interest Rate Risk The Group’s exposure to market risk for changes in interest rates relates primarily to the Group’s long-term debt obligations (see Note 18).
The Group maintains a conservative financing strategy and has preference for longer tenor credit with fixed interest rate that matches the nature of its investments. To manage this mix in a cost-efficient manner, the Group enters into interest rate swaps and cross-currency swaps in which the Group agrees to exchange, at specified intervals, the difference between fixed and variable interest amounts calculated by reference to an agreed notional amount. The interest rate swaps

- 44 -
economically hedge the underlying debt obligations. The cross-currency swaps were designated by the Group under cash flow hedge accounting (see Note 25).
As at June 30, 2016 and December 31, 2015, after taking into account the effect of the swaps, approximately 73% and 74%, respectively of the Group’s borrowings are kept at fixed interest rates.
Foreign Currency Risk The Group aims to reduce foreign currency risks by employing on-balance sheet hedges and derivatives such as foreign currency swap contracts, foreign cross-currency swaps, foreign currency call options, non-deliverable forwards and foreign currency range options.
As at June 30, 2016, the Group’s foreign currency-denominated assets and liabilities amounted to P=74,411.2 million ($1,581.2 million) and P=102,022.7 million ($1,966.8 million and ¥1,337.3 million), respectively.
As at December 31, 2015, the Group’s foreign currency-denominated assets and liabilities amounted to P=101,051.6 million ($2,147.3 million) and P=137,621.8 million ($2,160.5 million and ¥4,960.8 million), respectively.
As at June 30, 2016 and December 31, 2015, approximately 43.4% and 44.5%, respectively, of the Group’s borrowings were denominated in foreign-currency.
The following exchange rates were used in translating foreign currency-denominated assets and liabilities:
June 30, 2016 December 31, 2015 China Yuan Renminbi to U.S. dollar RMB6.6480 RMB6.4937 Philippine Peso to U.S. dollar P=47.06 P=47.06
Liquidity Risk The Group seeks to manage its liquidity profile to be able to finance capital expenditures and service maturing debts. To cover its financing requirements, the Group intends to use internally generated funds and proceeds from debt and equity issues and sales of certain assets. The Group also has readily available credit facilities with banks and related parties to meet its long-term financial liabilities.
As part of its liquidity risk management program, the Group regularly evaluates its projected and actual cash flow information and continuously assesses conditions in the financial markets for opportunities to pursue fund-raising initiatives. These initiatives may include bank loans, export credit agency-guaranteed facilities, debt capital and equity market issues.

- 45 -
The Group’s financial assets, which have maturities of less than 12 months, and used to meet its short-term liquidity needs, include the following:
June 30,
2016 December 31,
2015
(In Thousands)
Cash and cash equivalents P=29,516,339 P=53,910,071 Current portion of time deposits 11,399,755 9,611,405 Investments held for trading – bonds 279,359 279,359 Current portion of AFS investments - Bonds and corporate notes 282,010 179,282
Credit Risk The Group trades only with recognized and creditworthy related and third parties. It is the Group’s policy that all customers who wish to trade on credit terms are subject to credit verification procedures. In addition, receivable balances are monitored on a regular basis which aims to reduce the Group’s exposure to bad debts at a minimum level. Given the Group’s diverse base of customers, it is not exposed to large concentrations of credit risk.
With respect to credit risk arising from the other financial assets of the Group which consist of cash and cash equivalents, time deposits, investments held for trading, AFS investments and certain derivative instruments, the Group’s exposure to credit risk arises from default of the counterparty, with a maximum exposure equal to the carrying amount of these instruments, without considering the effects of collateral. Since the Group trades only with recognized related and third parties, there is no requirement for collateral.
Receivable from sale of real estate has minimal credit risk and is effectively collateralized by the respective units sold since title to the real estate properties are not transferred to the buyers until full payment is made.
As at June 30, 2016 and December 31, 2015, the financial assets, except for certain receivables and AFS investments, are generally viewed by management as good and collectible considering the credit history of the counterparties. Past due or impaired financial assets are very minimal in relation to the Group’s total financial assets.
Credit Quality of Financial Assets The credit quality of financial assets is managed by the Group using high quality and standard quality as internal credit ratings.
High Quality. This pertains to a counterparty who is not expected to default in settling its obligations, thus credit risk exposure is minimal. This normally includes large prime financial institutions, companies and government agencies.
Standard Quality. Other financial assets not belonging to high quality financial assets are included in this category.
Equity Price Risk Management monitors the equity securities in its investment portfolio based on market expectations. Material equity investments within the portfolio are managed on an individual basis and all buy and sell decisions are approved by management.

- 46 -
Capital Management The primary objective of the Group’s capital management is to ensure that it maintains a strong credit rating and healthy capital ratios in order to support its business and maximize shareholder value.
The Group manages its capital structure and makes adjustments to it, in light of changes in economic conditions. To maintain or adjust the capital structure, the Group may adjust the dividend payment to shareholders, pay off existing debts, return capital to shareholders or issue new shares.
The Group’s gearing ratios follow:
June 30,
2016 December 31,
2015 Gross 49:51 50:50 Net 39:61 36:64
25. Financial Instruments
The Group’s financial assets and liabilities by category and by class, except for those with carrying amounts that are reasonable approximations of fair values, follow:
June 30, 2016
Carrying
Value Fair value
Quoted Prices in Active Markets (Level 1)
Significant Observable
Inputs (Level 2)
Significant Unobservable
Inputs (Level 3)
(In Thousands) Assets Measured at Fair Value Financial assets at FVPL - Derivative assets P=3,515,934 P=3,515,934 P=– P=3,515,934 P=– Assets for which Fair Values are Disclosed Loans and receivables: Time deposits - noncurrent portion 51,068,610 67,645,442 – – 67,645,442 Receivables - net (including noncurrent portion
of receivables from real estate buyers) 43,009,994 42,914,568 – – 42,914,568 Long-term notes (Note 15) 5,215,203 5,727,273 – – 5,727,273 99,293,807 116,287,283 – – 116,287,283 P=102,809,741 P=119,803,217 P=– P=3,515,934 P=116,287,283
Liabilities for which Fair Values are Disclosed Other Financial Liabilities: Long-term debt (noncurrent portion and net of
unamortized debt issue cost) P=266,081,197 P=285,524,487 P=– P=– P=285,524,487 Tenants’ deposits and others* 20,393,575 23,641,761 – – 23,641,761 P=286,474,772 P=309,166,248 P=– P=– P=309,166,248 *Excluding nonfinancial liabilities amounting to P=1,640.8 million as at June 30, 2016

- 47 -
December 31, 2015
Carrying
Value Fair value
Quoted Prices in Active Markets (Level 1)
Significant Observable
Inputs (Level 2)
Significant Unobservable
Inputs (Level 3)
(In Thousands) Assets Measured at Fair Value Financial assets at FVPL - Derivative assets P=3,964,807 P=3,964,807 P=– P=3,964,807 P=– Assets for which Fair Values are Disclosed Loans and receivables: Time deposits - noncurrent portion 53,127,769 57,332,807 – – 57,332,807 Receivables - net (including noncurrent portion
of receivables from real estate buyers) 40,096,123 39,967,000 – – 39,967,000 Long-term notes (included under “Other
noncurrent assets” account in the consolidated balance sheet) 927,000 940,801 – – 940,801
94,150,892 98,240,608 – – 98,240,608 P=98,115,699 P=102,205,415 P=– P=3,964,807 P=98,240,608
Liabilities for which Fair Values are Disclosed Other Financial Liabilities: Long-term debt (noncurrent portion and net of
unamortized debt issue cost) P=245,167,269 P=265,886,763 P=– P=– P=265,886,763 Tenants’ deposits and others* 20,815,414 19,226,430 – – 19,226,430 265,982,683 285,113,193 – – 285,113,193 P=265,982,683 P=285,113,193 P=– P=– P=285,113,193
*Excluding nonfinancial liabilities amounting to P=1,412.0 million as at December 31, 2015
There were no transfers between Level 1 and Level 2 fair value measurements and no transfers into and out of Level 3 fair value measurements as at June 30, 2016 and December 31, 2015.
Derivative Financial Instruments To address the Group’s exposure to market risk for changes in interest rates arising primarily from its long-term floating rate debt obligations and to manage its foreign exchange risks, the Group enter into various derivative transactions such as cross-currency swaps, interest rate swaps, foreign currency call options, non-deliverable forwards and foreign currency range options. In addition, the Group has embedded derivatives from its long-term notes (recorded under “Noncurrent Assets” account) and convertible bonds.
Derivative Instruments Accounted for as Cash Flow Hedges
Cross-currency Swaps. In 2013, the Parent Company and SM Prime entered into cross-currency swap transactions to hedge both the foreign currency and interest rate exposures on its U.S. dollar-denominated five-year term loans (the hedged loans).
Under the floating-to-fixed cross-currency swap, the hedged U.S. dollar-denominated loans have been converted into Philippine peso:
� Swap the face amount of the loans in US$ for their agreed Philippine peso equivalents with the counterparty banks and exchange, at maturity date, the principal amount originally swapped.
� Pay fixed interest in the Philippine peso notional amount and receive floating interest on the US$ notional amount, on a semi-annual basis, simultaneous with interest payments on the hedged loans.

- 48 -
The outstanding hedged loans follow:
Principal Balance (In US$) (In PhP=)
(In Thousands) Parent - Unsecured loans US$180,000 P=8,470,800
SM Prime: Unsecured loan 200,000 9,412,000 Unsecured loan 150,000 7,059,000 Unsecured loan 180,000 8,449,369 Unsecured advances 50,000 2,347,047 Unsecured advances 50,000 2,347,047 Unsecured advances 100,000 4,694,094
Details of the cross-currency swaps follow:
Notional Amount
(In US$) (In PhP=) Receive Pay US$:P=
Rate Maturity Fair Value (In Thousands) (In Thousands) Parent: Floating-to-Fixed US$50,000 P=2,059,250 6M US LIBOR + 170 bps 4.05% P=41.19 May 15, 2018 P=322,357 Floating-to-Fixed 60,000 2,478,000 6M US LIBOR + 170 bps 4.03% 41.30 May 15, 2018 380,667 Floating-to-Fixed 70,000 2,888,200 6M US LIBOR + 170 bps 3.98% 41.26 May 15, 2018 449,696 SM Prime: Floating-to-Fixed 150,000 6,100,500 6M US LIBOR + 170 bps 3.70% 40.67 January 29, 2018 1,040,664 Floating-to-Fixed 50,000 2,033,500 6M US LIBOR + 170 bps 3.70% 40.67 January 29, 2018 347,276 Floating-to-Fixed 50,000 2,055,000 6M US LIBOR + 170 bps 3.90% 41.10 March 23, 2018 322,866 Floating-to-Fixed 50,000 2,055,000 6M US LIBOR + 170 bps 3.90% 41.10 March 23, 2018 328,911 Floating-to-Fixed 50,000 2,055,000 6M US LIBOR + 170 bps 3.90% 41.10 March 23, 2018 323,455
Principal Only Swaps. In 2016, SM Prime entered into principal only swap transactions to hedge the foreign-currency exposure on its U.S. dollar-denominated five-year term syndicated loans and advances (the hedged loans and advances).
Under the principal only swap, the hedged U.S. dollar-denominated loans and advances have been converted into China Yuan Renminbi:
� Swap the face amount of the loan and advances in US$ for their agreed China Yuan Renminbi equivalents with the counterparty banks and exchange, at maturity date, the principal only amount originally swapped.
� Pay premium interest in the China Yuan Renminbi notional amount, on a semi-annual basis.

- 49 -
The outstanding hedged loans and advances follow:
Notional Amount US$:¥ Rate Maturity
Fair Value (In Thousands) Principal only US$100,000 ¥6.528 March 23, 2018 (P=46,437) Principal only 50,000 6.569 March 23, 2018 (53,530) Principal only 50,000 6.458 January 29, 2021 50,770 Principal only 50,000 6.369 January 29, 2021 39,605 Principal only 50,000 6.480 January 29, 2021 21,048 Principal only 30,000 6.483 January 29, 2021 10,852 Principal only 25,000 6.514 August 31, 2017 (14,072) Principal only 15,000 6.514 August 31, 2017 (8,481) Principal only 10,000 6.514 August 31, 2017 288
As the terms of the swaps have been negotiated to match the terms of the hedged loans and advances, the hedges were assessed to be highly effective.
Other Derivative Instruments Not Designated as Accounting Hedges
� Options Arising from Long-term Notes. The Parent Company entered into a loan agreement with Atlas. The loan contains multiple embedded derivatives such as conversion, call and put options. The conversion option pertains to the right of the Parent Company to convert the loan into common shares of Atlas at the conversion price of P=8.29 per share at any time beginning July 21, 2015 until June 2, 2018. The call option pertains to the right of Atlas to early redeem the loan, in whole but not in part, on or after December 9, 2016 subject to the conditions stated in the loan agreement. On the other hand, the put option pertains to the right of the Parent Company to require Atlas to redeem all or some of the loan at their prepayment amount on the date fixed for prepayment beginning June 9, 2016. As at June 30, 2016, all outstanding embedded derivatives have nil values.
26. EPS Computation
June 30,
2016 June 30,
2015
(In Thousands Except Per Share Data)
Net income attributable to owners of the Parent (a) P=14,986,407 P=13,494,480 Weighted average number of common shares
outstanding for the period (b) 803,055 797,477
Basic EPS (a/b) P=18.66 P=16.92
27. Reclassification
The Group reclassified certain consolidated balance sheet accounts as at December 31, 2015 and consolidated statement of income accounts in 2015 to conform to the 2016 consolidated financial statements presentation and classification. The reclassifications have no impact on the 2015 profit or loss and equity of the Group.

- 50 -
28. Events After the Reporting Period
On July 15, 2016, the SEC approved the increase in authorized capital stock of the Parent Company (see Note 19). On July 20, 2016, the SEC fixed the record date of August 3, 2016, and payment date of August 18, 2016, for the 50% stock dividends that was declared by the BOD on March 2, 2016 and approved by stockholders on April 27, 2016. On July 12, 2016, the SEC approved the merger of SM Retail. Under the terms of the deal, over 1,300 retail outlets will be folded into SM Retail in exchange for shares of stock in SM Retail’s expanded assets. To be merged with SM Retail’s food and department stores are a wide ranging portfolio of leading local brands such as Ace Hardware, Watsons, Toy Kingdom, SM Appliances, Our Home, Baby Company, Kultura, Sports Central, Pet Express and other specialty retailers. The merger is seen to be both value and earnings accretive given the stores’ competitive position, synergies with SM Supermalls and strong growth potential.
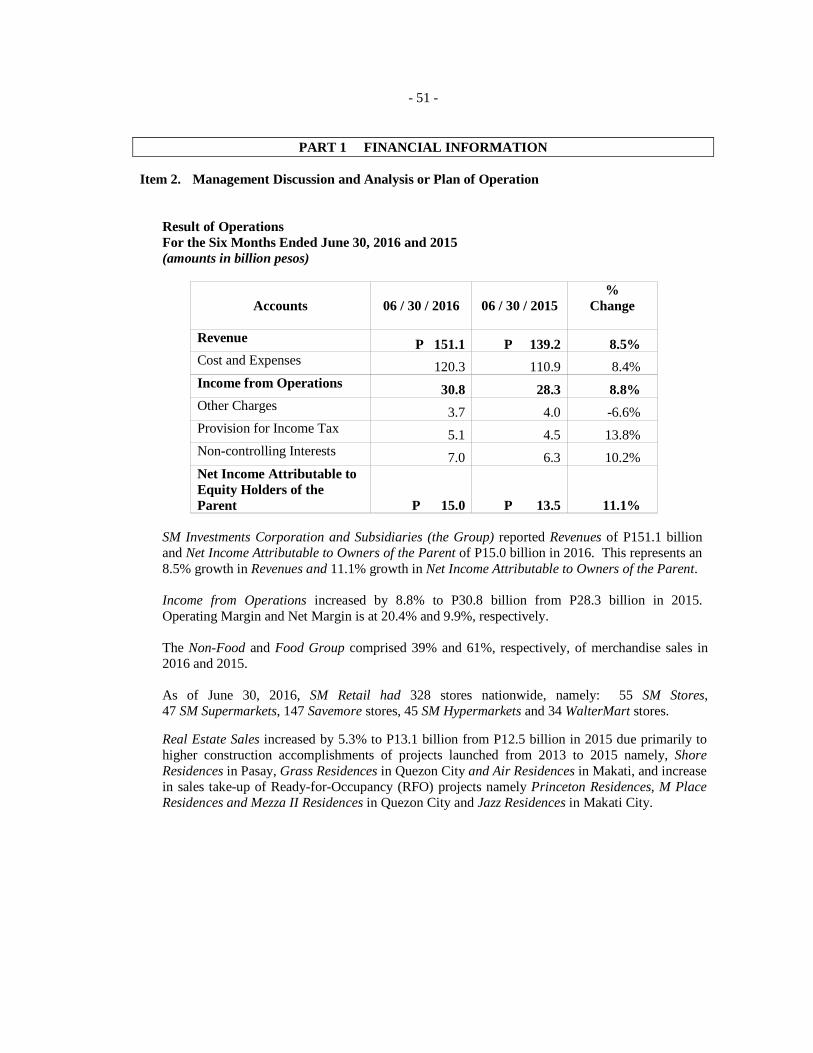
- 51 -
PART 1 FINANCIAL INFORMATION Item 2. Management Discussion and Analysis or Plan of Operation
Result of Operations For the Six Months Ended June 30, 2016 and 2015 (amounts in billion pesos)
Accounts
06 / 30 / 2016
06 / 30 / 2015 %
Change
Revenue P 151.1 P 139.2 8.5% Cost and Expenses 120.3 110.9 8.4% Income from Operations 30.8 28.3 8.8% Other Charges 3.7 4.0 -6.6% Provision for Income Tax 5.1 4.5 13.8% Non-controlling Interests 7.0 6.3 10.2% Net Income Attributable to Equity Holders of the Parent
P 15.0
P 13.5
11.1%
SM Investments Corporation and Subsidiaries (the Group) reported Revenues of P151.1 billion and Net Income Attributable to Owners of the Parent of P15.0 billion in 2016. This represents an 8.5% growth in Revenues and 11.1% growth in Net Income Attributable to Owners of the Parent. Income from Operations increased by 8.8% to P30.8 billion from P28.3 billion in 2015. Operating Margin and Net Margin is at 20.4% and 9.9%, respectively.
The Non-Food and Food Group comprised 39% and 61%, respectively, of merchandise sales in 2016 and 2015. As of June 30, 2016, SM Retail had 328 stores nationwide, namely: 55 SM Stores, 47 SM Supermarkets, 147 Savemore stores, 45 SM Hypermarkets and 34 WalterMart stores.
Real Estate Sales increased by 5.3% to P13.1 billion from P12.5 billion in 2015 due primarily to higher construction accomplishments of projects launched from 2013 to 2015 namely, Shore Residences in Pasay, Grass Residences in Quezon City and Air Residences in Makati, and increase in sales take-up of Ready-for-Occupancy (RFO) projects namely Princeton Residences, M Place Residences and Mezza II Residences in Quezon City and Jazz Residences in Makati City.

- 52 -
Rent Revenue, derived mainly from the mall operations of SM Prime Holdings, Inc. (SM Prime), increased by 10.8% to P19.5 billion from P17.6 billion in 2015. The increase in Rent Revenue is primarily due to the new malls which opened in 2015 and 2016, namely, SM Seaside City Cebu, SM City Cabanatuan, SM City San Mateo, SM San Jose Del Monte and SM Trece Martires as well as the expansion of shopping spaces in SM Center Sangandaan and SM City Iloilo. In addition, retail podiums of Light, Shine, Shell and Green Residences opened in 2015 and 2016. Excluding the new malls and expansions, same-store rental growth is at 7%. Rentals from commercial operations also increased due to the opening of SM Cyber West and Five E-com Center as well as the expansion of SM Aura office tower in 2015. Rentals from hotels and convention centers also contributed to the increase due to improvement in average room and occupancy rates and the opening of Park Inn Clark in December 2015. As of June 30, 2016, SM Prime had 58 malls in the Philippines and 6 malls in China. Equity in Net Earnings of Associate Companies and Joint Ventures increased by 10.8% to P7.4 billion from P6.7 billion in 2015 due mainly to the 12.9% net income growth of BDO. Operating Expenses increased by 9.3% to P32.8 billion from P30.0 billion in 2015 due mainly to additional operating expenses associated with new or renovated retail stores and malls and new real estate projects. Other Charges (net) decreased by 6.6% to P3.8 billion from P4.0 billion in 2015. Other Charges consist mainly of Interest Expense which decreased by 2.1% to P5.5 billion from P5.6 billion in 2015. Provision for Income Tax increased by 13.8% to P5.1 billion from P4.5 billion in 2015 due to higher taxable income. The effective income tax rate is 18.8% in 2016 and 18.4% in 2015. Non-controlling Interests increased by 10.2% to P7.0 billion in 2016 from P6.3 billion in 2015 due to the increase in net income of certain partly-owned subsidiaries.

- 53 -
Financial Position As of June 30, 2016 and December 31, 2015 (amounts in billion pesos)
Accounts 06 / 30 / 2016 12 / 31 / 2015 % Change
Current Assets P 145.4 P 164.3 -11.5%
Noncurrent Assets 624.8 606.8 3.0%
Total Assets P 770.2 P 771.1 -0.1%
Current Liabilities P 81.9 P 115.8 -29.3%
Noncurrent Liabilities 295.5 273.6 8.0%
Total Liabilities 377.4 389.4 -3.1%
Stockholders’ Equity 392.7 381.7 2.9% Total Liabilities and Stockholders’ Equity
P 770.2
P 771.1 -0.1%
Total Assets decreased by 0.1% to P770.2 billion from P771.1 billion in 2015. On the other hand, total Liabilities decreased by 3.1% to P377.4 billion from P389.4 billion in 2015. Current Assets Current Assets decreased by 11.5% to P145.4 billion from P164.3 billion in 2015. Cash and Cash Equivalents decreased by 45.2% to P29.5 billion from P53.9 billion in 2015 due mainly to dividend payments of SMIC and SM Prime at P8.5 billion and P6.6 billion, respectively, as well as payment of trade payables, debt servicing, capital expenditures and additional loan to an associate company. Time Deposits increased by 18.6% to P11.4 billion from P9.6 billion in 2015 due mainly to reclassification of maturing deposits from noncurrent to current. Investments Held for Trading and Sale increased by 13.1% to P1.2 billion from P1.1 billion in 2015 due mainly to reclassification of maturing available-for-sale (AFS) investments from noncurrent to current, partially offset by maturity of certain investment in bonds. Receivables increased by 2.7% to P33.0 billion from P32.1 billion in 2015. The increase pertains mostly to Receivables from real estate buyers.
Merchandise Inventories increased by 10.4% to P18.0 billion from P16.3 billion in 2015. Other Current Assets increased by 1.9% to P52.3 billion from P51.3 billion in 2015.

- 54 -
Noncurrent Assets Noncurrent Assets increased by 3.0% to P624.8 billion from P606.8 billion in 2015. AFS Investments increased by 9.9% to P23.3 billion from P21.2 billion in 2015 due mainly to the increase in market value of certain AFS investments. Investments in Associate Companies and Joint Ventures increased by 3.6% to P176.1 billion from P169.9 billion in 2015. The increase represents the equity in net earnings of associates for the first half of 2016 partially offset by dividends received from these associate companies. Time Deposits decreased by 3.9% to P51.1 billion from P53.1 billion in 2015 due mainly to the reclassification of maturing time deposits to current. Property and Equipment decreased by 0.7% to P19.3 billion from P19.4 billion in 2015. Investment Properties increased by 3.7% to P258.8 billion from P249.6 billion in 2015 due mainly to ongoing new mall projects located in Cagayan de Oro, Puerto Princesa, and Olangapo in the Philippines and Tianjin in China; expansions and renovations of SM Mall of Asia and SM City Baguio; and ongoing projects of the commercial and hotel groups namely Three E-Com Center, Four E-Com Center, and Conrad Manila. Land and Development decreased by 10.9% to P24.4 billion from P27.4 billion in 2015 due mainly to reclassification to current of launched projects. Deferred Tax Assets decreased by 1.0% to P2.5 billion from P2.6 billion in 2015. Other Noncurrent Assets increased by 15.0% to P44.8 billion from P38.9 billion in 2015. The increase mainly represents additional loans to an associate company and higher Receivable from real estate buyers.
Current Liabilities
Current Liabilities decreased by 29.3% to P81.9 billion from P115.8 billion in 2015. Bank Loans decreased by 32.5% to P6.7 billion from P9.9 billion in 2015 due mainly to loan payments. Current Portion of Long-term Debt decreased by 74.3% to P6.7 billion from P26.0 billion in 2015 due mainly to payments of matured debts. Accounts Payable and Other Current Liabilities decreased by 14.5% to P66.3 billion from P77.5 billion in 2015 due to settlement of payables mainly for trade transactions. Dividends Payable increased by 9.3% to P0.4 billion from P0.3 billion in 2015. This mainly represents dividends due to minority stockholders of certain subsidiaries. Income Tax Payable decreased by 7.9% to P1.9 billion from P2.0 billion in 2015.

- 55 -
Noncurrent Liabilities Noncurrent Liabilities increased by 8.0% to P295.5 billion from P273.6 billion in 2015. Long-term Debt - Net of Current Portion increased by 8.5% to P266.1 billion from P245.2 billion in 2015 due mainly to new availments. Tenants’ Deposits and Others increased by 6.3% to P22.3 billion from P20.9 billion in 2015. The increase is attributable to new malls and expansions as well as increase in customers’ deposits from residential buyers. Deferred Tax Liabilities decreased by 3.6% to P7.2 billion from P7.4 billion in 2015 due mainly to higher collections on real estate sales. Equity Total Equity increased by 2.9% to P392.7 billion from P381.7 billion in 2015. The increase pertains mainly to the first half 2016 net income of P15.0 billion partially offset by dividends of P8.5 billion.
The Company has no known direct or contingent financial obligation that is material to the Company operations, including any default or acceleration of an obligation. The Company has no off-balance sheet transactions, arrangements, obligations during the reporting period and as of the balance sheet date. There are no known trends, events, material changes, seasonal aspects or uncertainties that are expected to affect the Company’s continuing operations.

- 56 -
Key Performance Indicators The following are the key financial ratios of the Group for the period ended June 30, 2016 and 2015 and December 31, 2015:
Accounts 06 / 30 / 2016 12 / 31 / 2015
Current Ratio 1.8 1.4
Asset to Equity 2.0 2.0
Debt-equity Ratio:
On Gross Basis 49 : 51 50 : 50
On Net Basis 39 : 61 36 : 64
Return on Equity 10.5% 10.3%
Accounts 06 / 30 / 2016 06 / 30 / 2015
Revenue Growth 8.5% 6.3%
Net Income to Revenues 9.9% 9.7%
Net Income Growth 11.1% 9.6%
EBITDA (in billions of pesos) P36.8B P33.9B
Interest Coverage 6.7x 6.0x
Current ratio increased to 1.8 from 1.4 in 2015 due mainly to the decrease in current assets of 11.5% coupled with a decrease in current liabilities of 29.3%. Debt-equity ratio decreased to 49:51 from 50:50 in 2015 due to the 0.6% decrease in gross debts from P281.1 billion to P279.5 billion in 2016. Revenue growth in 2016 is higher at 8.5% vs. 6.3% in 2015 due to higher Merchandise sales growth of 8.6% vs. 6.1% in 2015, higher Real estate sales growth of 5.3% vs. 2.9% in 2015, and higher growth in Equity in net earnings of 10.8% vs. 2.7% in 2015. Interest coverage increased to 6.7x from 6.0x in 2015 due to 8.6% increase in EBITDA vs. 2.1% decrease in interest expense.

- 57 -
The manner by which the Company calculates the foregoing indicators is as follows: 1. Current Ratio Current Assets Current Liabilities 2. Asset to Equity Ratio Total Assets
Total Stockholders’ Equity
3. Debt – Equity Ratio a. Gross Basis Total Interest Bearing Debt
Total Equity Attributable to Equity Holders of the Parent + Total Interest Bearing Debt
b. Net Basis Total Interest Bearing Debt less cash and cash equivalents (excluding cash on
hand), time deposits, investment in bonds held for trading and available for sale, long-term notes Total Equity Attributable to Equity Holders of the Parent + Total Interest Bearing Debt less cash and cash equivalents (excluding cash hand), time deposits, investments in bonds held for trading and available for sale, long-term notes
4. Revenue Growth Total Revenues (Current Period) - 1 Total Revenues (Prior Period)
5. Net Income to Revenue Net Income Attributable to Equity Holders of the Parent Total Revenues
6. Net Income Growth Net Income Attributable to Equity Holders of the Parent (Current Period) - 1 Net Income Attributable to Equity Holders of the Parent (Prior Period)
7. Return on Equity Net Income Attributable to Equity Holders of the Parent (Annualized) Average Equity Attributable to Equity Holders of the Parent 8. EBITDA Income from Operations + Depreciation & Amortization
9. Interest Coverage EBITDA Interest Expense

- 58 -
Expansion Plans / Prospects for the Future Malls For the rest of 2016, SM Prime will open 2 new malls in the Philippines namely, Cherry SM Congressional in Quezon City and SM City East Ortigas in Pasig City and complete the expansion of SM Center Molino and SM City San Pablo. By yearend, SM Prime will have 60 malls in the Philippines and 6 in China with an estimated combined gross floor area of 8.6 million square meters. Residential For 2016, SMDC will launch about 6,000 to 8,000 units in the cities of Tagaytay, Quezon City, and Pasay City and economic housing in the provinces of Bulacan, Cavite and Cabanatuan. Commercial The construction of Three E-com Center and Four E-com Center is ongoing. These projects are scheduled for completion in 2017 and 2018, respectively. For the rest of 2016, the Retail Group will be opening 2 SM Stores, 7 Savemore stores, and 6 WalterMart stores. The above expenditures will be funded through internally generated sources and other capital raising initiatives such as bond issuances and loan availments.

- 59 -
PART I FINANCIAL INFORMATION
Item 3. Aging of Accounts Receivable – Trade
SM Investments Corporation and Subsidiaries Aging of Accounts Receivable - Trade As of June 30, 2016 (in Thousands) Receivable from tenants Third-party tenants P 5,602,048 Related-party tenants 859,781 Receivable from real estate buyers
- net of non-current portion 25,704,676
Total P 32,166,505
Aging: Neither past due nor impaired P 26,315,353 31-90 days 1,400,827 91-120 days 448,610 Over 120 days 2,982,251 Impaired 1,019,464
Total P 32,166,505

- 60 -
PART II - SIGNATURE
Pursuant to the requirements of the Securities Regulation Code, the issuer has duly caused this report
to be signed on its behalf by the undersigned thereunto duly authorized.
Registrant: SM INVESTMENTS CORPORATION
__________________________ Date: ____________ Franklin C. Gomez Senior Vice President – Finance Alternate Corporate Information Officer
08-09-16