siam future development public co., ltd ...setlive.thailivestream.com/data-file/events/pdf/...format...
TRANSCRIPT

SIAM FUTURE DEVELOPMENT PUBLIC CO., LTD.
Corporate Presentation 2017
Overview
Financial Summary
Project Update
2
Presentation Agenda

Founded: 1994
Staff: 75
Centers: 22
Vision “Unlike other developers,
we create a place for people first then for business. “
3
Overview

1994 Established “Siam Future Development”
1995 Opened first open-air shopping center “Bangbon”
1996 Opened “Prachautid” and “Sukaphiban 3”
1998 Opened “Sukhumvit 71”
2000 Opened 2 Convenient centers
and 8 B-quik centers
2002 Listed in MAI and opened “Thonglor”
2003 Listed in SET PP to Major Cineplex Group and opened “Thungmahamek”
2004 Opened “Changwattana”,
“Ladprao120”, ”Chachoengsao”, “Piyarom Place” and “J Avenue”
2005 Opened “Wanghin 2”, “Petchkasem” and “Ekkamai”
2006 Completed Changwattana”, “La-villa” and “Esplanade”
2007 Opened “Pattaya” and “Kao-yai”
2008 Opened “Nawamin” and “Ratchayothin”
2009 Opened “Nawamin City Avenue”
2011 - Open 1st IKEA Store in Thailand - Open “Nawamin Festival Walk”
2012 Open Megabangna
4
Development Timeline
2017 - Open “Plot H at Megabangna” - Open “Marketplace Nanglinchee Phase 1”

Format
2015 2016 2017 Average size
(sq.m.) No. of centers
GLA (sq.m.)
No. of centers
GLA (sq.m.)
No. of centers
GLA (sq.m.)
Lifestyle Center 6 77,709 6 77,709 6 77,709 10,000
Power Center 3 67,217 3 67,217 3 67,217 22,500
Entertainment Center
1 43,241 1 43,241 1 43,241 43,000
Neighborhood Center
7 38,389 7 38,389 7 42,000 5,500
Convenience Center
2 1,178 2 1,178 2 1,178 600
Automotive Service center
2 829 2 829 2 997 400
Super Regional 1 180,000 1 180,000 1 191,216 191,216
Total 22 408,563 22 408,563 22 423,558 19,253
Occupancy Rate 98% 93% 88%
5
Leasable Area and Occupancy
Note: GLA = Gross Leasable Area

Shareholding Structure
23%
51%
26%
10%
3%
7%
4%
16%
30%
4%
Major Cineplex Group PLC.
Management
Freefloat
Witoonchart group
Pojkasemsin Group
Suttapong Group
Jantaraprapa Group
Foreigners
Retails
Number of shares: 1,776.61 Million
Source: Shareholder list as of 31 Dec 17 6
Local Institutions

Overview
Financial Summary
Project Update
7
Presentation Agenda
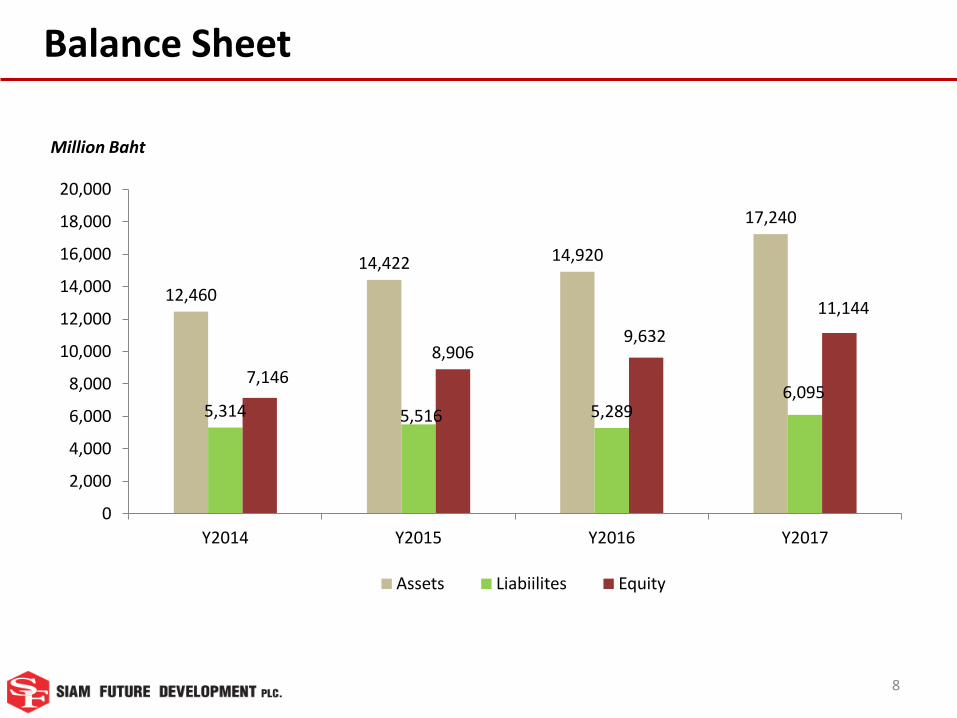
12,460
14,422 14,920
17,240
5,314 5,516 5,289 6,095
7,146
8,906 9,632
11,144
0
2,000
4,000
6,000
8,000
10,000
12,000
14,000
16,000
18,000
20,000
Y2014 Y2015 Y2016 Y2017
Million Baht
Assets Liabiilites Equity
8
Balance Sheet

(Million Baht)
Remarks: * Fair value adjustment on Investment Property= Depreciation & Amortization + Gain (Loss) from revaluation 9
Income Statement (Management Account) 2014 2015 2016 2017
1 Recurring Revenue 1,394 1,429 1,431 1,414
2 Cost of rental & service (955) (909) (911) (932)
3 Gross profit 439 520 520 482
4 SG&A (229) (233) (238) (242)
5 EBIT 210 287 282 239
6 Interest expenses (95) (96) (75) (71)
7 Income tax (32) (38) (46) (22)
8 Minority (18) (21) (18) (17)
9 Recurring profit (excl. Megabangna) 65 131 143 130
10 Profit from joint venture 191 201 281 370
11 Total recurring profit 256 332 424 499
%growth (YOY) 48% 30% 28% 18%
Total recurring profit per share (Baht/share) 0.18 0.20 0.24 0.28
12 Add: Profit from Fin Lease (after tax) 2 - - -
13 Fair value adjustment on IP*– SF (after tax) 161 679 246 253
14 Fair value adjustment on IP– Megabangna (49%) 284 397 294 1,088
15 Net profit 700 1,408 964 1,841
Earnings per share (EPS) (Baht/share) 0.49 0.85 0.54 1.04
Average Occupancy Rate (%) 93% 93% 93% 88%
Average number of shares (million shares) 1,431 1,665 1,777 1,777
Dividend per share (Baht/share) Stock dividend 5:1 0.15 0.20 0.25
Dividend Yield (%) n.a. 2.40% 3.25% 3.21%

Profit Structure Megabangna’s Recurring Profit
As of 30 Sep 2017
10
Others, 6%
Petchkasem, 2%
La Villa, 4%
J Avenue, 4%
Esplanade, 8%
89
240
393
474
634
818
-
100
200
300
400
500
600
700
800
900
2012 (8m) 2013 2014 2015 2016 2017
Million Baht
Megabangna, 72%

Rental Structure
17%
83%
by Revenue
27%
73%
by GLA
As of 31 Dec 2017
Revenue Sharing
11
Fixed Rent 73%
Fixed Rent Fixed Rent
Revenue Sharing

Costs Breakdown
20%
26%
Utilities 22%
32%
Depreciation & Amortization
Operating
Land Rent
17%
58%
6%
19%
Depreciation
SG&A Breakdown
As of 30 Sep 2017
Personnel
Marketing Admin
12

As of Dec-16
Total Debt = 1,550 million Baht
Average interest rate = 4.43%
As of Dec-17
13
Total Debt = 2,221 million Baht
Average interest rate = 3.76%
0.27
0.22
0.16 0.20
-
0.1
0.2
0.3
Y2014 Y2015 Y2016 Y2017
D:E Ratio
Debt Structure

INDEX 2014 2015 2016 2017
SET Index 1,498 1,288 1,543 1,754
SF (stock price) 6.25 6.25 6.15 7.80
Market Cap (MB) 9,256 11,104 10,926 13,858
Dividend Summary
Par Value (Baht) 1.00 1.00 1.00 1.00
Dividend Paid (MB) Stock Dividend 5:1
266 355.3 444.2
Dividend/share (Baht) 0.22223 0.15 0.20 0.25
Dividend Payout Ratio N.A. 80% 84% 89%
Statistics as of 29 Dec 17 *
Stock Price 7.80 Par Value (Baht) 1.00
Share Capital (M shares) 1,776.61 P/E (times) 13.62
Market Cap (MB) 13,858 P/BV (times) 1.49
14
Stock Information and Dividend
* Source: www.set.or.th

Overview
Financial Summary
Project Update
15
Presentation Agenda

16
* Subject to change upon future situation
Expansion Plan*
219,641 237,308 235,229 224,120 231,795 229,600 229,600 228,906 228,563 228,563 225,686 213,276
180,000 180,000 180,000 180,000 180,000 180,000180,000
6,500
6,500
11,000
11,000
4,500
6,540 18,360
95% 98% 95% 98% 97% 97% 94% 93%98%
93%88%
0
50,000
100,000
150,000
200,000
250,000
300,000
350,000
400,000
450,000
500,000
2007 2008 2009 2010 2011 2012 2013 2014 2015 2016 2017 2018F
GLA (sq.m.)
Existing MegabangnaNanglinchee-Ph.1 Megabangna Retail expansion (Plot H)Nanglinchee-Ph.2 DusitMegabangna Retail expansion (Plot A) Occupancy Rate

17 * Subject to change upon future situation
Project Objective Existing GLA (sq.m.)
Future GLA (sq.m.)
CAPEX (mil baht)
Target Opening Date
SF
• Nanglinchee (expansion)
Lifestyle Center 2,900 11,000 660 Phase 1: Nov-17 Phase 2: Sep-18
• Dusit Lifestyle Center - 6,540 295 Dec-18
• Thonglor 4 (redevelopment)
Lifestyle Center 3,600 15,500 850 Y2020
Total 6,500 33,040 1,855
Megabangna & Megacity
• Plot H Retail extension + Parking
-
11,000 1,080 Dec-17
• New Ring Road Car and Pedestrian link
-
n.a. 115 Dec-17
• Plot A (land lease only)
Outdoor entertainment
+ Leisure for family
-
18,000 150 May-18
• Plot D Edutainment - 8,500 350 Mar-19
Total - 37,500 1,695
Expansion Plan*

18
Marketplace Nanglinchee (Expansion)
Shopping centre format Lifestyle center
GLA 11,000 sq.m.
Anchor Tops Market
Target Opening Phase 1: Nov-17 Phase 2: Sep-18

19
Market Place Dusit
Shopping centre format Lifestyle center
GLA 6,540 sq.m.
Anchor Tops Market
Target Opening Dec-18

20
Marketplace Thonglor4 (Redevelopment)
Shopping centre format Lifestyle center
GLA 15,500 sq.m.
Anchor Tops Market
Target Opening Y2020

22
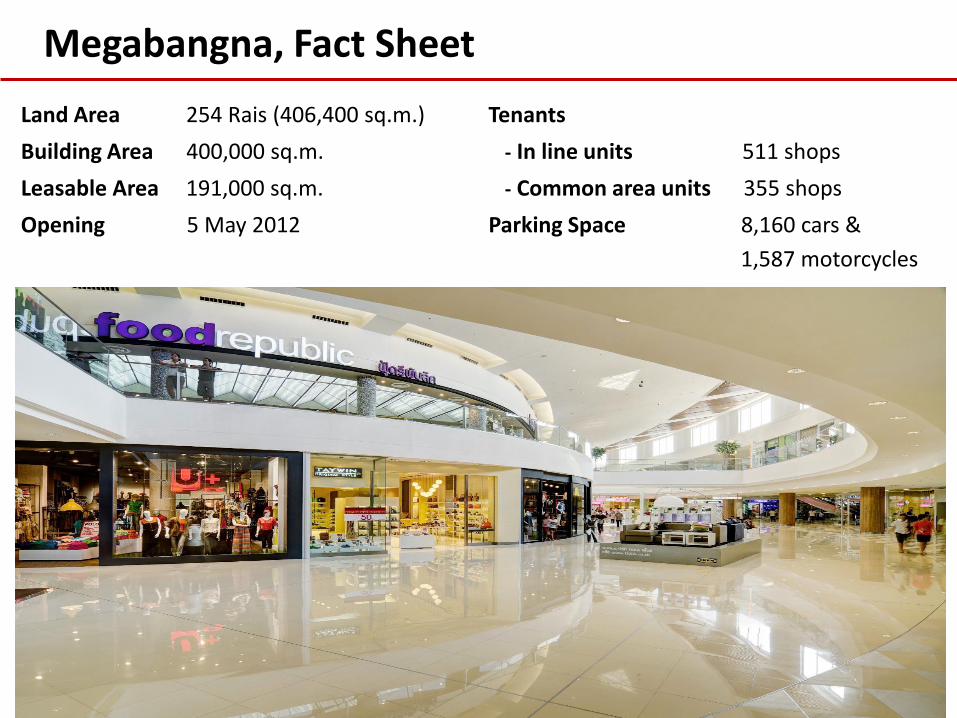
Land Area 254 Rais (406,400 sq.m.)
Building Area 400,000 sq.m.
Leasable Area 191,000 sq.m.
Opening 5 May 2012
Tenants
- In line units 511 shops
- Common area units 355 shops
Parking Space 8,160 cars &
1,587 motorcycles
Megabangna, Fact Sheet

Anchors: 102,000 sq.m.
23
34% 14%
52%
Megabangna, Tenants Mix
Mini-anchors: 24,000 sq.m. Tenants: 58,000 sq.m.

Megabangna Transformation to Megacity
24

25
Megabangna&Mega City: Land Plot Summary

26
Project Location Plot H
Land Area 6.5 Rai
Leasable Area 11,000 sq.m.
Parking Space 1,100 cars
Opening Dec-17
Retail Expansion and Parking Deck

Plot H: Tenants

28
Opening: Dec-17
New Ring Road - Car and Pedestrian link

29
Project Location Plot A
Leasable Area 18,000 sq.m.
Opening May-18
Retail Expansion – Outdoor Entertainment & Leisure

30
Project Location Plot D
Leasable Area 8,500 sq.m.
Opening Mar-19
Retail Expansion – Edutainment
31
For Further Information
Contact: Investor Relations Team Tel (662) 660-9464 Tel (662) 660-9465 Tel (662) 660-9474 Fax (662) 660-9020 E-mail [email protected] [email protected] [email protected] Website www.siamfuture.com