should we tax unhealthy foods and drinks? - tax policy … · tax policy center | urban institute...
TRANSCRIPT

TAX POLICY CENTER | URBAN INSTITUTE & BROOKINGS INSTITUTION
SHOULD WE TAX UNHEALTHY FOODS AND DRINKS? Donald Marron, Maeve Gearing, and John Iselin
December 2015
Donald Marron is director of economic policy initiatives and Institute fellow at the Urban Institute, Maeve Gearing is a research associate at the Urban Institute, and John Iselin is a research assistant at the Urban-Brookings Tax Policy Center. The authors thank Laudan Aron, Kyle Caswell, Philip Cook, Stan Dorn, Lisa Dubay, William Gale, Genevieve Kenney, Adele Morris, Eric Toder, and Elaine Waxman for helpful comments and conversations; Joseph Rosenberg for running the Tax Policy Center model; Cindy Zheng for research assistance; Elizabeth Forney for editing; and Joanna Teitelbaum for formatting. This report was funded by the Laura and John Arnold Foundation. We thank our funders, who make it possible for Urban to advance its mission. The views expressed are those of the authors and should not be attributed to our funders, the Urban-Brookings Tax Policy Center, the Urban Institute, or its trustees. Funders do not determine our research findings or the insights and recommendations of our experts. For more information on our funding principles, go to urban.org/support.
TAX POLICY CENTER | URBAN INSTITUTE & BROOKINGS INSTITUTION 1
EXECUTIVE SUMMARY
A healthy diet is essential to a long and vibrant life. But there is increasing evidence that our diets
are not as healthy as we would like. Obesity, diabetes, hypertension, and other conditions linked
to what we eat and drink are major challenges globally. By some estimates, obesity alone may be
responsible for almost 3 million deaths each year and some $2 trillion in medical costs and lost
productivity (Dobbs et al. 2014). In response, many nations, states, and cities are considering
how policies could improve what we eat and drink.
This report takes a detailed look at one such policy: taxing unhealthy foods and drinks.
Denmark, Finland, France, Hungary, Mexico, the Navajo Nation, and the city of Berkeley,
California, have enacted such taxes, primarily on sugar-sweetened beverages and energy-dense
processed foods (what we commonly call “junk food”). We evaluate the rationale behind such
taxes, review the evidence on their effects, analyze different ways of structuring them, draw
lessons from experience with taxes on tobacco, alcohol, and the carbon dioxide emissions that
cause climate change, and offer a framework for assessing the benefits and costs of nutrition-
focused taxation.
It is not possible to offer a blanket assessment of whether taxing unhealthy foods and
drinks makes sense. Nutrition policy is complex, involving the interplay of social, cultural,
economic, and biological factors, uncertainty about the links between nutrition and health, and
tradeoffs among numerous policy levers. Tax policy considerations add more complications.
Taxes can influence what people eat and drink, but they also have important limits and costs.
Whether taxes are a promising option depends on the specifics of the social and economic
environments, the nutritional harms being targeted, the way taxes are designed, and the range of
other policy options available. It also depends on one’s views about the appropriate role of
government.
This report examines a wide range of factors that determine the benefits and costs of
using taxes to improve nutrition. That assessment yields ten findings:
1. Excess sugar consumption stands out as a health risk warranting policy attention. Health
concerns have been raised about, and taxes proposed for, other nutrients and ingredients,
including fat, saturated fat, salt, and artificial sweeteners. But recent research and policy
discussions reveal important disagreements about their health effects. Sugar, in contrast,
is consistently identified as contributing to rising obesity, diabetes, and other metabolic
health risks. Sugar in drinks may be a particular concern.
2. Taxes can change what we eat and drink. Businesses typically pass a substantial fraction
of taxes into retail prices. In response, people eat and drink less of targeted products, less
of complementary products, and more of substitutes. The size of these responses varies.
TAX POLICY CENTER | URBAN INSTITUTE & BROOKINGS INSTITUTION 2
Consumers appear to find it easier to switch away from sugary drinks, which have many
alternatives, than from other foods and drinks.
3. The health effects of nutrition-focused taxes depend on all the ways consumption
changes. It is not sufficient to focus on reduced consumption of targeted products. The
sugar reduction from taxing sweetened drinks, for example, could be partly offset if
consumers switch to juice and beer or eat more bread or cookies. The sugar reduction
could be amplified if people cut back on potato chips and similar snacks that go well with
sugary drinks. Some studies track these effects, typically finding small to moderate
offsets, but more research is needed to document how taxes change entire diets, how
diets change over prolonged periods, and how responses vary across different groups of
people.
4. In principle, taxes can encourage businesses to develop and market healthier products; in
practice, most existing and proposed taxes fail to do so. Taxing sugary drinks based on
their volume, for example, does nothing to encourage businesses to reduce the sugar
content of their products (unless they can eliminate it). Taxing sugar content would be
more effective. It would encourage businesses to reduce the sugar in existing drinks and
to introduce new, lower-sugar alternatives, and it would encourage consumers to switch
to less-sugary drinks.
5. Taxes are an imprecise way to address many nutritional concerns. Taxes work best when
there is a tight relationship between the “dose” that gets taxed and the “response” of
concern. Taxes on cigarettes and carbon dioxide are well-targeted given tight links to lung
cancer and climate change, respectively. Dose-response relationships for nutrition,
however, are typically less tight. Obesity, for example, depends not just on the amount of
sugar one consumes, but also on metabolic factors that differ across people. The health
effects and medical costs of obesity, moreover, are not uniform; severe obesity is much
more harmful than mild obesity. Taxes on unhealthy foods and drinks apply uniformly and
thus cannot reflect such differences across individual circumstances.
6. By changing what we eat, taxes can improve health. Simulations suggest, for example, that
moderate taxes on sugar-sweetened beverages could reduce obesity rates 1–4
percentage points in the United States. Obesity rates are currently more than 35 percent,
so such reductions would be beneficial but modest relative to the challenge. Larger and
broader taxes would likely have larger effects.
7. Taxes create losers, not just winners. Discussions of nutrition-focused taxes often
emphasize lower health risks and reduced health care costs. Those potential upsides are
important, but they are not the whole story. Taxes also increase families’ grocery bills.
Such taxes are regressive, placing a greater relative burden on lower-income consumers
than on higher-income ones. For example, a US tax on sugar-sweetened beverages would
TAX POLICY CENTER | URBAN INSTITUTE & BROOKINGS INSTITUTION 3
impose more than four times as much burden, relative to income, on households in the
bottom fifth of the income distribution as on those in the top fifth. In addition, people who
consume targeted products without harm will pay a new tax or shift to less enjoyable or
more expensive food and drink options without getting any health benefit.
8. If policymakers decide to use taxes to improve nutrition, the sugar content of drinks
would likely be the best place to start. As noted above, sugar in drinks raises particular
health concerns, consumers respond to drink prices, and taxing content is more effective
than taxing volume or sales. Policy discussions usually focus on drinks containing added
sugar, but natural sugars in juices and other beverages also pose health risks.
9. Policymakers should give careful thought to how they use revenues from taxing unhealthy
foods and drinks. A penny-per-ounce tax on sugar-sweetened beverages would generate
almost $10 billion annually in the United States. Policymakers could use that money (or
the smaller amounts that would result from state or local taxes) for many purposes.
Advocates often suggest that revenue be used to fund subsidies to fruits and vegetables,
healthy eating information campaigns, obesity prevention, and similar efforts. Such
earmarking may further advance public health goals, but it is not the only approach.
Policymakers should also consider other uses, including assistance to lower-income
families, cutting back other taxes, or providing general government revenues.
10. Several aspects of nutrition-focused taxes remain under-studied. These include how taxes
change overall diets including food in restaurants, schools, and other locations outside the
home, how businesses change their product offerings in response to different tax designs,
and how policymakers should determine the magnitude of potential taxes.
Improving nutrition is essential to better public health. Well-designed taxes can likely
help. But taxes are a limited tool for such a complex challenge. Even the best-designed taxes on
unhealthy foods and drinks are not a silver bullet, and poorly designed taxes can impose burdens
without yielding commensurate health benefits.
Policymakers should also recognize that they must make decisions about taxes and other
policies when our knowledge of nutrition and the effects of nutrition policies is imperfect. That
uncertainty implies that we should carefully evaluate the actual effects of policy interventions,
absorb new insights from nutrition science, and update policies as we learn more about the best
ways to reduce obesity, diabetes, and other nutrition-related conditions.
TAX POLICY CENTER | URBAN INSTITUTE & BROOKINGS INSTITUTION 4
SUGAR RAISES PARTICULAR NUTRITION AND HEALTH CONCERNS
Not all foods are good for us. Moreover, we should not consume too much of any particular
nutrient, with historically heightened concerns about fat (both saturated and unsaturated), salt,
and sugar. Older research suggested that consumption of fat was associated with obesity and
heart disease, consumption of salt with hypertension and cardiovascular disease, and sugar with
diabetes and obesity. More recently, scientific support for the ills of fat and salt has decreased; it
seems that some of the associations found earlier were only weakly causal and that some
dangers of salt and fat were overstated (Pawlak, Ebbeling, and Ludwig 2002; O’Donnell et al.
2012). Support for the ills of sugar, however, has only grown.
Sugar is one type of carbohydrate, nutrients that provide essential fuel for our bodies. But
different carbohydrates are processed by the body in different ways. Complex carbohydrates,
such as whole grains, vegetables, and fruits, are burned more evenly in energy creation; they
provide energy over longer periods of time without a large spike in blood sugar. Simple
carbohydrates, like sugar and white flour, are burned quickly, providing a spike of both energy
and blood sugar (US Dietary Guidelines Advisory Committee 2015). Why does this matter?
Because there is evidence that repeated spikes in blood sugar, and elevated levels of blood sugar
over time, can contribute to diabetes and obesity. These, in turn, harm health and well-being.
OBESITY AND ASSOCIATED HARMS
Obesity is a global health concern, with 13 percent of adults suffering from obesity in 2014
(World Health Organization 2015). In some nations, including the United States and Mexico,
obesity rates are much higher. More than 1 in 3 American adults suffers from obesity, and about
1in 16 suffers from severe obesity (figure 1); 1 in 6 youth younger than 20 suffers from obesity as
well (Ogden et al. 2014). These rates have risen dramatically in recent decades, with obesity
rates in the United States almost tripling since the early 1960s.
Obesity, and in particular severe obesity, is associated with a host of personal and social
harms (Pawlak, Ebbeling, and Ludwig 2002). Indeed, the McKinsey Global Institute recently
ranked obesity as the third-most severe global social challenge after smoking and armed violence
(Dobbs et al. 2014). Major concerns include the following:
Adults with obesity are more likely to suffer from diabetes, hypertension, inflammation,
asthma, sleep apnea, and cardiovascular disease (Pi-Sunyer 1999). They have shorter
lifespans and report lower quality of life, on average, than people of healthier weight (Jia
and Lubetkin 2005; Peeters et al. 2003).

TAX POLICY CENTER | URBAN INSTITUTE & BROOKINGS INSTITUTION 5
Children with severe obesity are more likely to suffer from type 2 diabetes, hypertension
and prehypertension, asthma, and other conditions, and they are more likely to suffer
from obesity or severe obesity as adults (Must and Strauss 1999).
Adults with obesity are more likely to be absent from work, to earn lower wages, and to
pursue lower-income occupations (Finkelstein, Ruhm, and Kosa 2005).
Adults with obesity have higher rates of depression, anxiety, and low self-esteem, in part
because of the stigma against obesity in the United States and elsewhere (Averett and
Korenman 1999).
Health care costs associated with obesity are substantial. In the United States, medical
costs as a result of obesity may exceed $300 billion annually (Cawley 2015). Those costs
are particularly large for people with severe obesity (Finkelstein, Fiebelkorn, and Wang
2003; Finkelstein et al. 2009).
Several conditions have become more prevalent in parallel with obesity’s rise. Almost 10
percent of Americans have diabetes, up from 6.5 percent in 1999 (Cheung et al. 2009), and over
20 percent have prediabetes. Given current trends, the Centers for Disease Control estimates
one in three people will develop type 2 diabetes in their lifetime (CDC 2014). Rates of
0%
5%
10%
15%
20%
25%
30%
35%
40%
1961 1966 1971 1976 1981 1986 1991 1996 2001 2006 2011
FIGURE 1
Obesity and Severe Obesity Have Increased Significantly Age-adjusted prevalence of obesity among adults aged 20–74
Fryar, Cheryl D., Margaret D. Carroll, and Cynthia L. Ogden. 2014 "Prevalence of Overweight, Obesity, and
Extreme Obesity Among Adults: United States, 1960–1962 Through 2011–2012 " NCHS Health E-Stat
All obesity
Severe obesity

TAX POLICY CENTER | URBAN INSTITUTE & BROOKINGS INSTITUTION 6
hypertension have begun to increase after a period of decrease (Hajjar, Kotchen, and Kotchen
2006). It is unclear how much the rise in obesity is responsible for the rise in diabetes,
hypertension, and other conditions. Associational studies find a strong positive relationship, but
the usual cautions about associational studies apply. Nevertheless, there is reason to believe that
a significant proportion of the rise in some conditions, particularly diabetes, is caused by the rise
in obesity (Shai et al. 2006).
OBESITY AND ITS CAUSES
To understand the association between obesity and other negative health conditions, it is
important to understand obesity itself. Obesity is typically defined according to body mass index,
or BMI. BMI is a measure of weight to height, adjusted by gender and, in children, by age.1 It was
originally designed as a population-level measure to classify relative weight compared with an
ideal weight for height (Beumont, Al-Alami, and Touyz 1988), but it has since become the
dominant individual measure of relative weight because of its ease of measurement and
comprehensibility for lay audiences (LeBlanc et al. 2011). Researchers have recently raised some
questions about BMI’s accuracy as a measure of weight-related health,2 but there is wide
consensus that it is a strong measure for identifying unhealthy weight as its upper reaches, such
as for people who have severe obesity (Sebo et al. 2008).
This ratio of height to weight is determined by complex interactions among the amount
and type of nutrients that people eat, the way their bodies metabolize those nutrients, and the
physical activity they get. Popular accounts often simplify these relationships to the notion that
obesity involves too many calories in and too few calories out. That is true in the narrow
thermodynamic sense of energy balance, but it does not address causality.
How calories consumed translate into individual BMI may depend, for example, on a
person’s genetics, epigenetics, microbiome, and health conditions (Drong, Lindgren, and
McCarthy 2012; Herrera, Keildson, and Lindgren 2011; Walley, Asher, and Froguel 2009).3
Moreover, a growing body of research suggests that not all calories are the same. Consuming
simple carbohydrates, such as sugar and refined flour, may spark hormonal responses that lead
to greater weight gain compared with consuming the same number of calories from fat or other
nutrients (Taubes 2013).
1
The formula for BMI is weight in kilograms divided by the square of height in meters. A 5’10” man weighing 150 pounds would have a BMI of 21.5, deemed healthy (BMIs are considered healthy if they are between 18.5 and 25). At 180 pounds, he would have a BMI of 25.8 and be deemed overweight. At 210 pounds he would have a BMI of 30 and be deemed to have obesity. And at 290 pounds, he would have a BMI of 41 and be deemed to have severe obesity. 2
One concern is that people have different “builds.” BMI may therefore inaccurately classify some people as obese who have a high muscle mass or identify others as at a healthy weight who have a high body fat percentage (Rothman 2008). Another concern is that the location and type of body fat matter in addition to its total amount.
3 “Defining a Healthy Diet for Everyone on the Planet,” Conscien Health, last modified November 22, 2015, http://conscienhealth.org/2015/11/defining-a-healthy-diet-for-everyone-on-the-planet/.
TAX POLICY CENTER | URBAN INSTITUTE & BROOKINGS INSTITUTION 7
SUGAR
The evidence is strongest for an association between sugar and obesity and diabetes. Research
suggests that obesity can both aggravate existing diabetes as well as lead to diabetes among
those who previously had normal blood sugar levels. Type 2 diabetes occurs when the body
cannot metabolize sugar efficiently. The body is either insulin insensitive, resulting in poor
regulation of sugar in the body, or produces insufficient insulin for sugar regulation.4 Fat
deposits, and hormones contained within them, help control how insulin is produced and
perceived within the body. Greater fat deposits typically lessen insulin sensitivity. In the long
term, diabetes can result in heart disease, nerve damage, kidney damage, blindness, sores in the
feet that may necessitate amputation, hearing impairment, skin conditions, and, potentially,
Alzheimer’s disease.5 People with diabetes must reduce their sugar intake and closely monitor
their blood glucose levels to control their disease and avoid these complications. Though
genetics and epigenetics also affect the relationship between obesity and diabetes, it does seem
clear that reducing rates of obesity and reducing sugar consumption could reduce rates of type 2
diabetes in adults and children and thus improve overall health and well-being.
Reducing liquid sugar may be particularly effective at reducing obesity. Studies have
found that individuals consuming liquid calories, through soda and other sugar-sweetened
beverages, exhibit less satiety than those consuming solid-state calories, leading to greater
caloric consumption (Pan and Hu 2011).
There could also be other positive spillover effects of reducing consumption of sugar-
sweetened beverages. Research has found a positive association between full calorie soda
consumption and metabolic syndrome (a cluster of conditions including obesity that increases
the risk of diabetes, heart disease, and stroke) and heart disease, at least in some populations
(Fung et al. 2009; Malik et al. 2010; Vartanian, Schwartz, and Brownell 2007). The same effects
were not found when studying diet beverages with artificial sweeteners, suggesting that it could
be the specific effect of sugar (Bellisle and Drewnowski 2007; Raben et al. 2002).
In sum, obesity has risen dramatically in the last several decades. Obesity is associated
with many negative health conditions, although the strength of these associations varies. There
appears to be a strong association between obesity and diabetes, and the rates of diabetes have
also risen dramatically in the last few decades. Consumption of sugar appears to contribute to
both obesity and diabetes, and drinks containing sugar may be particularly problematic.
4 Mayo Clinic Staff, “Type 2 Diabetes,” Mayo Clinic, last modified July 24, 2014, accessed November 24, 2015, http://www.mayoclinic.org/diseases-conditions/type-2-diabetes/basics/definition/con-20031902.
5 Ibid.
TAX POLICY CENTER | URBAN INSTITUTE & BROOKINGS INSTITUTION 8
GOVERNMENTS HAVE STARTED TAXING UNHEALTHY FOODS AND DRINKS
A growing number of governments, organizations, and advocates have proposed taxes on
unhealthy foods and drinks to improve nutrition and combat obesity. The US Dietary Guidelines
Advisory Committee (2015, 9) recently recommended taxes to “encourage the production and
consumption of healthy foods and to reduce unhealthy food.” Several US states and cities are
considering taxes on sugar-sweetened beverages. In the United Kingdom, the British Medical
Association (2015) and Public Health England (2015) have called for taxes on high-sugar
products.
Several governments have already adopted—and in some cases repealed—taxes on some
types of sugar, fats, soda, and other products they consider unhealthy. Twenty US states levy
higher sales taxes on soda than on food products generally (Chriqui, Eidson, and Chaloupka
2014). Denmark, Finland, France, Hungary, Mexico, Norway, the Navajo Nation, and the city of
Berkeley, California, among other places, have targeted taxes at specific products in an effort to
improve nutrition.
The taxes in Hungary, Denmark, Mexico, and Berkeley illustrate a range of approaches
that governments have pursued.
In 2011, Hungary enacted an array of taxes on pre-packaged products containing
ingredients believed to be health risks, including sugar, salt, and caffeine, as well as energy
drinks containing methylxanthines and taurine (European Competitiveness and
Sustainable Industrial Policy Consortium 2014). The taxes apply if products contain these
ingredients above specified thresholds. Sugar-sweetened beverages are taxed at 7 forint
(about $0.02) per liter if they contain more than 8 grams of sugar per 100 milliliters, for
example, and salty snacks are taxed at 250 forint ($0.85) per kilogram if they contain
more than 1 gram of salt per 100 grams.6 Initial, limited evidence suggests that the tax
increased consumer prices of targeted products, reduced their consumption, and inspired
some producers to reformulate products to get ingredient levels below the tax thresholds
(European Competitiveness and Sustainable Industrial Policy Consortium 2014).
In 2011, Denmark imposed a tax of 16 kroner (about $2.90) per kilogram of saturated fats
on producers and importers of foods made with saturated fat (Bødker et al. 2015). The tax
applied to butter, margarine, potato chips, and similar products, but it exempted regular
milk, certain yogurts, and other products containing less than 2.3 percent saturated fat.
Meats had standardized rates (beef and chicken had separate rates, for example)
independent of their actual fat content. Processed foods were taxed based on the
saturated fat used in their production rather than fat in the final product. Danish shoppers
6
All currency conversions in this report are based on exchange rates in December 2015.
TAX POLICY CENTER | URBAN INSTITUTE & BROOKINGS INSTITUTION 9
reduced domestic purchases of butter, margarine, and other taxed products about 10 to
15 percent (Jensen and Smed 2013), but the tax provoked intense complaints about its
design and economic impact, including concerns that Danish citizens were avoiding it by
shopping in Germany and Sweden (Snowdon 2013). In late 2012, Denmark repealed the
tax.
In 2014, Mexico enacted taxes on producers and importers of sugar-sweetened
beverages and of “junk food”, i.e., calorie-dense processed food. The tax on sweetened
beverages is one peso per liter, equivalent to roughly 0.2 cents per ounce, or 9 percent of
average prices (Grogger 2015). The tax on processed food is an 8 percent levy on sales of
foods with greater than 275 calories per 100 grams. Initial reports suggest the beverage
tax has been more than passed through to consumers, with retail prices increasing about
12 percent (Grogger 2015), and soda purchases declining about 10 percent.7
In 2015, Berkeley, California, imposed a tax of 1 cent per ounce on drinks with added
sugar, with revenue going to the city’s general fund. The tax falls on sodas, juice drinks,
energy drinks, iced teas, and similar beverages that contain added sugar, and excludes
sweeteners themselves (e.g., honey bought in a grocery store), diet drinks, natural fruit or
vegetable juice, milk, alcohol beverages, and medically necessary products. Initial
evidence suggests that the tax has only been partly passed through into retail beverage
prices, limiting its effect on consumer budgets and purchases (Cawley and Frisvold 2015;
Falbe et al. 2015).
Tax strategies thus vary in scope and design. Berkeley focuses on added sugar in
beverages, for example, while Hungary targets multiple ingredients across many product
categories. Berkeley and Mexico apply their drink taxes to any beverages with added sugar, but
Mexico’s junk food tax and Hungary’s taxes include thresholds below which products are not
taxed. As we discuss later, such design differences can have important implications for the
incentives taxes create and the effects they have
7 “Stopping slurping: Taxes on fizzy drinks seem to work as intended,” The Economist, November 28, 2015, http://www.economist.com/news/finance-and-economics/21679259-taxes-fizzy-drinks-seem-work-intended-stopping-slurping.
TAX POLICY CENTER | URBAN INSTITUTE & BROOKINGS INSTITUTION 10
TAXES CAN CHANGE WHAT WE EAT AND DRINK
People respond to prices when deciding what to eat and drink. If a tax increases the price of soda,
people cut back and drink other beverages. If a tax increases the price of beef, people switch to
pork or chicken. Taxes discourage consumption of targeted foods and drinks and increase
consumption of alternatives.
The magnitude and importance of those changes depend on how much consumers
respond to prices, how much tax gets passed into retail prices, how salient taxes are to
consumers, whether changes in consumption of other products offset or reinforce the direct
effect of the tax, whether businesses reformulate their product lines, and how closely taxes
target actual health concerns.
Taxes would do the most to improve nutrition and health when
consumers reduce purchases of targeted products substantially in response to price
increases;
businesses pass taxes through into retail prices rather than absorbing them in lower profit
margins;
consumers are aware of the tax when they make purchasing decisions;
consumers switch to more nutritious diets, rather than replacing taxed foods and drinks
with other products posing health risks;
businesses develop and market healthier versions of their products; and
health effects are closely related to the product or ingredient that gets taxed.
PRICE RESPONSIVENESS
Myriad studies have examined how much prices affect food and beverage purchases. In a recent
survey, Powell et al. (2013) found that American consumers are sensitive to prices, but to what
extent varies across product categories. Estimates of the price elasticity of demand for fruits,
vegetables, and fast food each average about 0.5, implying that a 10 percent price increase would
reduce purchases 5 percent. But soft drinks are significantly more responsive, with an average
estimated elasticity of about 0.9.
Price responsiveness depends on several factors, including how easy it is to switch to
other products or go without the product entirely. Soft drinks are relatively sensitive to price, for
TAX POLICY CENTER | URBAN INSTITUTE & BROOKINGS INSTITUTION 11
example, because other beverages are readily available, including tap water.8 For the same
reason, price responsiveness increases for narrower product categories. The estimated price
elasticity of sugar-sweetened beverages is higher than for soft drinks as a whole (1.2 versus 0.9),
because some consumers may switch to diet drinks. The price elasticity of energy drinks is higher
still, an estimated 2.4, because consumers can switch to other sugary drinks.9 The narrower the
category, the more numerous the close substitutes and the greater the price responsiveness.
PASS-THROUGH
Taxes can be collected from manufacturers, distributors, retailers, or consumers. That selection
determines who is responsible for sending payments to the government, but it does not
determine who ultimately bears the tax. If taxes are levied on businesses, they may absorb it in
reduced profit margins, increase prices to pass some or all of it through to consumers, or bargain
with workers and suppliers to pass some of it back onto them. If taxes are levied on consumers,
businesses may keep their prices steady or may lower prices to offset some or all of the taxes
consumers face. In relatively competitive markets, the interplay of demand and supply
determines how taxes get shifted, with the less price-responsive side of the market bearing more
of the tax and the more price-responsive side bearing less. In less competitive markets—those
having just a few major sellers—tax shifting also depends on how those sellers interact.
Businesses with market power may absorb much of the tax, may shift it to consumers, or may
even over shift, increasing retail prices by more than the tax. The magnitude of such shifting or
over shifting depends on how the firms compete and how the tax is designed.10
Studies typically find that businesses pass on a large fraction of excise taxes they pay and
do not reduce prices very much when taxes are levied on consumers.11 Consumers thus bear
most of sales and excise taxes via higher prices, and businesses bear relatively little of the burden
through lower profit margins. In some cases, profit margins expand, with businesses raising
prices more than the taxes. There are some exceptions, however; cigarette taxes are not fully
passed on to consumers according to the most recent literature (Harding, Leibtag, and
Lovenheim 2012).
Studies of nutrition-focused taxes have generally confirmed substantial pass-through and,
in some cases, over-shifting. Berardi and colleagues (2013) find that France’s sugared-drink tax 8
In some parts of the world, making tap water safe to drink can thus be part of anti-obesity efforts. 9
These estimates all come with significant uncertainty. Estimates of the price elasticity for fruits, for example, range from 0.3 to 0.8, and for individual categories of sugar-sweetened beverages from 0.7 to more than 3.0 (Powell et al. 2013). Some subsequent studies find high elasticities for sugar-sweetened beverages, including Zhen, Brissette, and Ruff (2014) at 1.9; because these beverages can be habit forming, elasticities may be higher in the long run (Zhen et al. 2011). Wang (2015), however, finds evidence that estimates have been distorted by short-term inventory behavior (e.g., consumers buy extra soda when prices are especially low and run down inventory when prices are higher). She thus concludes that elasticities may be less than half as large as usually estimated. Elasticities may also vary across consumers based on income and other factors (Lin et al. 2011). 10
For example, excise taxes are more likely to be over shifted than sales taxes (Bergman and Hansen 2013). 11
Cawley and Frisvold (2015) provide a useful overview of this literature.
TAX POLICY CENTER | URBAN INSTITUTE & BROOKINGS INSTITUTION 12
was fully passed into soda prices within a few months and at least 85 percent was passed into
flavored water and juice prices. Grogger (2015) estimates that Mexico’s soda tax was over-
shifted; a tax averaging 9 percent lifted soda prices by 12 percent. Bergman and Hansen (2013)
and Bonnet and Réquillart (2012) find over shifting of tax increases for beverages in Denmark.
In an important exception, Cawley and Frisvold (2015) find relatively muted pass-through
of Berkeley’s sugary-drink tax. They estimate average retail prices increased by less than half the
tax during its first three months. For Coke and Pepsi products, only 22 percent of the tax was
passed through. Falbe et al. (2015) find somewhat more pass-through, but still slightly less than
half for most drink categories. One possible explanation is that Berkeley is geographically small,
so consumers can avoid the tax by purchasing outside the city. That hypothesis is bolstered by
the fact that pass-through was lowest on the biggest containers—two-liter bottles and 12-packs
of cans—which are more likely to be the focus of shopping trips. On the other hand, stores that
raised prices by the amount of the tax are often near stores that did not, suggesting other factors
are important as well.
PRICE SALIENCE
Discussions usually focus on how taxes increase prices and how prices reduce consumption. The
tax-price-consumption relationship is indeed the main channel by which such taxes affect
consumer choices. But how taxes are collected also matters. A tax collected at the cash register,
for example, is less salient to some consumers than an otherwise identical tax incorporated in
posted prices (Chetty, Looney, and Kroft 2009; Goldin and Homonoff 2013). As a result, some
consumers may overlook a tax when they shop, even though they end up paying it at checkout. A
tax collected at the register thus does not change behavior as much one that is built into shelf
prices.12 It is possible that well-publicized taxes might also have a signaling effect, deterring
consumption by more than price changes alone would suggest, but as yet there is little evidence
of such effects (Brockwell 2014).
SUBSTITUTES AND COMPLEMENTS
The health effects of taxing unhealthy foods and drinks depend on how people change their
entire diets. Health gains from reduced consumption of targeted products can be offset by
increased consumption of alternatives or amplified by decreased consumption of complements.
A tax on sugar-sweetened beverages, for example, may cause people to switch to untaxed
drinks like milk, fruit juice, and beer (Finkelstein et al. 2013; Lin et al. 2011; Wansink et al. 2014).
12
Differential salience also affects how regressive such taxes are. Goldin and Homonoff (2013) find that low-income shoppers are more aware of taxes collected at the register and thus respond more to them than do higher-income shoppers. Taxes collected at the register are thus less regressive than those built into shelf prices.
TAX POLICY CENTER | URBAN INSTITUTE & BROOKINGS INSTITUTION 13
Those drinks all contain sugar, so the net sugar reduction from the tax will be less than a narrow
focus on sugar-sweetened beverages would suggest. On the other hand, consumers may also cut
back on food they enjoy eating with soda, including salty snacks (Finkelstein et al. 2013). Many of
those contain simple carbohydrates as well and contribute to health concerns. A handful of
studies have attempted to account for such changes in consumption, yielding a wide range of
results. Some studies find that changes offset about half the direct effect of reducing sugar-
sweetened beverage consumption (Zhen, Brissette, and Ruff 2014), some find only slight offsets
(Lin et al. 2011), and some find that adjustments actually amplify the direct effects (Finkelstein et
al. 2013). There are also spillovers into fat and salt consumption. Finally, data on food eaten away
from home and substitutions between food eaten at and away from home is lacking; this is
particularly important to understand given that research suggests that Americans consume
much more of their daily nutrient intake away from home than they did in the past (Smith, Ng,
and Popkin 2014).
Offsetting purchases are an even bigger concern if consumers are able to buy targeted
products without paying the tax, either by shopping in other jurisdictions or buying through
illegal markets. Both are major concerns for tobacco taxes (Stehr 2005). We are not aware of any
evidence of illegal transactions in response to nutrition taxes, but consumers buying in
neighboring jurisdictions is an issue. Purchases from Germany and Sweden may have
undermined Denmark’s fat tax (Snowdon 2013), and purchases from outside the city may have
limited the pass-through of Berkeley’s soda tax (Cawley and Frisvold 2015).
PRODUCT REDESIGN
Most discussions of nutrition taxes focus on how consumers respond to higher prices. But
business responses matter as well. In principle, well-designed taxes and other policies can
encourage businesses to reformulate existing products and introduce new ones that pose lower
health risks. Evidence on such responses is limited but suggestive. In 2005, the United Kingdom
launched two efforts to reduce salt consumption, one emphasizing consumer information and
the other encouraging businesses to voluntarily reformulate their products. Salt consumption did
indeed decline, and Griffith, O’Connell, and Smith (2014) find that it was reformulation of
processed food, bread, and breakfast cereals, not changes in consumer purchasing habits, that
caused it. The recent commitment by American beverage manufacturers to reduce beverage
calories emphasizes the importance of low-calorie products as well as no-calorie ones.13
Taxes would encourage reformulation as long as they target product ingredients and
apply to a substantial portion of the marketplace. A tax on soda volume, for example, would not
13
American Beverage Association, “Alliance for a Healthier Generation and America’s Beverage Companies Announce Landmark CGI Commitment to Reduce Beverage Calories Consumed across the Nation,” news release, September 23, 2014, http://www.ameribev.org/news-media/news-releases-statements/more/334/.
TAX POLICY CENTER | URBAN INSTITUTE & BROOKINGS INSTITUTION 14
encourage businesses to create lower-sugar products, but a sugar content tax would. A local tax
on sugary beverages would provide much less incentive to reformulate than would a national tax.
DOSE AND RESPONSE
Taxes are most effective as a policy instrument when there is a tight relationship between the
product or activity that gets taxed and the negative effect they cause. Taxing the carbon dioxide
emissions that drive climate change is perhaps the best example (Marron, Toder, and Austin
2015). Carbon dioxide emissions have the same effect on the climate whether they come from a
gasoline-fueled automobile in California or a coal-fired power plant in Florida. That tight linkage
makes carbon taxes especially promising for combatting climate change.
The same is roughly true for cigarette taxes. Different types of cigarettes are not identical
and people differ somewhat in their use of and reaction to them. But there is still a strong link
between the “dose” (e.g., the number of cigarettes smoked) and the “response” of policy concern
(e.g., lung cancer).
Dose-response relationships for nutrition, however, are typically less tight. Obesity
depends not just on the amount of sugar one consumes, but also on metabolic factors that differ
across people. The health effects and medical costs associated with obesity, moreover, are not
uniform; severe obesity is associated with much greater harm and costs than mild obesity.14 The
potential harm from a dose of sugar thus varies greatly across people. Some people can eat an
extra candy bar or drink a sweet tea and face no significant health risks; in fact, a few people
would likely benefit. Other people will face only modest risks. But some will face high health
risks.
Taxes on unhealthy foods and drinks cannot reflect such differences across individual
circumstances. Such taxes are less well-targeted than those on carbon or tobacco. A closer
parallel would be taxes on alcohol. Some people consume alcohol with no harm; indeed, some
people likely benefit. Others, however, create substantial costs, for themselves and for others,
from their drinking. This imperfect linkage between dose and response need not rule out taxes as
a policy lever. But it is an important limitation. A tax high enough to address the most severe risks
of drinking or of eating sugar would excessively discourage safe or low-risk activity by many
people. But a lower tax would leave the most severe risks under-addressed and warranting other
efforts.
14
Noelia Duchovny, Eamon Molloy, Lori Housman, and Ellen Werble, “Estimating the Effects of Federal Policies Targeting Obesity: Challenges and Research Needs,” (blog) Congressional Budget Office, October 26, 2015, https://www.cbo.gov/publication/50877.
TAX POLICY CENTER | URBAN INSTITUTE & BROOKINGS INSTITUTION 15
TAX DESIGN MATTERS
If policymakers want to discourage sugar consumption, the most efficient approach would be to
tax it in all foods and drinks. In practice, policymakers often target taxes much more narrowly,
such as by taxing sugar-sweetened beverages.15 The taxes in Berkeley and Mexico, for example,
exempt products like orange juice and beer—which have significant sugar content—to focus on
soda, teas, energy drinks, and similar beverages. That narrow focus creates substitution
opportunities that will weaken the effect of the tax; some consumers, for example, may switch to
juices. And it leaves health risks from the sugar in food and alcoholic beverages unaddressed. On
the other hand, consumer demand for soft drinks appears quite responsive to prices, making
them a relatively good target for taxes. And there is evidence that sugar in beverages may be
more problematic than sugar in foods, thus making sugary beverages a particularly worthy focus.
Taxes can be calibrated in several ways. Berkeley bases its tax on the volume of sugar-
sweetened beverages that people buy: 1 cent per fluid ounce. Mexico does the same in its
beverage tax, charging a peso per liter. For energy-dense processed food, however, Mexico
focuses on the sales value of targeted products, charging 8 percent on products with more than
275 calories per kilogram. A third approach would tax the content of targeted ingredients. For
example, a beverage tax could be based on how much sugar a drink contains.16
These examples illustrate the three basic ways that nutrition taxes can be designed,
focusing on content, volume, or sales.17 Those choices have different implications for reducing
unhealthy eating and drinking. If policymakers want to use taxes to reduce health risks, the most
efficient approach is to target harmful product characteristics. If calories are the problem, the tax
should be on calories. If sugar is the problem, the tax should be on sugar. And so on. Such
targeting encourages consumers to reduce the amount of harmful ingredients they consume and
encourages businesses to offer healthier products.18 Less precise taxes weaken those incentives
and create unintended consequences.
15
Here we focus on efficiency in terms of the incentives created for consumers and businesses. One additional concern is the administrative cost of implementing different tax regimes. Taxes that parallel a jurisdiction’s existing tax structure may be easier to collect. If a government already levies a retail sales tax, for example, it may be less costly to implement a nutrition-focused tax at a different sales tax rate, rather than on volume or ingredient contents. Policymakers will have to balance such administrative concerns against the benefits of better targeting such taxes. 16
Denmark’s short-lived fat tax targeted saturated fat. But the tax was levied on saturated fat used in production, rather than the amount in food itself, and flat rates were used for meat categories (e.g., beef, chicken, pork) independent of the saturated fat content in specific products (Bødker et al. 2015). The tax thus did not closely track the actual content of saturated fats. 17
Another approach would be to categorize food and beverages on a broad healthiness scale and tax those found insufficiently healthy (Engelhard, Garson, and Dorn 2009). 18
Zhen, Brissette, and Ruff (2014) model the consumer portion of this effect, finding that taxing calories (a proxy for sugar content) is more efficient than taxing volume.

TAX POLICY CENTER | URBAN INSTITUTE & BROOKINGS INSTITUTION 16
To illustrate, consider three ways of designing a tax to reduce consumption of added sugar
in soft drinks (table 1).19
TABLE 1
Taxing Content Is More Effective than Taxing Volume or Sales Value Incentives created by different approaches to taxing added sugar in drinks
Tax Base
Sugar content
(per gram)
Volume (per ounce, per
liter)
Sales value (percent of retail
price)
Consumers cut back
on sugary drinks
Businesses develop and promote zero-sugar drinks Consumers cannot avoid tax by buying cheaper drinks
Consumers shift to lower-sugar drinks
Businesses develop and promote lower-sugar drinks
Taxing sugar content would have the biggest effect. The tax would increase the price of
sugar-sweetened beverages, encouraging consumers to drink less of them and businesses to
develop and promote zero-sugar alternatives. By raising the price of high-sugar drinks more than
low-sugar ones, moreover, the tax would encourage consumers to switch to less-sugary products
and would encourage businesses to reduce sugar in existing products and introduce new, lower-
sugar options. A content tax thus encourages consumers and businesses to consider all possible
ways to reduce added sugar from sweetened beverages.
Taxing volume would also reduce consumption of added sugar, but less effectively.
Volume taxes increase the price of sugar-sweetened drinks, encouraging consumers to cut back
and businesses to promote zero-sugar alternatives. But they do not encourage consumers to
switch to lower-sugar drinks nor businesses to develop and market lower-sugar products.
Taxing sales value is less effective still. A sales tax, whether applied to retail sales (as in
many US states) or to value added (as in many nations), would increase the price of sugar-
sweetened drinks and encourage consumers to cut back and businesses to promote zero-sugar
19
By design, taxes on added sugar exempt any sugar in juices, beer, and other drinks that naturally contain sugar. If sugar, rather than added sugar, is a health concern, then a more effective approach would be to tax sugar content in all drinks.

TAX POLICY CENTER | URBAN INSTITUTE & BROOKINGS INSTITUTION 17
drinks. Like a tax on volume, however, a sales tax would do nothing to encourage consumers and
businesses to switch toward lower-sugar drinks. Moreover, a sales tax would allow consumers to
partly avoid the tax by switching to equally sugary, but lower-cost products. Someone who
usually drinks a higher-priced, branded cola in one-liter bottles, for example, could start buying a
less expensive store brand, two-liter bottles, or both. Such adjustments would reduce their
spending on sugar-sweetened beverages, and thus the sales tax they pay, without reducing the
added sugar they consume. Some potential health benefits would be dissipated in switching to
less desired products.
Hybrid approaches are also possible. Hungary exempts sweetened drinks from its volume-
based tax if their sugar content is less than 8 grams per 100 milliliters (about 19 grams per 8
ounce serving). The tax thus encourages consumers and businesses to favor lower-sugar drinks
over higher-sugar ones in general, but the tax does not vary based on sugar content within those
two categories. Mexico has recently considered converting its drink tax to a similar two-tier
structure; a central issue is whether the existing peso-per-liter tax would be reduced on lower-
sugar drinks or increased on higher-sugar ones.20
These design issues matter because sugar-sweetened beverages differ greatly in their
sugar content. Organic tea drinks often have 5 to 10 grams of sugar per 8 ounce serving, for
example, but, in the same volume, may popular regular sodas have 25 to 30 grams, and some
sodas and juice drinks have more than 40 grams (Harris et al. 2014). Taxing these products based
on volume or sales ignores these enormous differences in sugar content. Pairing these taxes with
thresholds partly addresses that concern, but it still leaves large differences. If sugar is a concern,
a serving of some sodas and juice drinks should face 5 times as much tax as a serving of organic
teas, and some sodas should be taxed twice as much as others. Only taxing based on sugar
content can accomplish that.
20
David Ogden, “Mexico's congress accused of caving to soda pop industry in tax cut plan,” The Guardian, October 19, 2015.
TAX POLICY CENTER | URBAN INSTITUTE & BROOKINGS INSTITUTION 18
DETERMINING HOW BIG TAXES SHOULD BE
Discussions of taxing unhealthy foods and drinks often focus on tax rates that average about 10
to 20 percent of a product’s cost (e.g., Finkelstein et al. 2013; Lin et al. 2011; Public Health
England 2015). Taxes at that level would likely inspire consumers to cut back on taxed products
and switch to other, hopefully healthier, ones. The potential for such shifts does not tell us,
however, whether taxes at this level are optimal. Without further context, it is not possible to
know whether such taxes, and the behavior changes they inspire, are too large, too small, or just
right.
The economic concept of externalities offers one way to think about appropriate tax levels.
Externalities arise when consumer and business choices impose costs on third parties. Pollution
from a power plant is a classic example; emissions harm people who have no role in purchasing or
producing the electricity. With nutrition, the primary channel for potential externalities is
through health insurance. Unhealthy foods and drinks can increase health care costs; insurance
then spreads those costs across everyone in the same pool (if private) or across taxpayers (if
public). Consumers have no reason to consider those spillover costs when they decide what to
eat and drink. A tax can act as a proxy for those costs, however, leading consumers and
businesses to make more efficient eating and drinking choices. The externality approach would
thus calibrate taxes to any overlooked health care costs that would be passed on to other people
through health insurance.
A newer approach, informed by insights from behavioral economics, goes further and
suggests that such taxes should also reflect any internal harms that people overlook (Marron
2015). Such internalities occur if people make eating and drinking choices without being fully
cognizant of the eventual damage to their health. Taxes on unhealthy foods and drinks can proxy
for those overlooked internal costs, just as they can for any external costs. The internality
approach would thus calibrate taxes to any overlooked costs, whether borne by third parties or
by consumers themselves.
Under both approaches, appropriate tax levels might then be adjusted up or down based
on distributional concerns. If taxing externalities would be highly regressive, for example,
policymakers might choose a tax smaller than the externality. Under the internality approach,
moreover, policymakers might also consider the welfare of people a policy is trying to help. From
that paternalistic perspective, taxing unhealthy foods and drinks poses a tradeoff. Taxes can
improve the health of people who do not account for potential health effects when making eating
and drinking choices, but they also reduce enjoyment from eating and drinking and represent a
new financial burden. As a result, the optimal paternalistic tax may be significantly less than the
amount of the overlooked internal costs (Marron 2015).
TAX POLICY CENTER | URBAN INSTITUTE & BROOKINGS INSTITUTION 19
Policy analyses of taxing carbon dioxide, tobacco, and alcohol have long used these
frameworks in efforts to determine appropriate tax levels and regulatory policies. Building on an
enormous research literature on climate change, for example, the Obama administration
recently estimated that the “social cost of carbon” is about $40 per metric ton (Marron, Toder,
and Austin 2015). Gruber and Koszegi (2004) have estimated that each pack of cigarettes costs
more than $35 in lost life expectancy. And Herrnstadt, Parry, and Siikamaki (2015) estimate that
the externalities from alcohol use are $27 per liter in the United States.
We do not necessarily endorse any of these estimates, each of which involves significant
uncertainty (as demonstrated by the large literatures with varying estimates). What we do
endorse is the effort to calculate them. Such efforts have shed light on the overlooked costs
associated with these activities and have given the policy community useful context for thinking
about appropriate tax levels.
As best as we can tell, no comparable literature exists for calibrating taxes on unhealthy
food and nonalcoholic drinks. Many studies have estimated the costs of obesity, diabetes, and
other conditions (Cawley 2015; Church 2003; Finkelstein et al. 2009). Many have estimated how
foods and drinks choices relate to those conditions (Montonen et al. 2005; Wyatt, Winters, and
Dubbert 2006). But little research combines all the pieces to determine the “social cost of sugar”
or anything similar.21 Instead, the research overwhelmingly focuses on round-number taxes, such
as 10–20 percent. This as an area where future research could provide useful guidance to
policymakers considering such taxes.
21
One exception is a recent analysis by Wang et al. (2012), who estimate that the medical costs associated with excess consumption of sugary drinks (which they define as more than one per week) are approximately a penny per ounce. The external medical costs of excess consumption would then be somewhat lower, depending on what fraction of those costs are ultimately paid by taxpayers or by other people in the insurance pool rather than out of pocket.

TAX POLICY CENTER | URBAN INSTITUTE & BROOKINGS INSTITUTION 20
WELL-DESIGNED TAXES CAN IMPROVE HEALTH
Nutrition-focused taxes are relatively new, so there is little evidence on their actual health
effects. Several strands of evidence suggest, however, that well-designed taxes can improve
health.
First, there is substantial evidence that taxes on alcohol and taxes have improved health
and well-being. Multiple studies have found that higher alcohol taxes reduce alcohol’s harms
among both adults and children, lowering rates of liver cirrhosis, drunk driving, violence, sexually
transmitted diseases, and other negative outcomes associated with excess consumption
(Chaloupka, Grossman, and Saffer 2002; Chaloupka and Wechsler 1996; Cook and Durrance
2013; Elder et al. 2010; Grossman 1993; Ponicki and Gruenewald 2006). Tobacco taxes,
meanwhile, have played an important role in reducing smoking. Studies find, for example, that a
10 percent increase in tobacco prices decreases consumption about 3–5 percent (van Baal et al.
2007; Kaplan et al. 2001; Townsend, Roderick, and Cooper 1994; Wilson and Thomson 2005).
This is smaller than the effect of alcohol taxes, but still substantial, particularly given the large
size of many tobacco taxes.
Second, as noted earlier, consumers are likely to cut back on unhealthy foods and drinks
when they are taxed. At least as the national level, taxes get passed-through into retail prices
(Berardi et al. 2013; Bergman and Hansen 2013; Bonnet and Réquillart 2012; Grogger 2015).
And higher prices translate into less consumption. Variation in soda prices and consumption, for
example, suggest a 10 percent increase in the price of sugar-sweetened beverages would reduce
consumption around 12 percent (Duffey et al. 2010; Powell et al. 2013). Early reports on
Mexico’s tax on sugar-sweetened beverages, moreover, suggest that prices increased 10 to 12
percent and consumption of taxed beverages declined 10 percent—an effect size larger than that
of tobacco taxes on tobacco consumption (Grogger 2015).22
Third, simulations and limited empirical evidence suggest that taxes can translate into
health gains. One study found, for example, that the small sales taxes many states levy on soda
have slightly reduced BMI (Fletcher, Frisvold, and Tefft 2010b). Another study found that a
penny-per-ounce tax would reduce average daily calorie by 40 calories, for example, resulting in
a 1.3 percentage point reduction in obesity rates (Briggs et al. 2013). Another study estimated
that a 10 percent tax would result in a 3 percentage point reduction in obesity rates (Lin et al.
2011). Results depend on assumptions about how consumers would adjust their diets (for
example, would they substitute from taxed sugar-sweetened beverages to other sources of
sugar?) and how changes in consumption translate into weight changes over time.
22
“Stop slurping: Taxes on fizzy drinks seem to work as intended.” The Economist, November 28, 2015.
TAX POLICY CENTER | URBAN INSTITUTE & BROOKINGS INSTITUTION 21
Switching to unhealthy substitutes or cutting back on healthy complements can reduce or
eliminate the potential health gains from taxing unhealthy foods and drinks. If consumers switch
from regular soda to water, for example, the health gains of taxing sugary drinks could be large. If
consumers switch to juice or cookies for a sugar fix, though, the net health effect of the tax could
be small. And if consumers cut back on healthy foods, the net effect could even be negative.23
Understanding these substitution patterns is an important priority for future research.
The preliminary Mexico results suggest that some consumers did indeed increase consumption
of untaxed fruit juices. 24 A study on prices and consumption in children found an increase in
consumption of other high-calorie beverages among youth when soda prices increased (Fletcher,
Frisvold, and Tefft 2010a). Fruit juices may not have added sugar, but their sugar content is still
often quite high, and some research suggests that excess consumption of fruit juice (beyond the
recommended glass a day) contributes to weight gain (Dennison, Rockwell, and Baker 1997;
O’Neil et al. 2012).
Changes in the effects of consumption over time are also critical. There is evidence of
long-term metabolic adjustment, such that the body “fights” weight loss. Initial changes in diet
may lead to weight loss, but over time this weight loss becomes muted as the body adjusts to the
change in diet (Cummings et al. 2002). Many early studies of sweetened-beverage taxes assumed
that reducing consumption by 3,500 calories would reduce one’s weight by one pound.
Subsequent research has shown, however, that the potential weight loss is much more muted
(Lin et al. 2011). Changes in total caloric intake cannot be linearly extrapolated to specific
amounts of weight loss.
Overall, then, experience with taxing alcohol and cigarettes as well as research on taxes
on unhealthy foods and drinks suggests that moderate sugar-sweetened beverage taxes would
reduce consumption. The net effect on overall sugar consumption is less certain, however, since
people may consume untaxed substitutes or may also cut back on fattening complements. To
truly understand the effects of a nutrition tax, the entire diet and diet patterns of taxed
individuals must be studied and understood better.
23
Nnoaham and colleagues (2009) report this extreme effect in a simulation of taxing “less healthy” foods in the United Kingdom. Some of those foods—yoghurt, for example—go well with healthy foods like fruit. As a result, they find that a tax on “less healthy” foods could actually increase mortality. 24
Ibid.
TAX POLICY CENTER | URBAN INSTITUTE & BROOKINGS INSTITUTION 22
TAXES ON UNHEALTHY FOODS AND DRINKS ARE REGRESSIVE
Proposals to tax unhealthy foods and drinks raise important distributional considerations. Most
prominent is how the new tax burden would be shared across society. Families with lower
incomes typically spend a larger fraction of their household budgets on groceries than do higher
income ones. Moreover, households with lower incomes and less education may be
systematically large consumers of products like sugar-sweetened drinks (Rehm et al. 2008).
Targeted taxes will thus be regressive, imposing a larger burden, relative to income, on lower-
income households than higher-income ones.
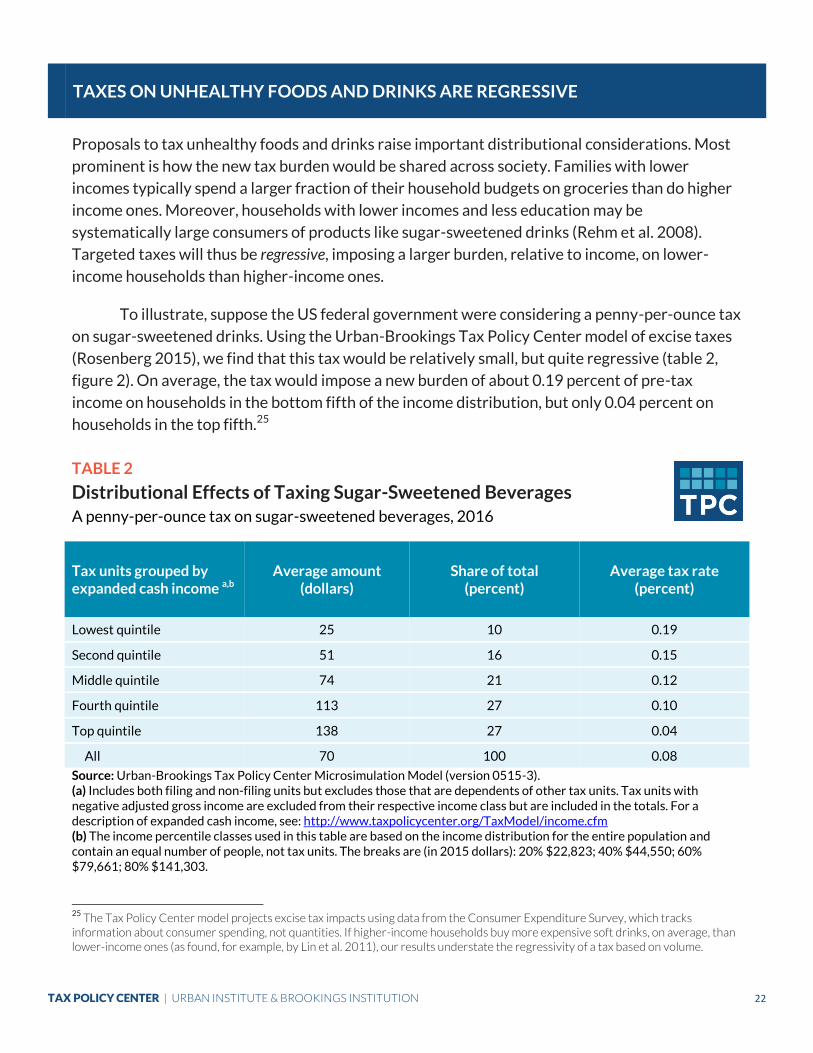
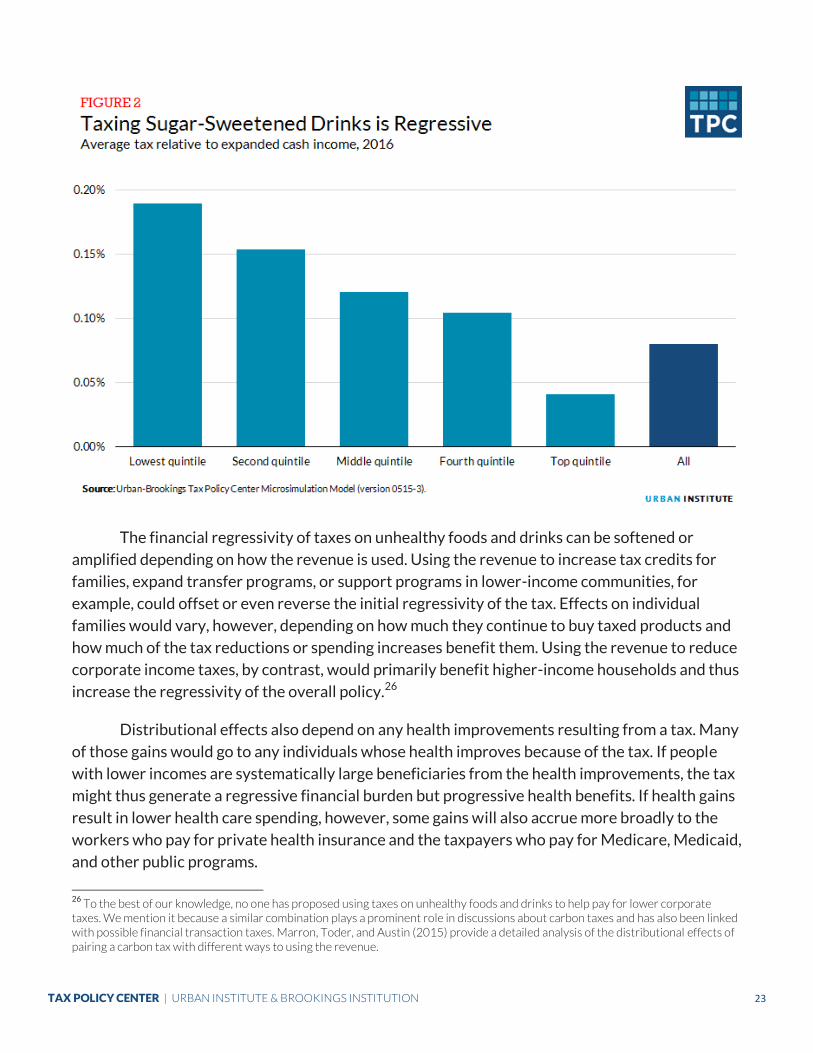
To illustrate, suppose the US federal government were considering a penny-per-ounce tax
on sugar-sweetened drinks. Using the Urban-Brookings Tax Policy Center model of excise taxes
(Rosenberg 2015), we find that this tax would be relatively small, but quite regressive (table 2,
figure 2). On average, the tax would impose a new burden of about 0.19 percent of pre-tax
income on households in the bottom fifth of the income distribution, but only 0.04 percent on
households in the top fifth.25
TABLE 2
Distributional Effects of Taxing Sugar-Sweetened Beverages A penny-per-ounce tax on sugar-sweetened beverages, 2016
Tax units grouped by expanded cash income a,b
Average amount (dollars)
Share of total (percent)
Average tax rate (percent)
Lowest quintile 25 10 0.19
Second quintile 51 16 0.15
Middle quintile 74 21 0.12
Fourth quintile 113 27 0.10
Top quintile 138 27 0.04
All 70 100 0.08
Source: Urban-Brookings Tax Policy Center Microsimulation Model (version 0515-3). (a) Includes both filing and non-filing units but excludes those that are dependents of other tax units. Tax units with negative adjusted gross income are excluded from their respective income class but are included in the totals. For a description of expanded cash income, see: http://www.taxpolicycenter.org/TaxModel/income.cfm (b) The income percentile classes used in this table are based on the income distribution for the entire population and contain an equal number of people, not tax units. The breaks are (in 2015 dollars): 20% $22,823; 40% $44,550; 60% $79,661; 80% $141,303.
25
The Tax Policy Center model projects excise tax impacts using data from the Consumer Expenditure Survey, which tracks information about consumer spending, not quantities. If higher-income households buy more expensive soft drinks, on average, than lower-income ones (as found, for example, by Lin et al. 2011), our results understate the regressivity of a tax based on volume.
TAX POLICY CENTER | URBAN INSTITUTE & BROOKINGS INSTITUTION 23
The financial regressivity of taxes on unhealthy foods and drinks can be softened or
amplified depending on how the revenue is used. Using the revenue to increase tax credits for
families, expand transfer programs, or support programs in lower-income communities, for
example, could offset or even reverse the initial regressivity of the tax. Effects on individual
families would vary, however, depending on how much they continue to buy taxed products and
how much of the tax reductions or spending increases benefit them. Using the revenue to reduce
corporate income taxes, by contrast, would primarily benefit higher-income households and thus
increase the regressivity of the overall policy.26
Distributional effects also depend on any health improvements resulting from a tax. Many
of those gains would go to any individuals whose health improves because of the tax. If people
with lower incomes are systematically large beneficiaries from the health improvements, the tax
might thus generate a regressive financial burden but progressive health benefits. If health gains
result in lower health care spending, however, some gains will also accrue more broadly to the
workers who pay for private health insurance and the taxpayers who pay for Medicare, Medicaid,
and other public programs.
26
To the best of our knowledge, no one has proposed using taxes on unhealthy foods and drinks to help pay for lower corporate taxes. We mention it because a similar combination plays a prominent role in discussions about carbon taxes and has also been linked with possible financial transaction taxes. Marron, Toder, and Austin (2015) provide a detailed analysis of the distributional effects of pairing a carbon tax with different ways to using the revenue.
TAX POLICY CENTER | URBAN INSTITUTE & BROOKINGS INSTITUTION 24
GOVERNMENTS HAVE MANY OPTIONS FOR USING TAX REVENUES
Taxing unhealthy foods and drinks could raise substantial revenues. If Berkeley’s penny-per-
ounce tax on sweetened beverages were extended to the United States as a whole, for example,
it would bring in about $13 billion in gross revenues annually; net revenues would be about $10
billion after accounting for declines in other revenue sources (box 1). A penny-per-ounce tax
would thus be about as large as existing federal excise taxes on tobacco and slightly larger than
federal taxes on alcohol (CBO 2015).
Proponents of such taxes often recommend that the revenues fund additional public
health efforts. Friedman and Brownell (2012), for example, suggest funding for obesity-
prevention programs, social marketing campaigns, and school-based nutrition programs, among
other options. The US Dietary Guidelines Advisory Committee (2015) similarly suggests
earmarking tax receipts for nutrition education and obesity prevention, as does celebrity chef
Jamie Oliver in the United Kingdom.27 A growing number of voices also suggest pairing taxes on
unhealthy foods with subsidies for healthy ones; taxes on sugary drinks, for example, could be
paired with subsidies for fruits and vegetables (British Medical Association 2015; Friedman and
Browell 2012; Mozaffarian, Rogoff, and Ludwig 2015).
Earmarking revenues this way may make sense from a purely public health perspective.
The tax provides one lever to improve nutrition, and deploying the revenue provides a second.
Such pairing can thus enhance the public health effect of a tax. In some cases, it may also make it
more politically viable.
From a broader perspective, however, such earmarking raises several concerns (Marron
and Morris, forthcoming). There is no reason revenues from a tax will match the funding needs of
a corresponding public health effort. The optimal subsidy for healthy foods, for example, might
require twice as much money as a tax provides or only one-half. Linking the two policies too
tightly can require compromising on one or both. Moreover, the imposition of a tax that improves
public health by changing behavior does not imply that the revenue should also be used to
improve public health. Governments have many other beneficial ways to use their revenue. They
may prefer to provide assistance to people with low incomes (thus offsetting some of the
regressivity of the tax), reduce taxes that weaken economic growth, invest in new opportunities
that may or may not be related to health, or simply use receipts as general revenue, just as
Berkeley does with its sugary-drink tax. Given the fungibility of money, such unconstrained use
may well happen even if revenues are nominally earmarked. Absent special financial controls,
revenues directed to a particular program can often be offset by redirecting other funding that
would have supported that program. 27
Jamie Oliver, “Jamie’s Sugar Manifesto,” accessed November 13, 2015, https://jamieoliverprod.s3.amazonaws.com/sugar-rush/pdf/FINALJamiesSugarManifesto.pdf.
TAX POLICY CENTER | URBAN INSTITUTE & BROOKINGS INSTITUTION 25
That broader perspective is evident today in discussions of taxing financial transactions
and carbon dioxide (Burman et al. 2015; Marron, Toder, and Austin 2015). Proposals to tax
financial transactions would often treat receipts as general revenues. Proposals to tax carbon
emissions would often use the revenue to expand tax credits for US residents, to reduce payroll
or corporate income taxes and to help communities most harmed by such a tax. Some advocates
suggest that financial transaction taxes be put toward greater financial regulation or that carbon
taxes be used to finance clean energy investments. The overall tenor of those policy discussions,
however, is to consider revenue uses well beyond the specific goals of the taxes. Governments
should have the same openness when considering taxes on unhealthy foods and drinks.
Box 1 How Much Revenue Would a Sweetened-Beverage Tax Raise in the United States?
Americans consume about 13 billion gallons of regular soda, sports drinks, energy drinks, and other sugar-sweetened beverages each year.
a Drink prices average about 6 cents per ounce (Powell et al. 2014). A
fully passed-through, penny-per-ounce tax would thus increase retail prices about 17 percent. If the price elasticity of demand for these drinks is 1.2 (Powell et al. 2013), the tax would reduce purchases about 20 percent. Annual purchases would fall to about 10.4 billion gallons, or 1.33 trillion ounces, and gross annual revenues from a penny-per-ounce tax would be $13.3 billion.
Net revenues would be lower, however, because the tax would indirectly reduce revenues from federal income and payroll taxes (CBO 2009).
b Beverage taxes, like all excise taxes, reduce taxable incomes. This
is easy to see if a business decides to absorb a tax. In that case, its taxable profit falls (the tax is a deductible expense) and its income tax payments fall. But the offset also exists when businesses pass some tax forward to consumers in higher prices or back to workers or suppliers in lower compensation. Ultimately, someone’s real taxable income is lower. The Urban-Brookings Tax Policy Center model estimates this offset at slightly less than 28 percent. The $13.3 billion in sweetened-beverage receipts would thus result in $9.6 billion in net new federal revenues.
a. Wang et al. (2012) estimate consumption at 13.8 billion gallons in 2009. The 13 billion gallon estimate here adjusts that figure for declining per capita consumption (see Margot Sanger-Katz, “Energy Drinks Are Popular, But Not Enough to Replace Soda, New York Times, October 15, 2015) and population growth.
b. This offset has been overlooked in previous studies of food and beverage taxes except one (CBO 2008).
TAX POLICY CENTER | URBAN INSTITUTE & BROOKINGS INSTITUTION 26
CONCLUSION
Taxes, nutrition, and what we eat and drink are highly resonant issues for many people. It is no
surprise, then, that proposals to tax unhealthy foods and drinks generate a wide range of
reactions, from enthusiasm for punishing “empty calories” to concern about financial burdens on
disadvantaged consumers to alarm at an expanding “nanny state.” Each of these concerns has
some merit. As a result, it is not possible to offer any sweeping opinion on the appropriateness of
taxing unhealthy foods and drinks. Context and details matter.
Well-designed taxes can encourage people to make healthier eating and drinking choices
and can encourage businesses to develop and market healthier products. In so doing, they can
improve health. But even the best-designed taxes are imperfectly targeted and create a
regressive tax burden. People vary significantly in their metabolisms, behavior, nutritional
knowledge, and personal circumstances. Unlike smoking, eating moderate amounts of sugar and
other potentially unhealthy nutrients and ingredients is consistent with good health. Moreover,
policymakers might not design taxes as well as possible.
Taxes are thus an imperfect instrument for addressing nutrition and health concerns.
They may make sense as part of larger policy efforts, particularly to address widespread
concerns about excess sugar consumption. But they are no substitute for efforts to identify and
help people at the greatest risk from obesity, diabetes, and related conditions.
TAX POLICY CENTER | URBAN INSTITUTE & BROOKINGS INSTITUTION 27
REFERENCES
Averett, Susan, and Sanders Korenman. 1999. “Black-White Differences in Social and Economic
Consequences of Obesity.” International Journal of Obesity 23 (2): 166–73.
Bellisle, France, and Adam. Drewnowski. 2007. “Intense Sweeteners, Energy Intake and the
Control of Body Weight.” European Journal of Clinical Nutrition 61 (6): 691–700.
Berardi, Nicoletta, Patrick Sevestre, Marine Tepaut, and Alexandre Vigneron. 2013. “The Impact
of a ‘Soda Tax’ on Prices: Evidence from French Micro Data.” Banque de France Working Paper
No. 415. Paris: Banque de France.
Bergman, U. Michael, and Niels Lynggård Hansen. 2013. “Are Excise Taxes on Beverages Fully
Passed through to Prices? The Danish Evidence.” Denmark: University of Copenhagen.
Beumont, Peter, Masab Al-Alami, and Stephen Touyz. 1988. “Relevance of a Standard
Measurement of Undernutrition to the Diagnosis of Anorexia Nervosa: Use of Quetelet’s Body
Mass Index (BMI).” International Journal of Eating Disorders 7 (3): 399–405.
Bødker, Malene, Charlotta Pisinger, Ulla Toft, and Torben Jørgensen. 2015. “The Rise and Fall of
the World’s First Fat Tax.” Health Policy 119 (6): 737–42.
Bonnet, Celine, and Vincent Réquillart. 2012. “Sugar Policy Reform, Tax Policy and Price
Transmission in the Soft Drink Industry.” Working Paper 4. Exeter, England: Transparency of
Food Pricing - European Commission, Directorate General Research.
Briggs, Adam D. M., Oliver T. Mytton, Ariane Kehlbacher, Richard Tiffin, Mike Rayner, and Peter
Scarborough. 2013. “Overall and Income Specific Effect on Prevalence of Overweight and
Obesity of 20% Sugar Sweetened Drink Tax in UK: Econometric and Comparative Risk
Assessment Modelling Study.” BMJ 347 (4): f6189.
British Medical Association. 2015. “Food for Thought: Promoting Healthy Diets Among Children
and Young People.” London, United Kingdom: British Medical Association.
Brockwell, Erik. 2014. “Signaling through Taxing America’s Sin: A Panel Data Study.” Working
Paper 2014: 4. Sweden: Umeå University.
Brownell, Kelly D., Thomas Farley, Walter C. Willett, Barry M. Popkin, FrankJ Chaloupka, Joseph
W. Thompson, and David S. Ludwig. 2009. “The Public Health and Economic Benefits of Taxing
Sugar-Sweetened Beverages.” The New England Journal of Medicine 361 (16): 1599–605.

TAX POLICY CENTER | URBAN INSTITUTE & BROOKINGS INSTITUTION 28
Burman, Leonard E., William G. Gale, Sarah Gault, Bryan Kim, James R. Nunns, and Steven M.
Rosenthal. 2015. “Financial Transaction Taxes in Theory and Practice.” Washington, DC: Urban-
Brookings Tax Policy Center.
Cawley, John, and David Frisvold. 2015. “The Incidence of Taxes on Sugar-Sweetened Beverages:
The Case of Berkeley, California.” Cambridge, MA: National Bureau of Economic Research.
Cawley, John. 2015. "An Economy of Scales: A Selective Review of Obesity's Economic Causes,
Consequences, and Solutions." Journal of Health Economics 43: 244–68.
CDC (Centers for Disease Control and Prevention). 2014. “National Diabetes Statistics Report,
2014: Estimates of Diabetes and Its Burden in the United States.” Atlanta, GA: Centers for
Disease Control and Prevention.
Chaloupka, Frank J., Michael Grossman, and Henry Saffer. 2002. “The Effects of Price on Alcohol
Consumption and Alcohol-Related Problems.” Alcohol Research and Health 26 (1): 22–34.
Chaloupka, Frank J., and Henry Wechsler. 1996. “Binge Drinking in College: The Impact of Price,
Availability, and Alcohol Control Policies.” Contemporary Economic Policy 14 (4): 112–24.
Chetty, Raj, Adam Looney, and Kory Kroft. 2009. “Salience and Taxation: Theory and Evidence.”
American Economic Review 99 (4): 1145–77.
Cheung, Bernard M.Y., Kwok Leung Ong, Stacey S. Cherny, Pak-Chung Sham, Annette W.K. Tso,
and Karen S.L. Lam. 2009. “Diabetes Prevalence and Therapeutic Target Achievement in the
United States, 1999 to 2006.” American Journal of Medicine 122 (5): 443–53.
Chriqui, Jamie, S. S. Eidson, and F. J. Chaloupka. 2014. “State Sales Taxes on Regular Soda (as of
January 2014).” Chicago: Bridging the Gap, Institute for Health Research and Policy, University
of Illinois at Chicago.
Church, Virginia. 2003. “Economic Costs of Diabetes in the US in 2002.” Diabetes Care 26 (3):
917–32.
CBO (Congressional Budget Office). 2008. “Budget Options Volume I: Health Care.” Washington,
DC: Congressional Budget Office.
———. 2009. “The Role of the 25 Percent Revenue Offset in Estimating the Budgetary Effects of
Legislation.” Economic and Budget Issue Brief. Washington, DC: Congressional Budget Office.
———. 2015. “An Update to the Budget and Economic Outlook: 2015 to 2025.” Washington, DC:
Congressional Budget Office.
TAX POLICY CENTER | URBAN INSTITUTE & BROOKINGS INSTITUTION 29
Cook, Phillip J., and Christine P. Durrance. 2013. "The Virtuous Tax: Lifesaving and Crime-
Prevention Effects of the 1991 Federal Alcohol Tax." Journal of Health Economics 32: 261–7.
Cummings, David E., David S. Weigle, R. Scott Frayo, Patricia A. Breen, Marina K. Ma, E. Patchen
Dellinger, and Jonathan Q. Purnell. 2002. “Plasma Ghrelin Levels after Diet-Induced Weight Loss
or Gastric Bypass Surgery.” New England Journal of Medicine 346 (21): 1623–30.
Dennison, Barbara A., Helen L. Rockwell, and Sharon L. Baker. 1997. “Excess Fruit Juice
Consumption by Preschool-Aged Children Is Associated with Short Stature and Obesity.”
Pediatrics 99 (1): 15–22.
Dobbs, Richard, Corinne Sawers, Fraser Thompson, James Manyika, Jonathan Woetzel, Peter
Child, Sorcha McKenna, and Angela Spatharou. 2014. “Overcoming Obesity: An Initial Economic
Analysis.” London: McKinsey Global Institute.
Drong, A. W., C. M. Lindgren, and M. I. McCarthy. 2012. “The Genetic and Epigenetic Basis of
Type 2 Diabetes and Obesity.” Clinical Pharmacology & Therapeutics 92 (6): 707–15.
Duffey, Kiyah J., Penny Gordon-Larsen, James M. Shikany, David Guilkey, David R. Jacobs, and
Barry M. Popkin. 2010. “Food Price and Diet and Health Outcomes: 20 Years of the CARDIA
Study.” Archives of Internal Medicine 170 (5): 420–6.
Elder, Randy W., Briana Lawrence, Aneeqah Ferguson, Timothy S. Naimi, Robert D. Brewer, Sajal
K. Chattopadhyay, Traci L. Toomey, and Jonathan E. Fielding. 2010. “The Effectiveness of Tax
Policy Interventions for Reducing Excessive Alcohol Consumption and Related Harms.” American
Journal of Preventive Medicine 38 (2): 217–29.
Engelhard, Carolyn L., Arthur Garson, Jr., and Stan Dorn. 2009. “Reducing Obesity: Policy
Strategies from the Tobacco Wars.” Washington, DC: The Urban Institute.
European Competitiveness and Sustainable Industrial Policy Consortium. 2014. “Food Taxes and
Their Impact on Competitiveness in the Agri-Food Sector: Annexes to the Main Report.”
Rotterdam, The Netherlands: European Competitiveness and Sustainable Industrial Policy
Consortium.
Falbe, Jennifer, Nadia Rojas, Anna H. Grummon, and Kristine A. Madsen. 2015. “Higher Retail
Prices of Sugar-Sweetened Beverages 3 Months After Implementation of an Excise Tax in
Berkeley, California.” American Journal of Public Health 105: 2194–201.
Finkelstein, Eric A., Ian C. Fiebelkorn, Guijing Wang. 2003. “National Medical Spending
Attributable to Overweight and Obesity: How Much, and Who’s Paying?” Health Affairs 22 (3,
Supp.): 219–26.
TAX POLICY CENTER | URBAN INSTITUTE & BROOKINGS INSTITUTION 30
Finkelstein, Eric A., Christopher J. Ruhm, and Katherine M. Kosa. 2005. “Economic Causes and
Consequences of Obesity.” Annual Review of Public Health 26: 239–57.
Finkelstein, Eric A., Justin G. Trogdon, Joel W. Cohen, and William Dietz. 2009. “Annual Medical
Spending Attributable to Obesity: Payer-and Service-Specific Estimates.” Health Affairs 28 (5):
w822–31.
Finkelstein, Eric A., Chen Zhen, Marcel Bilger, James Nonnemaker, Assad M. Farooqui, and
Jessica E. Todd. 2013. “Implications of a Sugar-Sweetened Beverage (SSB) Tax When
Substitutions to Non-Beverage Items Are Considered.” Journal of Health Economics 32 (1): 219–
39.
Fletcher, Jason M., David E. Frisvold, and Nathan Tefft. 2010a. “The Effects of Soft Drink Taxes
on Child and Adolescent Consumption and Weight Outcomes.” Journal of Public Economics 94
(11-12): 967–74.
———. 2010b. “Can Soft Drink Taxes Reduce Population Weight?” Contemporary Economic Policy
28 (1): 23–35.
Fung, Teresa T., Vasanti Malik, Kathryn M. Rexrode, JoAnn E. Manson, Walter C. Willett, and
Frank B. Hu. 2009. “Sweetened Beverage Consumption and Risk of Coronary Heart Disease in
Women.” American Journal of Clinical Nutrition 89 (4): 1037–42.
Friedman, Roberta R., and Kelly D. Brownell. 2012. “Sugar-Sweetened Beverage Taxes, An
Updated Policy Brief.” Hartford, CT: UConn Rudd Center for Food Policy & Obesity.
Goldin, Jacob, and Tatiana Homonoff. 2013. “Smoke Gets in Your Eyes: Cigarette Tax Salience
and Regressivity.” American Economic Journal: Economic Policy 5 (1): 302–36.
Griffith, Rachel, Martin O’Connell, and Kate Smith. 2014. “The Importance of Product
Reformulation versus Consumer Choice in Improving Diet Quality.” IFS Working Papers
W14/15. London: Institute for Fiscal Studies.
Grogger, Jeffrey. 2015. “Soda Taxes and the Prices of Sodas and Other Drinks: Evidence from
Mexico.” Cambridge, MA: National Bureau of Economic Research.
Grossman, Michael. 1993. “The Economic Analysis of Addictive Behavior.” In Economics and the
Prevention of Alcohol-Related Problems, 91–123. NIH Pub 93–3513. Bethesda, MD: National
Institute on Alcohol Abuse and Alcoholism, National Institute of Health.
Gruber, Jonathan, and Botond Köszegi. 2004. "Tax Incidence When Individuals Are Time-
Inconsistent: The Case of Cigarette Excise Taxes." Journal of Public Economics 88: 1959–87.

TAX POLICY CENTER | URBAN INSTITUTE & BROOKINGS INSTITUTION 31
Hajjar, Ihab, Jane Morley Kotchen, and Theodore A. Kotchen. 2006. “Hypertension: Trends in
Prevalence, Incidence, and Control.” Annual Review of Public Health 27 (1): 465–90.
Harding, Matthew, Ephraim Leibtag, and Michael F. Lovenheim. 2012. "The Heterogeneous
Geographic and Socioeconomic Incidence of Cigarette Taxes: Evidence from Nielsen Homescan
Data." American Economic Journal: Economic Policy 4(4): 169–98.
Harris, Jennifer L., Marlene B. Schwartz, Megan LoDolce, Christina Munsell, Frances Fleming-
Milici, James Elsey, Sai Liu, et al. 2014. “Sugary Drink Marketing to Youth: Some Progress but
Much Room to Improve.” Sugary Drink Facts. Hartford, CT: Rudd Center for Food Policy and
Obesity.
Herrera, BM, S Keildson, and CM Lindgren. 2011. “Genetics and Epigenetics of Obesity.”
Maturitas 69 (1): 41–9.
Herrnstadt, Evan, Ian W. H. Parry, and Juha Siikamäki. 2015. “Do Alcohol Taxes in Europe and
the US Rightly Correct for Externalities?” International Tax and Public Finance 22 (1): 73–101.
Jensen, Joergen Dejgard and Smed, Sinne. 2013. “The Danish Tax on Saturated Fat - Short Run
Effects on Consumption, Substitution Patterns and Consumer Prices of Fats.” Food Policy 42:18-
31.
Jia, Haomiao, and Erica I. Lubetkin. 2005. “The Impact of Obesity on Health-Related Quality-of-
Life in the General Adult US Population.” Journal of Public Health 27 (2): 156–64.
Kaplan, Robert M., C. F. Ake, S. L. Emery, and A. M. Navarro. 2001. “Simulated Effect of Tobacco
Tax Variation on Population Health in California.” American Journal of Public Health 91 (2): 239–
44.
LeBlanc, Erin, Elizabeth O’Connor, Evelyn Whitlock, Carrie Patnode, and Tanya Kapka. 2011.
Screening for and Management of Obesity and Overweight in Adults. Rockville, MD: Agency for
Healthcare Research and Quality.
Levy, David T., K. Michael Cummings, and Andrew Hyland. 2000. “Increasing Taxes as a Strategy
to Reduce Cigarette Use and Deaths: Results of a Simulation Model.” Preventive Medicine 31 (3):
279–86.
Lin, Biing-Hwan, Travis A. Smith, Jonq-Ying Lee, and Kevin D. Hall. 2011. “Measuring Weight
Outcomes for Obesity Intervention Strategies: The Case of a Sugar-Sweetened Beverage Tax.”
Economics & Human Biology 9 (4): 329–41.
TAX POLICY CENTER | URBAN INSTITUTE & BROOKINGS INSTITUTION 32
Malik, Vasanti S., Barry M. Popkin, George A. Bray, Jean-Pierre Despres, Walter C. Willett, and
Frank B. Hu. 2010. “Sugar-Sweetened Beverages and Risk of Metabolic Syndrome and Type 2
Diabetes: A Meta-Analysis.” Diabetes Care 33 (11): 2477–83.
Marron, Donald. 2015. “Should We Tax Internalities like Externalities?” Washington, DC: Urban-
Brookings Tax Policy Center.
Marron, Donald, and Adele C. Morris. Forthcoming. “How Should Governments Use the Revenue
from Corrective Taxes?” Washington DC: Urban-Brookings Tax Policy Center.
Marron, Donald, Eric Toder, and Lydia Austin. 2015. “Taxing Carbon: What, Why, and How.”
Washington, DC: Urban-Brookings Tax Policy Center.
Montonen, J., R. Järvinen, M. Heliövaara, A. Reunanen, A. Aromaa, and P. Knekt. 2005. “Food
Consumption and the Incidence of Type II Diabetes Mellitus.” European Journal of Clinical
Nutrition 59 (3): 441–8.
Moore, Michael J. 1995. “Death and Tobacco Taxes.” Cambridge, MA: National Bureau of
Economic Research.
Mozaffarian, Dariush, Kenneth S. Rogoff, and David S. Ludwig. 2014. “The Real Cost of Food: Can
Taxes and Subsidies Improve Public Health?” Journal of the American Medical Association 312 (9):
889–90.
Must, A., and R. S. Strauss. 1999. “Risks and Consequences of Childhood and Adolescent
Obesity.” International Journal of Obesity 23 (Supp. 2): S2–11.
Nnoaham, Kelechi E., Gary Sacks, Mike Rayner, Oliver Mytoon, and Alastair Gray. 2009.
“Modelling Income Group Differences in the Health and Economic Impacts of Targeted Food
Taxes and Subsidies.” International Journal of Epidemiology 38: 1324–33.
O’Donnell, Denis E., Conor D. J. O'Donnell, Katherine A. Webb, and Jordan A. Guenette. 2012.
“Respiratory Consequences of Mild-to-Moderate Obesity: Impact on Exercise Performance in
Health and in Chronic Obstructive Pulmonary Disease.” Pulmonary Medicine 2012: 1–12.
Ogden, Cynthia L., Margaret D. Carroll, Brian K. Kit, and Katherine M. Flegal. 2014. “Prevalence
of Childhood and Adult Obesity in the United States, 2011-2012.” Journal of the American Medical
Association 311 (8): 806–14.
O’Neil, Carol E., Theresa A. Nicklas, Gail C. Rampersaud, and V. L. Fulgoni 3rd. 2012. “100%
Orange Juice Consumption Is Associated with Better Diet Quality, Improved Nutrient Adequacy,
Decreased Risk for Obesity, and Improved Biomarkers of Health in Adults: National Health and
Nutrition Examination Survey, 2003-2006.” Nutrition Journal 11 (1): 107.

TAX POLICY CENTER | URBAN INSTITUTE & BROOKINGS INSTITUTION 33
Pan, An and Frank B. Hu. 2011. “Effects of Carbohydrates on Satiety: Differences Between Liquid
and Solid Food.” Current Opinion in Clinical Nutrition & Metabolic Care 14(4): 385–90.
Pawlak, Dorota B., Cara B. Ebbeling, and David S. Ludwig. 2002. “Childhood Obesity: Public-
Health Crisis, Common Sense Cure.” The Lancet 360 (9331): 473–82.
Peeters, Anna, Jan J. Barendregt, Frans Willekens, Johan P. Mackenback, Abdullah Al Mamun,
and Luc Bonneux. 2003. “Obesity in Adulthood and Its Consequences for Life Expectancy: A Life-
Table Analysis.” Annals of Internal Medicine 138 (1): 24–34.
Pi-Sunyer, F. Xavier. 1999. “Comorbidities of Overweight and Obesity: Current Evidence and
Research Issues.” Medicine & Science in Sports & Exercise 31 (11 Supp.) S602–8.
Ponicki, William R., and Paul J. Gruenewald. 2006. “The Impact of Alcohol Taxation on Liver
Cirrhosis Mortality.” Journal of Studies of Alcohol 67 (6): 934–38.
Powell, L. M., J. F. Chriqui, T. Khan, R. Wada, and F. J. Chaloupka. 2013. “Assessing the Potential
Effectiveness of Food and Beverage Taxes and Subsidies for Improving Public Health: A
Systematic Review of Prices, Demand and Body Weight Outcomes: Review of Prices, Demand
and Weight.” Obesity Reviews 14 (2): 110–28.
Powell L.M., Isgor Z, Rimkus L, and Chaloupka FJ. 2014. “Sugar-Sweetened Beverage Prices:
Estimates from a National Sample of Food Outlets.” Chicago, IL: Bridging the Gap Program,
Health Policy Center, Institute for Health Research and Policy, University of Illinois at Chicago.
Public Health England. 2015. “Sugar Reduction: The Evidence for Action.” London, United
Kingdom: Public Health England.
Raben, Anne, Tatjana H. Vasilaras, A. Christina Møller, and Arne Astrup. 2002. “Sucrose
Compared with Artificial Sweeteners: Different Effects on Ad Libitum Food Intake and Body
Weight after 10 Wk of Supplementation in Overweight Subjects.” American Journal of Clinical
Nutrition 76 (4): 721–29.
Rehm, Colin D., Thomas D. Matte, Gretchen Van Wye, Candace Young, and Thomas R. Frieden.
2008. “Demographic and Behavioral Factors Associated with Daily Sugar-sweetened Soda
Consumption in New York City Adults.” Journal of Urban Health: Bulletin of the New York Academy
of Medicine 85 (3):375–85.
Rosenberg, Joseph. 2015. “The Distributional Burden of Federal Excise Taxes.” Washington, DC:
Urban-Brookings Tax Policy Center.
Rothman, K J. 2008. “BMI-Related Errors in the Measurement of Obesity.” International Journal of
Obesity 32 (Supp. 3): S56–9.
TAX POLICY CENTER | URBAN INSTITUTE & BROOKINGS INSTITUTION 34
Sebo, Paul, Sigrid Beer-Borst, Dagmar M. Haller, and Patrick A. Bovier. 2008. “Reliability of
Doctors’ Anthropometric Measurements to Detect Obesity.” Preventive Medicine 47 (4): 389–93.
Shai, Iris, Rui Jiang, JoAnn E. Manson, Meir J. Stampfer, Walter C. Willett, Graham A. Colditz, and
Frank B. Hu. 2006. “Ethnicity, Obesity, and Risk of Type 2 Diabetes in Women: A 20-Year Follow-
Up Study.” Diabetes Care 29 (7): 1585–90.
Smith, Lindsey P., Shu Wen Ng, and Barry M. Popkin. 2014. “Resistant to the Recession: Low-
Income Adults’ Maintenance of Cooking and Away-From-Home Eating Behaviors During Times
of Economic Turbulence.” American Journal of Public Health 104 (5): 840–6.
Snowdon, Christopher. 2013. “The Proof of the Pudding: Denmark’s Fat Tax Fiasco.” London:
Institute for Economic Affairs.
Stehr, Mark. 2005. “Cigarette Tax Avoidance and Evasion.” Journal of Health Economics 24 (2):
277–97.
Taubes, Gary. 2013. “The Science of Obesity: What Do We Really Know About What Makes Us
Fat?” BMJ 346 (5): f1050.
Townsend, Joy, Paul Roderick, and Jacqueline Cooper. 1994. “Cigarette Smoking by
Socioeconomic Group, Sex, and Age: Effects of Price, Income, and Health Publicity.” BMJ 309
(6959): 923–7.
US Dietary Guidelines Advisory Committee. 2015. “Scientific Report of the 2015 Dietary
Guidelines Advisory Committee.” Washington, DC: Department of Agriculture.
Van Baal, Pieter H. M., Werner B. F. Brouwer, Rudolf T. Hoogenveen, and Talitha L. Feenstra.
2007. “Increasing Tobacco Taxes: A Cheap Tool to Increase Public Health.” Health Policy 82 (2):
142–52.
Vartanian, Lenny R., Marlene B. Schwartz, and Kelly D. Brownell. 2007. “Effects of Soft Drink
Consumption on Nutrition and Health: A Systematic Review and Meta-Analysis.” American
Journal of Public Health 97 (4): 667–75.
Walley, Andrew J., Julian E. Asher, and Philippe Froguel. 2009. “The Genetic Contribution to
Non-Syndromic Human Obesity.” National Review, Genetic 10 (7): 431–42.
Wang, Emily Yucai. 2015. “The Impact of Soda Taxes on Consumer Welfare: Implications of
Storability and Taste Heterogeneity.” The RAND Journal of Economics 46 (2): 409–41.

TAX POLICY CENTER | URBAN INSTITUTE & BROOKINGS INSTITUTION 35
Wang, Y. Claire, Pamela Coxson, Yu-Ming. Shen, Lee Goldman, and Kristen Bibbins-Domingo.
2012. “A Penny-Per-Ounce Tax on Sugar-Sweetened Beverages Would Cut Health And Cost
Burdens Of Diabetes.” Health Affairs 31 (1): 199–207.
Wansink, Brian, Andrew S. Hanks, John Cawley, and David R. Just. 2014. “From Coke to Coors: A
Field Study of a Fat Tax and Its Unintended Consequences.” Ithaca, NY: Cornell University.
Wilson, Nick, and George Thomson. 2005. “Tobacco Tax as a Health Protecting Policy: A Brief
Review of the New Zealand Evidence.” The New Zealand Medical Journal 118 (1213): 1–10.
World Health Organization. 2015. “Obesity and Overweight.” Fact Sheet no. 311. Geneva,
Switzerland: World Health Organization.
Wyatt, Sharon B., Karen P. Winters, and Patricia M. Dubbert. 2006. “Overweight and Obesity:
Prevalence, Consequences, and Causes of a Growing Public Health Problem.” American Journal of
the Medical Sciences 331 (4): 166–74.
Zhen, Chen, Ian F. Brissette, and Ryan Richard Ruff. 2014. “By Ounce or by Calorie: The
Differential Effects of Alternative Sugar-Sweetened Beverage Tax Strategies.” American Journal
of Agricultural Economics 96 (4): 1070–83.
Zhen, Chen, Michael K. Wohlgenant, Shawn Karns, and Phillip Kaufman. 2011. “Habit Formation
and Demand for Sugar-Sweetened Beverages.” American Journal of Agricultural Economics 93 (1):
175–93.

Copyright © 2015. Urban Institute. Permission is granted for reproduction of this file, with attribution to the Urban-Brookings Tax Policy Center.
The Tax Policy Center is a joint venture of the
Urban Institute and Brookings Institution.
For more information, visit taxpolicycenter.org
or email [email protected]