should we increase instruction time in low achieving ...ftp.iza.org/dp7437.pdfshould we increase...
TRANSCRIPT
DI
SC
US
SI
ON
P
AP
ER
S
ER
IE
S
Forschungsinstitut zur Zukunft der ArbeitInstitute for the Study of Labor
Should We Increase Instruction Timein Low Achieving Schools?Evidence from Southern Italy
IZA DP No. 7437
May 2013
Erich BattistinElena Claudia Meroni
Should We Increase Instruction Time
in Low Achieving Schools? Evidence from Southern Italy
Erich Battistin University of Padova,
IRVAPP and IZA
Elena Claudia Meroni University of Padova
Discussion Paper No. 7437 May 2013
IZA
P.O. Box 7240 53072 Bonn
Germany
Phone: +49-228-3894-0 Fax: +49-228-3894-180
E-mail: [email protected]
Any opinions expressed here are those of the author(s) and not those of IZA. Research published in this series may include views on policy, but the institute itself takes no institutional policy positions. The IZA research network is committed to the IZA Guiding Principles of Research Integrity. The Institute for the Study of Labor (IZA) in Bonn is a local and virtual international research center and a place of communication between science, politics and business. IZA is an independent nonprofit organization supported by Deutsche Post Foundation. The center is associated with the University of Bonn and offers a stimulating research environment through its international network, workshops and conferences, data service, project support, research visits and doctoral program. IZA engages in (i) original and internationally competitive research in all fields of labor economics, (ii) development of policy concepts, and (iii) dissemination of research results and concepts to the interested public. IZA Discussion Papers often represent preliminary work and are circulated to encourage discussion. Citation of such a paper should account for its provisional character. A revised version may be available directly from the author.

IZA Discussion Paper No. 7437 May 2013
ABSTRACT
Should We Increase Instruction Time in Low Achieving Schools? Evidence from Southern Italy*
This paper investigates the short term effects of a large scale intervention, funded by the European Social Fund, that provides additional instruction time to students in low achieving lower secondary schools of Southern Italy. We control for sorting across classes using the fact that freshman are divided into groups distinguished by letters, they remain in the same group across grades and the composition of teachers in the school assigned to each group is substantially stable over time. We implement a difference-in-differences strategy, and compare contiguous cohorts of freshman enrolled in the same group. We contrast groups with and without additional instruction time in participating schools, to groups in non-participating schools that we select to be similar with respect to a long list of pre-programme indicators. We find that the programme raised test scores in mathematics in schools characterised by students from less advantaged backgrounds. We also find that targeting the best students with extra activities in Italian language comes at the cost of lowering their performance in mathematics. We go beyond average effects, finding that the positive effect documented for mathematics is driven by larger effects for the best students in the group. JEL Classification: C31, I28 Keywords: education policies, instruction time, policy evaluation, quantile treatment effects Corresponding author: Erich Battistin Dipartimento di Scienze Statistiche University of Padova Via Cesare Battisti 241 35123 Padova Italy E-mail: [email protected]
* This paper benefited from discussions with Daniele Checchi, Marco Manacorda, Enrico Rettore and Barbara Petrongolo, and from comments by audiences at UPF (October 2012), Dondena, Bocconi University (December 2012), the Fifth Italian Congress of Econometrics and Empirical Economics (January 2013), University of Turin, (February 2013), IV Workshop on Public Policies, Social Dynamics and Population (March 2013) and Queen Mary (April 2013). We thank the INVALSI for providing the data and in particular Daniele Vidoni, Patrizia Falzetti, Michele Cardone and Andrea Caputo for continuous support and INDIRE, in particular Samuele Calzone, Sara Mori and Serena Greco.

1 Introduction
Understanding the key drivers of quality in education has a fundamental role for the achievement of
the Europe 2020 targets. The relevance of this problem for policy making is particularly important
in areas facing marked socio-economic deprivation, and thus being at risk of lagging behind in their
development. Given the conspicuous investments made by the European Union to finance structural
assistance, providing evidence on the key dimensions that should be targeted by public interventions
in Europe adds to the discussion on the most effective growth strategies for the coming decades.
This paper focuses on education policies that mandate low achieving students to extra hours at
school, thus contributing to the literature that studies the effects of instruction time on academic
achievement. We exploit variation in the number of hours spent at lower secondary school that results
from a programme implemented in selected regions of Southern Italy that are eligible to receive EU
Regional Development Funds (Objective 1 regions) and EU Social Funds. The rationale for intervening
stems from the fact that schools of these areas are characterised by markedly lower student performance
in the various dimensions of learning if compared to schools in the rest of the country.
The Quality and Merit Project (PQM in what follows) is an intervention rolled out in 2010 that
targets low achieving lower secondary school (from sixth to eighth grade) of Objective 1 regions in
Italy.1 Participation of schools is not compulsory. Applicant schools are ranked according to a series
of performance indicators (i.e. percentage of repeating and failing students and drop out rates), and
only those schools at the bottom end of the performance distribution are eventually enrolled. Schools
admitted to the programme must organise education activities outside the regular school hours in a
selected number of classes chosen ex ante by school principals at the time of the application. Activities
are differentiated across students, comprising after school programmes in both mathematics and Italian
language for low achievers, as well as programmes to strengthen and master advanced skills for the
best students. All students in the class participate in such activities, whose duration is - on average -
the same for everyone. The extra time comes in the form of individualised instruction in small study
groups, and all costs borne by the school are covered through EU funds.
Increasing the number of hours spent by students at school is motivated by the direct effects of
education on learning, and by side-benefits coming from the lower exposure to the risk of negative
behaviour (e.g. criminality, or teen-pregnancy). This is more so for students from low socio-economic
backgrounds. However, much of the evidence on the effects of instruction time is descriptive in nature,
and fails to address the possible endogeneity arising from the spurious correlation with other school
inputs and family characteristics. Different strategies have been employed over the years to deal with
1The project is funded through PON Istruzione 2007-2013 (A-2-FSE-2009-2).
2

this problem, yielding mixed evidence.
A first strategy exploits between and within country variability in the time exposure to different
subjects across EU school systems. Lee and Barro (2001) use panel data for 59 countries to assess the
impact of the time spent at school during the year on student performance, finding no effects on test
scores. Using TIMMS data for 39 countries, Woßmann (2003) finds that the effect of instruction time is
positive and significant, but negligible in size. Using a sample of students from more than 50 countries
that participate in PISA, Lavy (2010) finds that instruction time has a positive and significant effect,
though negligible in size, on test scores. Mandel and Sussmuth (2011) exploit cross state variation in
instruction time within Germany and find that it represents a highly robust determinant of cognitive
achievement.
A second strategy exploits the exogenous variation on length of school year that results from
different quasi-experimental settings. Marcotte (2007) and Marcotte and Hemelt (2008) consider the
variation in school-closing days for snowfalls in Maryland, finding that students perform better in
years with less unscheduled closing days. Hansen (2008) also exploit weather-related cancellations
in Colorado and Maryland, as well as changes in test-date administration in Minnesota. The results
point to positive effects of the number of school days on student performance. Sims (2008) uses a
similar idea exploiting a reform in Wisconsin, finding that additional school time is associated with
a small increase in mathematics for fourth grade students, but does not affect reading competencies.
Pischke (2007) exploits the variation in instruction time resulting from the German “short school
years”, finding that shorter years are associated with an increase in grade repetition. Bellei (2009)
finds that the Chilean full school day programme has been beneficial for both reading and mathematics
test scores.
A different stream of literature, which is closer in spirit to the intervention that we consider in this
paper, investigates the effect of a longer school time conceived as “more hours per day” rather than
“more days per year”. Extra-education is organized by opening schools for longer hours during the
afternoon, either providing extra-instruction time on curricular activities or helping students from less
advantage backgrounds doing their homework. Lavy and Schlosser (2005) reports quasi-experimental
estimates of the effect of a programme providing targeted additional instruction time to low achieving
high school students in Israel. The analysis documents an increase in college matriculation rates of
about 3 percentage points. Zimmer et al. (2010) considers Pittsburgh Public Schools, which enacted
various initiative to improve student performance via extra education and tutoring initiatives. Using
longitudinal data on students, the authors document positive effects for mathematics but not for
reading. Lavy (2012) exploits a school finance policy experiment undertaken in elementary schools in
3

Israel that changes the length of the school week and the time allocation to core subjects. He finds that
spending more time at schools and on key tasks yields an increase of achievement in mathematics,
English and sciences; and the effect is much larger for students coming from low socio-economic
background and in school whose students have homogenous socio-economic background. Full school
day compared to half school day was found to have a positive effect on learning outcomes also in
Kindergarten (Robin et al., 2006; DeCicca, 2007; Lash et al., 2008; Gibbs, 2010). Other programmes,
however, were found to be ineffective: this is the case of the programmes evaluated by Dynarski et al.
(2004), Checkoway et al. (2011) and Meyer and Van Klaveren (2011).
The literature on the effects of increased instruction time on academic performance overlaps, to a
large extent, with that considering the effects of specific remedial programmes targeting low achieving
students. In many instances, students benefitting from increased time at school are those from less
advantaged backgrounds, for whom extra activities at school often come in the form of remedial
classes. The intervention considered in this paper shares with remedial education programmes the
idea that public investment should target schools at the lower end of the performance distribution.
However, rather than targeting only low achieving students in the school, PQM targets all students
in low performing schools in the most deprived areas of the country. Thus we can think of PQM as
an intervention providing additional instruction time to the schools which are the most in need.
In the stream of the literature studying the effects of remedial education, Aiken et al. (1998)
find a positive effect of a university-level freshman remedial writing programme and Bettinger and
Long (2009) identify positive effects of remediation on college outcomes of under-prepared college
students in Ohio. Positive results of remedial high school programmes were found also for courses
targeting younger students (Lang et al., 2009) and implemented outside the US context (Lavy and
Schlosser, 2005). On the other hand, Calcagno and Long (2008) find that remedial courses increase the
probability of completing the first year of college of a sample of more than 100, 000 students in Florida,
but they do not affect the likelihood of completing the whole degree. A previous randomised study on
a summer school programme comprising temporary summer employment and academic remediation
aimed at contrasting early school dropouts, found no effects (Grossman et al., 1992). Banerjee et al.
(2007), using experimental data, study a programme providing remedial education to third and fourth
graders in India. The intervention targets low achieving students in the treated schools, and offers
remedial classes to small group of students during regular school time. They find an effect on test scores
of about 0.40 points of standard deviations for children with the lowest pre-programme performance.
The main contributions of this paper can be summarised as follows. First, we provide a rigorous
assessment of the returns to EU investments in the most deprived areas of Southern Italy by con-
4
sidering a large scale intervention worth an increase of 7 percentage points in per-student spending
(9, 100USD, as opposed to 9, 300USD in OECD countries). Thus, the intervention we consider shifts
public spending from below to well above the OECD average. We use longitudinal information on test
scores for consecutive cohorts of students enrolled in PQM schools before and after 2010, and contrast
the resulting time series to that of similar schools located in Objective 1 areas but not enrolled in
PQM. We make use of standardised test scores for sixth graders at the national level, which we link
to administrative information on participating schools made available through the Ministry of Edu-
cation, and investigate the the (short term) causal effects of extra time in education on test scores in
mathematics and Italian language. Given the lack of of standardised test scores at the national level
before the school year 2009/10, our paper is the first to provide a rigours evaluation of the effect of
the EU funds spent on education in Italy on a large scale.
Second, we implement a novel strategy to control for sorting of students across classes that builds
upon features of the Italian school system. Students enrolled in lower secondary schools are divided
into groups, called sezione, distinguished by letters, and remain in the same group for the whole
cycle of studies.2 Assignment of students to groups is not random, and results from adyosyncratic
criteria followed by school principals and from the parents’ pressure to have their children in the most
prestigious sezione of the school. The key feature that we exploit for identification is that prestige
depends on the quality of teachers, and that it is common practice in Italian schools to observe the
same teachers in the same sezione over the years and across grades. We make the assumption that
sorting of students across groups is stable over time, and compare changes in test scores for consecutive
cohorts enrolled in the same sezione before and after PQM. Under the assumption that the group of
teachers employed in the same sezione is approximatively stable over time, our approach also controls
for teachers’ fixed effects.
Third, we exploit within school variability in the enrolment of classes to assess the existence of
indirect effects on test scores of students not directly involved in the PQM programme. In particular
we are worried about possible interaction effects between teachers of participating classes and other
teachers at the school, as the former must attend a preparatory course that helps them organise
activities in the afternoon. The identifying source of information exploited comes from the comparison
between students in control classes of PQM schools, and students in schools located in Objective 1
area. We thus make use of multiple control groups of students, inside and outside PQM schools, to
2Normal age for enrolment in lower secondary education is 10, and progression to the upper secondary level - whichis compulsory by the Italian law - is expected three years later. To give an example, consider a school composed of 6classes: 2 6th grade classes, 2 7th grade classes and 2 8th grade classes. This school will have 2 sezione, which we call Aand B. Hence, in each year there will be sezione A class and sezione B class of 6th graders; sezione A class and sezioneB class of 7th graders; and sezione A class and sezione B class of 8th graders. A student assigned to sezione A class in6th grade in year 1, will be, with the same peers, in sezione A class in 7th grade in year 2, and so on.
5
assess the effects on test scores.
Fourth, we investigate the extent of heterogeneity in the effects of instruction time along two
different dimensions. We first allow for returns that depend on the number of school hours that come
on top of normal school time, thus considering exposure to PQM activities as a dose-response model
rather than a simple participation dummy. Moreover, we go beyond average effects and investigate
the returns to participation on quantiles of the test score distributions. This choice is motivated by
the sizeable heterogeneity in returns that was documented in past work in the literature.
Our main results can be summarised as follows. First, we find that PQM has had a positive effect
on average test scores in mathematics but not in Italian language. This effect is driven by large returns
to participation only for students in the most problematic schools, that is schools in the lowest tertile of
student achievement in the pre-programme periods. These are learning environments characterised by
the highest drop out and failing rates, and with students from markedly less advantaged backgrounds.
In addition, we show that the positive effect is driven by an improvement in mathematical reasoning,
but not in mathematical knowledge. This suggests that afternoon activities do not add much in terms
of knowledge of mathematical concepts, but rather can help students from the most disadvantaged
backgrounds boost their ability to think and to apply knowledge. This finding is in line with the
declared aims of the intervention, which was introduced to encourage student interest and reasoning
in mathematics and Italian language through various enrichment activities. Most likely, this approach
has higher returns to motivation for the most problematic students.
We also find very weak evidence that the duration of this activities matters for explaining the
effects on test scores. Rather, we conclude that the first order effects of being assigned to a PQM
teacher are way more important than those arising from the duration of exposure. Overall we find
evidence that longer hours spent on individualised instruction come into play only if we consider
students from the best performing schools.
Second, for schools in the top tertile we find that extra hours tailored around reading activities
have a negative average effect on test scores in mathematics, and no effect on Italian language. This
result is robust to a series of sensitivity checks that we perform on the data. Given that language
abilities are found to be less responsive to PQM across learning environments, we conclude that in the
least problematic environments instruction time should target activities that enhance mathematical
abilities, as the additional time spent at school engaged in Italian language activities may substitute
the time that students would have invested on mathematics.
Third, we provide evidence of heterogeneous returns across students enrolled in the most problem-
atic schools. We find that the average returns to PQM documented for the lowest tertile is driven by
6

sizeable effects after the 40th percentile of the test score distribution in mathematics. That is, extra
time spent at school leaves unaffected the bottom part of the test score distribution. The absence of
average causal effects for students in all remaining schools still holds when quantiles are considered.
Moreover, we find that the negative effect of reading activities on mathematics for schools in the top
tertile is concentrated at the top end of the test score distribution. In other words, extra hours spent
at school by students on reading come at the cost of outstanding performance in mathematics.
We provide various falsification tests for the results obtained. We first make use of the variability
in test scores across school subjects to control for class fixed effects. The use of class instead of sezione
fixed effects calls for weaker conditions, but comes at the cost of narrowing the set of parameters that
can be retrieved from the data. We however show that the parameters estimated using sezione fixed
effects map into those obtained using class fixed effects, thus providing a specification test in favour
of the procedure that we propose. Second, we check the sensitivity of our results to the presence of
pre-programme trends in test scores using data for fifth graders and sixth graders. Acknowledging
some data limitations related to the availability of test scores at the national level, that are discussed
in larger detail further below, we are not able to reject the validity of our difference-in-differences
strategy.
The remainder of the paper is organised as follows. In Section 2 we describe the intervention
and provide some background information. Data are described in Section 3. Section 4 explains the
sample selection criteria employed, and discusses descriptives statistics. In Section 5 we explain the
methodology used, distinguishing between average and non linear (quantile) effects. Results and
sensitivity checks are presented in Section 6 and Section 7, respectively, while Section 8 concludes
providing some policy recommendations.
2 Background information on the intervention
Systematic evidence from international surveys (IEA-PIRLS 2006; IEA TIMMS 2007; PISA 2003,
2006 and 2009) has identified the gap between the Italian school system and that of other OECD
countries. It is now well documented that Italian students perform below the European average in
both mathematics and reading. This figure conceals a good deal of variability across regions, with
Northern areas performing in line with other European countries and Southern areas performing
markedly below. The recent experience on national assessment tests in Italy has demonstrated that,
while the North/South divide is contained for second graders, it increases at the end of the primary
school and grows even larger in middle schools (INVALSI, 2010b). For these reasons, four regions
located in the Objective 1 area (Campania, Sicily, Calabria and Apulia) are eligible to benefit from
7
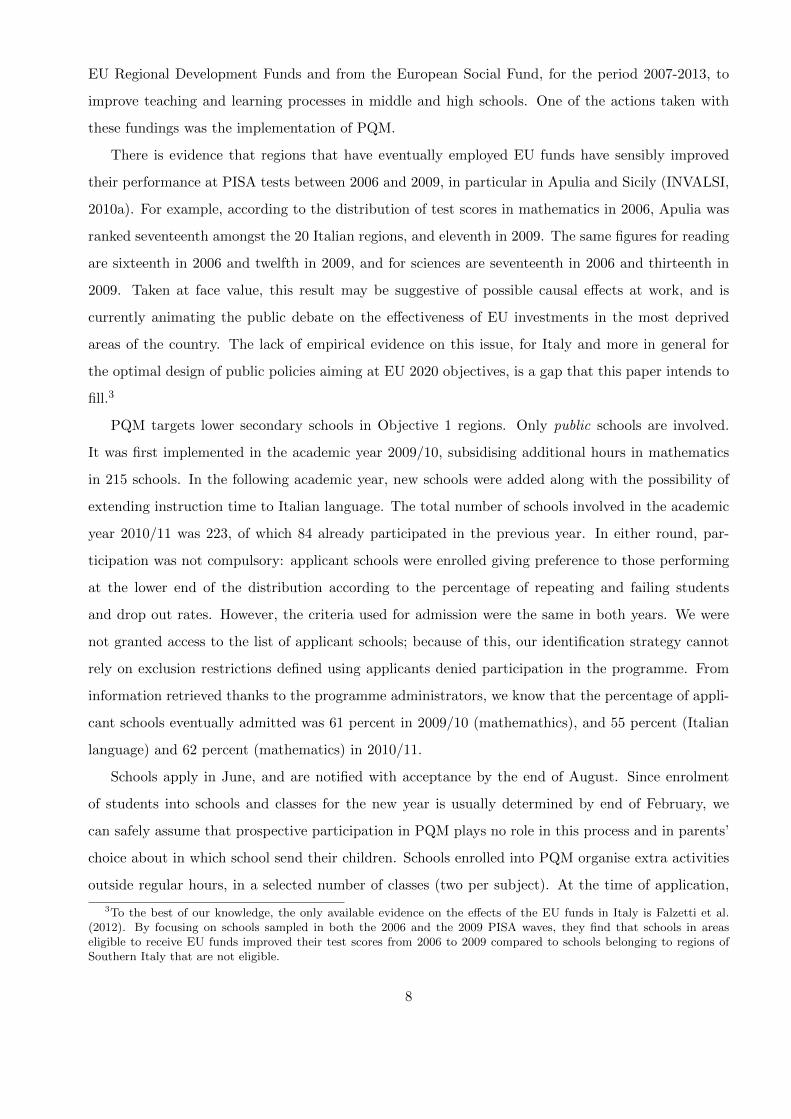
EU Regional Development Funds and from the European Social Fund, for the period 2007-2013, to
improve teaching and learning processes in middle and high schools. One of the actions taken with
these fundings was the implementation of PQM.
There is evidence that regions that have eventually employed EU funds have sensibly improved
their performance at PISA tests between 2006 and 2009, in particular in Apulia and Sicily (INVALSI,
2010a). For example, according to the distribution of test scores in mathematics in 2006, Apulia was
ranked seventeenth amongst the 20 Italian regions, and eleventh in 2009. The same figures for reading
are sixteenth in 2006 and twelfth in 2009, and for sciences are seventeenth in 2006 and thirteenth in
2009. Taken at face value, this result may be suggestive of possible causal effects at work, and is
currently animating the public debate on the effectiveness of EU investments in the most deprived
areas of the country. The lack of empirical evidence on this issue, for Italy and more in general for
the optimal design of public policies aiming at EU 2020 objectives, is a gap that this paper intends to
fill.3
PQM targets lower secondary schools in Objective 1 regions. Only public schools are involved.
It was first implemented in the academic year 2009/10, subsidising additional hours in mathematics
in 215 schools. In the following academic year, new schools were added along with the possibility of
extending instruction time to Italian language. The total number of schools involved in the academic
year 2010/11 was 223, of which 84 already participated in the previous year. In either round, par-
ticipation was not compulsory: applicant schools were enrolled giving preference to those performing
at the lower end of the distribution according to the percentage of repeating and failing students
and drop out rates. However, the criteria used for admission were the same in both years. We were
not granted access to the list of applicant schools; because of this, our identification strategy cannot
rely on exclusion restrictions defined using applicants denied participation in the programme. From
information retrieved thanks to the programme administrators, we know that the percentage of appli-
cant schools eventually admitted was 61 percent in 2009/10 (mathemathics), and 55 percent (Italian
language) and 62 percent (mathematics) in 2010/11.
Schools apply in June, and are notified with acceptance by the end of August. Since enrolment
of students into schools and classes for the new year is usually determined by end of February, we
can safely assume that prospective participation in PQM plays no role in this process and in parents’
choice about in which school send their children. Schools enrolled into PQM organise extra activities
outside regular hours, in a selected number of classes (two per subject). At the time of application,
3To the best of our knowledge, the only available evidence on the effects of the EU funds in Italy is Falzetti et al.(2012). By focusing on schools sampled in both the 2006 and the 2009 PISA waves, they find that schools in areaseligible to receive EU funds improved their test scores from 2006 to 2009 compared to schools belonging to regions ofSouthern Italy that are not eligible.
8

the school principal has to declare the two teachers that will provide extra education, and thus the
corresponding two classes that will participate.
This leaves us with a certain degree of selection that we were hardly able to attribute to any rule
consistently applied across schools. However, as the intervention was designed to be rolled out over
three consecutive years, the teachers enrolled were those who had already obtained a career status,
and were expected to remain at the school for the full duration of the programme (ruling out, for
example, teachers who are about to retire, or those employed with contracts implying high turnover).
As we made clear in the Introduction, most likely these are teachers employed in the same sezione
over time, and whose work loads at school are fulfilled in the sixth, seventh and eighth grade of the
same sezione every year.4 Since we only consider sixth grade classes, this rules out the possibility -
or makes it very unlikely - that the effort exerted by teachers in organising afternoon activities has a
indirect effect on learning for other classes not involved in PQM.
Teachers of participating classes are mandated to a training course, whose aim is to help them
organise the extra activities that they will hold in the afternoon. Training lasts 60 hours (30 hours of
formal training and 30 hours online) and it helps teachers set up an improvement plan, based on the
results of a standardised test which participating classes take at the beginning of the academic year
(October).5 The test should help teachers target pupils who are in need and the areas of intervention,
and all students in participating class receive individualised activities for the same amount of time.
The absence of objective criteria that teachers must follow to select students is a feature that this
programme shares with that considered in Lavy and Schlosser (2005). The training is held in groups
of 10 teachers (i.e. 5 schools), and it is supervised by a mentor who provide support in respect of their
decisions about how to organise remedial and extra activities during the school year. It is important
to stress that training is not content focused, thus it does not affect the teachers’ competences and
their knowledge in the subjects, but it simply supports them in the decision on how to organise the
extra activities and it provides them with some material that can be used during such activities.
4Given the national contract offered to teachers, and the number of hours of instruction time imposed by the Italianlaw, this is true in particular for teachers of mathematics, who have to work a number of hours per week sufficient tocover three classes. For Italian language, weekly workloads can be fulfilled over two classes. To ensure continuity overtime, employing the same teacher across grades of the same sezione is most common than employing the same teacheracross sezione of the same grade.
5We were not granted access to this test, and we cannot distinguish who in the class is benefitting from basic/remedialactivities or other programmes.
9
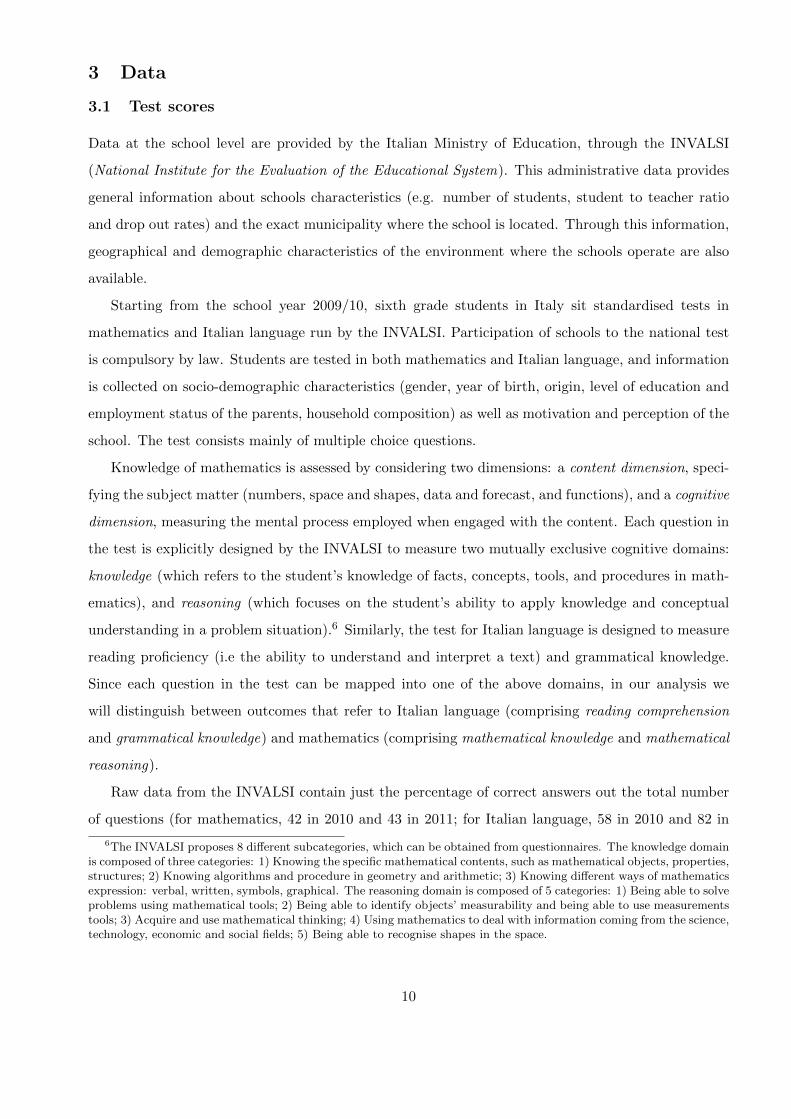
3 Data
3.1 Test scores
Data at the school level are provided by the Italian Ministry of Education, through the INVALSI
(National Institute for the Evaluation of the Educational System). This administrative data provides
general information about schools characteristics (e.g. number of students, student to teacher ratio
and drop out rates) and the exact municipality where the school is located. Through this information,
geographical and demographic characteristics of the environment where the schools operate are also
available.
Starting from the school year 2009/10, sixth grade students in Italy sit standardised tests in
mathematics and Italian language run by the INVALSI. Participation of schools to the national test
is compulsory by law. Students are tested in both mathematics and Italian language, and information
is collected on socio-demographic characteristics (gender, year of birth, origin, level of education and
employment status of the parents, household composition) as well as motivation and perception of the
school. The test consists mainly of multiple choice questions.
Knowledge of mathematics is assessed by considering two dimensions: a content dimension, speci-
fying the subject matter (numbers, space and shapes, data and forecast, and functions), and a cognitive
dimension, measuring the mental process employed when engaged with the content. Each question in
the test is explicitly designed by the INVALSI to measure two mutually exclusive cognitive domains:
knowledge (which refers to the student’s knowledge of facts, concepts, tools, and procedures in math-
ematics), and reasoning (which focuses on the student’s ability to apply knowledge and conceptual
understanding in a problem situation).6 Similarly, the test for Italian language is designed to measure
reading proficiency (i.e the ability to understand and interpret a text) and grammatical knowledge.
Since each question in the test can be mapped into one of the above domains, in our analysis we
will distinguish between outcomes that refer to Italian language (comprising reading comprehension
and grammatical knowledge) and mathematics (comprising mathematical knowledge and mathematical
reasoning).
Raw data from the INVALSI contain just the percentage of correct answers out the total number
of questions (for mathematics, 42 in 2010 and 43 in 2011; for Italian language, 58 in 2010 and 82 in
6The INVALSI proposes 8 different subcategories, which can be obtained from questionnaires. The knowledge domainis composed of three categories: 1) Knowing the specific mathematical contents, such as mathematical objects, properties,structures; 2) Knowing algorithms and procedure in geometry and arithmetic; 3) Knowing different ways of mathematicsexpression: verbal, written, symbols, graphical. The reasoning domain is composed of 5 categories: 1) Being able to solveproblems using mathematical tools; 2) Being able to identify objects’ measurability and being able to use measurementstools; 3) Acquire and use mathematical thinking; 4) Using mathematics to deal with information coming from the science,technology, economic and social fields; 5) Being able to recognise shapes in the space.
10

2011). We complemented this information by constructing test scores that weight items depending on
their difficulty, the latter being defined by 1 over the percentage of students in Objective 1 areas who
answer that item correctly (see Appendix A for further details). The test score that we constructed
is therefore percentage of correct answers, weighting items by their difficulty.7
3.2 Sample selection criteria
We will focus only on the second wave of PQM, which was implemented in the year 2010/11. These
choice is very pragmatic, and driven by the availability of national data on test scores only from
2009/10. Because of this, our main sample selection consists in keeping only schools participating in
PQM for the first time in the year 2010/11. Compared to all remaining schools located in Objective
1 areas, these are characterised by higher student to teacher ratio and higher percentage of teachers
with a permanent contract, and are usually larger schools.
To control for the bias resulting from non-random selection, we choose a group of control schools
sharing similar observable characteristics with the schools enrolled in PQM. We set out a matched pair
comparison of similar schools located in the the same province, but with different status with respect
to enrolment. Matching was implemented with replacement using the propensity score, which we
made area-specific.8 The working sample that resulted from this procedure is composed of 23 schools
enrolled only in PQM mathematics, 37 schools enrolled only in PQM Italian language, and 74 schools
enrolled in both components of PQM. This corresponds to 127 classes receiving extra education in
mathematics, 146 in Italian language and 40 in both subjects.
Using school identifiers provided by the INVALSI, we were able to link data for the same school in
the 2009/10 (pre-programme) and the 2010/11 (post-programme) year. Moreover, as discussed in the
Introduction, we obtain identifiers for the group to which students are assigned at school (sezione).
Thus our working sample consists of two consecutive cohorts of sixth graders enrolled in the same
7The distribution of weights is reported in Figure A-1 of Appendix A, where mathematics is considered in the toppanel and Italian language in the bottom panel. The average weight for mathematical reasoning is 2.78 in 2009/10 (18questions) and 3.05 in 2010/11 (23 questions), while for mathematical knowledge is 2.18 in 2009/10 (23 questions) and2.68 in 2010/11 (20 questions). Weights appear to be slightly higher for the former domain, in both waves of data.The average weight for grammatical knowledge is 1.90 in 2009/10 (15 questions) and 1.63 in 2010/11 (45 questions),while for reading comprehension is 2.07 in 2009/10 (43 questions) and 2.24 in 2010/11 (37 questions). We still observeenough variability in the level of difficulty across questions. Standardised test scores will be considered throughout allregressions, and their distributions for the working sample are presented in Figure A-2 and Figure A-3 of Appendix A.
8The matching procedure along the dimensions considered did not yield major common support problems (only 4PQM schools out of 138 were dropped because of this). Variables used for the calculation of the propensity score are:average percentage of correct answers in mathematics and language in sixth grade; student-teacher ratio, proportionof permanent teachers, drop out rate, failing rate, proportion of repeating students, proportion of immigrant students,proportion of disable students, proportion of female students, proportion of students attending more than 30 hours perweek, number of students, whether the school has received in the previous year other PON funds for other activities,population in town and whether school is located on a mountain municipality. Since all the school chosen to participateto PQM were public, before calculating the propensity score we dropped non public schools from the sample.
11

school and in the same sezione one year before and one year after the introduction of PQM. Table 1
presents the number of PQM and control schools, classes and students in both pre and post intervention
years.9
3.3 Validation sample
Test scores for sixth graders are available at the national level starting from the year 2009/10. This
makes it impossible to test for the existence of pre-programme trends in the outcomes of interest using
only our working sample. For this reason, we used test scores for fifth graders that are available at the
national level from 2008/09, thus adding one year of data. The key assumption is that the trend in test
scores for fifth graders in the years before PQM provides a good approximation to the trend for sixth
graders. This assumption is rather innocuous in the Italian context, given that the transition from
the primary (fifth grade) to the lower secondary (sixth grade) school is characterised by extremely low
geographic mobility. Students typically enrol at both levels in schools in the same local area, which
in the large majority of cases are only a few kilometers apart or are located in adjacent buildings.
We therefore selected fifth graders enrolled in primary schools of areas where PQM was imple-
mented, and used this group to proxy pre-programme trends from 2008/09. Various data cuts were
performed to check the sensitivity of this approach to alternative definitions of the group of fifth
graders employed, all leading to qualitatively similar results. Results from this analysis are presented
in Section 7.
4 Descriptive statistics
4.1 School characteristics and test scores
Table 2 presents descriptive statistics for PQM schools and for the schools chosen as controls in the
working sample, using only pre-programme data. The average of the various dimensions considered is
similar - see columns (1) and (2) - and, in fact, not statistical different between groups - see column
(3). In column (4) we report the estimates of a logistic regression for the probability of being a PQM
school in the working sample. It follows that none of the variables included is a good predictor for
being a PQM school, and this corroborates the quality of the matching procedure implemented.10
Throughout our empirical exercise we will stratify schools according to tertiles of performance
in mathematics in the pre-programme year. The aim is to cluster schools according to their socio-
9Figure A-4 of Appendix A shows a map of the 4 regions involved and the location and number of PQM and controlschools in each municipality.
10In Table A-1 of Appendix A we present descriptive statistics for student characteristics in the two groups of schools,that is for characteristics that were not directly used in the matching procedure. The table shows that there are minordifferences between the two groups along some dimensions (e.g. students in control schools have higher percentage ofmothers employed and of highly educated parents), but the overall results point to rather similar patterns.
12

economic background. A similar stratification could be obtained using test scores in Italian language,
yielding conclusions similar to those presented below. The summary statistics presented in Table 3
suggest that the stratification adopted indeed resembles division according to socio-economic back-
ground. Schools in the bottom tertile are worse than the schools in the other tertiles along various
dimensions: the proportion of problematic students is much higher in this group. As for student char-
acteristics, we notice that students attending schools in the bottom tertile come from less-advantaged
family backgrounds: less mothers are working, less fathers have a high occupational status, the propor-
tion of parents with low education is much higher, and the proportion of parents with high education
much lower; the coefficient for home possession is lower.11
Table 4 sheds light on within class variability of test scores using pre-intervention data. We first
standardised test scores, separately for mathematics and Italian language, and defined a grid based on
the standard deviation. This grid varies between −1.1 and 1.1 points of standard deviation. For each
class, we computed the percentage of students scoring above points in the grid. We then computed
the distribution of this percentage across classes, maintaining the classification of schools by tertile.
Reported in the table are selected percentiles of this distribution (10th, 50th and 90th). Consider, for
example, the median of this distribution. Table 4 shows that the best (e.g. top 20 percent) students in
the worst schools are average (e.g. top 60 percent) students in the best schools. As the intervention we
consider has a mastery learning focus, results in the table imply that afternoon activities are carried
out in rather different learning environments.
Table 5 paves the way for our empirical analysis, as it shows how (standardised) test scores have
changed over time in PQM and control schools. Descriptives are presented for mathematics and
Italian language by tertile of performance in the pre-programme year, the most problematic schools
being in the top panel. As expected, test scores are highly correlated with the socio-economic back-
ground of students in the school. As for mathematics, the change in test scores for classes involved in
PQM mathematics appears more pronounced, with respect to control classes, in the most problematic
schools. For two out of the three groups considered, numbers in the table picture positive or constant
trends in test scores from 2009/10 to 2010/11 for both mathematics and Italian language. Scores in
the best schools are an exception to this general pattern, as they are associated to negative trends.
11The variables used to calculate this index are: child has a quiet place to study; child has a desk to do his homework;child as a single room for him-self; number of books in the house; house has an internet connection; house has a burglaralarm; house has more than one bathroom; parents have more than one car. Higher values of the score denote better offhouseholds.
13

4.2 Class vis-a-vis sezione clustering of students
Endogenous sorting of students across groups will be addressed by using sezione fixed effects, building
upon the practice that teachers, or the large majority of them, are assigned to the same sezione across
grades. Given the administrative data available, no empirical evidence can be provided to support the
adoption of such practice, although anecdotal evidence - also confirmed by the Ministry of Education -
suggests that this is the predominant rule rather than the exception. The numbers presented in Table
6 were derived to put this idea into context, using data only for schools not enrolled in the programme.
We start by estimating a model in which the variance of test scores across students (in both
mathematics and language) is explained by two levels: school and class. We find that, for both subjects,
the percentage of variance explained by each level is roughly constant in 2009/10 and 2010/11. We
thus pool the two waves of data, and report in Panel A of Table 6 results from the multilevel analysis.
Class membership is twice as much important than school membership in explaining variability of
mathematics test scores (23 percent as opposed to 11 percent), while the two sources are more aligned
when it comes to Italian language. We also report results of the same analysis obtained using sezione
instead of class membership. Since the same sezione appears both in 2009/10 and 2010/11, this
analysis attempts at explaining the same variance using roughly half the number of groups. We
find that the percentage of variance explained by school membership is roughly comparable to the
previous figures, and that sezione explains 13/23 = 57 (for mathematics) and 9/15 = 60 (Italian
language) percent of the variance that was explained using class membership. We thus conclude that
the contribution to the variance coming from class membership is mostly spanned by that coming
from sezione membership.
We complement this analysis by regressing average test scores in 2010/11 on average test scores in
2009/10 for the same sezione. Three nested specifications are considered for the regressions reported
in Panel B of the table. The first specification obtains results from a null model; the second controls
for school fixed effects; the third adds controls (percentage of females, class size, percentage of foreign
students). The following outcomes are considered: test scores (to proxy persistence of students’s
and teachers’ ability), and the home possession coefficient and the percentage of foreign students in
the class (to proxy assignment based on socio-economic status). Results show that the persistence
in the characteristics of the sezione cannot be fully explained by school fixed effects or observable
variables, and thus that sezione membership captures dimensions different from those controlled for
in the analysis presented in what follows.
14

4.3 Instruction time
The intervention we consider is similar in spirit to those in Lavy and Schlosser (2005) and Banerjee
et al. (2007). However, rather the targeting only the low performing students, it offers extra hours
at school - in the form of remedial or advanced activities aimed at consolidating knowledge acquired
during normal school hours - to all students in the class. According to the institutional settings
regulating the programme, the number of afternoon activities planned per class varies between 1 and
8. Each activity consists of 15 hours of extra education to be held outside the regular school time to
students, and the teacher is free to decide how many activities and how many students to involve.12
In most classes the number of activities chosen by the teacher is between 2 and 4. Number of students
involved and number of afternoon activities are very similar in the two participating classes within
the PQM school.
Exploiting variation in number of activities provided, we used hours spent by the class in afternoon
activities on subject k as indicator of treatment intensity. We also considered a standardised version
of this indicator, obtained using the total number of hours that are mandatorily dedicated to subject
k during regular school time.13 Descriptives of the two indicators in the three groups of schools are
provided in Table 7. The percentage change in instruction time is on average higher for mathematics
than for Italian language, and can be quite substantial for both dimensions: we found that the mean
value is well above 20 percentage points for mathematics, and set at about 12 percentage points for
Italian language. These numbers amount to about 30 hours of afternoon activities for both subjects.
The profile across school tertiles is u-shaped, with schools at the two ends of the distribution of test
scores presenting lower take up rates of extra activities.
To shed light into the possible determinants of this variability, we regressed intensity in year
2010/11 on class inputs in year 2009/10, using observations for the same sezione in both years and
controlling for school fixed effects. The results of this analysis are fully documented in Table A-2 of
Appendix A, and point to generally weak correlations of intensity with the regressors considered (i.e.
test scores and student characteristics in the baseline year). The only exceptions worth mentioning
are that, for schools in the bottom tertile group, better performance in mathematics at baseline is
negatively correlated with the intensity of PQM activities in mathematics, while for the middle tertile
group better performance in mathematics at baseline is positively correlated with the intensity of
PQM activities in mathematics.
12Teachers receive extra-salary for their extra loads (50 euro per hour); thus considering their salary, planning 4activities would make one month salary.
13We computed this by knowing that each activity lasts 15 hours, and we know that children in lower secondary schoolsdedicate 4 hours per week to mathematics and 7 hours per week to Italian language and that the number of weeks in aschool year are 33.
15

5 Methods
5.1 Identification
The analysis is carried out using two cohorts of sixth graders in 2009/10 and 2010/11. We compare
performance of students enrolled in the same sezione before and after the programme implementation.
This defines a standard difference-in-differences approach, with sezione fixed effects. Although we have
access to micro data for students, we are not able to identify who participated in the different type of
afternoon activities within PQM classes. Because of this, the causal parameters retrieved refer to the
effect of being in a class with a PQM teacher.
Since some classes receive extra education in mathematics, some in Italian language and some in
both, we allow for possible cross subject effects (i.e effect of PQM mathematics on test scores in Italian
language, and viceversa). Our preferred specification considers the following equation:
ykjt = αk + ηt + βkMDMjt + βkID
Ijt + δkNjt + γj + εkjt,
where ykjt is the outcome variable in class j, year t and school subject k. DIjt and DM
jt are dummies
for being enrolled in any activity in Italian language (I) and mathematics (M), respectively, while Njt
is dummy for control classes in PQM schools. There is DIj1 = DM
j1 = Nj1 = 0 for all j, where t = 1
and t = 2 refer to the pre- and post-programme periods, respectively. With this notation βMM and βMI
measure the effect of receiving extra hours in mathematics or Italian language, respectively, on the
mathematics test score. A similar interpretation applies to the effects βIM and βII on Italian language.
The conditioning on a set Xjt of student and school level variables is left implicit throughout, but is
used in the empirical analysis; ηt captures time effects, αk a subject-specific effect (k ∈ {M, I}), and
εkjt is a random error.
Variability is this setting is across classes, time and school subjects. We have two observations per
class at each time coming for cross school subjects variability, but classes are not followed over time
because we can only observe consecutive cohorts of sixth graders. We make the assumption that class
fixed effects γj are totally spanned by sezione fixed effects. Since we can identify students in the same
sezione across different cohorts in the same school, we exploit variability in outcomes over time for
the same sezione to write:
∆ykj2 = (η2 − η1) + βkMDMj2 + βkID
Ij2 + δkNj2 + ∆εkj2, (1)
where, here and in what follows, ∆ is the time difference operator and ∆wkj2 ≡ wk
j2 − wkj1. This
represents our preferred identification strategy.
16

We then use the variability across classes to test the assumption that sorting is driven solely by
sezione fixed effects. Since there is:
yjt = (αM − αI) + (βMM − βIM )DMjt + (βMI − βII )DI
jt + (δM − δI)Njt + εjt, (2)
where wjt ≡ wMjt −wI
jt, we use this equation to obtain βM ≡ βMM −βIM , βI ≡ βMI −βII and δ ≡ δM −δI .
If the assumption on the role played by sezione fixed effects is correct, one should be able to back out
the parameters in (2) from the knowledge of the parameters in (1). We use this as a specification test.
5.2 Estimation
The parameters in (1) are estimated from the regression of ykjt on a time dummy, DMjt , DI
jt, Njt
and sezione fixed effects. The parameters in (2) are instead estimated from the regression of yjt on
DMjt , DI
jt and Njt. We rely throughout on linear probability equations, clustering standard errors at
the school level. All regressions presented control for class size, weekly class schedule and class level
variables constructed from student level information (e.g. gender, immigration status, whether the
student is ahead or behind compared to her age, education of parents and mother working status).
The basic specification is further refined by considering variability in the number of activities.
In this case, equations (1) and (2) are estimated using INT Ijt and INTM
jt in place of DIjt and DM
jt ,
respectively, where the former variables correspond to the measures of intensity defined Section 4.
As discussed, the number of activities is chosen by teachers. Thus, for identification we require that
the decision is modeled through teacher’s unobservables that fall into sezione fixed effects. This
assumption is not unreasonable for the case at hand, because of the practice to assign teachers to the
same sezione across years. In this setting, sezione fixed effects and teacher fixed effects coincide.
The analysis is carried out by considering three different outcomes ykjt, all defined at the class
level. We start by using average test scores, for which results are presented in Table 8. We then
use an indicator for having the average test score above a certain threshold, which we set to be
subject specific. Thresholds are defined using baseline data, calculating a grid from the 1st to the
99th percentile of the relevant distribution. We thus make use of between class variability in test
scores to study whether all classes benefit (lose) in the same way from PQM. Our approach closely
resembles a non-linear difference-in-differences method, that was originally proposed by Firpo et al.
(2009) and then re-considered by Havnes and Mogstad (2010). Our specification for dealing with
quantiles proves particularly convenient to account for the availability of multiple control groups, and
to model treatment intensity represented by variability across PQM classes in the number of activities.
The results from this analysis are presented in Figure 1.14
14The full set of regressions underlying the graphical presentation of results in Figure 1 and Figure 2 is available upon
17

Finally, we want to study if the effects of PQM on average test scores are driven by returns that
are markedly different across students in the class, thus shedding light on within class variability. We
thus set ykjt to be the percentage of students in the class scoring above a certain threshold, which again
we make subject specific and defined from percentiles calculated on baseline data. The results from
this analysis are presented in Figure 2.15
6 Results
6.1 Average effects
Table 8 presents estimates of the effects obtained from equation (1) for both mathematics and Italian
language, by tertiles of the average test score in the pre-intervention year. The variable considered is
average test score in the class. Test scores are standardised, so that the effect measures percentage
points of standard deviation. The left hand side part of the table refers to mathematics, while the
right hand side part refers to Italian language. For both school subjects we present the break down
by cognitive domain covered in the test, for which the definition was given in Section 3.1. Thus we
also report results for mathematical reasoning and knowledge, and for reading comprehension and
grammar knowledge.
The first result worth noting is the absence of any effect of PQM on Italian language, for both
domains considered and across tertile groups - see columns (4), (5) and (6). On the other hand, we
find that extra instruction time in mathematics has large positive effects on mathematics test scores,
but only for students in the most problematic schools (0.25 points) - see column (1). This effect is
driven by the “reasoning” domain; the effect on the “knowledge” domain is still positive, but not
statistically significant at the conventional levels. This finding is interesting in itself, as it suggests
that extra instruction time in the afternoon does not increase basic knowledge of the targeted children,
but it helps them applying and using the knowledge they have acquired during normal school hours.
This finding in consistent with the objectives of the programme expected at roll out.
We also find evidence of cross subject effects for schools in the top tertile, since extra time dedicated
to Italian language impacts negatively on test scores in mathematics - see the last panel of column
(3). The size of this effect (−0.31 points) is comparable to that of extra activities in mathematics
found for schools in the bottom tertile, and refers to the “knowledge” domain. This result suggests
that the extra time spent on Italian language substitutes the time that the best students would have
request, but is not presented in what follows.15We performed various sensitivity checks finding that results are robust to modifications of the specification adopted.
In particular, we estimated quantile treatment effects relying on the change-in-changes approach by (Athey and Imbens,2006).
18

spent developing their mathematical knowledge, and this in turn impacts on test scores. The general
picture that emerges is in favour of targeting the most problematic students with extra activities that
help develop mathematical reasoning. On the other hand, we find that Italian language is not affected
by afternoon activities, which may in fact be less effective in those environments where students would
have probably invested in instruction time also without PQM.
Moreover, by considering the coefficient associated to Nj2 in Equation (1), we find that test
scores for control classes are the same in schools with and without PQM. This rules out possible spill
over effects that may arise, for example, if teachers of PQM classes share with other colleagues at
the school materials and teaching modalities acquired during the preparatory training course. This
finding reinforces the idea that the effects documented on test scores are solely driven by the extra
instruction time to which students of PQM classes are exposed. Of course, it may well be that these
effects conceal a good deal of variability in returns within classes. This is the question to which we
turn in the next section.
Table 9 replicates the same analysis by considering number of hours spent on afternoon activities,
our measures of intensity defined in Section 4. The effect in equation (1) is parametrised distinguishing
between up to 30 hours (corresponding to two modules), which is the baseline treatment, and more
than 30 hours, which is measured as deviation from baseline. Results from this analysis are reported
in columns labeled Average. We also experienced other cuts for the definition of treatment intensity,
all leading to qualitatively similar results.
We find that the results documented above are confirmed, and that the duration of instruction
time (i.e. two versus more than two modules) does not play any important role. We still have the
cross subject effect for schools in the top tertile of performance, although the significance of this effect
is somewhat lower. We conclude that the effects on mathematics are largely driven by having a PQM
teacher, rather than by the duration of such individualised activities.
6.2 Quantile effects
We now go beyond averages and estimate the impact of PQM across classes and for students within
the class. We start by defining dummies for being a class scoring above pre-defined thresholds, these
corresponding to percentiles of the outcome distribution in the pre-programme year.16 After having
defined a grid ranging from the 1st to the 99th percentile for both mathematics and Italian language,
we compute the effect of PQM on the probability of being at least as good as the τ th percentile of the
outcome distribution in 2009/10. The coefficients estimated from the 99 regressions as in (1) and the
16Figure A-5 of Appendix A presents the percentiles of the score distribution for the two school subjects.
19

corresponding 95 percent confidence intervals are presented in Figure 1. The left hand side column of
the figure reports the coefficients associated to DMj2 when test scores in mathematics are considered;
the right hand side column refers to DIj2 for scores in Italian language. The same exercise performed
using our indicators of intensity yields qualitatively similar results, and is thus not discussed in what
follows.
Results show that, in the most disadvantaged schools, PQM has significantly raised the probability
that a class test score for mathematics is above values of the baseline distribution after the 40th
percentile. Taken at face value, this result rules out that returns to participation are the same across
classes. Under the assumption that the ranking of classes is left unaffected by PQM, we can conclude
that such returns are lower in those environments characterised by the largest number of under-
performing students. The remaining panels in the left hand side column of Figure 1 confirm the
results for mathematics already documented for average effects, pointing to no effect in all remaining
schools. We also confirm that extra hours on activities concerning Italian language have no impact
on quantiles of the Italian language scores - see the right hand side column of the figure.
The results presented so far speak about the effects of having been assigned to a class with a
PQM teacher. We now investigate to what extent the distribution of test scores changed within
PQM classes. Similarly to the programme considered by Banerjee et al. (2007), students enrolled in
afternoon activities were selected using a pre-test conducted at the beginning of the school year. We
don’t have access to results from this test. Moreover, although we know that all students in the class
are involved, we cannot identify the type of activities undertaken by each student. We can however
investigate to what extent returns to participation are heterogenous within the class, and use this
result to provide a tentative explanation for which students are benefitting the most.
Using the same grid as before, we calculated 99 outcome variables representing the percentage of
students in the class scoring above the τ th percentile of the outcome distribution in 2009/10. Figure
2 reports the profiles obtained from regressions as in (1) that make use of these 99 outcomes, as well
as the corresponding confidence intervals. As in other studies, results point to heterogeneous returns
within the class for mathematics test scores (see the left hand side column of Figure 2) but not for
Italian language. The first half of the distribution of test scores in the worst schools is substantially
unaffected by having a PQM teacher. This implies that the positive average effect documented in
Table 8 for this group is driven by an increase in the probability of scoring values in the second half
the distribution. In results not tabulated, we found that the quantile treatment effects calculated after
the 40th percentile are roughly constant and equal to 0.4 points of standard deviation. Moreover, for
schools in the middle and top tertile we replicate the results for mathematics documented in Table
20

8. Overall these results picture a good deal of variability in returns across tertile groups, and are
consistent with observing large returns in the most problematic learning environments only for the
best students.17
The left hand side panel of Figure 3 reports the profile obtained from the 99 regression estimates
of the coefficient for DIj2 on mathematics test scores using between class (left hand side panel) and
within class (right hand side panel) variability for the top group of schools. This is the only cross
subject effect for which we found statistically significant results in Table 8. We find that the negative
effect documented is substantially stable across classes, although it is very imprecisely measured. Such
effect appears to be driven by negative effects at the highest quantiles of the score distribution. This
finding is consistent with observing that the extra time dedicated to Italian language activities results
in lower performances of the outstanding students.
Table 9 replicates the within class analysis by considering our measure of treatment exposure.
Only results for selected percentiles (25th, 50th and 75th) are presented. For schools in the bottom
and middle tertiles, the general pattern emerging from Figure 3 is confirmed. For some combinations,
parameters are marginally significant and point to larger effects at the top end of the distribution.
For schools in the top tertile we find that the duration of afternoon activities plays some role at
the bottom end of the distribution (see results for the bottom 25 percent). Overall we seem to find
evidence that longer hours spent on individualised instruction become important only if we consider
students from the best performing schools. Also confirmed are the negative cross subject effects of
activities in Italian language on mathematics test scores, which are increasing in size as one moves to
the highest percentiles of the distribution.
7 Specification tests
The aim of this section is threefold. First, we provide a test for the validity of sezione fixed effects as
a mean to control for unobserved class differences in our analysis. To this end, we exploit variability
across subjects and derive the comparison of point estimates as discussed in Section 5. We then discuss
the plausibility of the common trend assumption for PQM and control schools in pre-programme
periods. Since tests scores from the national assessment are available in Italy for sixth graders only
from 2009/10, we proxy counterfactual scores by considering fifth graders, for whom data are available
since 2008/09. Finally, we run a set of placebo regressions using as outcome the dummy for having
17In results non presented, we find that a similar picture emerges for mathematical reasoning. We also find weakevidence of heterogenous effects on mathematical knowledge at selected percentiles (e.g. between the 50th and 70th
percentile of the baseline distribution in the bottom tertile group of schools). As a further check, we replicated the sameanalysis using the change-in-changes approach by Athey and Imbens (2006). We found that the effects on quantilesdocumented in this section are confirmed, and thus robust to the estimation method employed.
21

received preschool (or infant) education. If our results are not driven by residual selection, we should
detect zero effects on any outcome which is predetermined with respect to participation in PQM.18
7.1 Specification test using variability across school subjects
The top panel of Table 10 reports estimates of βM , βI and δ for the three groups of schools. As we have
discussed is Section 5, these parameters can be obtained from knowledge of the parameters in Table
8. If sezione fixed effects are able to span unobserved characteristics which in Table 10 are modelled
through class fixed effects, the quantities βM − (βMM − βIM ), βI − (βMI − βII ) and δ − (δM − δI) should
all be zero. Estimates of these quantities are reported in the bottom panel of Table 10, along with
p-values for the test of significance calculated using bootstrap according to the following procedure.
For each pseudo-sample, we estimated equation (1) for both mathematics and Italian language test
scores, as well as equation (2). The following quantities were then computed:
βM − (βMM − βIM ), βI − (βMI − βII ), δ − (δM − δI),
for which standard errors were obtained from 500 simulations (clustering by schools).
We find that none of the quantities considered is significantly different from zero at the conventional
level, which supports the hypothesis that sezione fixed effects have the same informational contents
as class fixed effects.
7.2 Specification test using test scores for fifth graders
The assumption needed for our identification strategy to work is that, in the absence of PQM, test
scores in all classes would have presented parallel trends. As we have discussed in Section 3.3, we
provide evidence on the validity of this assumption by looking at test scores for fifth graders. As
the sixth grade is the first year at lower secondary school, we need to establish a link between PQM
schools in our sample and primary schools of Objective 1 areas.
To this end, we proceed according to the following steps. First, we consider the municipality
where the PQM school is located, and group all primary schools of that municipality. We do so
because the transition from primary school (fifth grade) to lower secondary school (sixth grade) in
Italy is characterised by very limited geographic mobility of students, and in many cases both school
grades are offered within the same institute in contiguous buildings. This means that many of the
18As an additional sensitivity check, we repeated the main analysis selecting only PQM schools with two sixth gradeclasses. For these schools the selection process is simplified, as all students must be enrolled in afternoon activities.However, precision is precluded by the small sample size that results from this selection, as only 44 schools out of 248 inour sample have two classes (this before stratifying for tertiles). We thus decided not to rely on such sensitivity analysis,and focus on the three dimensions reported in what follows.
22

students who complete primary education in June, end up enrolled in sixth grade at the same school
in September.
Second, we classify PQM municipalities depending on the number of lower secondary schools en-
rolled in PQM. We consider four alternative definitions as a sensitivity check for our conclusions. The
first definition imposes that a PQM municipality must have all lower secondary schools enrolled in
PQM from 2010/11. Clearly, this definition may be too restrictive as - for example - larger municipal-
ities are most likely excluded because they have a larger number of schools. The additional definitions
are less restrictive, and impose that PQM municipalities must have at least 40 and 70 percent of lower
secondary schools enrolled in PQM from 2010/11. The last definition that we employ is the least
restrictive, and labels PQM municipalities as those where at least one school is involved in PQM from
2010/11.
Third, we collapse data at the municipality level, and compute average test scores for students
enrolled in fifth grade at primary school. We then compare the time series of test scores for fifth graders
in PQM municipalities to that of fifth graders in non-PQM municipalities. Figure 4 presents the times
series of fifth graders for the four definitions of PQM municipality adopted. We present results only
for standardised tests in mathematics, as the analysis yielded similar conclusions for Italian language.
Regardless of the definition adopted, the time series for fifth graders present remarkably similar trends
over time, thus corroborating the assumption needed for identification. Under the assumptions stated,
we can conclude that sixth grade students in PQM areas have competencies at entrance that are similar
to those of students in other municipalities that in the main analysis are used as controls.
7.3 Placebo regressions using pre-determined outcomes
Our data contain self-reported information on preschool attendance (before age 3). We computed the
percentage of students in the class who attended preschool, and ran the same specification (1) used
for the main analysis. Results from this test are presented in Table 11. We find that having been
assigned to a PQM class has no effect on this variable.
8 Conclusions
This paper has provided evidence on the effectiveness of mandating students from low achieving schools
in Southern Italy to extra instruction time in mathematics and Italian language. We have investigated
the effects of the Quality and Merit Project (PQM), which is still implemented in Objective 1 regions
through EU Regional Development Funds and EU Social Funds. We have found that the role of PQM
teachers and increased instruction time through afternoon activities is important only in the most
23

problematic learning environments. In our setting, these are represented by schools in the bottom
tertile of the distribution of performance in the pre-programme period. They enrol students from less
advantaged socio-economic backgrounds, for whom the negative effects on learning may be offset by
the additional time spent on compulsory afternoon activities.
We have found that only test scores in mathematics are affected, and estimate a positive, large
effect of about 0.25 points of standard deviation. In line with the objectives of the intervention, we
have shown that this result follows from an improvement in quantitative reasoning, rather than in
mathematical knowledge. This result is consistent with other studies in the literature showing that it
is much harder to intervene on reading and comprehension skills, rather than on skills involving a lot
of exercise and practice (Sims, 2008). Probably, as it is documented in previous works that considers
the impact of early interventions on children outcomes, in order to affect reading skills and language
test scores we should target younger children, during elementary or pre-schools.
We have concluded that the first order effects of being assigned to individualised activities are more
important than those arising from the duration of exposure. We also have found that the positive
effect of PQM in the most critical schools conceals a good deal of variability within the class. We
have shown that the effect is driven by a large, positive shift to the distribution of test scores, but
that a sizeable group at the bottom end of the distribution is left unaffected by the intervention.
This finding is consistent with observing large returns only for the best students in the class, that
we have estimated at 0.4 points of standard deviation. As in other studies that have investigated
similar interventions - see, for example, Lavy and Schlosser (2005) and Banerjee et al. (2007) - we
have found that only the least advantaged students are those with positive returns to participation.
However, we have documented a non-negligible heterogeneity across students in this group, with those
at the bottom end of the ability distribution falling behind and not catching up to their peers after
the intervention.
We have found that extra activities organised only around Italian language do not yield a significant
improvement in test scores. If anything, our results point to negative returns to such activities for
the best students in mathematics. The results in this paper imply that EU Regional Development
Funds and EU Social Funds used to roll out education policies in the most deprived areas must tailor
effective strategies around the students most in need to avoid important deadweight loss.
24

References
L.S. Aiken, S.G. West, D.E. Schwalm, J.L. Carroll, and S. Hsiung. Comparison of a randomized and
two quasi-experimental designs in a single outcome evaluation. Evaluation Review, 22(2):207–244,
1998.
S. Athey and G.W. Imbens. Identification and inference in nonlinear difference-in-difference models.
Econometrica, 74(2):431–497, 2006.
A. V. Banerjee, S. Cole, E. Duflo, and L. Linden. Remedying education: Evidence from two randomized
experiments in india. The Quarterly Journal of Economics, 122(3):1235–1264, 2007.
C. Bellei. Does lengthening the school day increase students academic achievement? results from a
natural experiment in chile. Economics of Education Review, 28(5):629–640, 2009.
E.P. Bettinger and B.T. Long. Addressing the needs of underprepared students in higher education.
Journal of Human Resources, 44(3):736–771, 2009.
J.C. Calcagno and B.T. Long. The impact of postsecondary remediation using a regression discon-
tinuity approach: Addressing endogenous sorting and noncompliance. Technical report, National
Bureau of Economic Research, 2008.
A. Checkoway, B. Boulay, B. Gamse, M. Caven, L. Fox, K. Kliorys, R. Luck, K. Maree, M. Velez,
M. Woodford, et al. Evaluation of the expanded learning time initiative. year four integrated report:
2009-10. 2011.
P. DeCicca. Does full-day kindergarten matter? evidence from the first two years of schooling.
Economics of Education Review, 26(1):67–82, 2007.
M. Dynarski, S. James-Burdumy, M. Moore, L. Rosenberg, J. Deke, W. Mansfield, et al. When schools
stay open late: The national evaluation of the 21st century community learning centers program:
New findings. Report submitted to the US Department of Education, National Center for Education
Evaluation and Regional Assistance. Washington, DC: US Government Printing Office, 2004.
P. Falzetti, L. Palmerio, B. Romano, and D. Vidoni. Reducing the gap? the effects of eu funds for
improving education in southern italy. Vancouver, British Columbia, Canada, 2012. AERA Annual
meeting.
S. Firpo, N.M. Fortin, and T. Lemieux. Unconditional quantile regressions. Econometrica, 77(3):
953–973, 2009.
25

C.H. Gibbs. Measuring the impact of full-day kindergarten: Experimental and quasi-experimental
evidence. Society for Research on Educational Effectiveness, 2010.
J.B. Grossman, C.L. Sipe, and Corporation for Public/Private Ventures. Summer Training and Edu-
cation Program (STEP): Report on long-term impacts. Public/Private Ventures, 1992.
B. Hansen. School year length and student performance: Quasi-experimental evidence. Unpublished
manuscript. University of California, Santa Barbara, 2008.
T. Havnes and M. Mogstad. Is universal child care leveling the playing field?: Evidence from non-linear
difference-in-differences. IZA Discussion paper, 2010.
INVALSI. Le competenze in lettura, matematica e scienze degli studenti quindicenni italiani. rapporto
nazionale pisa 2009. Technical report, INVALSI, 2010a.
INVALSI. Servizio nazionale di valutazione 2010-11. le rilevazioni degli apprendimenti a.s. 2010-11.
Technical report, INVALSI, 2010b.
L. Lang, J. Torgesen, W. Vogel, C. Chanter, E. Lefsky, and Y. Petscher. Exploring the relative
effectiveness of reading interventions for high school students. Journal of Research on Educational
Effectiveness, 2(2):149–175, 2009.
A. Lash, S. Bae, V. Barrat, E. Burr, and T. Fong. Full-day kindergarten and student achievement: A
literature review. Technical report, US Department of Education, REL West Technical Assistance
Response. Washington, DC, 2008.
V. Lavy. Do differences in schools instruction time explain international achievement gaps in math,
science, and reading? evidence from developed and developing countries. Technical report, National
Bureau of Economic Research, 2010.
V. Lavy. Expanding school resources and increasing time on task: Effects of a policy experiment
in israel on student academic achievement and behavior. Technical report, National Bureau of
Economic Research, 2012.
V. Lavy and A. Schlosser. Targeted remedial education for underperforming teenagers: Costs and
benefits. Journal of Labor Economics, 23(4), 2005.
J.W. Lee and R.J. Barro. Schooling quality in a cross–section of countries. Economica, 68(272):
465–488, 2001.
26

P. Mandel and B. Sussmuth. Total instructional time exposure and student achievement: An extreme
bounds analysis based on german state-level variation. CESifo Working Paper Series, 2011.
D.E. Marcotte. Schooling and test scores: A mother-natural experiment. Economics of Education
Review, 26(5):629–640, 2007.
D.E. Marcotte and S.W. Hemelt. Unscheduled school closings and student performance. Education
Finance and Policy, 3(3):316–338, 2008.
E. Meyer and C. Van Klaveren. Evaluation of an extended day program in the netherlands: A
randomized field experiment. TIER Working Papers, 2011.
J.S. Pischke. The impact of length of the school year on student performance and earnings: evidence
from the german short school year. Economic Journal, 117:1216–1242, 2007.
K.B. Robin, E.C. Frede, and W.S. Barnett. Is more better? the effects of full-day vs half-day preschool
on early school achievement. 2006.
D.P. Sims. Strategic responses to school accountability measures: It’s all in the timing. Economics of
Education Review, 27(1):58–68, 2008.
L. Woßmann. Schooling resources, educational institutions and student performance: the international
evidence. Oxford Bulletin of Economics and Statistics, 65(2):117–170, 2003.
R. Zimmer, L. Hamilton, and R. Christina. After-school tutoring in the context of no child left behind:
Effectiveness of two programs in the pittsburgh public schools. Economics of education Review, 29
(1):18–28, 2010.
27

Table 1: Sample size (schools, classes and students)
Pre treatment year Post treatment year
Schools Enrolled in PQM 134 134Used as control 114 114
Classes Enrolled in PQM 313 313Used as controls in PQM schools 407 407Used as controls in remaining schools 595 595
Students Enrolled in PQM 6,228 6,461Used as controls in PQM schools 8,260 8,380Used as controls in remaining schools 12,455 12,672
Note. Presented are number of students, classes and schools in the working sample (see Section 3.2 for details).
Table 2: Descriptive statistics (schools enrolled in PQM and matched control schools)
(1) (2) (3) (4)PQM Control Difference Score
% of correct answers in mathematics 0.480 0.489 -0.009 1.418(0.010) (2.861)
% of correct answers in Italian language 0.572 0.584 -0.012 -4.010(0.008) (3.639)
% of permanent teachers 0.892 0.904 -0.012 -0.341(0.012) (1.612)
Student to teacher ratio 9.632 9.931 -0.299 -0.098(0.275) (0.099)
Number of students 402.8 398.4 4.470 0.001(26.34) (0.001)
% of female students 0.490 0.488 0.002 0.589(0.007) (2.385)
% of foreign students 0.027 0.027 0.000 1.088(0.003) (5.101)
% of students with disabilities 0.034 0.031 0.003 2.652(0.003) (8.669)
% of repeating students 0.048 0.041 0.007 4.105(0.006) (4.182)
% received EU funds 0.963 0.974 -0.011 -0.273(0.023) (0.769)
Municipality located on mountains 0.284 0.246 0.038 0.186(0.056) (0.306)
(Log) population in town 10.38 10.31 0.069 0.008(0.192) (0.110)
Number of schools 134 114
Note. Presented are descriptive statistics for schools in the working sample (pre-programme data only). Column (1):
schools enrolled; column (2): control schools; column (3): difference between column (1) and column (2) - standard
deviation in parentheses; column (4): logit regression for being a PQM school (standard errors in parentheses).
28
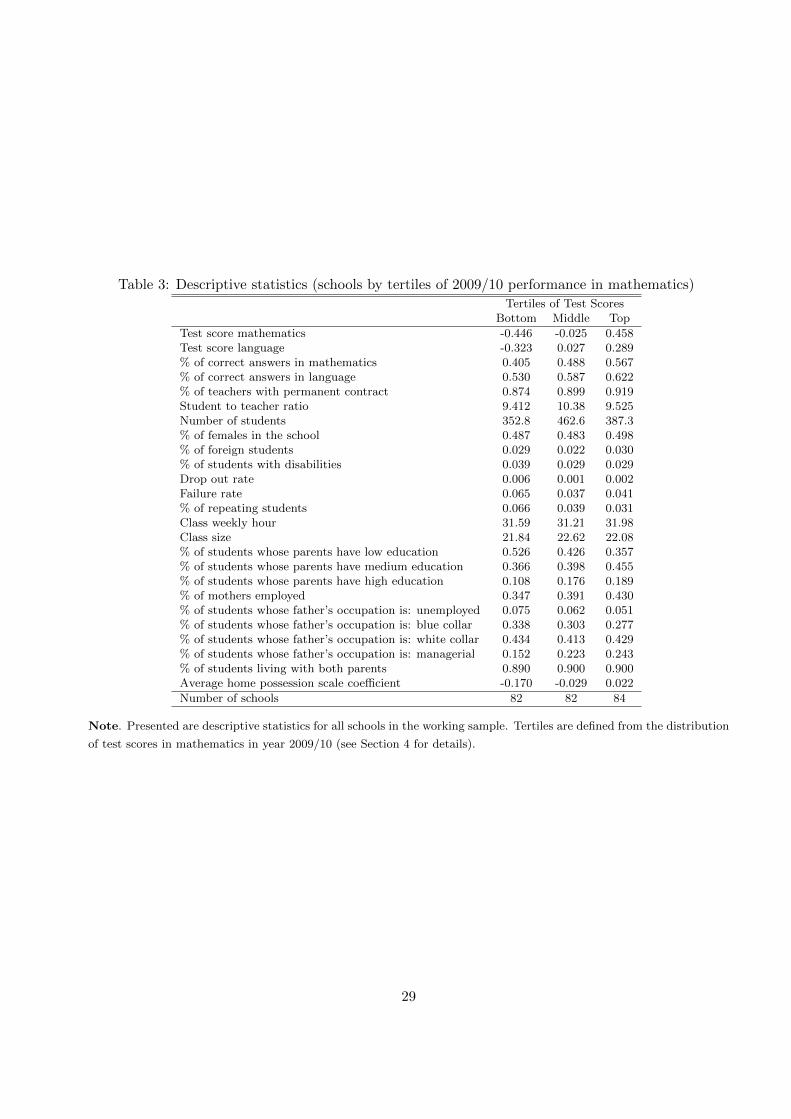
Table 3: Descriptive statistics (schools by tertiles of 2009/10 performance in mathematics)
Tertiles of Test ScoresBottom Middle Top
Test score mathematics -0.446 -0.025 0.458Test score language -0.323 0.027 0.289% of correct answers in mathematics 0.405 0.488 0.567% of correct answers in language 0.530 0.587 0.622% of teachers with permanent contract 0.874 0.899 0.919Student to teacher ratio 9.412 10.38 9.525Number of students 352.8 462.6 387.3% of females in the school 0.487 0.483 0.498% of foreign students 0.029 0.022 0.030% of students with disabilities 0.039 0.029 0.029Drop out rate 0.006 0.001 0.002Failure rate 0.065 0.037 0.041% of repeating students 0.066 0.039 0.031Class weekly hour 31.59 31.21 31.98Class size 21.84 22.62 22.08% of students whose parents have low education 0.526 0.426 0.357% of students whose parents have medium education 0.366 0.398 0.455% of students whose parents have high education 0.108 0.176 0.189% of mothers employed 0.347 0.391 0.430% of students whose father’s occupation is: unemployed 0.075 0.062 0.051% of students whose father’s occupation is: blue collar 0.338 0.303 0.277% of students whose father’s occupation is: white collar 0.434 0.413 0.429% of students whose father’s occupation is: managerial 0.152 0.223 0.243% of students living with both parents 0.890 0.900 0.900Average home possession scale coefficient -0.170 -0.029 0.022
Number of schools 82 82 84
Note. Presented are descriptive statistics for all schools in the working sample. Tertiles are defined from the distribution
of test scores in mathematics in year 2009/10 (see Section 4 for details).
29

Tab
le4:
Des
crip
tive
stat
isti
cs(w
ith
incl
ass
vari
abil
ity
inte
stsc
ore
s)
(1)
(2)
(3)
(4)
(5)
(6)
(7)
(8)
(9)
Math
emati
cs
Bott
om
Ter
tile
Mid
dle
Ter
tile
Top
tert
ile
(a)
(a*sd
)(1
0%
)(5
0%
)(9
0%
)(1
0%
)(5
0%
)(9
0%
)(1
0%
)(5
0%
)(9
0%
)
-1.1
00
-1.0
82
0.5
71
0.8
10
0.9
47
0.8
33
0.9
13
1.0
00
0.8
33
0.9
60
1.0
00
-0.8
00
-0.7
87
0.3
52
0.6
32
0.8
51
0.6
67
0.8
00
0.9
55
0.6
67
0.9
05
1.0
00
-0.5
00
-0.4
92
0.1
76
0.4
38
0.7
14
0.5
20
0.6
67
0.8
89
0.5
20
0.8
26
1.0
00
-0.2
00
-0.1
97
0.0
94
0.3
04
0.5
74
0.3
52
0.5
21
0.8
10
0.3
52
0.7
11
0.9
60
0.0
00
0.0
00
0.0
48
0.2
17
0.5
00
0.2
72
0.4
17
0.7
22
0.2
72
0.6
35
0.9
50
0.2
00
0.1
97
0.0
00
0.1
58
0.4
12
0.1
99
0.3
21
0.6
31
0.1
99
0.5
61
0.9
13
0.5
00
0.4
92
0.0
00
0.1
00
0.3
00
0.1
11
0.2
27
0.5
29
0.1
11
0.4
26
0.8
57
0.8
00
0.7
87
0.0
00
0.0
53
0.2
18
0.0
50
0.1
58
0.4
14
0.0
50
0.2
97
0.7
14
1.1
00
1.0
82
0.0
00
0.0
00
0.1
31
0.0
00
0.1
00
0.2
86
0.0
00
0.2
17
0.6
32
Italian
language
Bott
om
Ter
tile
Mid
dle
Ter
tile
Top
tert
ile
(a)
(a*sd
)(1
0%
)(5
0%
)(9
0%
)(1
0%
)(5
0%
)(9
0%
)(1
0%
)(5
0%
)(9
0%
)
-1.1
00
-1.0
88
0.5
61
0.8
00
0.9
55
0.7
86
0.9
09
1.0
00
0.7
86
0.9
50
1.0
00
-0.8
00
-0.7
91
0.4
11
0.6
80
0.8
89
0.6
67
0.8
33
0.9
55
0.6
67
0.8
95
1.0
00
-0.5
00
-0.4
95
0.2
94
0.5
45
0.8
08
0.5
29
0.7
14
0.9
13
0.5
29
0.8
18
1.0
00
-0.2
00
-0.1
98
0.1
67
0.4
09
0.6
97
0.4
12
0.6
00
0.8
33
0.4
12
0.7
20
0.9
23
0.0
00
0.0
00
0.1
00
0.3
33
0.6
19
0.3
15
0.5
00
0.7
83
0.3
15
0.6
25
0.8
95
0.2
00
0.1
98
0.0
56
0.2
67
0.5
26
0.2
40
0.4
10
0.7
00
0.2
40
0.5
44
0.8
40
0.5
00
0.4
95
0.0
00
0.1
67
0.4
01
0.1
36
0.2
92
0.5
62
0.1
36
0.4
17
0.7
51
0.8
00
0.7
91
0.0
00
0.0
91
0.2
73
0.0
55
0.1
84
0.4
17
0.0
55
0.2
92
0.6
20
1.1
00
1.0
88
0.0
00
0.0
48
0.1
90
0.0
00
0.1
11
0.3
08
0.0
00
0.1
67
0.4
76
Note
.P
erce
nta
ge
of
studen
tsin
the
class
scori
ng
ab
ove
ace
rtain
thre
shold
,th
isb
eing
defi
ned
from
agri
dbase
don
the
standard
dev
iati
on
of
the
score
inth
epre
-
pro
gra
mm
eyea
r(f
rom
−1.1
tim
esth
est
andard
dev
iati
on
to1.1
tim
esth
est
andard
dev
iati
on).
Rep
ort
edare
the
10-t
h,
50-t
hand
90-t
hp
erce
nti
les
of
this
quanti
ty
acr
oss
class
es,
by
school
gro
up.
For
exam
ple
,th
efirs
tra
wst
ate
sth
at,
for
schools
inth
eb
ott
om
tert
ile,
in50
per
cent
of
class
es81
per
cent
of
studen
tssc
ore
ab
ove−
1.1
tim
esth
est
andard
dev
iati
on
of
the
score
inm
ath
emati
csin
the
pre
-pro
gra
mm
eyea
r.
30

Table 5: Descriptive statistics (changes over time in test score)
Mathematics LanguageBottom tertile Pre Post Change Pre Post ChangeControl class in control schools -0.482 -0.324 0.158 -0.417 -0.227 0.190Control class in PQM schools -0.450 -0.257 0.193 -0.319 -0.192 0.127Any extra class in language -0.435 -0.307 0.128 -0.267 -0.106 0.161Any extra class in mathematics -0.455 -0.014 0.441 -0.480 -0.243 0.237
Mathematics LanguageMiddle tertile Pre Post Change Pre Post ChangeControl class in control schools -0.042 0.040 0.082 0.055 0.120 0.065Control class in PQM schools -0.052 -0.060 -0.008 0.008 0.007 -0.001Any extra class in language 0.062 -0.009 -0.071 -0.013 0.100 0.113Any extra class in mathematics -0.018 0.094 0.112 -0.107 0.019 0.126
Mathematics LanguageTop tertile Pre Post Change Pre Post ChangeControl class in control schools 0.390 0.233 -0.157 0.297 0.216 -0.081Control class in PQM schools 0.367 0.208 -0.159 0.319 0.169 -0.150Any extra class in language 0.520 0.260 -0.260 0.340 0.289 -0.051Any extra class in mathematics 0.452 0.221 -0.231 0.220 0.168 -0.052
Note. Reported are average test scores by group calculated for 2009/10 (pre-programme) and 2010/11 (post-programme)
data. Reported also is the change over time of test scores. Test scores have been standardised in each year. Schools are
grouped into tertiles defined from the average test score in mathematics in year 2009/10 (See Section 4 for details).
31

Table 6: Descriptive statistics (variability of test scores explained by sezione)
A: % of variance explained by school, sezione and class (pooled 2009/10 and 2010/11 data)School Class Residual
Mathematics 0.113 0.230 0.678Italian Language 0.105 0.150 0.753
School Sezione ResidualMathematics 0.106 0.132 0.777Italian Language 0.099 0.090 0.814
B: Serial correlation of variables in the same sezione across yearsNull Model School FE School FE + controls
Test score mathematics 0.349 0.200 0.179(0.011) (0.014) (0.014)
Test score language 0.420 0.223 0.184(0.011) (0.014) (0.014)
Home possession coefficient 0.308 0.120 0.079(0.012) (0.014) (0.014)
% of foreign students 0.330 0.139 0.132(0.012) (0.014) (0.014)
Note. Panel A. Multilevel model that makes use of school and class membership (first raw), and school and sezione
membership (second raw); all sixth graders in the four PON regions are considered, excluding PQM schools. Panel B.
Regression of variables at time 2 (2010/11) on variable at time 1 (2009/10) in the same sezione (null model); including
school fixed effects (FE); and adding controls - see Section 4 for details.
Table 7: Descriptive statistics (alternative definitions of exposure to afternoon activities)
Bottom tertile Middle tertile Top Tertile
Mathematics
25th 0.130 0.175 0.162
50th 0.210 0.233 0.227Percentage change in instruction time Mean 0.213 0.245 0.227
75th 0.239 0.273 0.244
25th 17.14 23.04 21.43
50th 27.69 30.78 30.00Number of afternoon hours Mean 28.57 32.40 30.04
75th 31.50 35.99 32.14
Italian language
25th 0.089 0.103 0.090
50th 0.116 0.136 0.122Percentage change in instruction time Mean 0.126 0.133 0.122
75th 0.144 0.148 0.138
25th 20.49 23.68 20.77
50th 26.75 30.62 28.12Number of afternoon hours Mean 29.15 30.81 28.23
75th 33.25 34.09 31.88
Note. Presented are descriptive statistics for the two measures of exposure to afternoon classes in mathematics and
Italian language for the three groups of schools. See Section 4 for details. For 6 classes enrolled in PQM mathematics
and 6 classes enrolled in PQM Italian language we do not have information about the number of activities taken during
the afternoon; thus those classes are not used in computations.
32

Table 8: Effect of PQM on mathematics and Italian language (participation vis-a-vis non participation)
(1) (2) (3) (4) (5) (6)Bottom Middle Top Bottom Middle Toptertile tertile tertile tertile tertile tertile
Mathematics Italian languageAny extra class in mathematics 0.254 0.077 0.017 0.025 0.104 0.018
(0.109) (0.102) (0.097) (0.084) (0.073) (0.092)Any extra class in language 0.005 -0.059 -0.312 -0.095 0.061 -0.032
(0.084) (0.083) (0.137) (0.077) (0.079) (0.104)Control class in PQM schools 0.065 -0.035 -0.007 -0.042 -0.037 -0.066
(0.074) (0.062) (0.101) (0.067) (0.048) (0.091)
Mathematical reasoning Reading comprehensionAny extra class in mathematics 0.260 0.061 -0.023 0.022 0.122 -0.013
(0.090) (0.102) (0.115) (0.078) (0.074) (0.092)Any extra class in language 0.008 -0.067 -0.218 -0.087 0.073 -0.065
(0.080) (0.087) (0.142) (0.070) (0.071) (0.107)Control class in PQM schools 0.094 -0.057 0.009 -0.061 -0.031 -0.089
(0.076) (0.065) (0.109) (0.062) (0.051) (0.085)
Mathematical knowledge Grammar knowledgeAny extra class in mathematics 0.212 0.087 0.059 0.068 0.028 0.024
(0.123) (0.096) (0.083) (0.099) (0.088) (0.087)Any extra class in language 0.002 -0.036 -0.364 -0.028 0.017 0.035
(0.085) (0.078) (0.127) (0.087) (0.087) (0.099)Control class in PQM schools 0.020 -0.004 -0.025 -0.002 -0.064 -0.050
(0.071) (0.057) (0.086) (0.072) (0.048) (0.093)
Number of observations 774 1020 836 774 1020 836
Note. Difference-in-differences estimates of the effect of the intervention on mathematics and Italian language. The
first panel refers to gains in mathematics (left hand side column) and Italian language (right hand side column), which
comprise mathematical reasoning and reading comprehension (second panel) and mathematical knowledge and grammar
knowledge (third panel). Schools have been divided into three groups according to test scores in pre-treatment year as
explained in Section 4. Estimates are at the class level with sezione fixed effects. Standard errors clustered at the school
level in parentheses.
33

Tab
le9:
Eff
ect
ofP
QM
onm
ath
emat
ics
and
Ital
ian
lan
guag
e(I
nte
nsi
ty)
(1)
(2)
(3)
(4)
(5)
(6)
(7)
(8)
(9)
(10)
(11)
(12)
Bott
om
Ter
tile
Mid
dle
Ter
tile
Top
Ter
tile
Aver
age
25th
50th
75th
Aver
age
25th
50th
75th
Aver
age
25th
50th
75th
Math
emati
cs
Up
to30
hours
(math
emati
cs)
0.2
90
0.0
65
0.1
11
0.1
17
0.2
08
0.0
17
0.0
15
0.0
98
-0.0
71
-0.0
15
-0.0
31
-0.0
53
(0.1
41)
(0.0
52)
(0.0
54)
(0.0
51)
(0.1
21)
(0.0
40)
(0.0
72)
(0.0
44)
(0.1
31)
(0.0
27)
(0.0
46)
(0.0
62)
More
than
30
hours
(math
emati
cs)
-0.0
82
-0.0
41
0.0
41
0.0
17
0.2
34
-0.0
29
-0.0
21
-0.1
14
0.2
41
0.1
27
0.1
23
0.0
88
(0.2
24)
(0.0
71)
(0.0
95)
(0.0
87)
(0.1
93)
(0.0
62)
(0.1
06)
(0.0
74)
(0.1
64)
(0.0
47)
(0.0
72)
(0.0
80)
Up
to30
hours
(language)
0.0
22
0.0
41
0.0
18
0.0
08
0.0
05
0.0
07
0.0
01
-0.0
52
-0.3
05
-0.0
17
-0.1
16
-0.1
60
(0.1
01)
(0.0
40)
(0.0
43)
(0.0
40)
(0.1
24)
(0.0
41)
(0.0
59)
(0.0
47)
(0.1
61)
(0.0
35)
(0.0
59)
(0.0
66)
More
than
30
hours
(language)
-0.0
63
0.0
10
0.0
18
0.0
59
0.1
25
-0.0
78
-0.0
78
-0.0
04
-0.0
33
-0.0
69
0.0
04
0.0
33
(0.1
37)
(0.0
64)
(0.0
68)
(0.0
52)
(0.1
45)
(0.0
45)
(0.0
69)
(0.0
67)
(0.2
66)
(0.0
61)
(0.1
01)
(0.1
04)
Italian
language
Up
to30
hours
(math
emati
cs)
0.0
84
0.0
19
0.0
14
0.0
20
0.1
76
0.0
48
0.0
78
0.0
87
-0.0
32
0.0
04
-0.0
11
-0.0
42
(0.0
94)
(0.0
34)
(0.0
42)
(0.0
35)
(0.1
10)
(0.0
40)
(0.0
46)
(0.0
48)
(0.1
05)
(0.0
27)
(0.0
49)
(0.0
44)
More
than
30
hours
(math
emati
cs)
-0.1
56
-0.0
77
-0.0
09
0.0
13
0.1
46
-0.0
46
-0.1
19
-0.0
58
0.1
40
0.0
46
0.0
64
0.1
09
(0.1
79)
(0.0
94)
(0.0
78)
(0.0
48)
(0.1
22)
(0.0
43)
(0.0
57)
(0.0
59)
(0.1
63)
(0.0
43)
(0.0
76)
(0.0
76)
Up
to30
hours
(language)
-0.0
49
0.0
01
-0.0
19
-0.0
17
0.0
66
-0.0
03
0.0
37
0.0
28
-0.1
16
-0.0
412
-0.0
46
-0.0
35
(0.0
86)
(0.0
35)
(0.0
36)
(0.0
31)
(0.0
98)
(0.0
35)
(0.0
46)
(0.0
41)
(0.1
18)
(0.0
34)
(0.0
61)
(0.0
50)
More
than
30
hours
(language)
-0.1
38
-0.0
81
-0.0
72
-0.0
18
0.0
33
-0.0
11
-0.0
43
-0.0
02
0.2
59
0.0
90
0.1
59
0.0
64
(0.1
15)
(0.0
56)
(0.0
56)
(0.0
43)
(0.1
32)
(0.0
52)
(0.0
57)
(0.0
54)
(0.1
83)
(0.0
45)
(0.0
93)
(0.0
98)
Num
ber
of
obse
rvati
ons
768
768
768
768
1008
1008
1008
1008
830
830
830
830
Note
.D
iffer
ence
-in-d
iffer
ence
ses
tim
ate
sof
the
effec
tof
the
inte
rven
tion
on
math
emati
csand
Italian
language.
Est
imate
sare
at
the
class
level
wit
hsezione
fixed
effec
ts.
Sta
ndard
erro
rscl
ust
ered
at
the
school
level
inpare
nth
eses
.F
or
6cl
ass
esen
rolled
inP
QM
math
emati
csand
6cl
ass
esen
rolled
inP
QM
Italian
language
we
do
not
hav
e
info
rmati
on
ab
out
the
num
ber
of
act
ivit
ies
taken
duri
ng
the
aft
ernoon;
thus
those
class
esare
not
use
din
com
puta
tions
34

Table 10: Specification test using variability across school subjects (mathematics)
Bottom tertile Middle Tertile Top Tertile
βM 0.209 0.092 0.005(0.076) (0.068) (0.060)
βI -0.016 -0.018 -0.165(0.054) (0.046) (0.069)
δ 0.016 -0.021 -0.048(0.043) (0.047) (0.054)
βM − (βMM − βI
M ) -0.020 0.119 0.007(0.071) (0.066) (0.097)
βI − (βMI − βI
I ) -0.116 0.103 0.114(0.067) (0.058) (0.106)
δ − (δM − δI) -0.092 -0.024 -0.107(0.064) (0.052) (0.084)
Observations 774 1020 836
Note. Presented are estimation results for the parameters defined in Section 7, using scores for mat. The top panel
refers to equation (2); the bottom panel reports the difference of the parameters estimated in equations (2) and (1), with
the corresponding bootstrapped standard errors.
Table 11: Placebo regression using preschool education (before age 3)
Bottom tertile Middle tertile Top tertile
Any extra class in mathematics 0.025 -0.067 0.002(0.051) (0.071) (0.072)
Any extra class in language 0.066 0.018 -0.106(0.054) (0.058) (0.071)
Control class in PQM schools 0.089 0.051 0.075(0.067) (0.048) (0.030)
Note. The table reports results obtained as in the main analysis, using as outcome the percentage of students in the
class who attended pre school before age 3.
35

Figure 1: Effects on quantiles of test scores (between class variability).
Bottom tertile-.4
-.20
.2.4
Estim
ate
10 20 30 40 50 60 70 80 90Mathematics test score: percentile of the baseline distribution
-.4-.2
0.2
.4Es
timat
e
10 20 30 40 50 60 70 80 90Italian language test score: percentile of the baseline distribution
Middle tertile
-.4-.2
0.2
.4Es
timat
e
10 20 30 40 50 60 70 80 90Mathematics test score: percentile of the baseline distribution
-.4-.2
0.2
.4Es
timat
e
10 20 30 40 50 60 70 80 90Italian language test score: percentile of the baseline distribution
Top tertile
-.4-.2
0.2
.4Es
timat
e
10 20 30 40 50 60 70 80 90Mathematics test score: percentile of the baseline distribution
-.4-.2
0.2
.4Es
timat
e
10 20 30 40 50 60 70 80 90Italian language test score: percentile of the baseline distribution
Note. Effects of PQM across classes for test scores in mathematics (first column) and Italian language (second column),
together with 95% confidence intervals. Point estimates were derived by estimating equation (1), where the outcome
variable is a dummy for the class average score being above the percentile reported on the horizontal axis. Percentiles
were computed from pre-programme data. Confidence intervals were obtained using a normal approximation, standard
errors being clustered at the school level. See Section 5 for details.36

Figure 2: Effects on quantiles of test scores (within class variability)
Bottom tertile-.4
-.20
.2.4
Estim
ate
10 20 30 40 50 60 70 80 90Mathematics test score: Percentiles of the baseline distribution
-.4-.2
0.2
.4Es
timat
e
10 20 30 40 50 60 70 80 90Italian language test score: Percentiles of the baseline distribution
Middle tertile
-.4-.2
0.2
.4Es
timat
e
10 20 30 40 50 60 70 80 90Mathematics test score: Percentiles of the baseline distribution
-.4-.2
0.2
.4Es
timat
e
10 20 30 40 50 60 70 80 90Italian language test score: Percentiles of the baseline distribution
Top tertile
-.4-.2
0.2
.4Es
timat
e
10 20 30 40 50 60 70 80 90Mathematics test score: Percentiles of the baseline distribution
-.4-.2
0.2
.4Es
timat
e
10 20 30 40 50 60 70 80 90Italian language test score: Percentiles of the baseline distribution
Note. Effects of PQM within classes for test scores in mathematics (first column) and Italian language (second column),
together with 95% confidence intervals. Point estimates were derived by estimating equation (1), where the outcome
variables are a dummy for the class average score being above the percentile reported on the horizontal axis (first
column) and the percentage of students in the class above the percentile reported on the horizontal axis (second column).
Percentiles were computed from pre-programme data. Confidence intervals were obtained using a normal approximation,
standard errors being clustered at the school level. See Section 5 for details.37
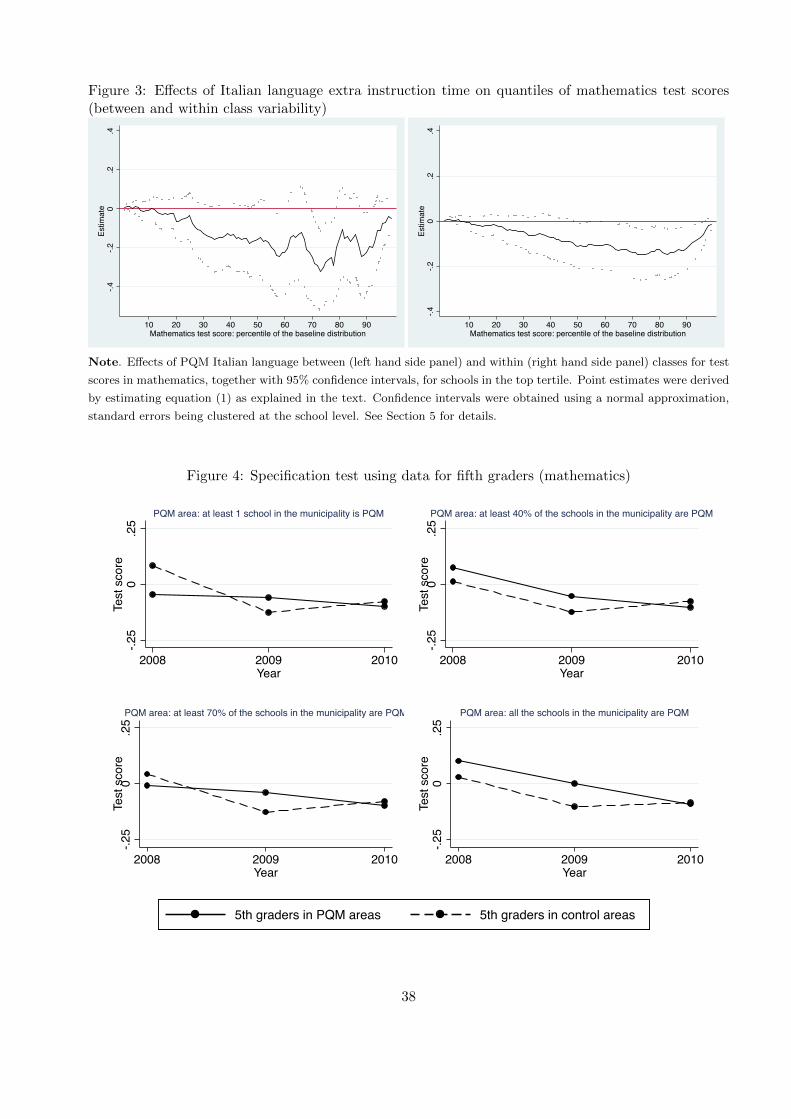
Figure 3: Effects of Italian language extra instruction time on quantiles of mathematics test scores(between and within class variability)
-.4-.2
0.2
.4Es
timat
e
10 20 30 40 50 60 70 80 90Mathematics test score: percentile of the baseline distribution
-.4-.2
0.2
.4Es
timat
e
10 20 30 40 50 60 70 80 90Mathematics test score: percentile of the baseline distribution
Note. Effects of PQM Italian language between (left hand side panel) and within (right hand side panel) classes for test
scores in mathematics, together with 95% confidence intervals, for schools in the top tertile. Point estimates were derived
by estimating equation (1) as explained in the text. Confidence intervals were obtained using a normal approximation,
standard errors being clustered at the school level. See Section 5 for details.
Figure 4: Specification test using data for fifth graders (mathematics)
-.25
0.2
5Te
st s
core
2008 2009 2010Year
PQM area: at least 1 school in the municipality is PQM
-.25
0.2
5Te
st s
core
2008 2009 2010Year
PQM area: at least 40% of the schools in the municipality are PQM
-.25
0.2
5Te
st s
core
2008 2009 2010Year
PQM area: at least 70% of the schools in the municipality are PQM
-.25
0.2
5Te
st s
core
2008 2009 2010Year
PQM area: all the schools in the municipality are PQM
5th graders in PQM areas 5th graders in control areas
38

Appendix A: Additional Results(for on-line publication)
39
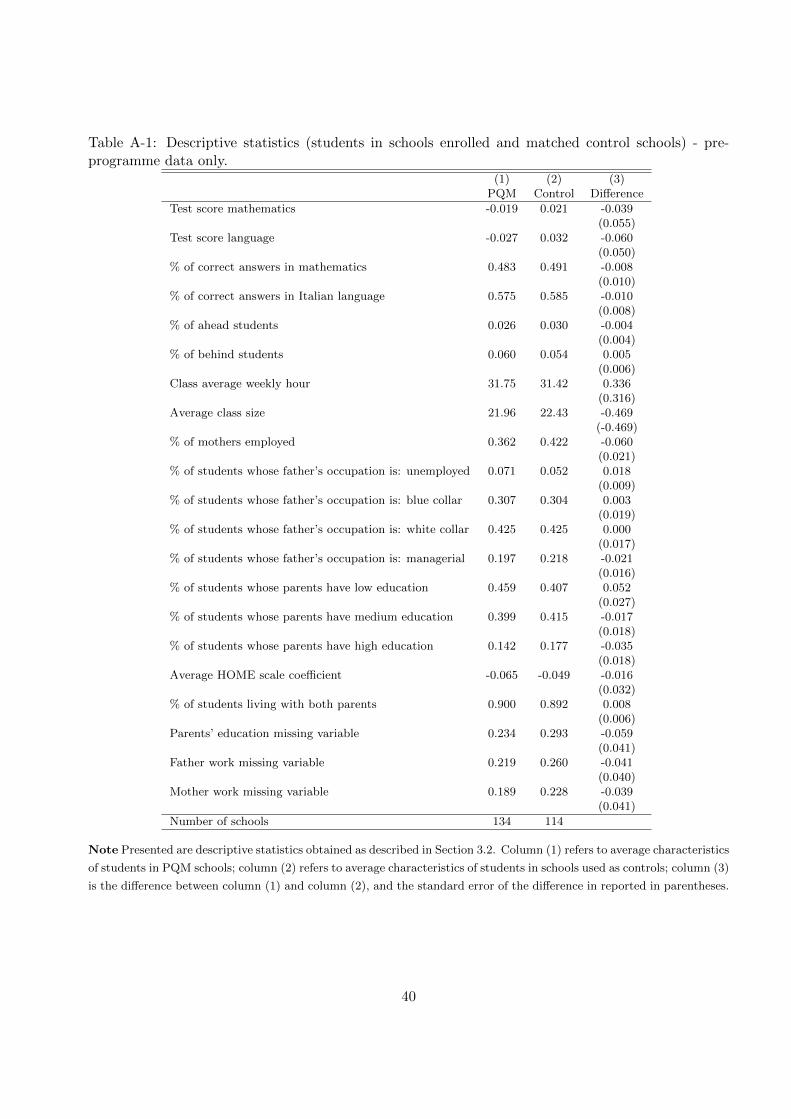
Table A-1: Descriptive statistics (students in schools enrolled and matched control schools) - pre-programme data only.
(1) (2) (3)PQM Control Difference
Test score mathematics -0.019 0.021 -0.039(0.055)
Test score language -0.027 0.032 -0.060(0.050)
% of correct answers in mathematics 0.483 0.491 -0.008(0.010)
% of correct answers in Italian language 0.575 0.585 -0.010(0.008)
% of ahead students 0.026 0.030 -0.004(0.004)
% of behind students 0.060 0.054 0.005(0.006)
Class average weekly hour 31.75 31.42 0.336(0.316)
Average class size 21.96 22.43 -0.469(-0.469)
% of mothers employed 0.362 0.422 -0.060(0.021)
% of students whose father’s occupation is: unemployed 0.071 0.052 0.018(0.009)
% of students whose father’s occupation is: blue collar 0.307 0.304 0.003(0.019)
% of students whose father’s occupation is: white collar 0.425 0.425 0.000(0.017)
% of students whose father’s occupation is: managerial 0.197 0.218 -0.021(0.016)
% of students whose parents have low education 0.459 0.407 0.052(0.027)
% of students whose parents have medium education 0.399 0.415 -0.017(0.018)
% of students whose parents have high education 0.142 0.177 -0.035(0.018)
Average HOME scale coefficient -0.065 -0.049 -0.016(0.032)
% of students living with both parents 0.900 0.892 0.008(0.006)
Parents’ education missing variable 0.234 0.293 -0.059(0.041)
Father work missing variable 0.219 0.260 -0.041(0.040)
Mother work missing variable 0.189 0.228 -0.039(0.041)
Number of schools 134 114
Note Presented are descriptive statistics obtained as described in Section 3.2. Column (1) refers to average characteristics
of students in PQM schools; column (2) refers to average characteristics of students in schools used as controls; column (3)
is the difference between column (1) and column (2), and the standard error of the difference in reported in parentheses.
40

Tab
leA
-2:
Des
crip
tive
stat
isti
cs(d
eter
min
ants
ofp
rogra
mm
ein
ten
sity
)
Bott
om
tert
ile
Mid
dle
tert
ile
Top
tert
ile
Math
emati
csL
anguage
Math
emati
csL
anguage
Math
emati
csL
anguage
INT
1IN
T2
INT
1IN
T2
INT
1IN
T2
INT
1IN
T2
INT
1IN
T2
INT
1IN
T2
Tes
tsc
ore
math
emati
cs-1
1.2
9-0
.085
0.1
33
0.0
02
5.5
51
0.0
45
1.9
19
0.0
06
1.0
45
0.0
21
4.0
26
0.0
03
(4.0
45)
(0.0
30)
(2.6
65)
(0.0
11)
(1.2
03)
(0.0
09)
(3.4
92)
(0.0
15)
(3.3
81)
(0.0
15)
(4.7
35)
(0.0
21)
Tes
tsc
ore
language
-3.7
45
-0.0
26
-2.6
09
-0.0
11
-3.1
80
-0.0
42
1.9
96
0.0
05
-1.0
75
-0.0
22
-4.0
21
0.0
17
(4.5
46)
(0.0
34)
(3.2
78)
(0.0
14)
(2.8
39)
(0.0
15)
(2.9
83)
(0.0
12)
(3.6
27)
(0.0
17)
(7.8
80)
(0.0
35)
%of
fem
ale
studen
ts0.4
42
0.0
08
-1.1
48
-0.0
06
4.8
01
0.0
32
-6.0
12
-0.0
27
-4.9
49
-0.0
85
-2.6
95
-0.0
25
(9.1
67)
(0.0
69)
(5.8
49)
(0.0
25)
(5.6
11)
(0.0
41)
(8.6
13)
(0.0
36)
(13.0
18)
(0.0
62)
(13.4
0)
(0.0
61)
%of
ahea
dst
uden
ts0.8
06
-0.0
07
7.2
44
0.0
23
25.7
30.1
35
-18.8
3-0
.070
-45.0
6-0
.517
-37.1
1-0
.007
(23.9
9)
(0.1
85)
(19.0
6)
(0.0
78)
(27.7
0)
(0.1
78)
(26.0
3)
(0.1
15)
(63.1
3)
(0.2
84)
(43.1
7)
(0.1
93)
%of
beh
ind
studen
ts-1
0.4
4-0
.067
6.7
61
0.0
31
-3.8
24
-0.0
21
38.5
60.1
21
-46.7
7-0
.149
-54.7
60.0
72
(23.6
6)
(0.1
77)
(8.7
05)
(0.0
37)
(13.5
0)
(0.0
84)
(18.0
1)
(0.0
77)
(49.0
0)
(0.2
33)
(28.8
8)
(0.1
39)
%of
fore
ign
studen
ts-7
6.9
0-0
.558
4.8
39
0.0
18
-30.5
9-0
.078
65.4
10.2
97
30.7
80.1
83
-56.0
5-0
.239
(32.8
5)
(0.2
50)
(16.5
1)
(0.0
69)
(19.1
9)
(0.1
18)
(32.4
9)
(0.1
41)
(35.3
4)
(0.1
60)
(33.4
1)
(0.1
55)
Cla
sssi
ze-0
.325
-0.0
02
-0.6
77
-0.0
03
-1.1
76
-0.0
07
-0.5
42
-0.0
02
-1.6
57
-0.0
07
-2.0
84
-0.0
09
(0.6
78)
(0.0
05)
(0.3
91)
(0.0
02)
(0.2
79)
(0.0
02)
(0.4
71)
(0.0
02)
(0.5
15)
(0.0
02)
(0.6
81)
(0.0
03)
Cla
ssw
eekly
hour
-1.2
34
-0.0
09
-0.3
45
-0.0
01
--
-0.6
15
-0.0
03
-2.0
61
-0.0
10
0.6
01
0.0
01
(1.0
48)
(0.0
08)
(0.5
65)
(0.0
02)
--
(0.9
14)
(0.0
04)
(2.3
86)
(0.0
11)
(0.7
30)
(0.0
03)
Const
ant
72.5
50.5
25
52.3
40.2
24
-1119
-2.6
10
2314
10.5
0134.3
80.7
29
61.5
00.3
07
(35.5
9)
(0.2
69)
(23.4
1)
(0.0
99)
(733.0
)(4
.494)
(1102)
(4.7
62)
(80.7
3)
(0.3
61)
(32.7
7)
(0.1
39)
Obse
rvati
ons
61
61
76
76
52
52
58
58
47
47
46
46
Note
.P
rese
nte
dare
esti
mate
sobta
ined
by
regre
ssin
gin
tensi
tyin
math
emati
csand
language
at
tim
e2
(2010/11)
on
inputs
inth
esa
mesezione
at
tim
e1
(2009/10).
Est
imate
sare
at
thesezione
level
wit
hsc
hool
fixed
effec
ts.
Only
PQ
Msezioni
hav
eb
een
kep
t.IN
T1
repre
sents
the
num
ber
of
aft
ernoon
hours
inea
chsu
bje
ct;
INT
2
repre
sents
the
per
centa
ge
change
inin
stru
ctio
nin
each
sub
ject
(see
Sec
tion
3.2
for
det
ails)
.Sch
ools
are
div
ided
into
tert
iles
defi
ned
from
the
aver
age
test
score
in
math
emati
csin
yea
r2009/10
(see
Sec
ion
3.2
for
det
ails.
).
41

Figure A-1: Weight assigned to each question in Mathematics (“reasoning” and “knowing”) andLanguage (“reading” and “grammar”) domains
Mathematics
12
34
56
78
910
1112
0 10 20 30 40Year 2009/10
Reasoning Knowing
12
34
56
78
910
1112
0 10 20 30 40Year 2010/11
Reasoning Knowing
Language
12
34
56
7
0 20 40 60 80Year 2009/10
Reading Comprehension Grammar
12
34
56
7
0 20 40 60 80Year 2010/11
Reading Comprehension Grammar
42
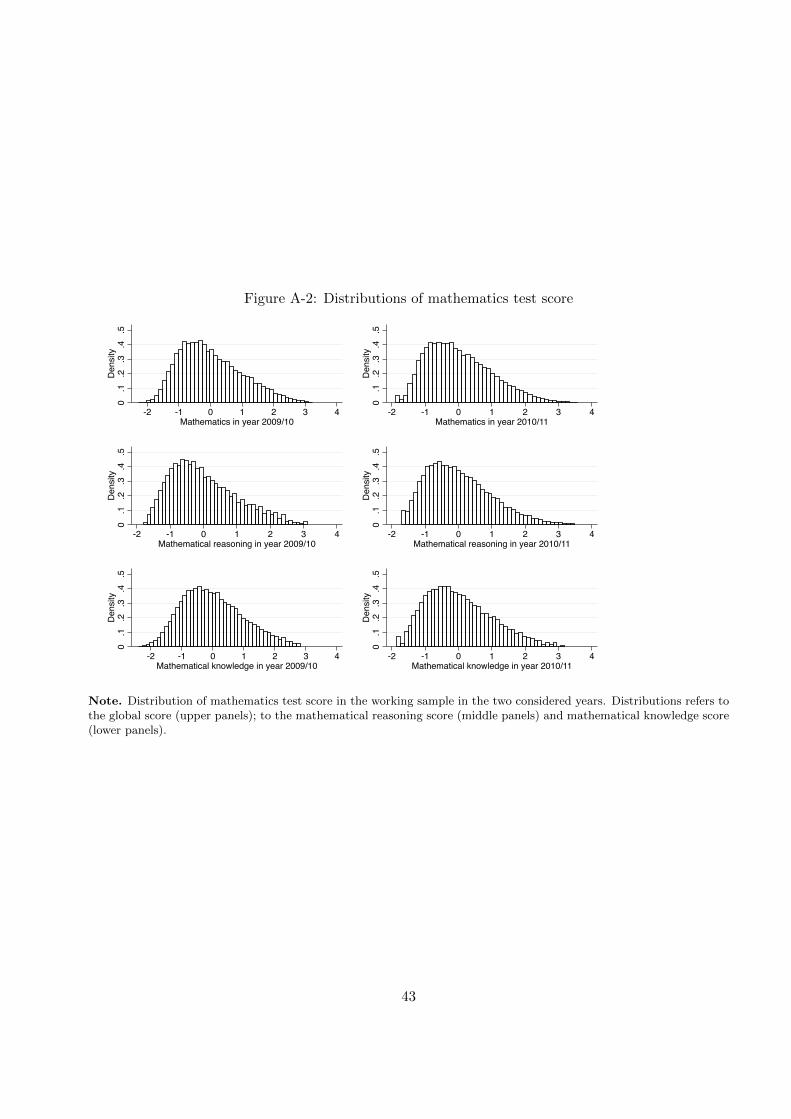
Figure A-2: Distributions of mathematics test score
0.1
.2.3
.4.5
Den
sity
-2 -1 0 1 2 3 4Mathematics in year 2009/10
0.1
.2.3
.4.5
Den
sity
-2 -1 0 1 2 3 4Mathematics in year 2010/11
0.1
.2.3
.4.5
Den
sity
-2 -1 0 1 2 3 4Mathematical reasoning in year 2009/10
0.1
.2.3
.4.5
Den
sity
-2 -1 0 1 2 3 4Mathematical reasoning in year 2010/11
0.1
.2.3
.4.5
Den
sity
-2 -1 0 1 2 3 4Mathematical knowledge in year 2009/10
0.1
.2.3
.4.5
Den
sity
-2 -1 0 1 2 3 4Mathematical knowledge in year 2010/11
Note. Distribution of mathematics test score in the working sample in the two considered years. Distributions refers tothe global score (upper panels); to the mathematical reasoning score (middle panels) and mathematical knowledge score(lower panels).
43

Figure A-3: Distributions of Italian language test score
0.1
.2.3
.4.5
Den
sity
-4 -3 -2 -1 0 1 2 3 4Italian language in year 2009/10
0.1
.2.3
.4.5
Den
sity
-4 -3 -2 -1 0 1 2 3 4Italian language in year 2010/11
0.1
.2.3
.4.5
Den
sity
-4 -3 -2 -1 0 1 2 3 4Reading comprehension in year 2009/10
0.1
.2.3
.4.5
Den
sity
-4 -3 -2 -1 0 1 2 3 4Reading comprehension in year 2010/11
0.1
.2.3
.4.5
Den
sity
-4 -3 -2 -1 0 1 2 3 4Grammatical knowledge in year 2009/10
0.1
.2.3
.4.5
Den
sity
-4 -3 -2 -1 0 1 2 3 4Grammatical knowledge in year 2010/11
Note. Distribution of Italian language test score in the working sample in the two considered years. Distributions refersto the global score (upper panels); to the reading and comprehension score (middle panels) and grammatical knowledgescore (lower panels).
Figure A-4: Number and location of PQM and control schools in the different municipalities of thefour Objective 1 regions
More than 443210
Number of PQM schoolsMore than 443210
Number of control schools
44

Figure A-5: Distribution of class average standardised test scores, mathematics and Italian languagein 2009/10
0.2
.4.6
.8D
ensi
ty
-3 -2 -1 0 1 2 3Class average standardised test score in in Mathematics 2009/10
0.2
.4.6
.8D
ensi
ty
-3 -2 -1 0 1 2 3Class average standardised test score in Italian language in 2009/10
Note. Distribution class average test scores (standardised) in mathematics (left panel) and Italian language (rightpanel). Distributions refer to the working sample. Lines correspond to the 10th, 25th, 50th, 75th, 90th percentile of thedistribution.
45