shoreline video assessment (s -vam)
TRANSCRIPT

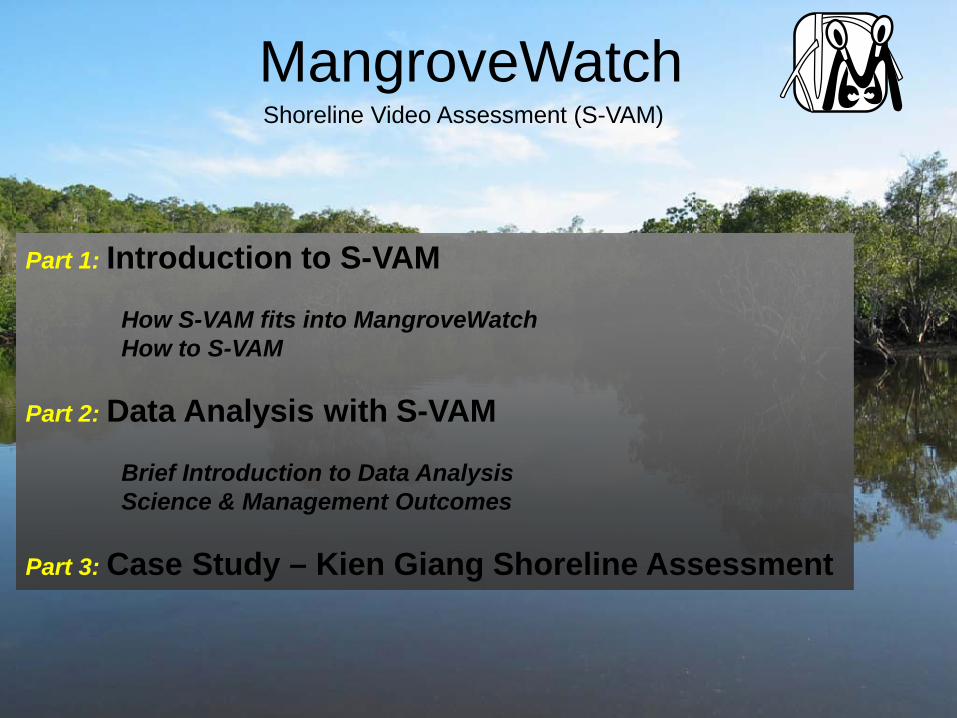
MangroveWatch Shoreline Video Assessment (S-VAM)
Jock Mackenzie & Norm Duke CoDirector – MangroveWatch Ltd. Mangrove Hub Coordinator - JCU www.mangrovewatch.org.au [email protected]
MangroveWatch Shoreline Video Assessment (S-VAM)
Part 1: Introduction to S-VAM How S-VAM fits into MangroveWatch How to S-VAM Part 2: Data Analysis with S-VAM Brief Introduction to Data Analysis Science & Management Outcomes Part 3: Case Study – Kien Giang Shoreline Assessment

A Mangrove Monitoring Strategy that is
Community driven, Scientifically validated
With Practical outcomes for management
What is MangroveWatch?
Assessing Change Identifying Threats
Empowering Communities
Enhancing scientific knowledge
Informing management solutions
Protecting tidal wetlands
Protecting coastal resources
Informing communities
Gauging management success

Shoreline Video Assessment Method (SVAM)
Continuous Georeferenced Digital
Video Image Recording &
Criteria Based Image Analysis

MangroveWatch – your 6 step cycle
Step 2: Film shoreline
Step 3: Track position
Step 4: Send video and GPS track to mangrove experts
Step 5: Repeat Steps 1 to 4 - every 6 months
Step 6: Feedback on your mangroves health will be sent
back to you
Step 1: Select area of mangroves or
shoreline to monitor
Training & support from mangrove
experts
Data assessment by mangrove
experts
Data collection by you

How does MangroveWatch & S-VAM work?
Community Education & Training
Community Data Collection
No prior mangrove knowledge required.
2x surveys per year
(wet/dry season)
2x Workshops/ year Training and Feedback
Community

How does MW work?
Imagery (video) analysis
Data processing and Outputs
Data transfer from Community to Scientists
Requirements: Mangrove knowledge
Basic Excel and ArcGIS
Management
Science
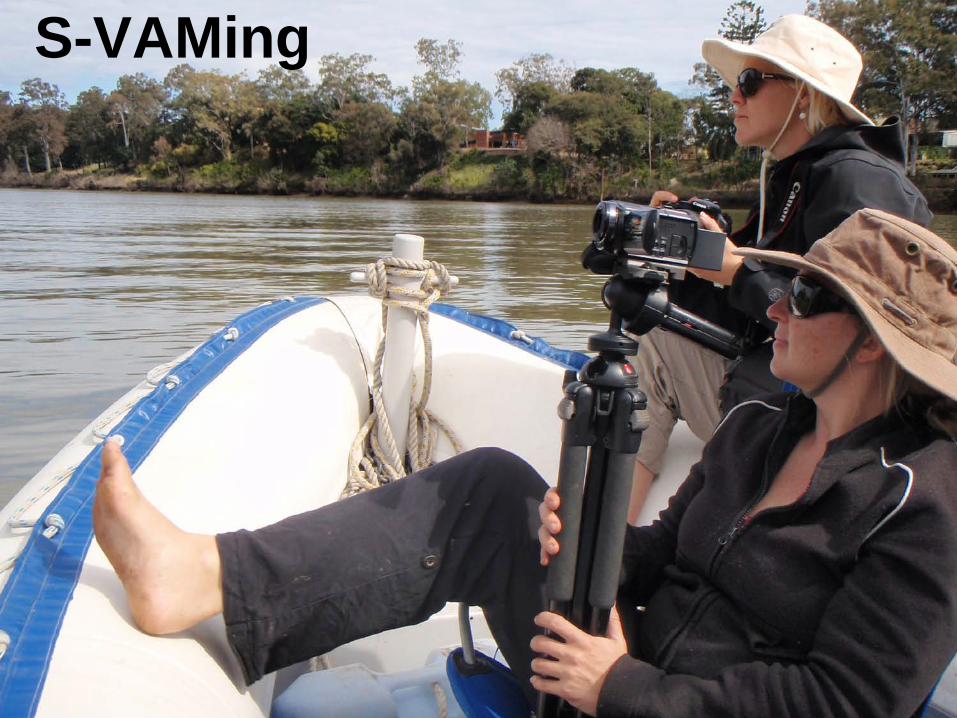
S-VAMing
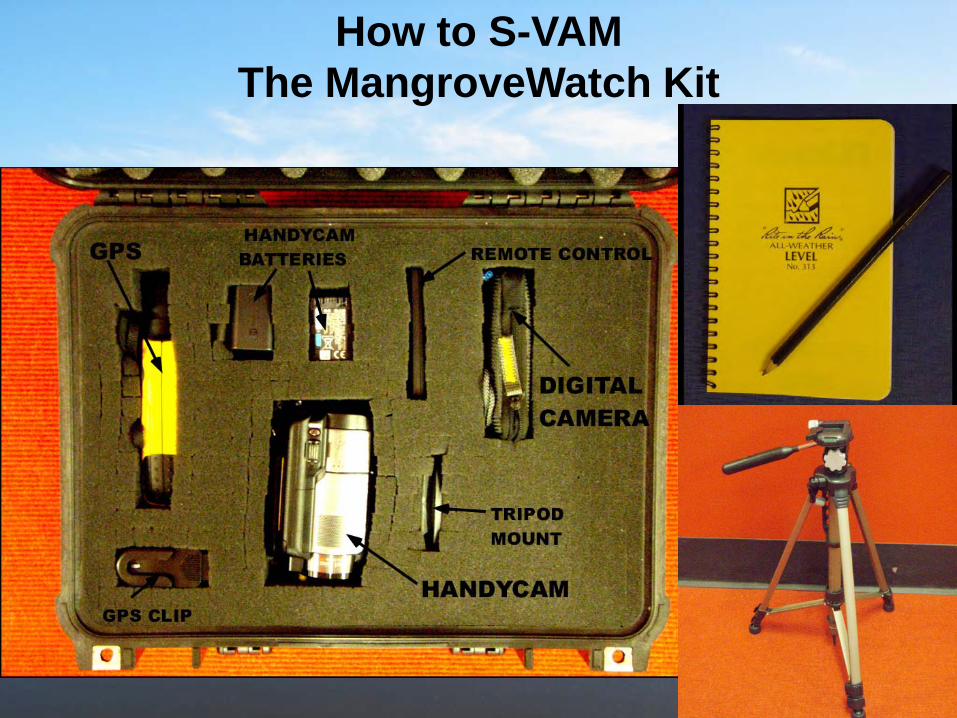
How to S-VAM The MangroveWatch Kit

When to go MangroveWatching?
Good Tide – low to mid Good Light – Sunny Film with the sun on
your back 2 surveys per year Ends of Dry & Wet
seasons

The 5 Tasks of S-VAM
1. Handycam Operator 2. GPS Operator 3. Photographer 4. Observer 5. Boat Driver
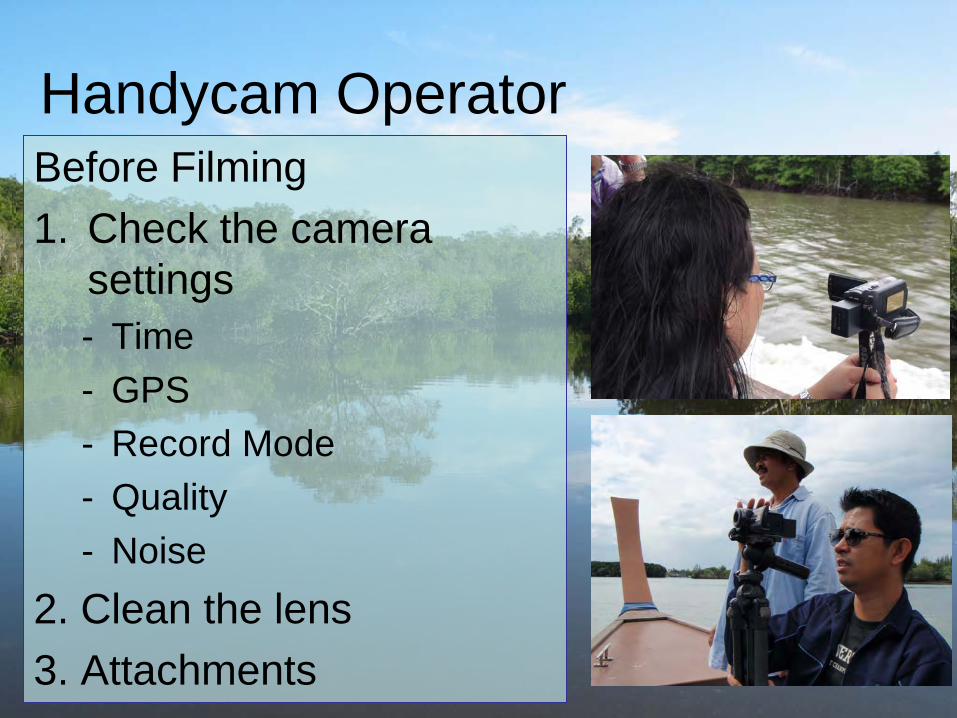
Handycam Operator Before Filming 1. Check the camera
settings - Time - GPS - Record Mode - Quality - Noise
2. Clean the lens 3. Attachments
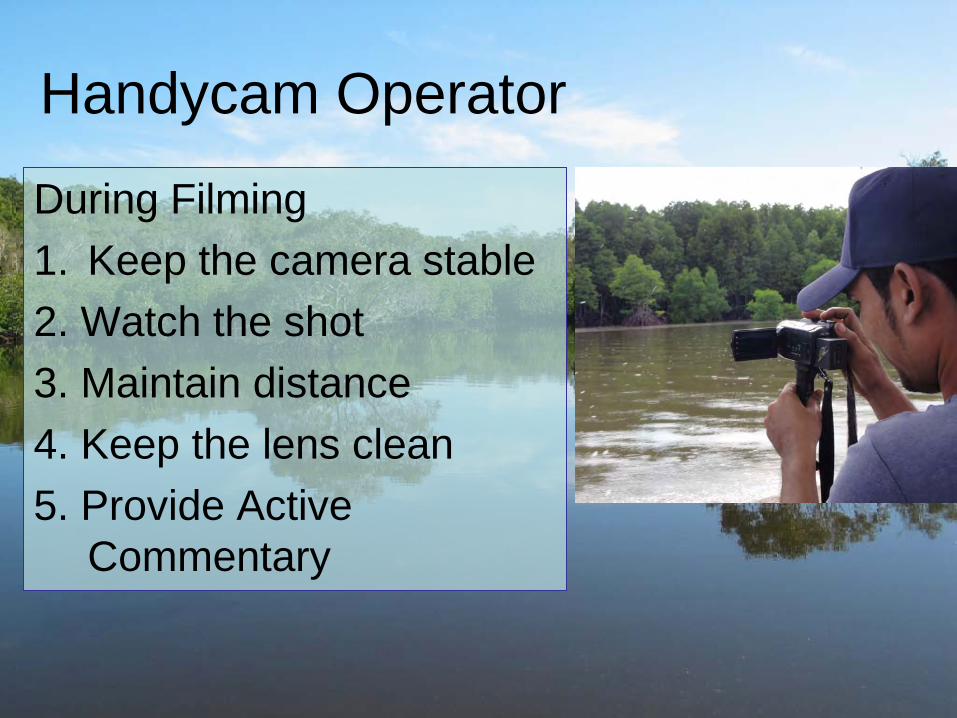
Handycam Operator
During Filming 1. Keep the camera stable 2. Watch the shot 3. Maintain distance 4. Keep the lens clean 5. Provide Active
Commentary

GPS Operator
Before Filming 1. Turn the Track log on! 2. Check the track log
memory

GPS Operator
During Filming 1. Check the Track log 2. Keep a clear signal 3. Take waypoints 4. Keep an eye on batteries 5. Watch boat speed *Turn Track Log off when done
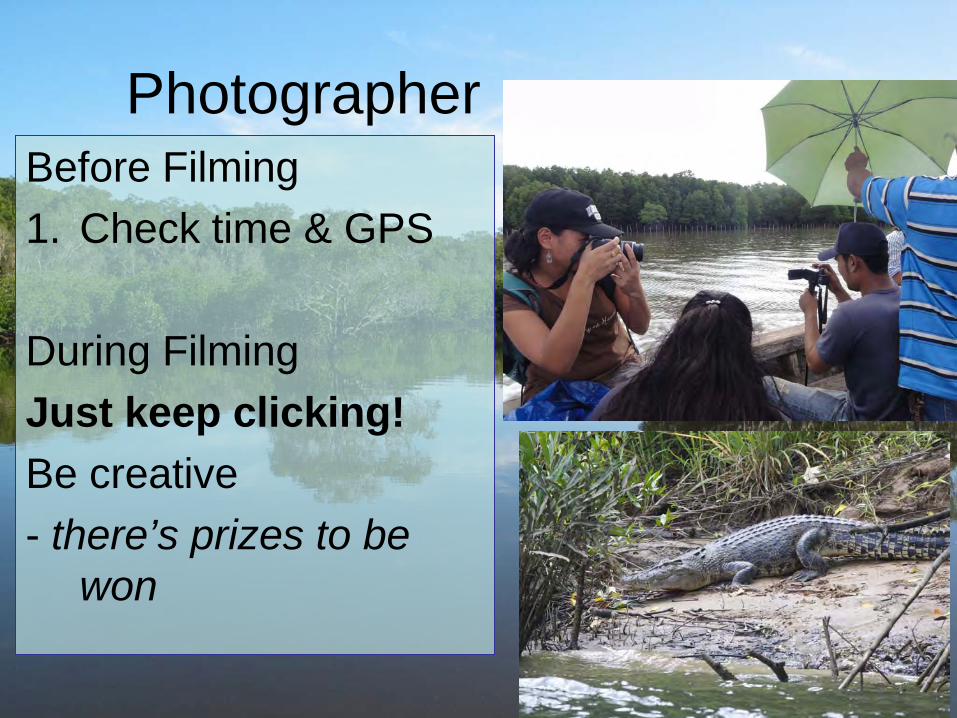
Photographer Before Filming 1. Check time & GPS During Filming Just keep clicking! Be creative - there’s prizes to be
won

Observer/ Recorder
1. Record Start/ Stop Locations
2. Waypoints 3. Interesting Features 4. Bird/ Fauna Counts 5. Mangrove User counts 6. Mangrove Phenology
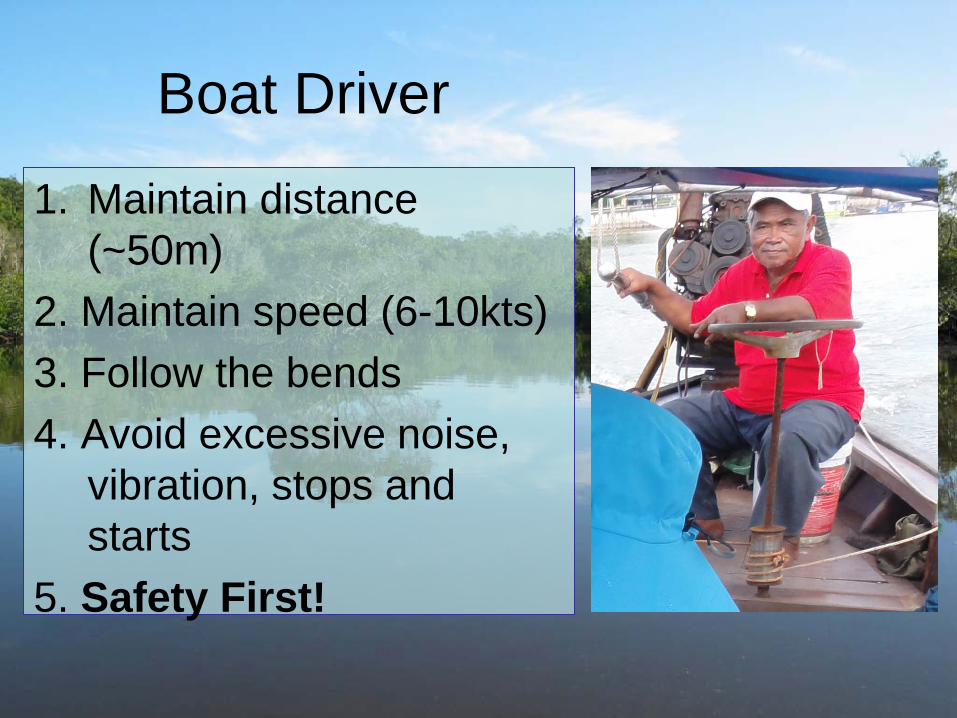
Boat Driver
1. Maintain distance (~50m)
2. Maintain speed (6-10kts) 3. Follow the bends 4. Avoid excessive noise,
vibration, stops and starts
5. Safety First!

You are now ready to go MangroveWatching!

Part 2 Data Analysis with S-VAM

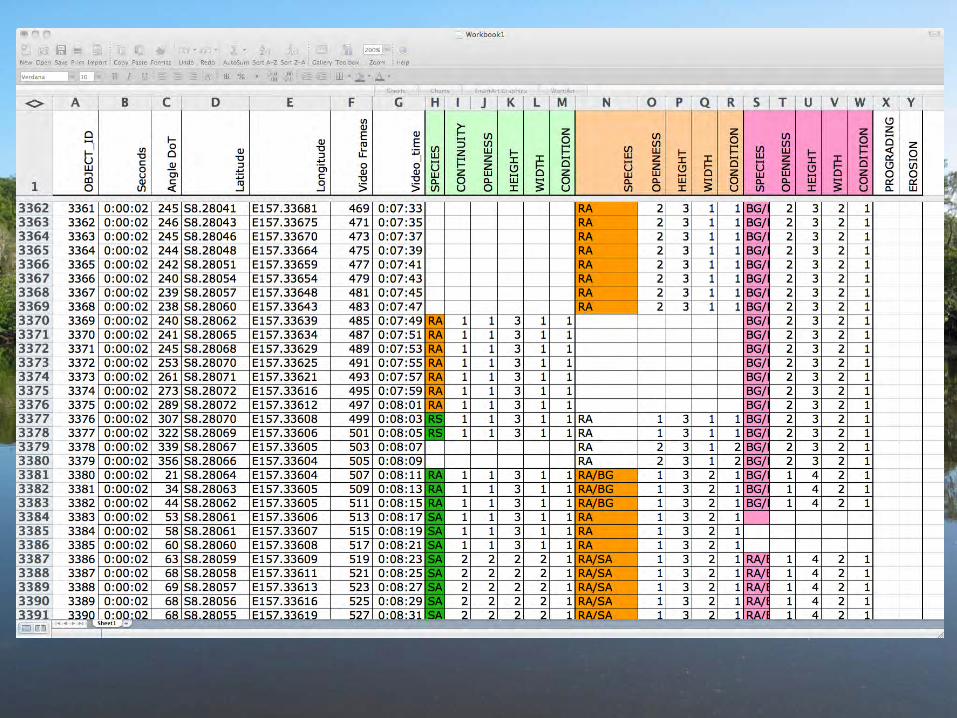
Video converted to 1s frame images
Images linked to GPS track and assessed against Multiple criteria – e.g. Mangrove forest type
Data used to generate map outputs With ArcGIS
Science


BANK FEATURES
BANK MORPHOLOGY
SUBSTRATE
PHYSICAL PROCESS
HABITAT
PRESSURES DIRECT INDIRECT
CUTTING
GRAZING RECENT
REMOVAL
HARDENDED BANK
OPEN DRAIN ADJACENT LANDUSE
BUILT STRUCTURES
LITTER
BOATS
VEGETATION FEATURES
MANGROVE
DENSITY
HEIGHT
DOMINANT SP. DIEBACK
Intensity DIEBACK
Scale
FOREST TYPE
FALLEN TREES
TERRESTRIAL
DENSITY
DOMINANT SP.
EXPOSED ROOTS
HEALTH
FALLEN TREES
HEIGHT
EXPOSED ROOTS
SEEDLING DENSITY
ASSESSING ECOSYSTEM VALUE & CONDITION & Identifying threats & drivers of change
What do we look for? Science

Poor Condition Moderate Condition Good Condition
% M
angr
ove
Estuary Comparisons Outcomes Science

2011
2009
2011
Assessing Resilience to Natural Events Drought Recovery Flood Damage
Feb 2011
Aug 2011
Outcomes Science

1977
2004
Habitat Mapping – Nutrient Effects MangroveWatch Tracks
Using MangroveWatch footage & assessment for ground-truthing
habitat mapping
Outcomes Science
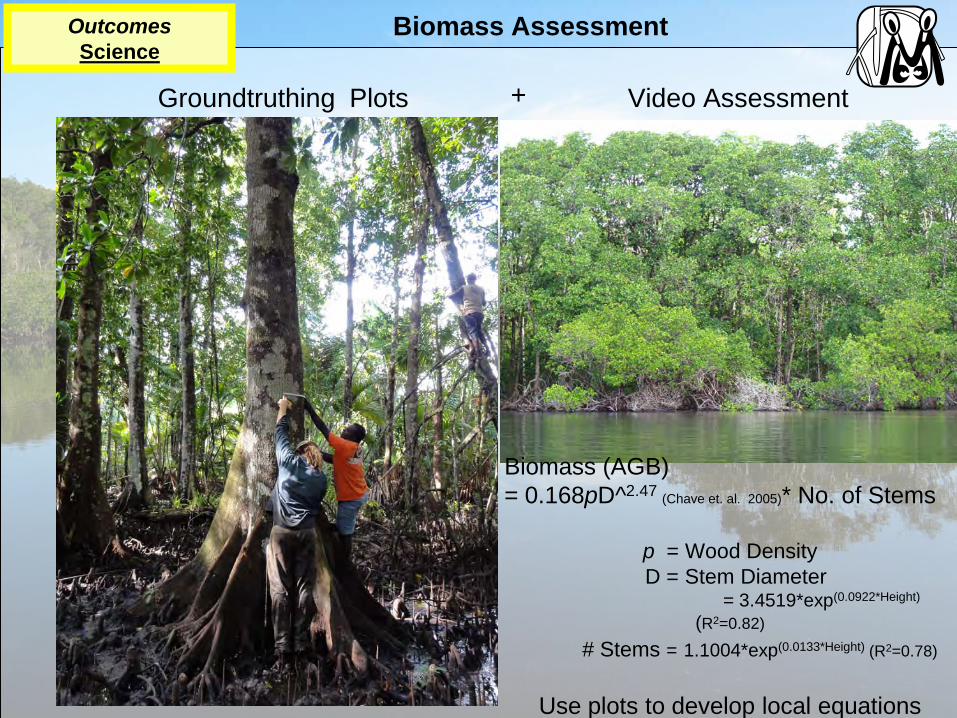
Biomass Assessment Outcomes Science
Groundtruthing Plots Video Assessment +
Biomass (AGB) = 0.168pD^2.47 (Chave et. al. 2005)* No. of Stems
p = Wood Density
D = Stem Diameter = 3.4519*exp(0.0922*Height)
(R2=0.82)
# Stems = 1.1004*exp(0.0133*Height) (R2=0.78)
Use plots to develop local equations

Mangrove Condition Report Cards
Outcomes Management

Identification of Indicators of Change Outcomes
Management

Identifying Poor management & Illegal Activity
Outcomes Management

Targeted Restoration Outcomes
Management

‘ShoreView’
Interactive, online mangrove condition report cards
Prototype innovation
Outcomes Management

Part 3 Case Study

Advantages of the MW approach Community Engagement: • Records local knowledge and locally relevant
issues – anecdotal evidence, historical images, stories
• Enables large spatial coverage • Community education • Community environmental stewardship And many more…

Advantages of the MW methods Video Monitoring: • Easy use. • No objective decision making required in the field • Rapid: 1 hour = ~12km. • Permanent Visual Record • Remote data assessment by mangrove scientists • Potential for further ‘expert’ assessment – bird habitat etc. • Perfect for data visualisation

Lessons Learned so far…. Feedback is essential!
• Requires assessment of footage. • Guaging community knowledge increase
Every region and group is different…
• Level of capacity – different skill sets • What’s considered important – why are you
MangroveWatching? • Local issues vary
The MangroveWatch program is flexible and adaptive
The primary goal is imagery collection for long-term monitoring, everything else is locality dependent

Discussion Session
How can MangroveWatch help you? – What
information would you like to have about shoreline habitats?

Thank You!
Any Questions?