shoney's - loopnetimages2.loopnet.com/d2/ewbsdnin9ru69-qphrev2msxjz5... · the value of a net...
TRANSCRIPT
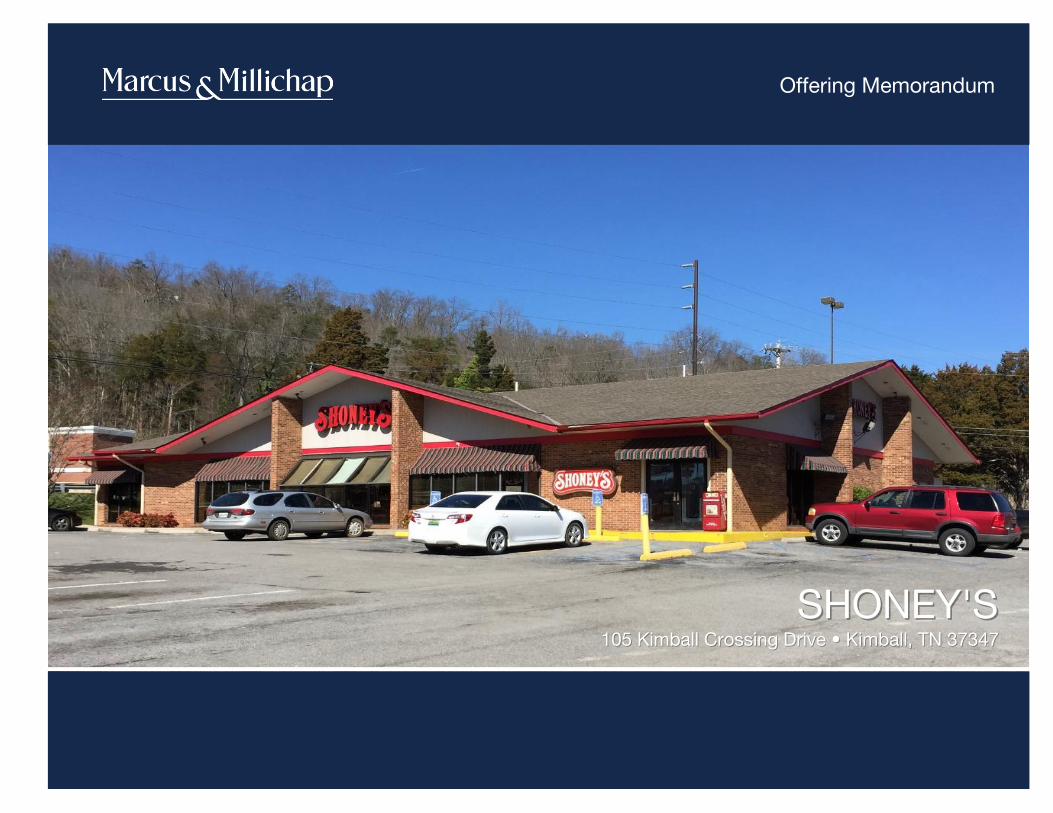
Offering Memorandum
SHONEY'SSHONEY'S105 Kimball Crossing Drive • Kimball, TN 37347105 Kimball Crossing Drive • Kimball, TN 37347

N O N - E N D O R S E M E N T A N D D I S C L A I M E R N O T I C E
Confidentiality and DisclaimerThe information contained in the following Marketing Brochure is proprietary and strictly confidential. It is intended to be reviewed only by the party receiving it from Marcus & Millichap and should not be made available to any other person or entity without the written consent of Marcus & Millichap. This Marketing Brochure has been prepared to provide summary, unverified information to prospective purchasers, and to establish only a preliminary level of interest in the subject property. The information contained herein is not a substitute for a thorough due diligence investigation. Marcus & Millichap has not made any investigation, and makes no warranty or representation, with respect to the income or expenses for the subject property, the future projected financial performance of the property, the size and square footage of the property and improvements, the presence or absence of contaminating substances, PCB's or asbestos, the compliance with State and Federal regulations, the physical condition of the improvements thereon, or the financial condition or business prospects of any tenant, or any tenant's plans or intentions to continue its occupancy of the subject property. The information contained in this Marketing Brochure has been obtained from sources we believe to be reliable; however, Marcus & Millichap has not verified, and will not verify, any of the information contained herein, nor has Marcus & Millichap conducted any investigation regarding these matters and makes no warranty or representation whatsoever regarding the accuracy or completeness of the information provided. All potential buyers must take appropriate measures to verify all of the information set forth herein. Marcus & Millichap is a service mark of Marcus & Millichap Real Estate Investment Services, Inc. © 2017 Marcus & Millichap. All rights reserved.
Non-Endorsement NoticeMarcus & Millichap is not affiliated with, sponsored by, or endorsed by any commercial tenant or lessee identified in this marketing package. The presence of any corporation's logo or name is not intended to indicate or imply affiliation with, or sponsorship or endorsement by, said corporation of Marcus & Millichap, its affiliates or subsidiaries, or any agent, product, service, or commercial listing of Marcus & Millichap, and is solely included for the purpose of providing tenant lessee information about this listing to prospective customers.
ALL PROPERTY SHOWINGS ARE BY APPOINTMENT ONLY.PLEASE CONSULT YOUR MARCUS & MILLICHAP AGENT FOR MORE DETAILS.
SHONEY'SKimball, TNACT ID Y0121543
2

N E T L E A S E D D I S C L A I M E R
Marcus & Millichap hereby advises all prospective purchasers of Net Leased property as follows:
The information contained in this Marketing Brochure has been obtained from sources we believe to be reliable. However, Marcus & Millichap has not and will not verify any of this information, nor has Marcus & Millichap conducted any investigation regarding these matters. Marcus & Millichap makes no guarantee, warranty or representation whatsoever about the accuracy or completeness of any information provided.
As the Buyer of a net leased property, it is the Buyer’s responsibility to independently confirm the accuracy and completeness of all material information before completing any purchase. This Marketing Brochure is not a substitute for your thorough due diligence investigation of this investment opportunity. Marcus & Millichap expressly denies any obligation to conduct a due diligence examination of this Property for Buyer.
Any projections, opinions, assumptions or estimates used in this Marketing Brochure are for example only and do not represent the current or future performance of this property. The value of a net leased property to you depends on factors that should be evaluated by you and your tax, financial and legal advisors.
Buyer and Buyer’s tax, financial, legal, and construction advisors should conduct a careful, independent investigation of any net leased property to determine to your satisfaction with the suitability of the property for your needs.
Like all real estate investments, this investment carries significant risks. Buyer and Buyer’s legal and financial advisors must request and carefully review all legal and financial documents related to the property and tenant. While the tenant’s past performance at this or other locations is an important consideration, it is not a guarantee of future success. Similarly, the lease rate for some properties, including newly-constructed facilities or newly-acquired locations, may be set based on a tenant’s projected sales with little or no record of actual performance, or comparable rents for the area. Returns are not guaranteed; the tenant and any guarantors may fail to pay the lease rent or property taxes, or may fail to comply with other material terms of the lease; cash flow may be interrupted in part or in whole due to market, economic, environmental or other conditions. Regardless of tenant history and lease guarantees, Buyer is responsible for conducting his/her own investigation of all matters affecting the intrinsic value of the property and the value of any long-term lease, including the likelihood of locating a replacement tenant if the current tenant should default or abandon the property, and the lease terms that Buyer may be able to negotiate with a potential replacement tenant considering the location of the property, and Buyer’s legal ability to make alternate use of the property.
By accepting this Marketing Brochure you agree to release Marcus & Millichap Real Estate Investment Services and hold it harmless from any kind of claim, cost, expense, or liability arising out of your investigation and/or purchase of this net leased property.
3
OFFERING SUMMARY
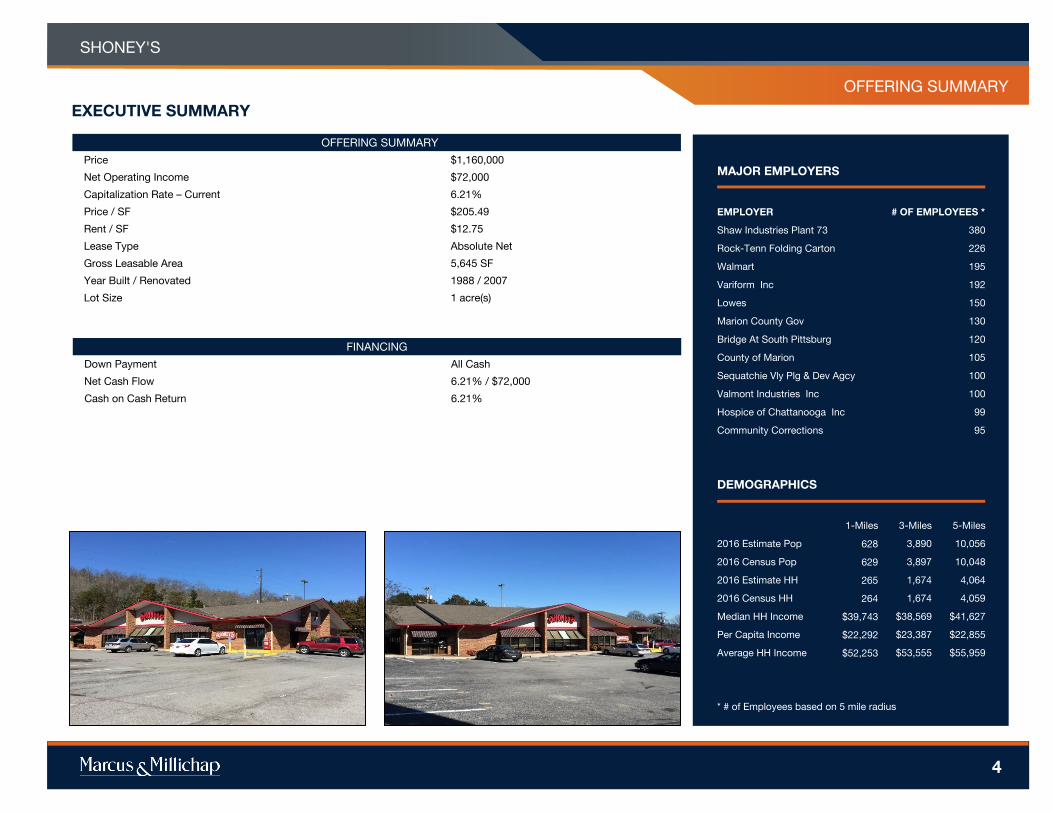
Price $1,160,000
Net Operating Income $72,000
Capitalization Rate – Current 6.21%
Price / SF $205.49
Rent / SF $12.75
Lease Type Absolute Net
Gross Leasable Area 5,645 SF
Year Built / Renovated 1988 / 2007
Lot Size 1 acre(s)
#
EXECUTIVE SUMMARY
OFFERING SUMMARY
#
FINANCING
Down Payment All Cash
Net Cash Flow 6.21% / $72,000
Cash on Cash Return 6.21%
SHONEY'S
4
SHONEY'S
4
OFFERING SUMMARY
MAJOR EMPLOYERS
EMPLOYER # OF EMPLOYEES *
Shaw Industries Plant 73 380
Rock-Tenn Folding Carton 226
Walmart 195
Variform Inc 192
Lowes 150
Marion County Gov 130
Bridge At South Pittsburg 120
County of Marion 105
Sequatchie Vly Plg & Dev Agcy 100
Valmont Industries Inc 100
Hospice of Chattanooga Inc 99
Community Corrections 95
DEMOGRAPHICS
1-Miles 3-Miles 5-Miles
2016 Estimate Pop 628 3,890 10,056
2016 Census Pop 629 3,897 10,048
2016 Estimate HH 265 1,674 4,064
2016 Census HH 264 1,674 4,059
Median HH Income $39,743 $38,569 $41,627
Per Capita Income $22,292 $23,387 $22,855
Average HH Income $52,253 $53,555 $55,959
* # of Employees based on 5 mile radius
SHONEY'S
OFFERING SUMMARY
§ Walmart Supercenter Outparcel
§ Absolute Net Lease - Zero Landlord Responsibilities
§ Nine Years and Ten Months Remaining on Lease with Two, Five-Year Options
§ Corporate Lease Guarantee
§ Remodeled in 2007 to include New Roof
§ Traffic Count - 42,295 Vehicles per Day
§ Strong Visibility and Direct Access to I-24
§ Close proximity to Chattanooga
INVESTMENT HIGHLIGHTS
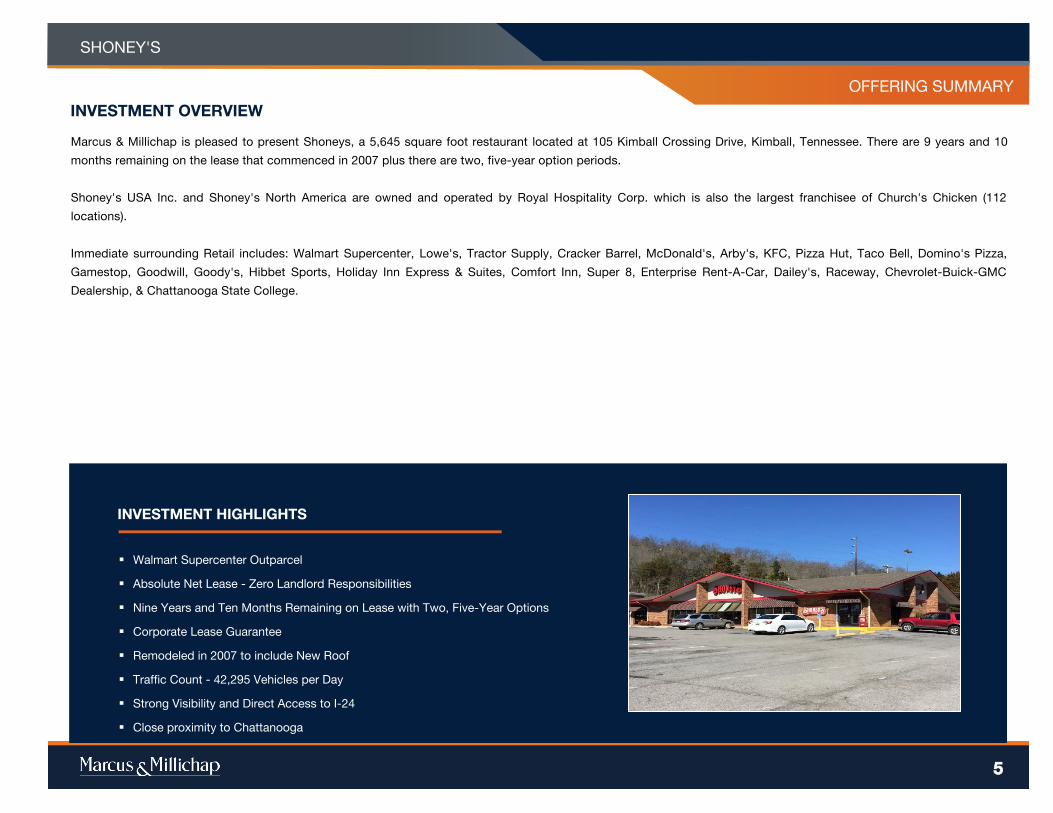
Marcus & Millichap is pleased to present Shoneys, a 5,645 square foot restaurant located at 105 Kimball Crossing Drive, Kimball, Tennessee. There are 9 years and 10
months remaining on the lease that commenced in 2007 plus there are two, five-year option periods.
Shoney's USA Inc. and Shoney's North America are owned and operated by Royal Hospitality Corp. which is also the largest franchisee of Church's Chicken (112
locations).
Immediate surrounding Retail includes: Walmart Supercenter, Lowe's, Tractor Supply, Cracker Barrel, McDonald's, Arby's, KFC, Pizza Hut, Taco Bell, Domino's Pizza,
Gamestop, Goodwill, Goody's, Hibbet Sports, Holiday Inn Express & Suites, Comfort Inn, Super 8, Enterprise Rent-A-Car, Dailey's, Raceway, Chevrolet-Buick-GMC
Dealership, & Chattanooga State College.
INVESTMENT OVERVIEW
5

#
CLOSE PROXIMITY TO:
105 Kimball Crossing Drive, Kimball, TN 37347
LOCATION OVERVIEWTENANT SUMMARYPRICING AND VALUATION MATRIX
PROPERTY NAMESHONEY'S
PRICING AND VALUATION MATRIX
PROPERTY NAME
SHONEY'S
6
LOCATION OVERVIEW

#
105 Kimball Crossing Drive, Kimball, TN 37347
LOCATION OVERVIEWTENANT SUMMARYPRICING AND VALUATION MATRIX
PROPERTY NAMESHONEY'S
PRICING AND VALUATION MATRIX
PROPERTY NAME
SHONEY'S
7
REGIONAL AND LOCAL MAP
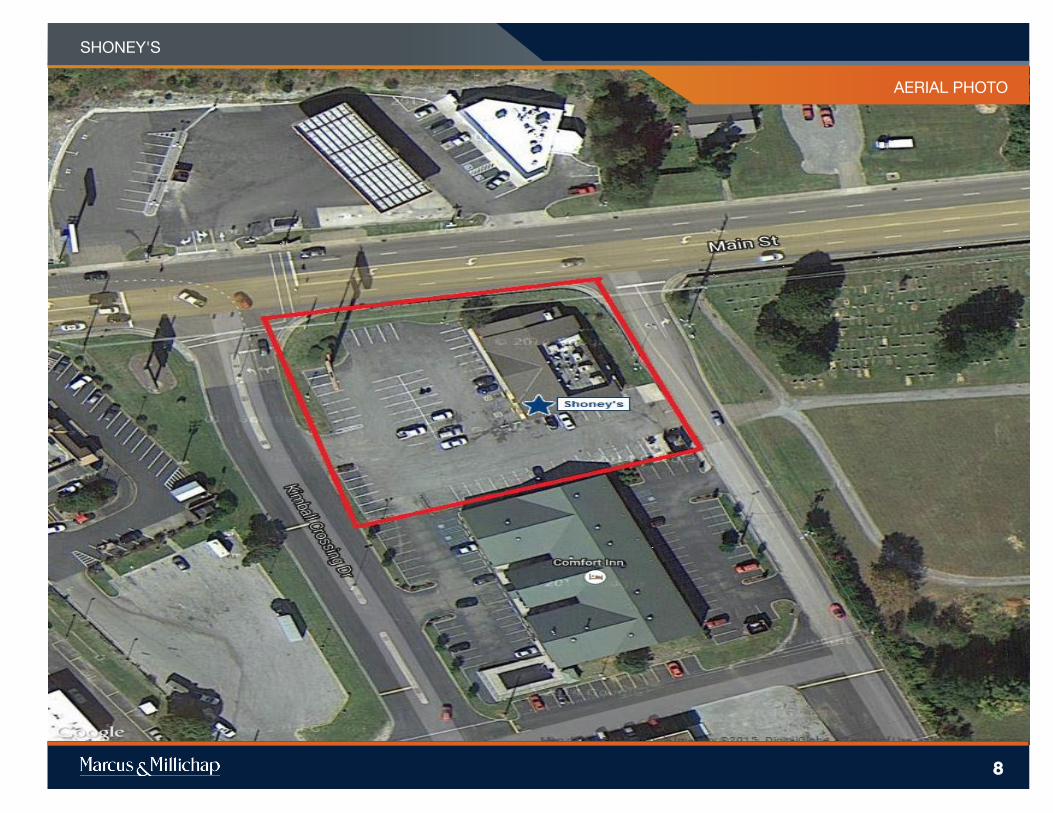
AERIAL PHOTO
SHONEY'S
8

#
PROPERTY SUMMARY
OFFERING SUMMARY
#
NOTES
SHONEY'S
9
OFFERING SUMMARY
SHONEY'S
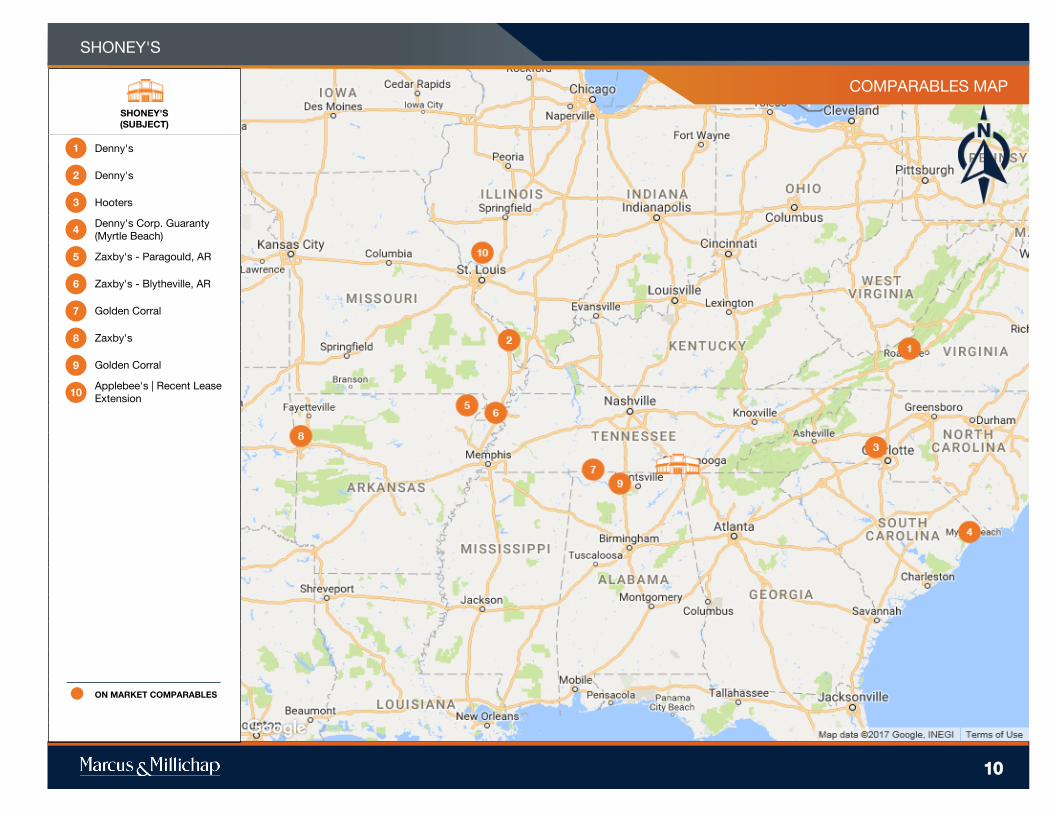
COMPARABLES MAP
10
SHONEY'S(SUBJECT)
Denny's
Denny's
Hooters
Denny's Corp. Guaranty (Myrtle Beach)
Zaxby's - Paragould, AR
Zaxby's - Blytheville, AR
Golden Corral
Zaxby's
Golden Corral
Applebee's | Recent Lease Extension
ON MARKET COMPARABLES
1
2
3
4
5
7
8
6
9
10

11
Shoney's Denny's Denny's-2 Hooters Denny'sCorp.
Guaranty(MyrtleBeach)
Zaxby's -Paragould,
AR
Zaxby's -Blytheville,
AR
GoldenCorral
Zaxby's GoldenCorral-2
Applebee's| RecentLease
Extension
0.0
0.7
1.4
2.1
2.8
3.5
4.2
4.9
5.6
6.3
7.0 Avg. 6.35%
PROPERTY NAME
SHONEY'S
SALES COMPARABLES
Average Cap Rate
ON MARKET COMPARABLES
ON MARKET COMPS AVG
12
Shoney's Denny's Denny's-2 Hooters Denny'sCorp.
Guaranty(MyrtleBeach)
Zaxby's -Paragould,
AR
Zaxby's -Blytheville,
AR
GoldenCorral
Zaxby's GoldenCorral-2
Applebee's| RecentLease
Extension
$0.00
$70.00
$140.00
$210.00
$280.00
$350.00
$420.00
$490.00
$560.00
$630.00
$700.00
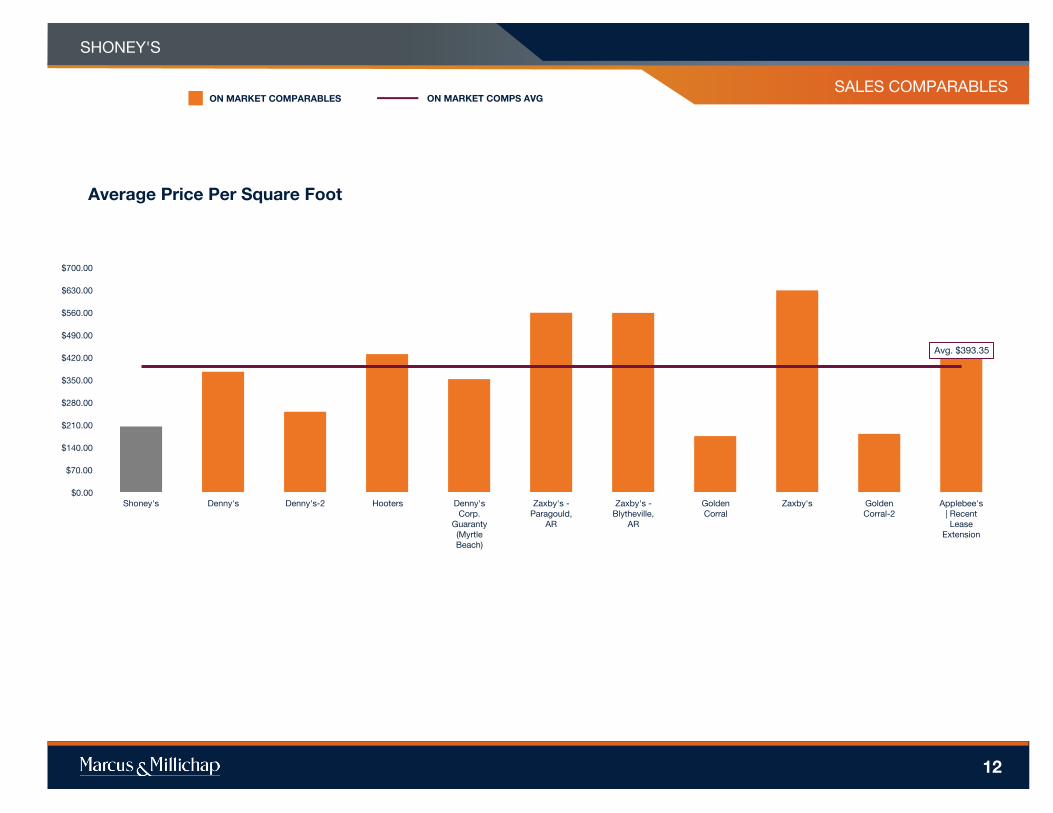
Avg. $393.35
PROPERTY NAME
SHONEY'S
SALES COMPARABLES
Average Price Per Square Foot
ON MARKET COMPARABLES
ON MARKET COMPS AVG

PROPERTY NAME
MARKETING TEAM
SHONEY'S
SALES COMPARABLES
rentpropertyname1
rentpropertyaddress1
rentpropertyname1
rentpropertyaddress1
rentpropertyname1
rentpropertyaddress1
13
ON MARKET COMPARABLES
SUBJECT PROPERTY
Asking Price $1,160,000
Price/SF $205.49
CAP Rate 6.21%
GLA 5,645 SF
Lot Size 1 acre(s)
Year Built 1988
Lease Term Remaining 9.8 Years
SHONEY'S105 Kimball Crossing Drive, Kimball, TN, 37347
1
NOTES
Franchisee Guarantee
On Market
List Price $1,200,000
Price/SF $375.94
CAP Rate 6.25%
GLA 3,192 SF
Lot Size 0.99 acre(s)
Year Built 1988
Lease Term Remaining 10 Years
DENNY'S2675 Roanoke St, Christiansburg, VA, 24073
2
On Market
List Price $1,500,000
Price/SF $251.59
CAP Rate 6.00%
GLA 5,962 SF
Lot Size 1.2 acre(s)
Year Built 1985
Lease Term Remaining 3 Years
DENNY'S161 West Dr, Cape Girardeau, MO, 63703

PROPERTY NAME
MARKETING TEAM
SHONEY'S
SALES COMPARABLES
rentpropertyname1
rentpropertyaddress1
rentpropertyname1
rentpropertyaddress1
rentpropertyname1
rentpropertyaddress1
14
ON MARKET COMPARABLES
3
NOTES
Corporate Guarantee
On Market
List Price $1,557,500
Price/SF $430.72
CAP Rate 7.00%
GLA 3,616 SF
Lot Size 1.0 acre(s)
Year Built 1999
Lease Term Remaining 6 Years
HOOTERS3725 E Franklin Blvd, Gastonia, NC, 28056
4
On Market
List Price $1,825,000
Price/SF $353.00
CAP Rate 5.23%
GLA 5,170 SF
Year Built 1993
DENNY'S CORP. GUARANTY (MYRTLE BEACH)1200 U.S. Highway 17 North, Surfside Beach, SC, 29575
5
NOTES
Personal Guarantee
On Market
List Price $1,848,085
Price/SF $559.52
CAP Rate 6.50%
GLA 3,303 SF
Lot Size 0.99 acre(s)
Year Built 2007
Lease Term Remaining 11 Years
ZAXBY'S - PARAGOULD, AR2907 W Kingshighway, Paragould, AR, 72450
PROPERTY NAME
MARKETING TEAM
SHONEY'S
SALES COMPARABLES
rentpropertyname1
rentpropertyaddress1
rentpropertyname1
rentpropertyaddress1
rentpropertyname1
rentpropertyaddress1
15
ON MARKET COMPARABLES
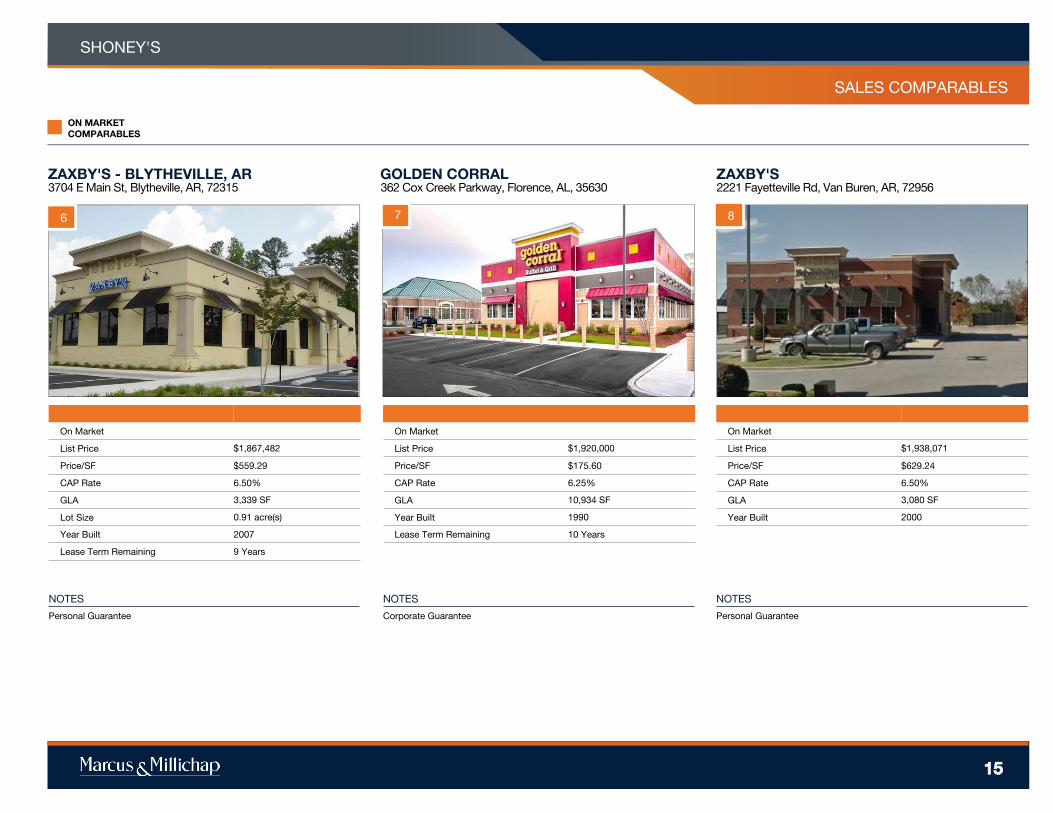
6
NOTES
Personal Guarantee
On Market
List Price $1,867,482
Price/SF $559.29
CAP Rate 6.50%
GLA 3,339 SF
Lot Size 0.91 acre(s)
Year Built 2007
Lease Term Remaining 9 Years
ZAXBY'S - BLYTHEVILLE, AR3704 E Main St, Blytheville, AR, 72315
7
NOTES
Corporate Guarantee
On Market
List Price $1,920,000
Price/SF $175.60
CAP Rate 6.25%
GLA 10,934 SF
Year Built 1990
Lease Term Remaining 10 Years
GOLDEN CORRAL362 Cox Creek Parkway, Florence, AL, 35630
8
NOTES
Personal Guarantee
On Market
List Price $1,938,071
Price/SF $629.24
CAP Rate 6.50%
GLA 3,080 SF
Year Built 2000
ZAXBY'S2221 Fayetteville Rd, Van Buren, AR, 72956

PROPERTY NAME
MARKETING TEAM
SHONEY'S
SALES COMPARABLES
rentpropertyname1
rentpropertyaddress1
rentpropertyname1
rentpropertyaddress1
rentpropertyname1
rentpropertyaddress1
16
ON MARKET COMPARABLES
9
NOTES
Corporate Guarantee
On Market
List Price $2,016,000
Price/SF $182.38
CAP Rate 6.25%
GLA 11,054 SF
Year Built 1990
GOLDEN CORRAL921 Wimberly Drive Southwest, Decatur, AL, 35603
10
NOTES
Corporate Guarantee
On Market
List Price $2,107,386
Price/SF $416.23
CAP Rate 7.00%
GLA 5,063 SF
Year Built 2002
Lease Term Remaining 5 Years
APPLEBEE'S | RECENT LEASE EXTENSION319 Homer Adams Parkway, Alton, IL, 62002

2016 Net-Leased Retail Market Overview
Y-O-Y Average Cap Rates down 10 Basis Points
Consumption growth steady as hiring extends into sixth year. The continued
employment growth cycle has helped support consistent gains in retail sales despite
tepid wages. For retail center owners, positive economic momentum has steadily
tightened vacancy without sparking significant construction. To address limited space
availability, retailers have been working with developers to expand the pipeline of
single-tenant floor plans, with deliveries topping 39 million square feet in 2015,
accounting for the vast majority of retail completions. While internationally driven
headwinds prompted some volatility in the first quarter, positive traction has boosted
confidence and limited caution, at least for the short term. Considering bars and
restaurants have been a leading retail growth sector, the outlook for these and other
net-leased assets remains strong.
Investors trading out of other assets via 1031-exchanges lead net-lease buyer
pool. As a growing number of property owners near retirement, many are choosing to
transition their investment portfolios from apartment assets that are trading at a
premium into net-leased retail properties throughout the U.S. Benefits can include
higher initial yields than other low-maintenance options and reduced volatility relative
to other property types. Net-leased properties offer a wide range of choices with
average cap rates in the mid-5 percent range, depending on location and tenancy.
While pending mergers and minimum-wage concerns made headlines in several net-
leased sectors, deal flow was limited by a lack of available listings rather than a
slowdown in demand. Investors typically use cash to close transactions, underscoring
the amount of capital readily available for well-positioned assets with corporate credit
tenants. Although cap rates are likely to remain stable due to the tight spread between
credit financing and prices, willing investors continue to actively search for attractive
offerings. With several states considering more stringent definitions of like-kind
exchanges, potentially limiting where acquisitions can be made, the current demand
for net-leased properties remains robust.
17
Y-O-Y Average Cap Ratesdown 10 Basis Points
Y-O-Y Average Cap Ratesdown 50 Basis Points
Y-O-Y Average Cap Ratesdown 20 Basis Points
Y-O-Y Average Cap Ratesdown 20 Basis Points
Net-Lease Assets Favored Amid Limited Development Cycle
Dollar Stores: Although deal flow fell following the announcement of store dispositions by the combined Family Dollar/Dollar Tree, cap rates in the sector slipped into the mid-7 percent band on average. Properties with new leases will change hands with average cap rates in the mid-6 percent range.
Auto-Part Retailers: Auto-part retailer cap rates continue to contract as investors flock to the sector. Average cap rates will begin in the high-5 percent range and extend into the mid-7 percent band, depending on tenancy and location.
Drugstores: Assets with new leases in this space will trade at cap rates starting in the low-5 percent range, with Walgreens commanding a premium to both CVS and Rite Aid. Uncertainty surrounding the Wagreens/Rite Aid merger may slow trading volume.
Quick-Service Restaurants: The average cap rate in the QSR space dropped into the low-5 percent range, with stalwarts including Starbucks and McDonald’s pricing in the mid-4 percent range. Shorter leases and regional credits will push yields closer to 6 percent.
Casual-Dining Establishments: Performance in the sector has become increasingly bifurcated, with new leases dropping trading properties’ caps into the mid-5 percent range. Tenancy and credit considerations will push the top end of the range into the mid-7 percent region.
NATIONAL NET-LEASED RETAIL REPORT
17
SECOND QUARTER 2016

18
Auto-Part Retailers
* Through first quarter** Trailing 12 months through first quarterSources: Marcus & Millichap Research Services; CoStar Group, Inc.
Economy
§ While auto sales have been robust in recent years, the average age of a car on the road is at a
record 11.5 years old, leaving plenty of room for growth to continue. The need to service older
vehicles will push up receipts at auto-parts retailers, providing an attractive net-lease opportunity.
§ Deal flow rose 20 percent over the past year as investors allocated more capital to the sector. Prices
per square foot range from the mid-$150 area for regional operators to the mid-$300 region for
national credit tenants such as AutoZone and Advance Auto Parts.
§ Higher prices were accompanied by tighter cap rates, with initial yields in the mid-6 percent region
nationwide. However, cap rates can vary from the mid-4 percent range for excellent locations with
new leases to the mid-8 percent band for shorter lease terms.
Outlook: The secular trend of aging vehicles will maintain high demand for replacement auto parts,
supporting a tactical acquisition strategy in the sector.
§ Over the past year, the U.S. economy added 2.8 million jobs, expanding total employment 2 percent
as persistent hiring in healthcare and professional services industries combined to add more than
1.3 million positions. While manufacturing and natural resources sectors detracted from gains, all
other groups recorded advancement, supporting broad-based growth.
§ Labor market gains have spilled over into unemployment, which recently hit multidecade lows not
seen since 1973. In addition, the unemployment rate sank 50 basis points to 5 percent, the lowest
level since 2007.
§ Core retail sales, which exclude volatile gasoline prices and auto sales, rose 3.9 percent over the 12
months ending in the first quarter. Several categories, including building materials and healthcare,
vaulted more than 6 percent, indicating consumer readiness to spend in specific areas.
Outlook: Labor market resilience will encourage more new households, supporting additional spending
at retail outlets. As a result, vacancy will decline 30 basis points nationwide to 5.8 percent, while the
average asking rent ticks up 2.8 percent to $18.94 per square foot.
NATIONAL NET-LEASED RETAIL REPORT
18
SECOND QUARTER 2016

19
§ The combined entity of Family Dollar and Dollar Tree is in the process of selling 330 stores following
its merger acceptance by the Department of Justice.
§ Trading contracted 23 percent as investors were much more diligent in their acquisition strategies in
the sector. Prices also fell below $130 per square foot, down from $180 per square foot in the
previous year.
§ First-year yields fell 50 basis points to the mid-7 percent range on average, with most deals pricing
in the high-5 percent to high-8 percent range, depending on lease structure, location and area
demographics. Dollar General stores typically command a premium as investors seek to avoid
tenancy risk by refraining from stores controlled by the combined Family Dollar/Dollar Tree entity.
Outlook: Net-leased buyers have opted to largely pursue other options in the sector, leading to a
contraction of volume and sales activity. This may continue for some time until investors are more
confident in the outlook for store counts.
§ The casual-dining space is undergoing dramatic changes, with fast-casual options gaining market
share from traditional options. Bob Evans announced several store closures due to performance,
joining Bravo Brio and Ovation Brands, the parent of Ryan’s Buffet and Old Country Buffet.
§ Transaction velocity ticked up 8 percent, with dollar volume advancing at a higher rate than closed
deals. Prices can range from $250 per square foot to more than $750 per square foot.
§ First-year yields will vary widely by tenant and location. The best sites will price in the low-5 percent
range to the mid-7 percent region.
Outlook: Investors in the space will be much more focused over the coming year, choosing to pay up for
chains including Chipotle and Panera Bread, while eschewing struggling operators.
Dollar Stores
** Trailing 12 months through first quarterSources: Marcus & Millichap Research Services; CoStar Group, Inc.
Casual-Dining Establishments
NATIONAL NET-LEASED RETAIL REPORT
19
SECOND QUARTER 2016

20
Quick-Service Restaurants
** Trailing 12 months through first quarter Sources: Marcus & Millichap Research Services; CoStar Group, Inc.
Drugstores
§ During the past year, many states have passed laws supporting a $15 per hour minimum wage,
prompting investors to contemplate the results of this change. While the effect is unknown right now,
buyers may slow their rate of capital deployment in the sector until more information is available.
§ Deal flow rose dramatically over the past year, with price per square foot exceeding $900 in primary
markets on assets with corporate tenants signed under long-term leases. Overall, prices can range
from $400 to $1,000 per square foot, indicating the wide range of pricing depending on tenancy.
§ Cap rates in the sector fell into the low- to mid-5 percent range, with stalwarts including Starbucks
and McDonald’s often commanding a lower premium.
Outlook: Brand power will overcome minimum-wage concerns in most markets as buyers seek safety
by purchasing net-leased assets in the QSR space that are leased by a Fortune 500 tenant.
§ During the past year, the drugstore segment was catalyzed by the proposed merger between
Walgreens and smaller rival Rite Aid. While the tie-up has yet to be approved by regulators, investors
have had to confront the possibility of store closures in some markets as a result of an approval.
§ Transaction prices increased marginally over the past year, varying from $400 to $700 per square
foot, depending on leasing terms and location. Walgreens garnered an average price of nearly $500
per square foot, while CVS storefronts priced at an average of $550 per square foot as buyers
sidestepped the possible merger risk by picking up CVS offerings.
§ During the last year, first-year yields sank roughly 20 basis points on average to the mid-5 percent
range, although prices can vary widely by tenancy. Walgreens stores typically price in the low- to
mid-5 percent range, while CVS locations are typically in the mid- to high-5 percent band.
Outlook: Uncertainty surrounding the Walgreens/Rite Aid merger will continue to drive sentiment in the
drugstore space in 2016. However, safety of yield and hands-off management will push investors to
deploy capital in the sector.
NATIONAL NET-LEASED RETAIL REPORT
20
SECOND QUARTER 2016
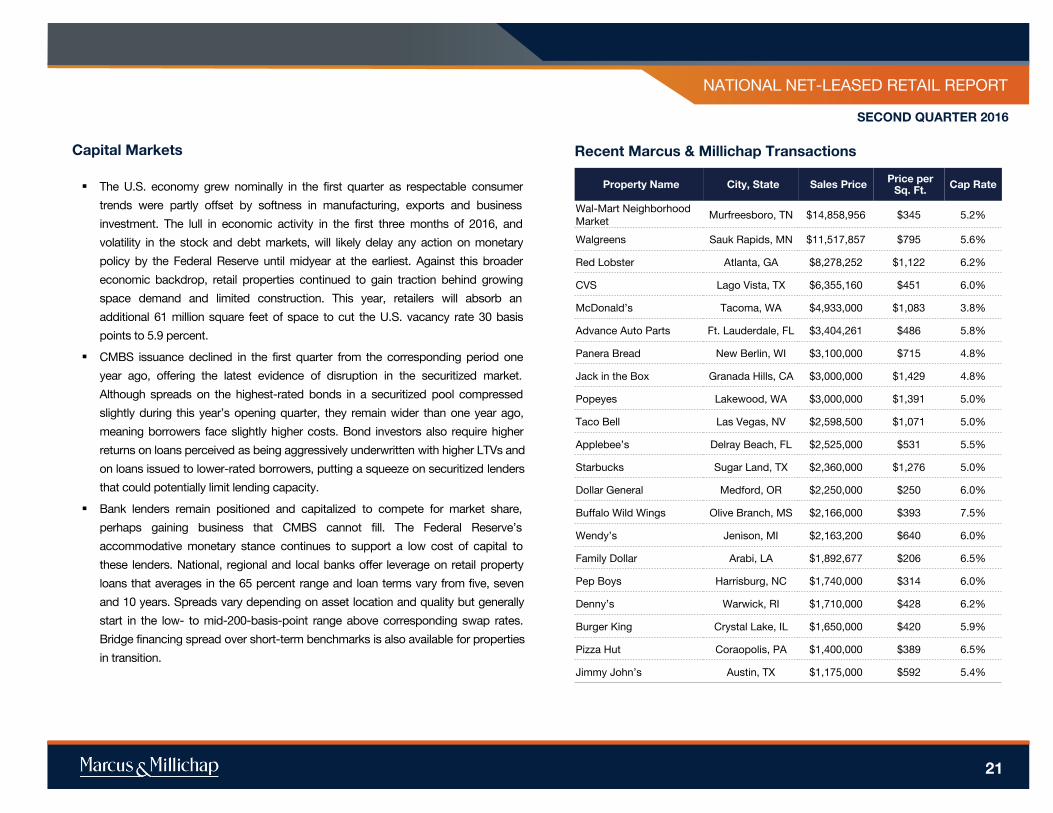
Capital Markets Recent Marcus & Millichap Transactions
§ The U.S. economy grew nominally in the first quarter as respectable consumer
trends were partly offset by softness in manufacturing, exports and business
investment. The lull in economic activity in the first three months of 2016, and
volatility in the stock and debt markets, will likely delay any action on monetary
policy by the Federal Reserve until midyear at the earliest. Against this broader
economic backdrop, retail properties continued to gain traction behind growing
space demand and limited construction. This year, retailers will absorb an
additional 61 million square feet of space to cut the U.S. vacancy rate 30 basis
points to 5.9 percent.
§ CMBS issuance declined in the first quarter from the corresponding period one
year ago, offering the latest evidence of disruption in the securitized market.
Although spreads on the highest-rated bonds in a securitized pool compressed
slightly during this year’s opening quarter, they remain wider than one year ago,
meaning borrowers face slightly higher costs. Bond investors also require higher
returns on loans perceived as being aggressively underwritten with higher LTVs and
on loans issued to lower-rated borrowers, putting a squeeze on securitized lenders
that could potentially limit lending capacity.
§ Bank lenders remain positioned and capitalized to compete for market share,
perhaps gaining business that CMBS cannot fill. The Federal Reserve’s
accommodative monetary stance continues to support a low cost of capital to
these lenders. National, regional and local banks offer leverage on retail property
loans that averages in the 65 percent range and loan terms vary from five, seven
and 10 years. Spreads vary depending on asset location and quality but generally
start in the low- to mid-200-basis-point range above corresponding swap rates.
Bridge financing spread over short-term benchmarks is also available for properties
in transition.
21
Property Name City, State Sales Price Price perSq. Ft. Cap Rate
Wal-Mart Neighborhood Market
Murfreesboro, TN $14,858,956 $345 5.2%
Walgreens Sauk Rapids, MN $11,517,857 $795 5.6%
Red Lobster Atlanta, GA $8,278,252 $1,122 6.2%
CVS Lago Vista, TX $6,355,160 $451 6.0%
McDonald’s Tacoma, WA $4,933,000 $1,083 3.8%
Advance Auto Parts Ft. Lauderdale, FL $3,404,261 $486 5.8%
Panera Bread New Berlin, WI $3,100,000 $715 4.8%
Jack in the Box Granada Hills, CA $3,000,000 $1,429 4.8%
Popeyes Lakewood, WA $3,000,000 $1,391 5.0%
Taco Bell Las Vegas, NV $2,598,500 $1,071 5.0%
Applebee’s Delray Beach, FL $2,525,000 $531 5.5%
Starbucks Sugar Land, TX $2,360,000 $1,276 5.0%
Dollar General Medford, OR $2,250,000 $250 6.0%
Buffalo Wild Wings Olive Branch, MS $2,166,000 $393 7.5%
Wendy’s Jenison, MI $2,163,200 $640 6.0%
Family Dollar Arabi, LA $1,892,677 $206 6.5%
Pep Boys Harrisburg, NC $1,740,000 $314 6.0%
Denny’s Warwick, RI $1,710,000 $428 6.2%
Burger King Crystal Lake, IL $1,650,000 $420 5.9%
Pizza Hut Coraopolis, PA $1,400,000 $389 6.5%
Jimmy John’s Austin, TX $1,175,000 $592 5.4%
NATIONAL NET-LEASED RETAIL REPORT
21
SECOND QUARTER 2016

MARKETING TEAM
Source: © 2015 Experian
PROPERTY NAME
#
CREATED ON OCTOBER 23, 2017
LOCATION OVERVIEWTENANT SUMMARYPRICING AND VALUATION MATRIX
PROPERTY NAMESHONEY'S
PRICING AND VALUATION MATRIX
PROPERTY NAME
SHONEY'S
22
DEMOGRAPHICS
1 Miles 3 Miles 5 Miles
POPULATION2021 Projection 641 3,971 10,191
2016 Estimate 628 3,890 10,056
2010 Census 629 3,897 10,048
2000 Census 603 3,929 10,127
INCOME
Average $52,253 $53,555 $55,959
Median $39,743 $38,569 $41,627
Per Capita $22,292 $23,387 $22,855
HOUSEHOLDS
2021 Projection 270 1,722 4,156
2016 Estimate 265 1,674 4,064
2010 Census 264 1,674 4,059
2000 Census 257 1,667 4,018
HOUSING
2016 $108,076 $109,098 $114,869
EMPLOYMENT
2016 Daytime Population 771 4,206 9,532
2016 Unemployment 6.39% 7.16% 6.28%2016 Median Time Traveled 21 22 24
RACE & ETHNICITY
White 86.60% 84.70% 86.99%
Native American 0.00% 0.00% 0.01%
African American 5.34% 10.34% 8.89%
Asian/Pacific Islander 4.08% 1.59% 0.89%

www.MarcusMillichap.com
Earle Hyman
Senior Managing Director Investments
Encino OfficeTel: (818) 212-2770Fax: (310) 388-0668
License: CA 00803521
Jody McKibben
Regional Manager
Nashville OfficeTel: (615) 997-2860Fax: (615) 997-2910
License: TN 307629
P R E S E N T E D B Y