shipper user manual for web-applicationcen.tgi.com.co/pltgweb/doc/pltgwebshipperopermanual.pdf ·...
TRANSCRIPT

Shipper User Manual for
Web-application

PipelineTransporter Shipper User Manual 2
SUBJECT : Shipper User Manual
AUTHOR : Product Development Team @ ESI
SYNOPSIS : This document is the shipper user manual for the PipelineTransporter product. It is going to be used by the shipper user.
VERSION : 21-Sept-2010 Updated for Revision 4.2
DISTRIBUTION : Shipper users of PLT web-application Energy Solutions
CIRCULATION : N/A
COPYRIGHT : This document and all accompanying material is the property of Energy Solutions International, Inc. It may not, in whole or in part, be distributed, copied manually or electronically, translated or reduced to any electronic or machine readable form without the authorization of Energy Solutions International, Inc.
PipelineTransporter Shipper User Manual 3
TABLE OF CONTENTS 1. INTRODUCTION............................................................................................................................... 7
1.1 GENERAL ....................................................................................................................................... 7 1.2 TERMS AND ABREVIATIONS ..................................................................................................... 8 1.3 SCREEN CONVENTIONS ............................................................................................................. 8 1.4 TRANSPORTER OVERVIEW ....................................................................................................... 8
2. STARTING AND STOPPING PLT ................................................................................................ 10
2.1 LOG INTO PLTWEB .................................................................................................................... 10 2.2 BROWSING THE MENU OPTIONS ............................................................................................ 11 2.3 EXITING THE SYSTEM .............................................................................................................. 12
3. SCREENS AND PROCESSES DESCRIPTION BY MODULES ................................................ 13
3.1 HOME PAGE ................................................................................................................................. 13 3.2 NOMINATIONS MODULE SCREENS AND PROCESSES ....................................................... 14
3.2.1 TRANSPORTATION REQUESTS ......................................................................................... 14 3.2.2 HOURLY NOMINATIONS ................................................................................................... 26
3.2.2.1 Flow Profiles ............................................................................................................................. 26 3.2.2.1.1 Flow Profile Creation ......................................................................................................... 26 3.2.2.1.2 Default Flow Profile Assignment ...................................................................................... 27
3.2.2.2 Working with Hourly Nominations ......................................................................................... 27 3.2.3 BLOCK NOMINATIONS ...................................................................................................... 29 3.2.4 NOMINATIONS DETAIL VIEW ........................................................................................... 34 3.2.5 SUMMARY ........................................................................................................................... 41 3.2.6 CAPACITY RELEASE .......................................................................................................... 46
3.3 ALLOCATION .............................................................................................................................. 49 3.3.1 PDA CONFIGURATION ...................................................................................................... 49 3.3.2 OPERATOR PROVIDED ALLOCATION............................................................................. 53 3.3.3 VIEW ALLOCATION RESULTS ........................................................................................... 58
3.4 PRE-INVOICING MODULE SCREENS AND PROCESSES ..................................................... 60 3.4.1 DYNAMIC VARIABLES........................................................................................................ 60 3.4.2 INVOICE DETAILS .............................................................................................................. 65 3.4.3 PREVIEW PPA ..................................................................................................................... 75
3.5 SUPERVISION MODULE SCREENS AND PROCESSES ......................................................... 79 3.5.1 REQUESTED, SCHEDULED, AND ALLOCATED GRAPHS ............................................. 79 3.5.2 CERTIFIED DATA GRAPH ................................................................................................. 84
3.6 VIEWS MODULE SCREENS AND PROCESSES ....................................................................... 89 3.6.1 CRYSTAL REPORT .............................................................................................................. 89 3.6.2 VIEW - STANDARD ............................................................................................................. 91
3.6.2.1 EXPRESSION SYNTAX .......................................................................................................... 96 3.6.3 OPEN SAVED VIEWS ......................................................................................................... 99
3.7 SECURITY MODULE .................................................................................................................100 3.7.1 CHANGE USER PASSWORD .............................................................................................100

PipelineTransporter Shipper User Manual 4
TABLE OF FIGURES Figure 1-1 Players in the PLT Process ................................................................................ 9 Figure 2-1 Web Application Login ................................................................................... 10 Figure 2-2 Web Application Menu Bar ........................................................................... 11 Figure 2-3 Menu options for the shipper .......................................................................... 11 Figure 2-4 Sign Off ........................................................................................................... 12 Figure 3-1 Home page with Informational Postings and Downloads ............................... 13 Figure 3-2 Home Page in Catalog mode ........................................................................... 14 Figure 3-3 Transportation Requests .................................................................................. 14 Figure 3-4 Control Panel used to filter ............................................................................. 15 Figure 3-5 Summary of values selected to filter data ....................................................... 16 Figure 3-6 Closer look at Transportation Requests .......................................................... 17 Figure 3-7 Accept Warnings ............................................................................................. 19 Figure 3-8 Exported Nominations in CSV format ............................................................ 20 Figure 3-9 CSV file edited for upload .............................................................................. 21 Figure 3-10 Saving the CSV file ....................................................................................... 21 Figure 3-11 Controls to Upload a CSV file ...................................................................... 22 Figure 3-12 Specifying the location of the CSV file ........................................................ 22 Figure 3-13 PLT ready to upload CSV file ....................................................................... 23 Figure 3-14 Warnings and Errors found during the Uploading process ........................... 24 Figure 3-15 Rules used to check nomination values ........................................................ 25 Figure 3-16 Send (Notification) ........................................................................................ 25 Figure 3-17 Hourly flow profile ....................................................................................... 26 Figure 3-18 Hourly default flow profile assignment ........................................................ 27 Figure 3-19 Hourly nominations ....................................................................................... 28 Figure 3-20 Block Nominations........................................................................................ 29 Figure 3-21 Control Panel used to filter ........................................................................... 30 Figure 3-22 Data Panel ..................................................................................................... 31 Figure 3-23 Errors/Warnings window .............................................................................. 33 Figure 3-24 Nominations Detail View .............................................................................. 34 Figure 3-25 Control Panel used to filter ........................................................................... 35 Figure 3-26 Save filter setting ........................................................................................... 37 Figure 3-27 Data Panel ..................................................................................................... 37 Figure 3-28 Copying nomination data to a future date range ........................................... 39 Figure 3-29 Warning and Errors screen ............................................................................ 39 Figure 3-30 Errors/Warnings window .............................................................................. 40 Figure 3-31 Summary ....................................................................................................... 41 Figure 3-32 Control Panel used to filter ........................................................................... 42 Figure 3-33 Summary of values selected to filter data ..................................................... 43 Figure 3-34.Closer look to the summary .......................................................................... 44 Figure 3-35 Summary - Details ......................................................................................... 45 Figure 3-36 Capacity Release ........................................................................................... 46 Figure 3-37 PDA Configuration ....................................................................................... 49 Figure 3-38 Detail of PDA Rule ....................................................................................... 52

PipelineTransporter Shipper User Manual 5
Figure 3-39 Assign Swing Contract .................................................................................. 52 Figure 3-40 Assign OBA Contract ................................................................................... 53 Figure 3-41 Operator Provided Allocation ....................................................................... 53 Figure 3-42 Summary of values selected to filter data ..................................................... 54 Figure 3-43 CSV file edited for upload ............................................................................ 55 Figure 3-44 Saving the CSV file ....................................................................................... 55 Figure 3-45 Controls to Upload a CSV file ...................................................................... 56 Figure 3-46 Specifying the location of the CSV file ........................................................ 56 Figure 3-47 PLT ready to upload CSV file ....................................................................... 57 Figure 3-48 View Allocation Results ............................................................................... 58 Figure 3-49 - Daily data of the contract point ................................................................... 59 Figure 3-50 Dynamic Variables ........................................................................................ 60 Figure 3-51 Control Panel used to filter ........................................................................... 61 Figure 3-52 Close look to Dynamic Variables ................................................................. 62 Figure 3-53 CSV file edited for upload ............................................................................ 63 Figure 3-54 Saving the CSV file ....................................................................................... 63 Figure 3-55 Controls to Upload a CSV file ...................................................................... 64 Figure 3-56 Specifying the location of the CSV file ........................................................ 64 Figure 3-57 Invoice Details .............................................................................................. 65 Figure 3-58 - Summary Information and Allocation Detail ............................................. 66 Figure 3-59 - Allocation Summary ................................................................................... 67 Figure 3-60 - Data view at contract point level ................................................................ 68 Figure 3-61 - Daily data of the contract point ................................................................... 69 Figure 3-62 – Manual Adjustment Summary ................................................................... 70 Figure 3-63 - Daily data of the contract manual adjustment ............................................ 70 Figure 3-64 – General Service Summary .......................................................................... 71 Figure 3-65 - Data view by service type ........................................................................... 71 Figure 3-66 - Daily data of the contract point ................................................................... 72 Figure 3-67 – Summary of Penalties and Other Charges ................................................. 72 Figure 3-68 - Data view by penalty type .......................................................................... 73 Figure 3-69 - Detail data of penalty type .......................................................................... 73 Figure 3-70 – Prior Period Adjustment Summary ............................................................ 74 Figure 3-71 - Daily data of the contract manual adjustment ............................................ 74 Figure 3-72 - Preview PPA ............................................................................................... 75 Figure 3-73 Changes in alloction ...................................................................................... 76 Figure 3-74 - Changes in daily penalty ............................................................................. 77 Figure 3-75 - Changes in monthly penalty ....................................................................... 78 Figure 3-76 - Changes in general services ........................................................................ 78 Figure 3-77 Requested, Scheduled, and Allocated Graphs ............................................... 79 Figure 3-78 A closer look to the information displayed in text format ............................ 80 Figure 3-79 Control Panel used to filter ........................................................................... 80 Figure 3-80 Summary of values selected to filter data ..................................................... 82 Figure 3-81 Closer look to Requested, Scheduled, and Allocated Graphs ....................... 82 Figure 3-82 Specialized menu to change graphic attributes ............................................ 83 Figure 3-83 Example of an edited graphic ........................................................................ 83 Figure 3-84 Certified Data Graph ..................................................................................... 84
PipelineTransporter Shipper User Manual 6
Figure 3-85 A closer look to the information displayed in text format ............................ 84 Figure 3-86 Control Panel used to filter .......................................................................... 85 Figure 3-87 Summary of values selected to filter data ..................................................... 86 Figure 3-88 Closer look to Certified Data Graph ............................................................. 87 Figure 3-89 Specialized menu to change graphic attributes ............................................. 87 Figure 3-90 Example of an edited graphic ........................................................................ 88 Figure 3-91 Crystal Report Tree ....................................................................................... 89 Figure 3-92 Crystal Report Parameters ............................................................................. 89 Figure 3-93 Certified Data Report .................................................................................... 90 Figure 3-94 View - Standard ............................................................................................. 91 Figure 3-95 Example of a standard view .......................................................................... 92 Figure 3-96 Fields ............................................................................................................. 92 Figure 3-97 Filter .............................................................................................................. 92 Figure 3-98 Calculated Columns ...................................................................................... 93 Figure 3-99 Show Summary ............................................................................................. 93 Figure 3-100 Save Definition............................................................................................ 93 Figure 3-101 Confirmation ............................................................................................... 93 Figure 3-102 Preview of the report to be printed .............................................................. 94 Figure 3-103 Selecting the Printer ................................................................................... 94 Figure 3-104 CSV File Download .................................................................................... 95 Figure 3-105 Saving CSV File .......................................................................................... 95 Figure 3-106 Download complete .................................................................................... 96 Figure 3-107 Viewing CSV File (downloaded report) ..................................................... 96 Figure 3-108 View – Open a saved view .......................................................................... 99 Figure 3-109 Example of a saved view ............................................................................. 99 Figure 3-110 Change Password ...................................................................................... 100
PipelineTransporter Shipper User Manual 7
1. INTRODUCTION
1.1 GENERAL
This document gives instructions on how to operate the PipelineTransporter web module through a browser. PipelineTransporter, PLT, is the software package developed by Energy Solutions International to help Gas Transportation Companies to automate their business processes. PLT has been designed to meet legal, commercial, and operational objectives for such Companies. PLT can be accessed through a web-enabled Internet platform developed as a part of this solution. The system interfaces with additional third party components, such as SCADA system, gas measurement system, modeling system, and billing systems. PLT also provides a mechanism to capture and submit gas nominations, balance shipper accounts and interface with the month-end billing system for invoice processing. The PLT software package consists of a number of automated processes and maintenance procedures separated into different modules, which are composed of a specific group of screens. This user manual focuses on:
• How to Log into the web system
• How to browse through the Menu Options
• Specific Group of Screen Descriptions including:
Nomination Module Screens
Allocation Module Screens
Pre- Invoicing Module Screens
Supervision Module Screens
Report Module Screens
Security Module Screens

PipelineTransporter Shipper User Manual 8
1.2 TERMS AND ABREVIATIONS
Delivery Point where the gas is extracted from the pipeline.
Nomination Amount of gas requested by the shipper for a given time period, typically 24 hours.
PipelineManager Software product developed by Energy Solutions International for real-time modeling control-room applications.
PipelineTransporter Software product developed by Energy Solutions International for managing gas transportation contracts
PLM Abbreviation for PipelineManager product.
PLT Abbreviation for PipelineTransporter product.
Receipt Point where gas enters the pipeline.
Transporter Pipeline Transportation Company, purchaser of the PLM/PLT products.
1.3 SCREEN CONVENTIONS
Several fields, buttons and procedures are common to many tables throughout the PLT system. The following convention applies to all screens unless otherwise indicated:
• The Update button updates the data changed into the database.
• The New button inserts new items into the database.
• The Delete button deletes a selected item from the database.
• The Cancel button rejects the changes without updating the database.
• The Close button closes the screen.
1.4 TRANSPORTER OVERVIEW
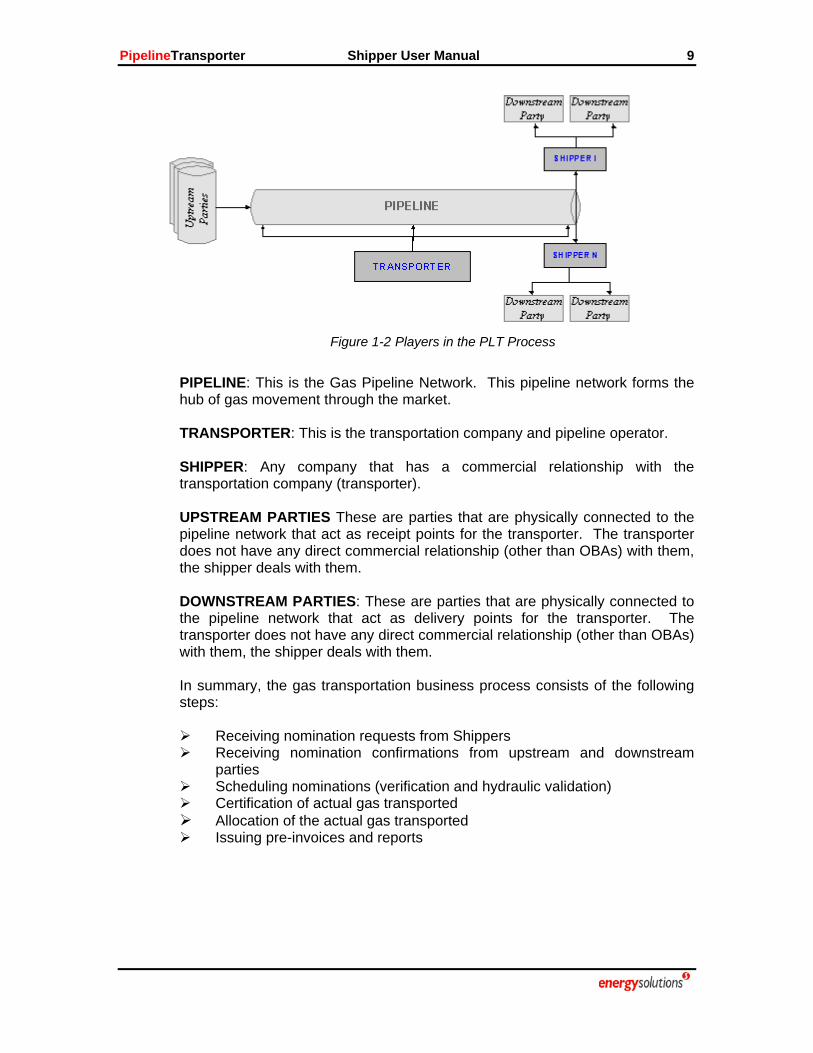
The transporter is a gas transportation company that provides transportation services to a number of shippers who buy gas from the upstream parties and sell it to the downstream parties. The next figure shows the main elements of the Transportation Business process, including the Shippers, Upstream Parties, and Downstream Parties.
PipelineTransporter Shipper User Manual 9
Figure 1-2 Players in the PLT Process
PIPELINE: This is the Gas Pipeline Network. This pipeline network forms the hub of gas movement through the market. TRANSPORTER: This is the transportation company and pipeline operator. SHIPPER: Any company that has a commercial relationship with the transportation company (transporter). UPSTREAM PARTIES These are parties that are physically connected to the pipeline network that act as receipt points for the transporter. The transporter does not have any direct commercial relationship (other than OBAs) with them, the shipper deals with them. DOWNSTREAM PARTIES: These are parties that are physically connected to the pipeline network that act as delivery points for the transporter. The transporter does not have any direct commercial relationship (other than OBAs) with them, the shipper deals with them. In summary, the gas transportation business process consists of the following steps:
Receiving nomination requests from Shippers Receiving nomination confirmations from upstream and downstream
parties Scheduling nominations (verification and hydraulic validation) Certification of actual gas transported Allocation of the actual gas transported Issuing pre-invoices and reports

PipelineTransporter Shipper User Manual 10
2. STARTING AND STOPPING PLT
The Pipeline Transporter System PLT has both a Windows and a Web module. This section will explain how to enter, browse and exit from the Web application. The information related with the Windows component can be found in the PLTWin User’s Manual.
2.1 LOG INTO PLTWEB
The Figure 2-1 Web Application Login shows two fields: Username and Password. It also has a check box to connect to the archive database.
Username: This is the identification name assigned for the user by the system administrator.
Password: This is an account password for the user. It can contain letters and numbers.
Check Box*: This is the “Connect to historical database” indicator, which will identify the database to be connected to. If it remains unchecked it will take the user to the live database, which will have the last two years of information. If the user wants to query historic data more than two years old (archive database) then the user should select the check box.
Figure 2-1 Web Application Login
Note*: When the “archive” database is selected only the reports module will be available.

PipelineTransporter Shipper User Manual 11
2.2 BROWSING THE MENU OPTIONS
Figure 2-2 Web Application Menu Bar
In order to browse through the menu bar it is necessary to click at the top level to expand a menu option. Then it is possible to browse through the submenus until the desired menu item appears and click on it.
The whole set of menu, submenus and options normally available for the shippers are presented in the following diagram:
Figure 2-3 Menu options for the shipper
The following are the main options:
Nominations: This option has all the information related to the shipper nominations. To know more about this functionality, refer to the respective section.

PipelineTransporter Shipper User Manual 12
Allocation: This option lets the user to configure the allocation rules, input allocation data for each of the point he/she operates. To learn how to use this module, refer to the respective section.
Supervision: This option has all the information related to the visual information (graphics) available to supervise the gas flowing thru the system. To know more about this functionality, refer to the respective section.
Views: This menu option has all the result data generated. From here all data views are available to the end user. To learn how to use this module, refer to the respective section.
Security: This option lets the user change the account’s password. To know more about this functionality, refer to the respective section.
Help: This option lets the user view the Shipper/Operator online manual
2.3 EXITING THE SYSTEM
To exit from the Web application click on the “Sign Off” option available in the menu bar.
Figure 2-4 Sign Off
PipelineTransporter Shipper User Manual 13
3. SCREENS AND PROCESSES DESCRIPTION BY MODULES
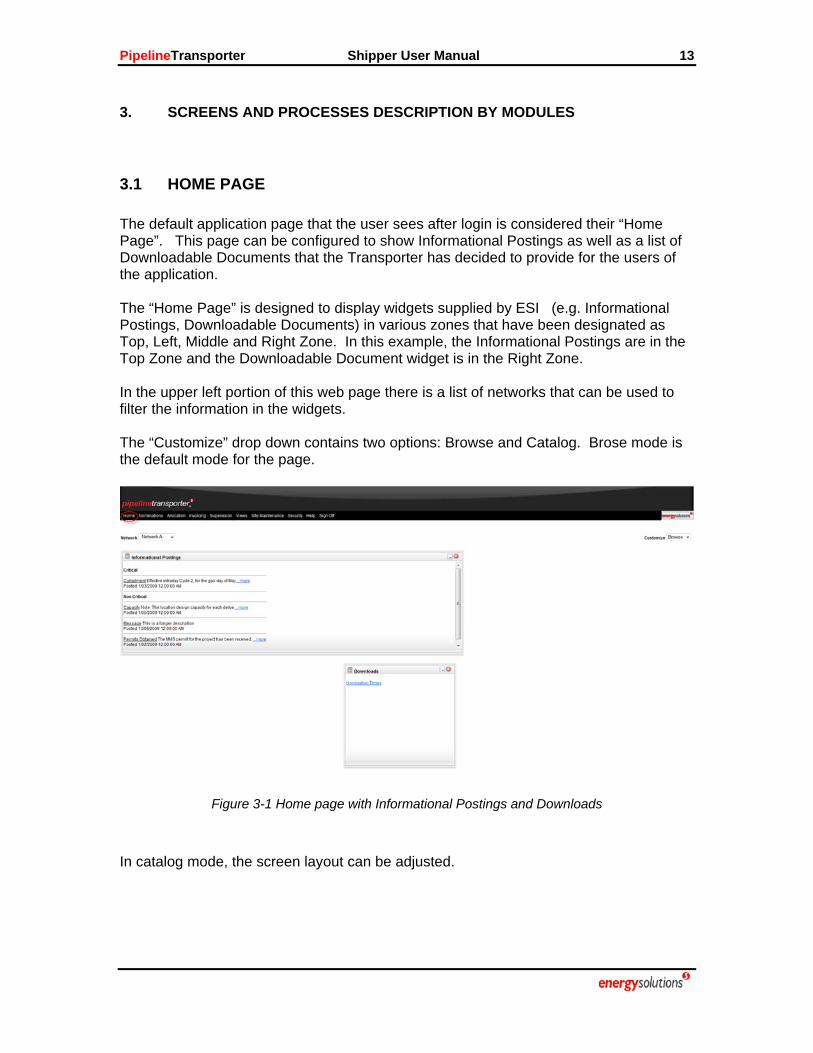
3.1 HOME PAGE The default application page that the user sees after login is considered their “Home Page”. This page can be configured to show Informational Postings as well as a list of Downloadable Documents that the Transporter has decided to provide for the users of the application. The “Home Page” is designed to display widgets supplied by ESI (e.g. Informational Postings, Downloadable Documents) in various zones that have been designated as Top, Left, Middle and Right Zone. In this example, the Informational Postings are in the Top Zone and the Downloadable Document widget is in the Right Zone. In the upper left portion of this web page there is a list of networks that can be used to filter the information in the widgets. The “Customize” drop down contains two options: Browse and Catalog. Brose mode is the default mode for the page.
Figure 3-1 Home page with Informational Postings and Downloads
In catalog mode, the screen layout can be adjusted.
PipelineTransporter Shipper User Manual 14
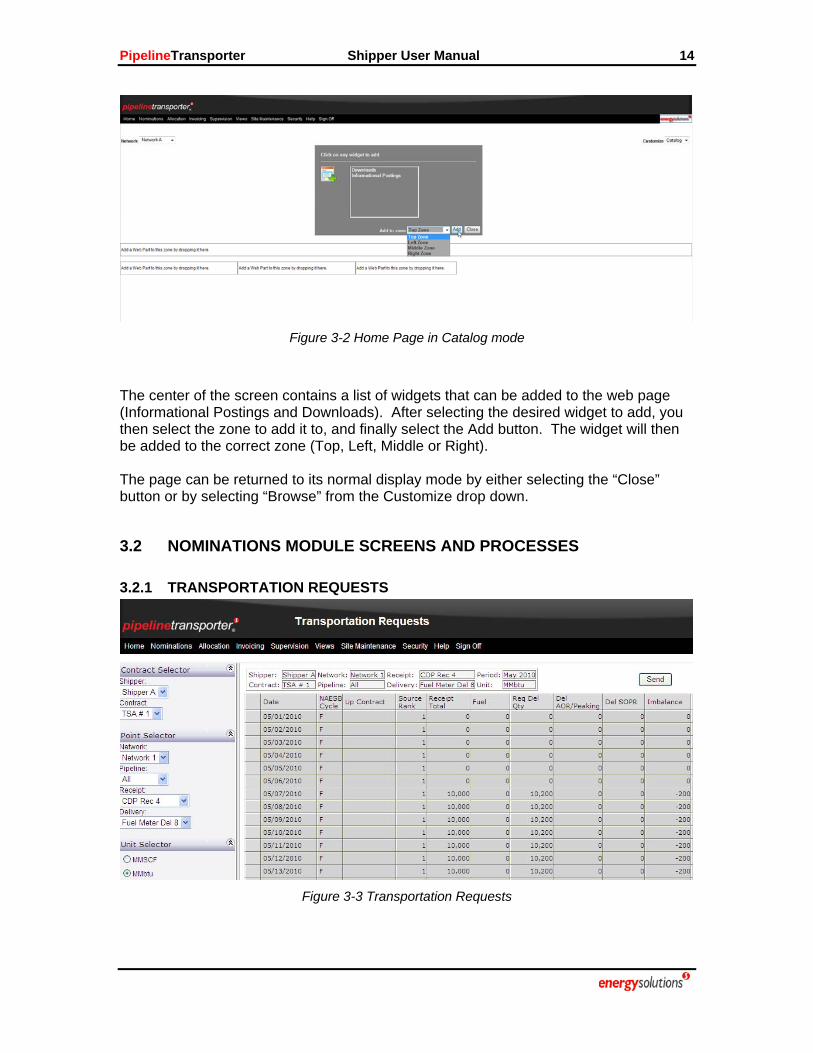
Figure 3-2 Home Page in Catalog mode
The center of the screen contains a list of widgets that can be added to the web page (Informational Postings and Downloads). After selecting the desired widget to add, you then select the zone to add it to, and finally select the Add button. The widget will then be added to the correct zone (Top, Left, Middle or Right). The page can be returned to its normal display mode by either selecting the “Close” button or by selecting “Browse” from the Customize drop down.
3.2 NOMINATIONS MODULE SCREENS AND PROCESSES
3.2.1 TRANSPORTATION REQUESTS
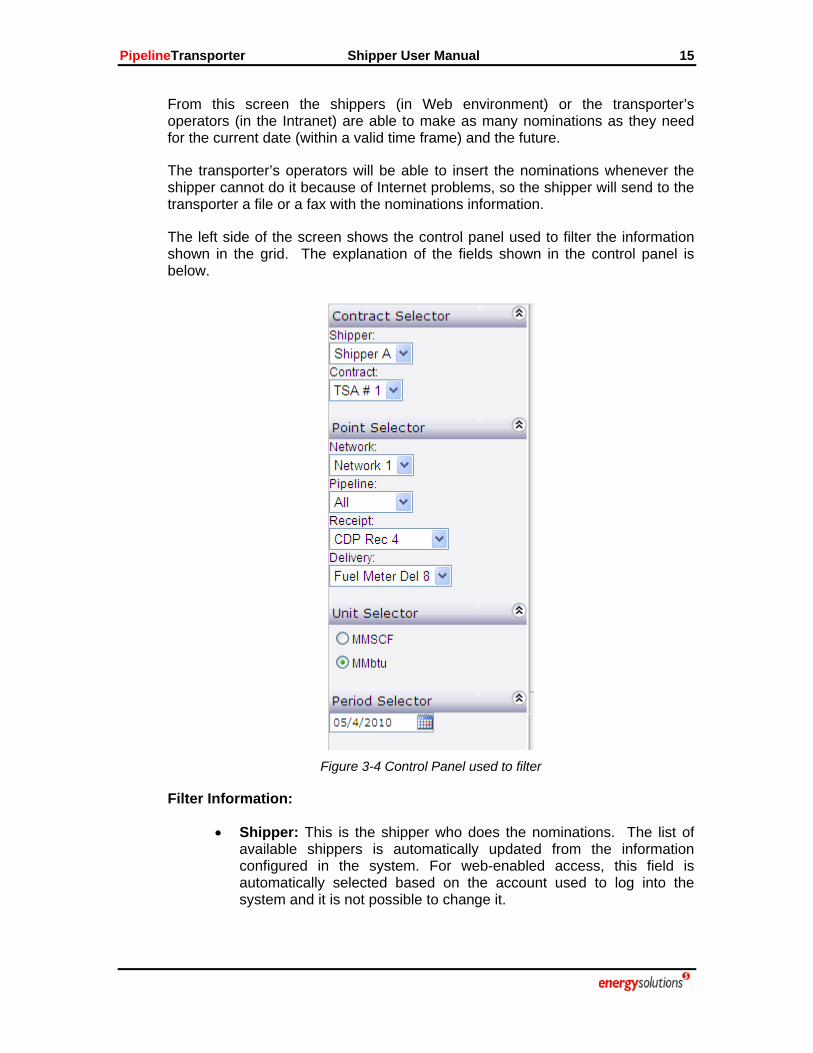
Figure 3-3 Transportation Requests
PipelineTransporter Shipper User Manual 15
From this screen the shippers (in Web environment) or the transporter’s operators (in the Intranet) are able to make as many nominations as they need for the current date (within a valid time frame) and the future.
The transporter’s operators will be able to insert the nominations whenever the shipper cannot do it because of Internet problems, so the shipper will send to the transporter a file or a fax with the nominations information.
The left side of the screen shows the control panel used to filter the information shown in the grid. The explanation of the fields shown in the control panel is below.
Figure 3-4 Control Panel used to filter
Filter Information:
• Shipper: This is the shipper who does the nominations. The list of available shippers is automatically updated from the information configured in the system. For web-enabled access, this field is automatically selected based on the account used to log into the system and it is not possible to change it.

PipelineTransporter Shipper User Manual 16
• Contract: This is the name of the contract. The list of available contracts is automatically updated based on the shipper selected.
• Network: This is the name of the gas pipeline network. This field is updated automatically based on the contract selected.
• Pipeline: This is the name of the pipeline. The list of available pipelines is automatically updated based on the contract/network selected.
• Receipt: This is the receipt point where the gas is going to be received (into the pipeline system). The list of possible receipt points is updated automatically based on the contract and phase selected.
• Delivery: This is the delivery point where the gas is going to be delivered (out of the pipeline system). The list of possible delivery points is automatically updated based on the contract and phase selected.
• Unit: This is the unit used to express all the gas amounts. The system provides radio buttons to select either the system standard volumetric unit (i.e. MSCF) or the system standard energy unit (i.e. MMbtu).
• Date: This is the selected month. The user can select any date using a calendar provided by the system.
The right side of the screen shows the data panel used to display the grid and also includes other useful controls.
A summary of the values used to filter the information displayed in the grid is at the top of the grid. The boxes shown in this section are explained below:
Figure 3-5 Summary of values selected to filter data
Field Information:
• Shipper: This is the shipper selected. Read-only value.
• Contract: This is the contract selected. Read-only value.
• Network: This is the network selected. Read-only value.
• Pipeline: This is the pipeline selected. Read-only value.
• Receipt: This is the receipt point selected. Read-only value.
PipelineTransporter Shipper User Manual 17
• Delivery: This is the delivery point selected. Read-only value.
• Date: This is the date representing the month selected. Read-only value.
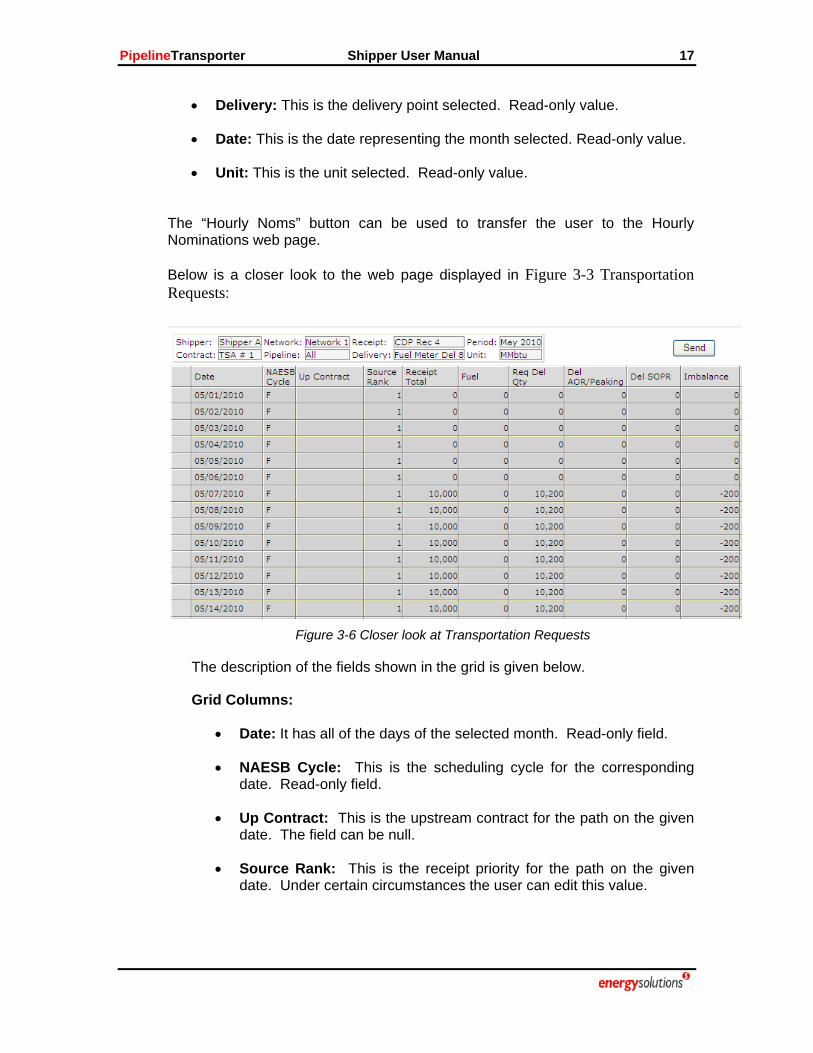
• Unit: This is the unit selected. Read-only value. The “Hourly Noms” button can be used to transfer the user to the Hourly Nominations web page. Below is a closer look to the web page displayed in Figure 3-3 Transportation Requests:
Figure 3-6 Closer look at Transportation Requests
The description of the fields shown in the grid is given below.
Grid Columns:
• Date: It has all of the days of the selected month. Read-only field.
• NAESB Cycle: This is the scheduling cycle for the corresponding date. Read-only field.
• Up Contract: This is the upstream contract for the path on the given date. The field can be null.
• Source Rank: This is the receipt priority for the path on the given date. Under certain circumstances the user can edit this value.
PipelineTransporter Shipper User Manual 18
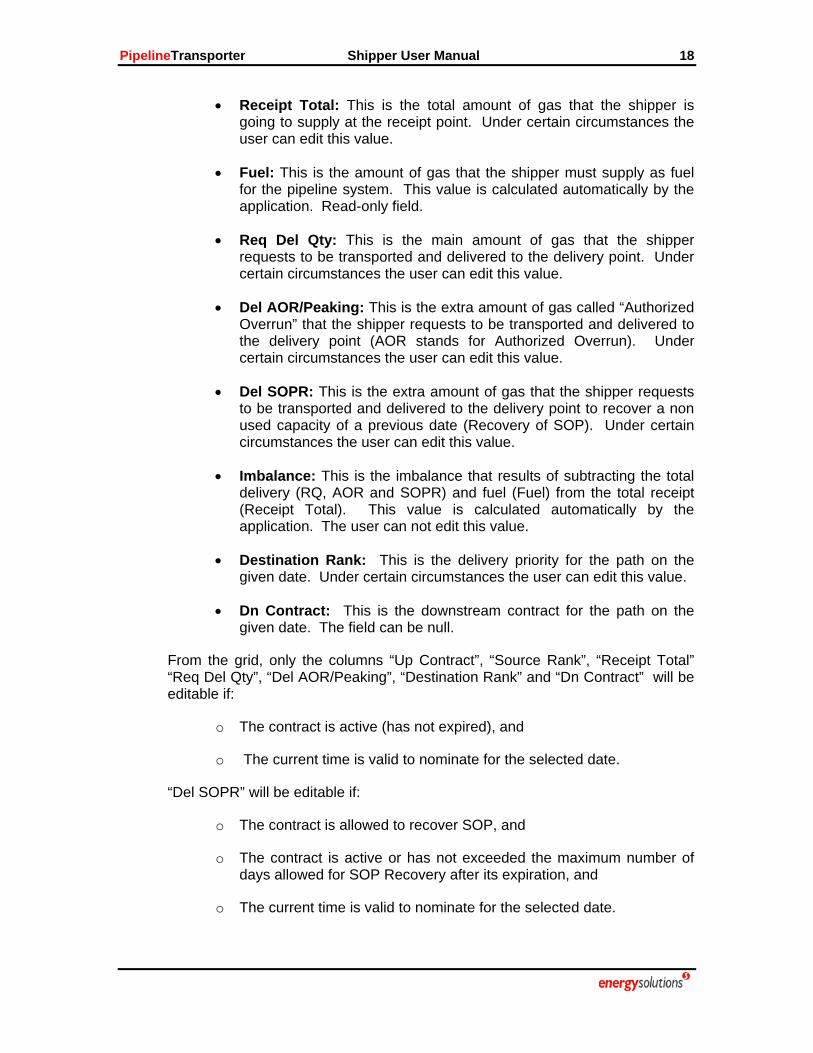
• Receipt Total: This is the total amount of gas that the shipper is going to supply at the receipt point. Under certain circumstances the user can edit this value.
• Fuel: This is the amount of gas that the shipper must supply as fuel for the pipeline system. This value is calculated automatically by the application. Read-only field.
• Req Del Qty: This is the main amount of gas that the shipper requests to be transported and delivered to the delivery point. Under certain circumstances the user can edit this value.
• Del AOR/Peaking: This is the extra amount of gas called “Authorized Overrun” that the shipper requests to be transported and delivered to the delivery point (AOR stands for Authorized Overrun). Under certain circumstances the user can edit this value.
• Del SOPR: This is the extra amount of gas that the shipper requests to be transported and delivered to the delivery point to recover a non used capacity of a previous date (Recovery of SOP). Under certain circumstances the user can edit this value.
• Imbalance: This is the imbalance that results of subtracting the total delivery (RQ, AOR and SOPR) and fuel (Fuel) from the total receipt (Receipt Total). This value is calculated automatically by the application. The user can not edit this value.
• Destination Rank: This is the delivery priority for the path on the given date. Under certain circumstances the user can edit this value.
• Dn Contract: This is the downstream contract for the path on the given date. The field can be null.
From the grid, only the columns “Up Contract”, “Source Rank”, “Receipt Total” “Req Del Qty”, “Del AOR/Peaking”, “Destination Rank” and “Dn Contract” will be editable if:
o The contract is active (has not expired), and
o The current time is valid to nominate for the selected date.
“Del SOPR” will be editable if:
o The contract is allowed to recover SOP, and
o The contract is active or has not exceeded the maximum number of days allowed for SOP Recovery after its expiration, and
o The current time is valid to nominate for the selected date.
PipelineTransporter Shipper User Manual 19
Editing values in the Grid
The buttons “Update” and “Cancel” shown at the bottom of the grid (see Figure 3-6 Closer look at Transportation Requests) are used when the shipper is editing values directly in the screen. These buttons are disabled by default. After a value is edited in the grid then both buttons are enabled to allow the user to submit the changes to the database (clicking on Update) or to loose the changes and restore the original values (clicking on Cancel). All the new values submitted to the database are validated. This occurs when the grid is modified directly and also when the nominations are uploaded from a CSV file as will be explained in the coming sections. The validation process uses predefined rules to find values that must be rejected (errors) or must be warned (warnings). The list of predefined rules is presented at the end of this chapter.
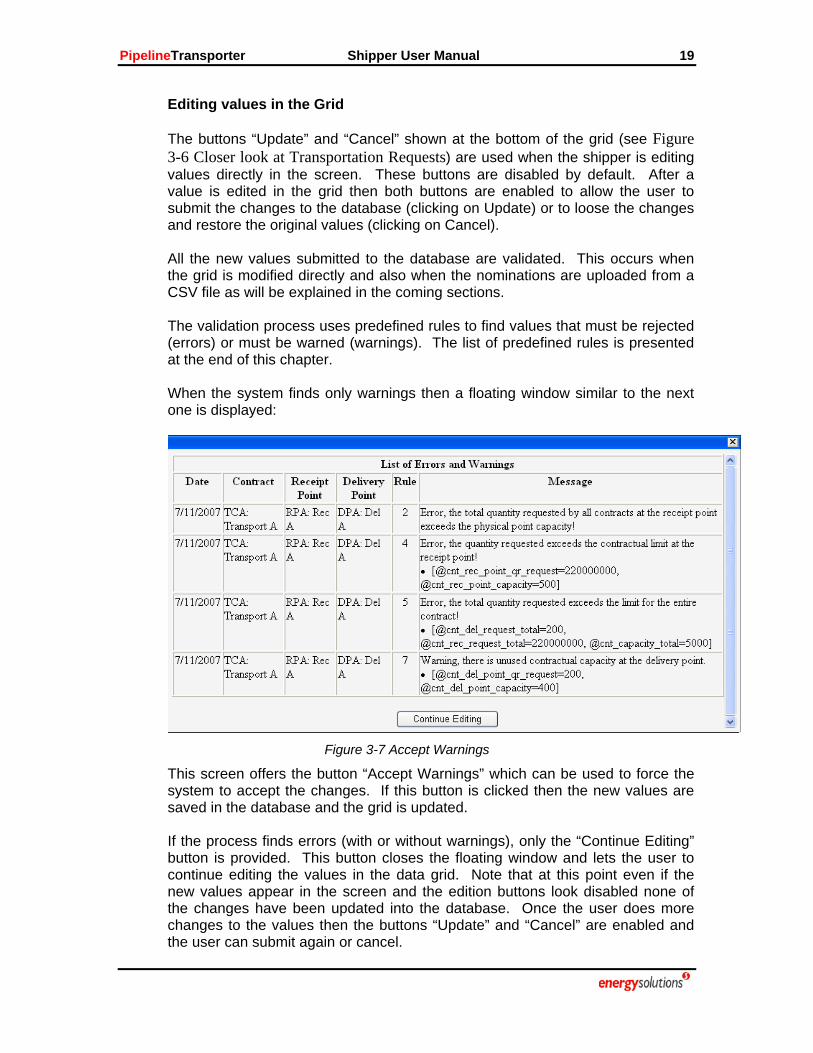
When the system finds only warnings then a floating window similar to the next one is displayed:
Figure 3-7 Accept Warnings
This screen offers the button “Accept Warnings” which can be used to force the system to accept the changes. If this button is clicked then the new values are saved in the database and the grid is updated. If the process finds errors (with or without warnings), only the “Continue Editing” button is provided. This button closes the floating window and lets the user to continue editing the values in the data grid. Note that at this point even if the new values appear in the screen and the edition buttons look disabled none of the changes have been updated into the database. Once the user does more changes to the values then the buttons “Update” and “Cancel” are enabled and the user can submit again or cancel.
PipelineTransporter Shipper User Manual 20
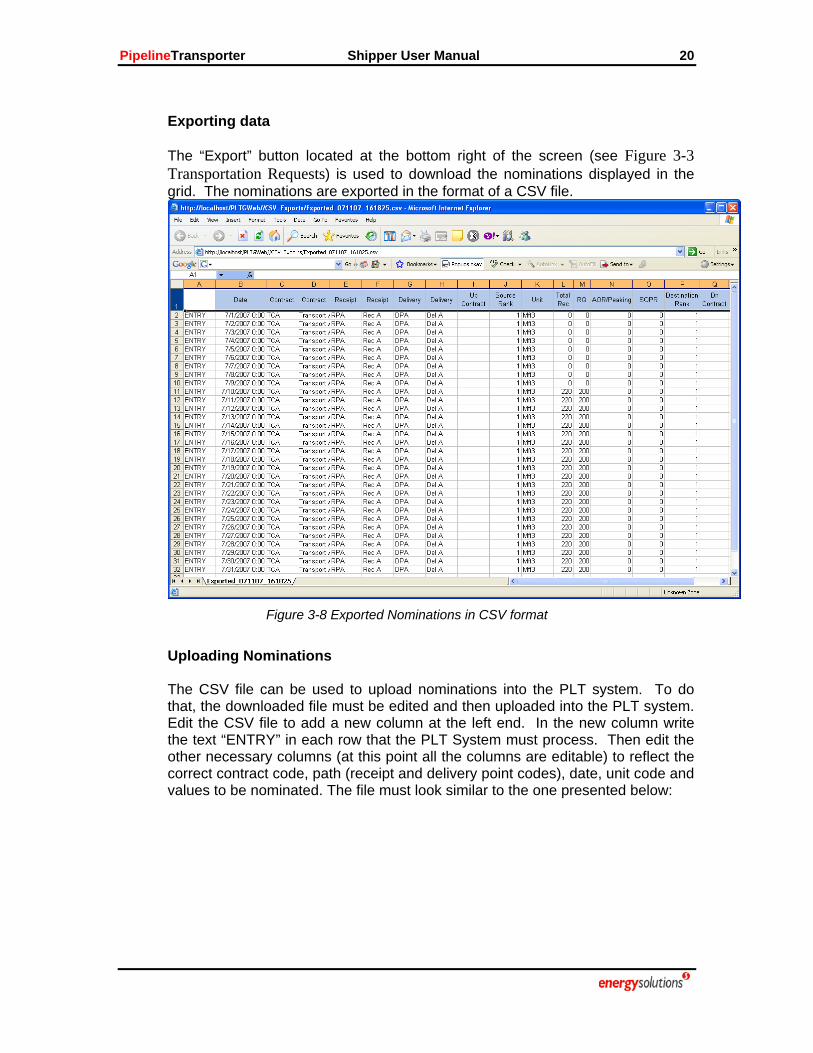
Exporting data
The “Export” button located at the bottom right of the screen (see Figure 3-3 Transportation Requests) is used to download the nominations displayed in the grid. The nominations are exported in the format of a CSV file.
Figure 3-8 Exported Nominations in CSV format
Uploading Nominations The CSV file can be used to upload nominations into the PLT system. To do that, the downloaded file must be edited and then uploaded into the PLT system. Edit the CSV file to add a new column at the left end. In the new column write the text “ENTRY” in each row that the PLT System must process. Then edit the other necessary columns (at this point all the columns are editable) to reflect the correct contract code, path (receipt and delivery point codes), date, unit code and values to be nominated. The file must look similar to the one presented below:

PipelineTransporter Shipper User Manual 21
Figure 3-9 CSV file edited for upload
Now, save the changes to a CSV file. Remember to check that the Excel uses the type “CSV (MS-DOS)” and the extension “CSV”. This is illustrated in the following diagram:
Figure 3-10 Saving the CSV file
PipelineTransporter Shipper User Manual 22
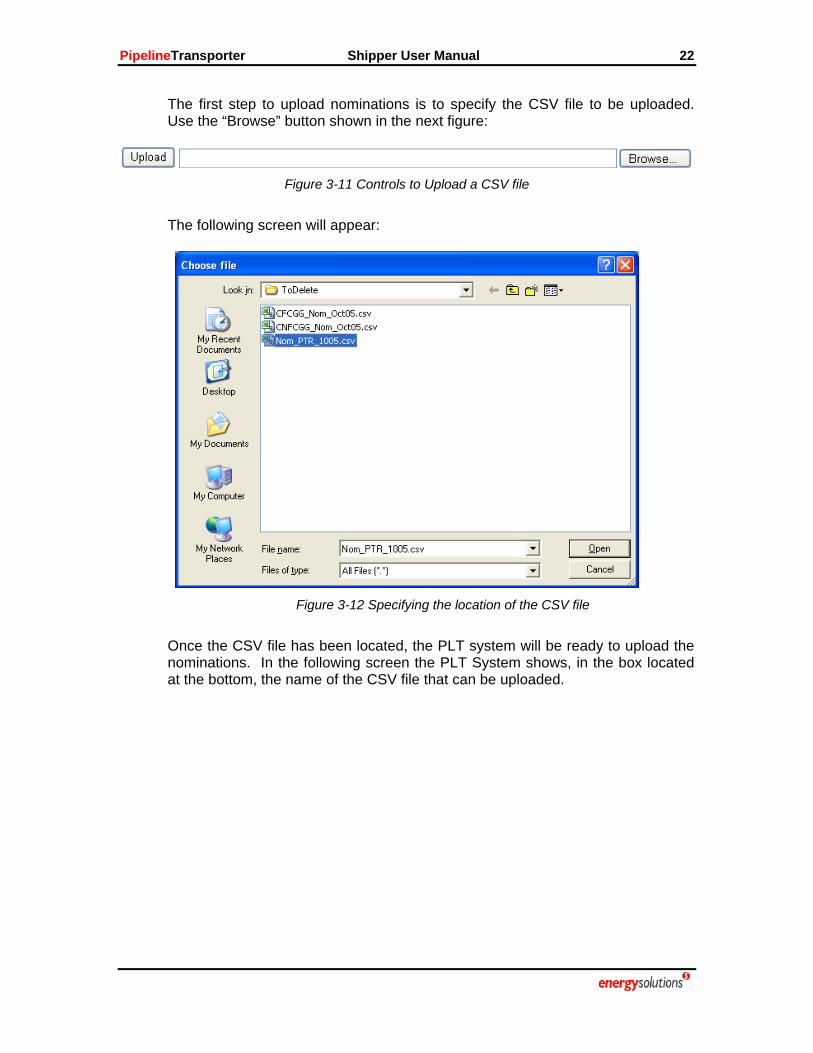
The first step to upload nominations is to specify the CSV file to be uploaded. Use the “Browse” button shown in the next figure:
Figure 3-11 Controls to Upload a CSV file
The following screen will appear:
Figure 3-12 Specifying the location of the CSV file
Once the CSV file has been located, the PLT system will be ready to upload the nominations. In the following screen the PLT System shows, in the box located at the bottom, the name of the CSV file that can be uploaded.

PipelineTransporter Shipper User Manual 23
Figure 3-13 PLT ready to upload CSV file
To start the upload process, click the “Upload” button located on the left side of the box showing the path and name of the CSV file. The system will take some time to upload and process the nominations. A validation process is run every time new nominations are loaded. The validation checks some predefined rules to find situations that must be rejected (errors) or must be warned (warnings). At the end, a floating window will arise if there were any errors or warnings found during the validation process. If all the nominations can be loaded without warnings then the data grid is refreshed to show any possible change. If there were warnings or errors found during the loading process then a window similar to the next one is presented.

PipelineTransporter Shipper User Manual 24
Figure 3-14 Warnings and Errors found during the Uploading process
All the values presented with warnings are updated in the database and all the values presented with errors are rejected. To see details keep the cursor on the corresponding “Message” cell until a small box appears in the screen specifying the found values. Predefined Rules to Validate Nominations Below is the list of nomination rules defined in the PLT System. Rules can be activated/inactivated to achieve business logic:
Rule 1. IF (@cnt_del_point_request > @physical_point_capacity) Error, the quantity requested at the contract delivery point exceeds the physical point capacity! Rule 2: IF (@cnt_rec_point_request > @physical_point_capacity) Error, the quantity requested at the contract receipt point exceeds the physical point capacity! Rule 3: IF (@cnt_del_point_request > @cnt_point_capacity) Error, the volume requested exceeds the contractual limit at the delivery point! Rule 4: IF (@cnt_rec_point_request > @cnt_point_capacity) Error, the volume requested exceeds the contractual limit at the receipt point! Rule 5: IF ((@cnt_del_request_total > @cnt_capacity_total)OR -- (@cnt_rec_request_total > @cnt_capacity_total)) Error, the total volume requested exceeds the limit for the entire contract! Rule 6: IF ((@cnt_del_point_qr_request < @cnt_point_capacity) AND (@cnt_del_point_ea_request > 0.0) Error, Overrun can not be requested at the Delivery Point if there is unused contractual point capacity! Rule 7: IF (@cnt_del_point_qr_request < @cnt_point_capacity) Warning, there is unused contractual capacity at the delivery point.

PipelineTransporter Shipper User Manual 25
Rule 8: IF (@cnt_rec_point_request < @cnt_point_capacity) Warning, there is unused contractual capacity at the receipt point. Rule 9: IF ((@cnt_is_makeup_allowed = 0) AND (@nom_sop_request > 0.0)) Error, there is SOP Recovery nominated but Makeup is not allowed for the contract! Rule 10: IF ((@cnt_is_makeup_allowed = 1) AND (@cnt_total_sop_request > @cnt_sop_acc_balance)) Error, the SOP Recovery nominated is greater than the SOP Recovery Account balance! Rule 11: IF ((@nom_date > @cnt_exp_date) AND -- ((@cnt_del_point_qr_request > 0.0) OR (@cnt_del_point_ea_request > 0.0)) Error, attempting to insert a nomination for a date after the contract expiration date. Rule 12: IF (@cnt_del_request_total (exclude the EA)> @cnt_capacity_total) Error, the total volume requested exceeds the limit for the entire contract! Use the AOR service for peaking purposes. Rule 13: IF ((@cnt_del_point_qr_request < @cnt_capacity) AND (@cnt_del_point_ea_request > 0.0) Error, Overrun can not be requested at the Delivery Point if there is unused contractual capacity!
Figure 3-15 Rules used to check nomination values
Send Notification The “Send” button located on the top right corner of the data panel (see Figure 3-6 Closer look at Transportation Requests) can be used by the shipper to send a notification. The notification is an email sent to the Scheduler confirming that the nomination process has been successfully completed by the shipper for the contract, transportation path and month selected. In response, the system will generate a transaction number which can be used for tracking purposes. The next screen shows an example of the kind of response that a user can receive when uses the “Send” button.
Figure 3-16 Send (Notification)
PipelineTransporter Shipper User Manual 26
3.2.2 HOURLY NOMINATIONS Nominations in the Pipeline Transporter system always start with a daily nomination. If the network being nominated has been configured to support hourly nominations then there are some additional tools at your disposal. The Transporter will determine whether or not the network requires hourly nominations.
3.2.2.1 Flow Profiles Pipeline Transporter uses flow profiles to distribute the daily nomination across the hourly periods of the gas day. In the absence of a designated default flow profile for the contract point the system will create an even distribution across the 24 hour period. In other words, the system will assign 1/24th of the daily nomination to each of the 24 periods that make up the gas day.
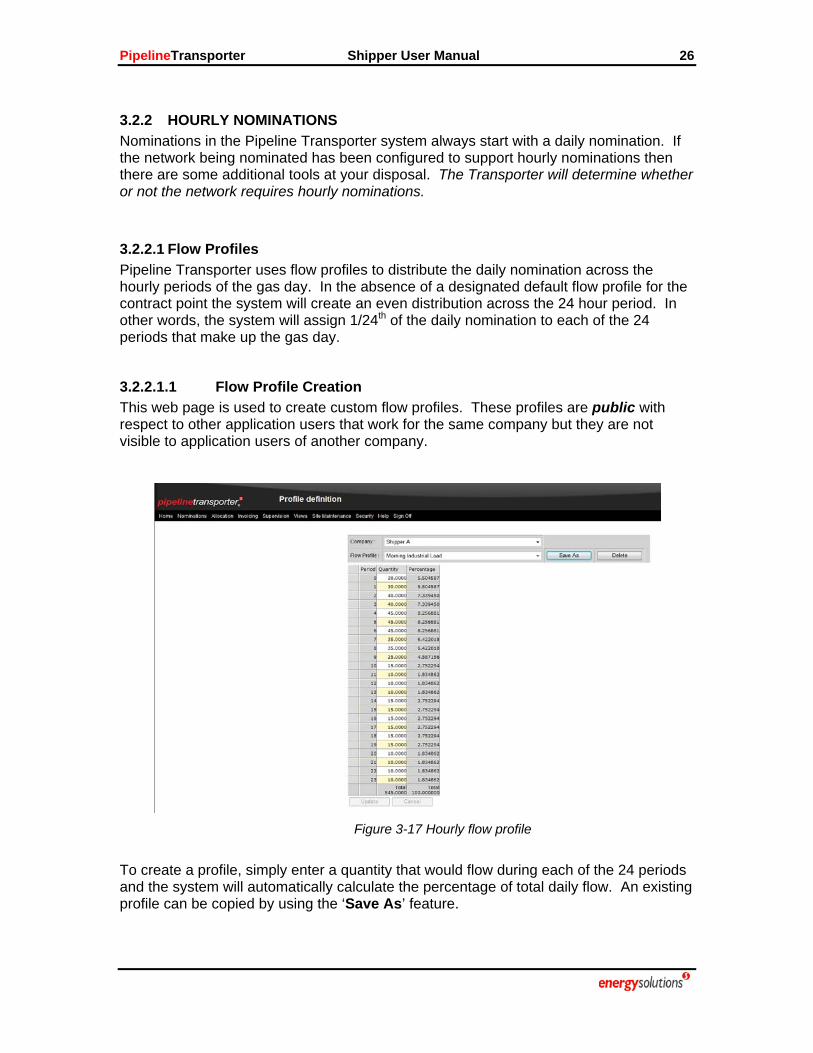
3.2.2.1.1 Flow Profile Creation This web page is used to create custom flow profiles. These profiles are public with respect to other application users that work for the same company but they are not visible to application users of another company.
Figure 3-17 Hourly flow profile
To create a profile, simply enter a quantity that would flow during each of the 24 periods and the system will automatically calculate the percentage of total daily flow. An existing profile can be copied by using the ‘Save As’ feature.

PipelineTransporter Shipper User Manual 27
3.2.2.1.2 Default Flow Profile Assignment This web page is used to assign a default flow profile to a contract point. If an even distribution is desired then no default flow profile assignment is necessary.
Figure 3-18 Hourly default flow profile assignment
After creating the profile it can be assigned as the default distribution profile for one or more points. It can also be used for points in different contracts.
3.2.2.2 Working with Hourly Nominations If the daily nomination passes validation then it is automatically converted into hourly nominations by use of either the default profile or by calculating an even distribution in the absence of a default profile assignment. In the event that the hourly nomination fails to successfully validate (min/max hourly contract limits or min/max hourly physical point limits) then it will not be saved to the database; however, the daily nomination will be saved to the database. All 24 periods must successfully validate before the application will save the hourly distribution to the database. The user must either change the daily nomination or manually create hourly nominations that will successfully validate. If after both the daily and hourly nominations have been successfully entered into the system and validated, the shipper changes the daily nomination the application will recalculate the hourly distribution by first calculating a dynamic profile based on the current hourly distribution and then distribute the new daily nomination using that dynamic profile. Additional logic exists for intraday nominations. The Transporter will assign an intraday nomination lead time to each network. This represents the number of hours that are allowed to elapse before the transporter is required to adjust the flow rate at the point. The application will take this lead time into account when calculating the dynamic profile. It will use the old profile to calculate how much gas should have flowed prior to the change (including lead time) and calculate the remaining flow quantity based on the new proposed nomination. This quantity will then be distributed amongst the remaining hourly periods in the gas day by calculating a dynamic profile for just the remaining periods. In order to do this, it aggregates the remaining profile percentages and then normalizes them to 100%. The user is also prohibited from making manual changes during periods that have already elapsed or are part of the lead time period.

PipelineTransporter Shipper User Manual 28
The shipper also has the ability to apply a profile to one or more days without changing the default profile assignment. First select the profile from the drop down list, then select the columns (multiple column selects are allowed) that you want to apply the profile too and then press the ‘Apply Profile’ button. The results are not validated until you click the ‘Update’ button.
Figure 3-19 Hourly nominations
In the previous image the current date is 09/09/2009 which makes it an example of an intraday nomination edit and that is why only some of the periods for that gas day are editable.
Filter Information:
• Shipper: This is the shipper who does the nominations. The list of available shippers is automatically updated from the information configured in the system. For web-enabled access, this field is automatically selected based on the account used to log into the system and it is not possible to change it.
• Contract: This is the name of the contract. The list of available contracts is automatically updated based on the shipper selected.
• Network: This is the name of the gas pipeline network. This field is updated automatically based on the contract selected.
• Pipeline: This is the name of the pipeline. The list of available pipelines is automatically updated based on the contract/network selected.

PipelineTransporter Shipper User Manual 29
• Receipt: This is the receipt point where the gas is going to be received (into the pipeline system). The list of possible receipt points is updated automatically based on the contract selected.
• Delivery: This is the delivery point where the gas is going to be delivered (out of the pipeline system). The list of possible delivery points is automatically updated based on the contract selected.
• Unit: This is the unit used to express all the gas amounts. The system provides radio buttons to select either the system standard volumetric unit (i.e. MMSCF) or the system standard energy unit (i.e. MMbtu).
• Date: This is the selected month.
Grid Columns:
• Period: This column contains 24 rows which represent the 24 periods of the gas day.
• Dates: There will be one column for each day of the month (as defined by the period selector in the filter on the left side of the display). The aggregate of the 24 periods will appear as the total at the bottom of the column.
3.2.3 BLOCK NOMINATIONS
Figure 3-20 Block Nominations
Block Nominations provides the ability to enter block nominations using as few keystrokes as possible. From this screen, the shippers (in Web environment) or the transporter’s operators (in the Intranet) are able to input duplicate nominations for different contract paths based on the specified Start Date and End Date.

PipelineTransporter Shipper User Manual 30
The left side of the screen shows the control panel used to populate block nominations shown in the grid. The explanation of the fields shown in the control panel is below.
Figure 3-21 Control Panel used to filter
Filter Information:
• Shipper: This is the shipper who does the nominations. The list of available shippers is automatically updated from the information configured in the system. For web-enabled access, this field is automatically selected based on the account used to log into the system and it is not possible to change it. Data grid will be cleared as a new shipper is selected.
• Contract: This is the name of the contract. The list of available contracts is automatically updated based on the selected shipper.
• Receipt: This is the receipt point where the gas is going to be received (into the pipeline system). The list of possible receipt points is updated automatically based on the selected contract.
• Delivery: This is the delivery point where the gas is going to be delivered (out of the pipeline system). The list of possible delivery points is automatically updated based on the selected contract.
• Select All: Click this to select all listed delivery points.
PipelineTransporter Shipper User Manual 31
• Create: This button is used to add new block nominations to the grid panel on the right.
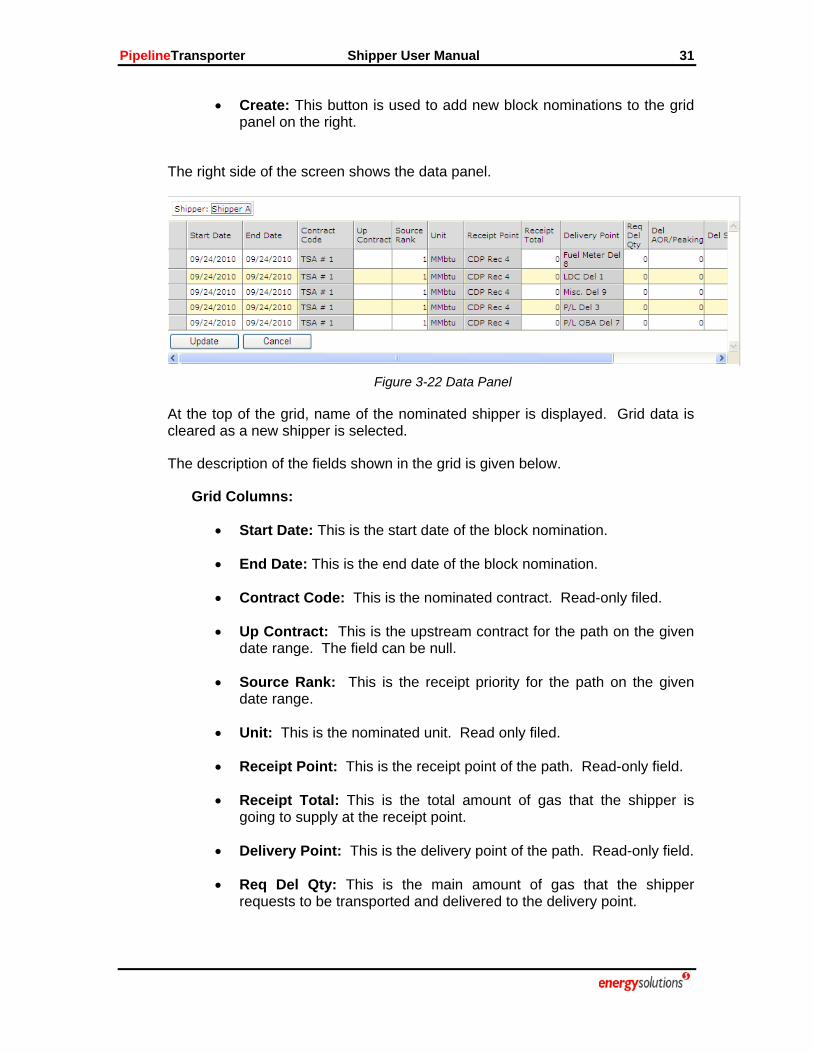
The right side of the screen shows the data panel.
Figure 3-22 Data Panel
At the top of the grid, name of the nominated shipper is displayed. Grid data is cleared as a new shipper is selected.
The description of the fields shown in the grid is given below.
Grid Columns:
• Start Date: This is the start date of the block nomination.
• End Date: This is the end date of the block nomination.
• Contract Code: This is the nominated contract. Read-only filed.
• Up Contract: This is the upstream contract for the path on the given date range. The field can be null.
• Source Rank: This is the receipt priority for the path on the given date range.
• Unit: This is the nominated unit. Read only filed.
• Receipt Point: This is the receipt point of the path. Read-only field.
• Receipt Total: This is the total amount of gas that the shipper is going to supply at the receipt point.
• Delivery Point: This is the delivery point of the path. Read-only field.
• Req Del Qty: This is the main amount of gas that the shipper requests to be transported and delivered to the delivery point.

PipelineTransporter Shipper User Manual 32
• Del AOR/Peaking: This is the extra amount of gas called “Authorized Overrun” that the shipper requests to be transported and delivered to the delivery point (AOR stands for Authorized Overrun).
• Del SOPR: This is the extra amount of gas that the shipper requests to be transported and delivered to the delivery point to recover a non used capacity of a previous date (Recovery of SOP).
• Destination Rank: This is the delivery priority for the path on the given date range.
• Dn Contract: This is the downstream contract for the path on the given date range. The field can be null.
The “Hourly Noms” button can be used to transfer the user to the Hourly Nominations web page. The buttons “Update” and “Cancel” shown at the bottom of the grid are enabled when there are new block nominations or modifications in the screen. “Update” button is used to submit new/edited data to the database. “Cancel” button is used to clear all new data and changes up to the last valid update. All the new/edited values submitted to the database are validated. The validation process uses predefined rules to find values that must be rejected (errors) or must be warned (warnings). The list of predefined rules is presented in the previous chapter. Please refer to Figure 3-15 Rules used to check nomination values for more details on the nomination rules.
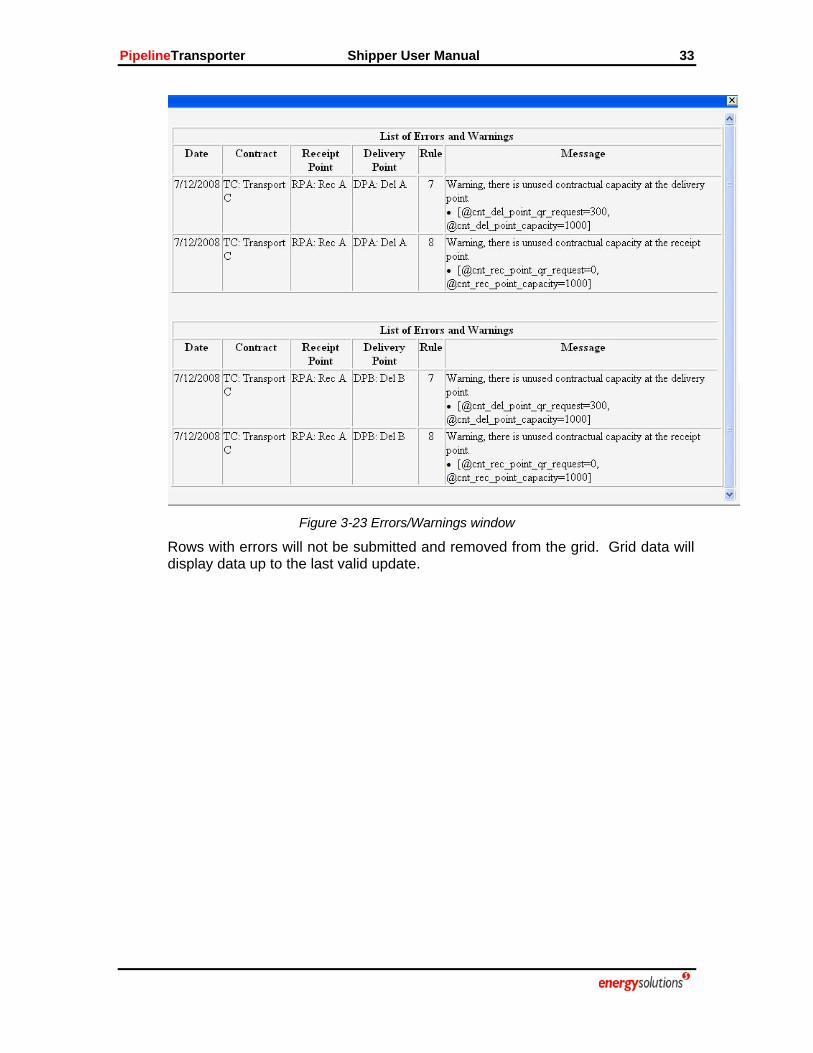
When the system finds any warnings/errors then a floating window similar to the next one is displayed:
PipelineTransporter Shipper User Manual 33
Figure 3-23 Errors/Warnings window
Rows with errors will not be submitted and removed from the grid. Grid data will display data up to the last valid update.
PipelineTransporter Shipper User Manual 34
3.2.4 NOMINATIONS DETAIL VIEW
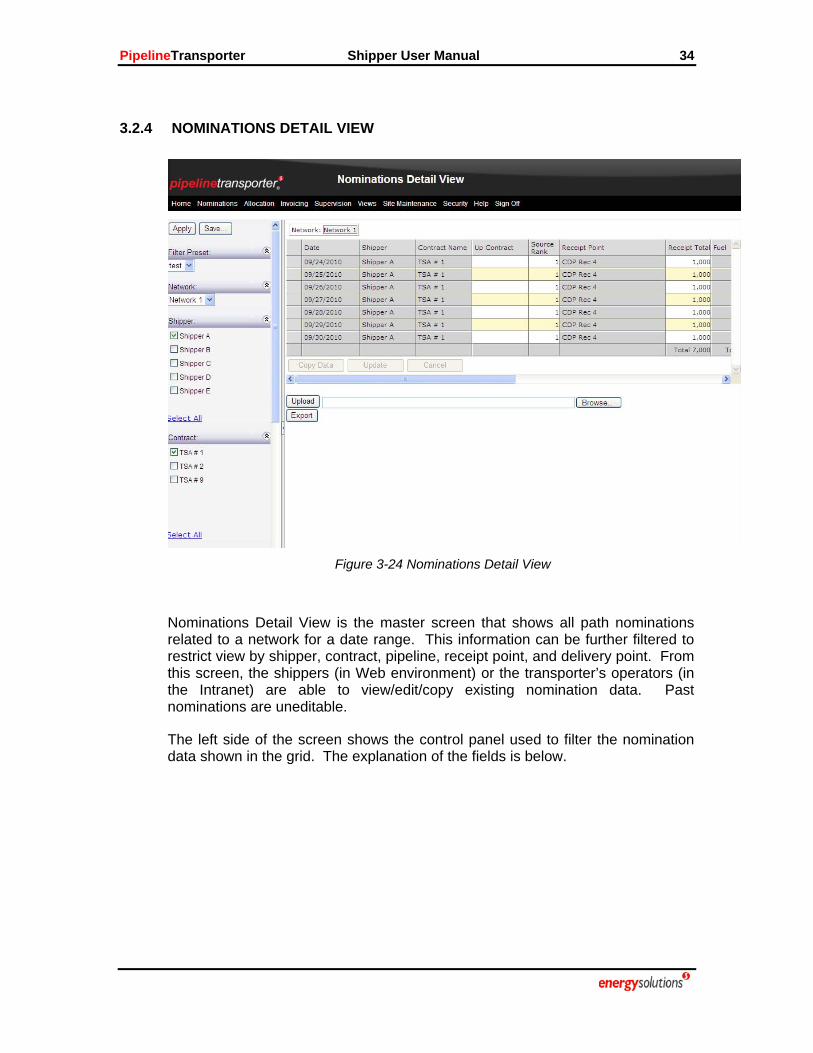
Figure 3-24 Nominations Detail View
Nominations Detail View is the master screen that shows all path nominations related to a network for a date range. This information can be further filtered to restrict view by shipper, contract, pipeline, receipt point, and delivery point. From this screen, the shippers (in Web environment) or the transporter’s operators (in the Intranet) are able to view/edit/copy existing nomination data. Past nominations are uneditable.
The left side of the screen shows the control panel used to filter the nomination data shown in the grid. The explanation of the fields is below.

PipelineTransporter Shipper User Manual 35
Figure 3-25 Control Panel used to filter
Filter Information:
• Filter Preset: This is the list of filter settings that has been saved in the database. Select one to prefill values for other filters.
• Network: The combo box lists all gas pipeline networks in the system. Select a network.
• Shipper: The checkbox list of shippers is automatically updated based on the selected network. Select one or more shippers to confine the nomination view. Use the ‘Select All’ option to select/deselect all checkboxes.

PipelineTransporter Shipper User Manual 36
• Contract: The checkbox list of contracts is automatically updated based on the selected shippers. Select one or more contracts to confine the nomination view. Use the ‘Select All’ option to select/deselect all checkboxes.
• Pipeline: The checkbox list of pipelines is automatically updated based on the selected network. Select one or more pipelines to confine the nomination view. Use the ‘Select All’ option to select/deselect all checkboxes.
• Receipt: This is the list of receipt points where the gas is going to be received (into the pipeline system). The checkbox list of receipt points is updated automatically based on the selected contracts and pipelines. Use the ‘Select All’ option to select/deselect all checkboxes.
• Delivery: This is the list of delivery points where the gas is going to be delivered (out of the pipeline system). The checkbox list of delivery points is automatically updated based on the selected contracts and receipts. Use the ‘Select All’ option to select/deselect all checkboxes.
• From Date: This field specifies the begin date for the nomination view.
• To Date: This field specifies the end date for the nomination view.
• Unit: This is the unit used to express all the gas amounts. The system provides radio buttons to select either the system standard volumetric unit (i.e. MMSCF) or the system standard energy unit (i.e. MMBtu). Data panel is only editable when the network’s system standard unit is selected.
• Apply: Click on this button to apply the current setting to the data grid.
• Save: Click on this button to save the current filter setting or to delete an existing filter setting.

PipelineTransporter Shipper User Manual 37
Figure 3-26 Save filter setting
‘Save’ option is used to overwrite existing setting with the current setting. ‘Save As’ option is used to add a new setting to the database. If the name specified in the ‘Save As’ has been used in the system, the existing data will be overwritten. Use ‘Delete’ option to remove an unwanted setting from the database. Click ‘OK’ to submit the action. Otherwise, click ‘Cancel’ to exit the screen.
The right side of the screen shows the data panel.
Figure 3-27 Data Panel
At the top of the grid, name of the selected network is displayed. Data panel is only refreshed when ‘Apply’ button is clicked. The “Hourly Noms” button can be used to transfer the user to the Hourly Nominations web page.
The description of the fields shown in the grid is given below.
PipelineTransporter Shipper User Manual 38
Grid Columns:
• Date: This is the nomination date.
• Shipper: This is name of the shipper who does nomination. Read-only field.
• Contract Name: This is name of the nominated contract. Read-only filed.
• Up Contract: This is the upstream contract for the path on the nomination date. The field can be null.
• Source Rank: This is the receipt priority for the path on the nomination date.
• Unit: This is the nominated unit. Read only filed.
• Receipt Point: This is the receipt point of the path. Read-only field.
• Receipt Total: This is the total amount of gas that the shipper is going to supply at the receipt point.
• Fuel: This is the amount of gas that the shipper must supply as fuel for the path.
• Delivery Point: This is the delivery point of the path. Read-only field.
• Req Del Qty: This is the main amount of gas that the shipper requests to be transported and delivered to the delivery point.
• Del AOR/Peaking: This is the extra amount of gas called “Authorized Overrun” that the shipper requests to be transported and delivered to the delivery point (AOR stands for Authorized Overrun).
• Del SOPR: This is the extra amount of gas that the shipper requests to be transported and delivered to the delivery point to recover a non used capacity of a previous date (Recovery of SOP).
• Destination Rank: This is the delivery priority for the path on the nomination date.
• Dn Contract: This is the downstream contract for the path on the nomination date. The field can be null.
• Imbalance: This is the imbalance that results of subtracting the total delivery (RQ, AOR and SOPR) and fuel (Fuel) from the total receipt (Receipt Total). This value is calculated automatically by the application. Read-only field.
PipelineTransporter Shipper User Manual 39
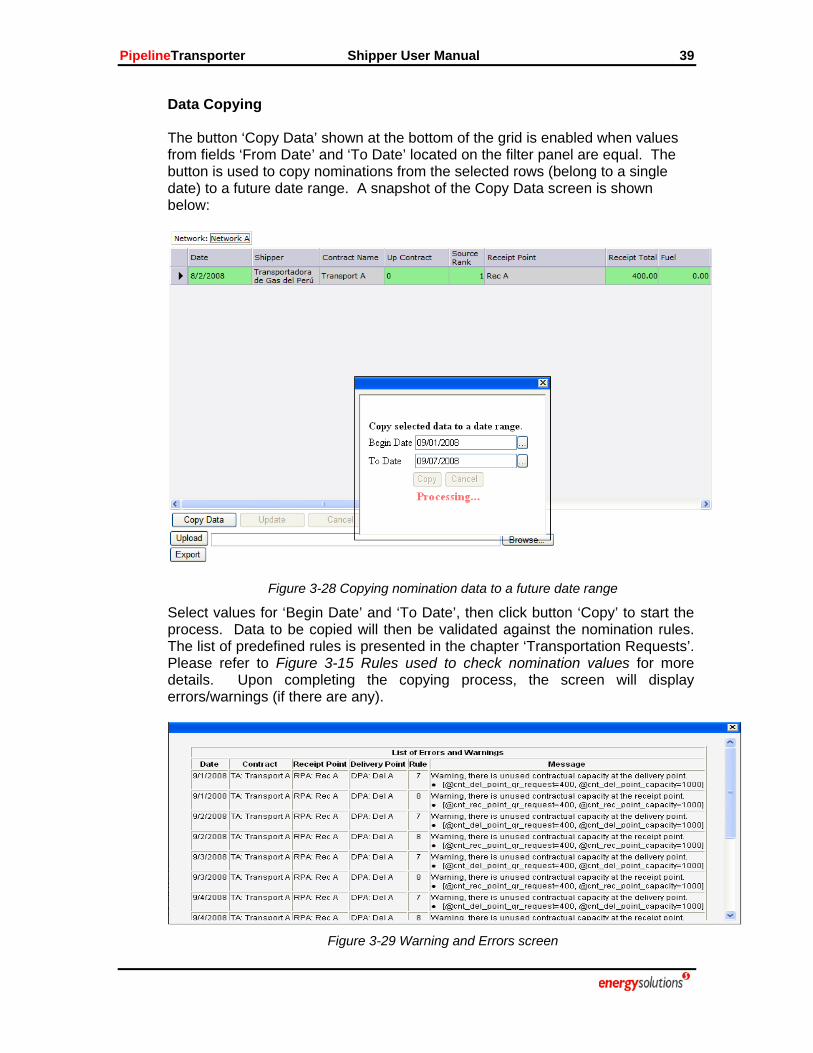
Data Copying The button ‘Copy Data’ shown at the bottom of the grid is enabled when values from fields ‘From Date’ and ‘To Date’ located on the filter panel are equal. The button is used to copy nominations from the selected rows (belong to a single date) to a future date range. A snapshot of the Copy Data screen is shown below:
Figure 3-28 Copying nomination data to a future date range
Select values for ‘Begin Date’ and ‘To Date’, then click button ‘Copy’ to start the process. Data to be copied will then be validated against the nomination rules. The list of predefined rules is presented in the chapter ‘Transportation Requests’. Please refer to Figure 3-15 Rules used to check nomination values for more details. Upon completing the copying process, the screen will display errors/warnings (if there are any).
Figure 3-29 Warning and Errors screen
PipelineTransporter Shipper User Manual 40
Data with errors will not be submitted to the database. Use button ‘Cancel’ to abort the copying process and exit the screen. Data Updating The buttons “Update” and “Cancel” shown at the bottom of the grid are enabled when there are modifications in the screen. “Update” button is used to submit edited data to the database. “Cancel” button is used to undo all changes up to the last valid update. All modified values submitted to the database are validated. The validation process uses predefined rules to find values that must be rejected (errors) or must be warned (warnings). The list of predefined rules is presented in the chapter ‘Transportation Requests’. Please refer to Figure 3-15 Rules used to check nomination values for more details on the nomination rules.
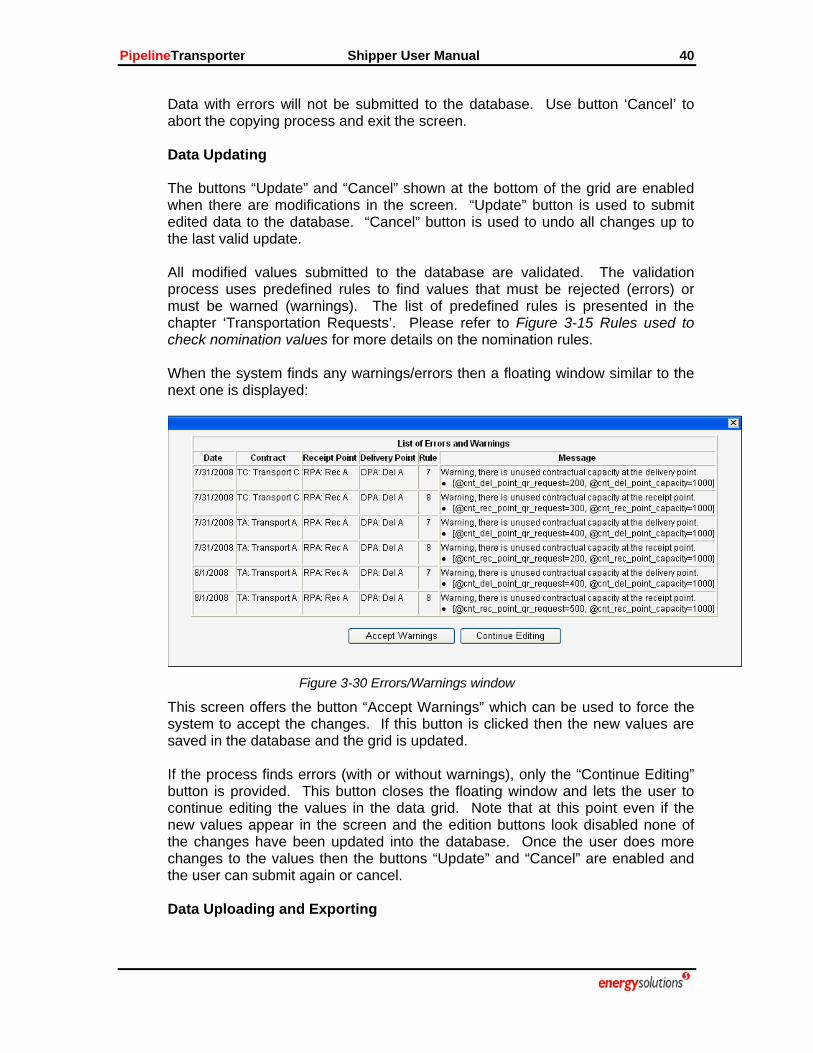
When the system finds any warnings/errors then a floating window similar to the next one is displayed:
Figure 3-30 Errors/Warnings window
This screen offers the button “Accept Warnings” which can be used to force the system to accept the changes. If this button is clicked then the new values are saved in the database and the grid is updated. If the process finds errors (with or without warnings), only the “Continue Editing” button is provided. This button closes the floating window and lets the user to continue editing the values in the data grid. Note that at this point even if the new values appear in the screen and the edition buttons look disabled none of the changes have been updated into the database. Once the user does more changes to the values then the buttons “Update” and “Cancel” are enabled and the user can submit again or cancel. Data Uploading and Exporting

PipelineTransporter Shipper User Manual 41
Uploading and exporting process of Nominations Detail View are the same as Transportation Requests’. Please refer to the chapter ‘Transportation Request’, sections ‘Exporting data’ and ‘Uploading Nominations’ for more details on the topics.
3.2.5 SUMMARY
Figure 3-31 Summary
This screen summarizes the nominations inserted by receipt point.
The left side of the screen shows the control panel used to filter the information shown in the grid. The explanation of the fields shown in the control panel is below.
PipelineTransporter Shipper User Manual 42
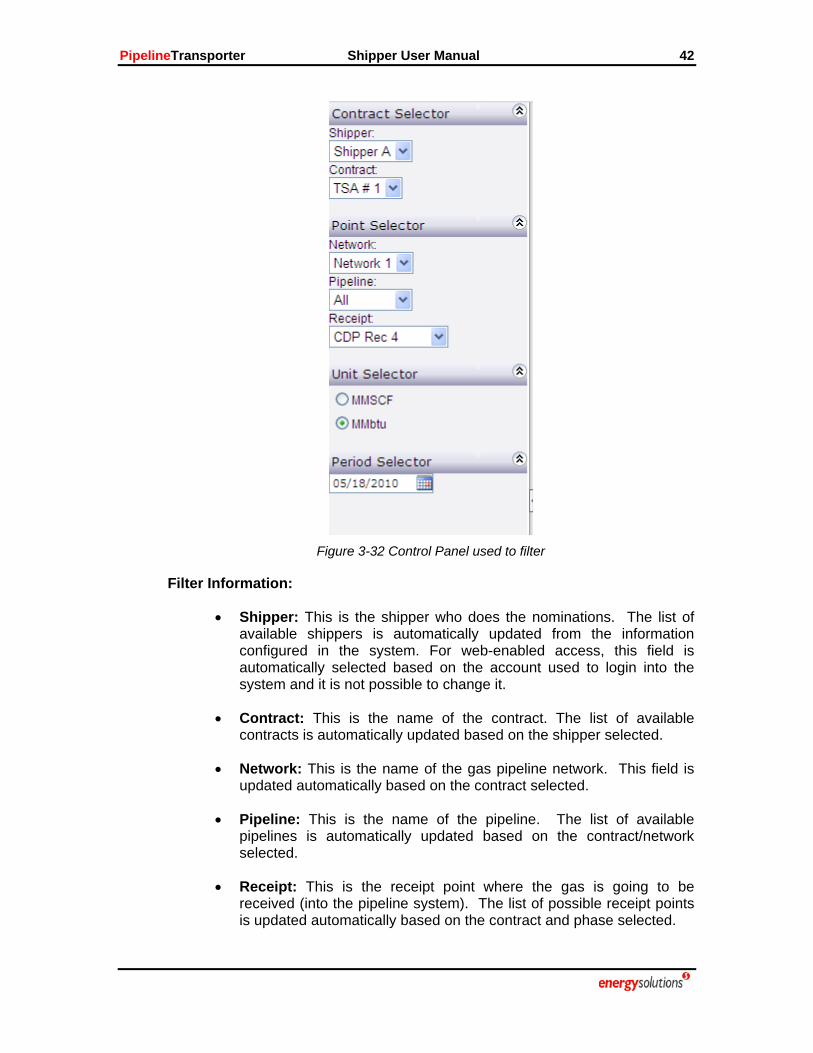
Figure 3-32 Control Panel used to filter
Filter Information:
• Shipper: This is the shipper who does the nominations. The list of available shippers is automatically updated from the information configured in the system. For web-enabled access, this field is automatically selected based on the account used to login into the system and it is not possible to change it.
• Contract: This is the name of the contract. The list of available contracts is automatically updated based on the shipper selected.
• Network: This is the name of the gas pipeline network. This field is updated automatically based on the contract selected.
• Pipeline: This is the name of the pipeline. The list of available pipelines is automatically updated based on the contract/network selected.
• Receipt: This is the receipt point where the gas is going to be received (into the pipeline system). The list of possible receipt points is updated automatically based on the contract and phase selected.

PipelineTransporter Shipper User Manual 43
• Unit: This is the unit used to express all the gas amounts. The system provides radio buttons to select either the system standard volumetric unit (i.e. MMSCF) or the system standard energy unit (i.e. MMBtu).
• Period: This is the selected month. The user can select any date using a calendar provided by the system.
The right side of the screen shows the data panel used to display the grid.
A summary of the values used to filter the information displayed in the grid is located at the top of the grid. The boxes shown in this section are explained below:
Figure 3-33 Summary of values selected to filter data
Field Information:
• Shipper: This is the shipper selected. Read-only value.
• Contract: This is the contract selected. The user cannot change this value.
• Network: This is the network selected. Read-only value.
• Pipeline: This is the pipeline selected. Read-only value.
• Receipt: This is the receipt point selected. Read-only value.
• Date: This is the date representing the month selected. Read-only value.
• Unit: This is the unit selected. Read-only value. Below is a closer look to the data panel displayed in Figure 3-31 Summary:
PipelineTransporter Shipper User Manual 44
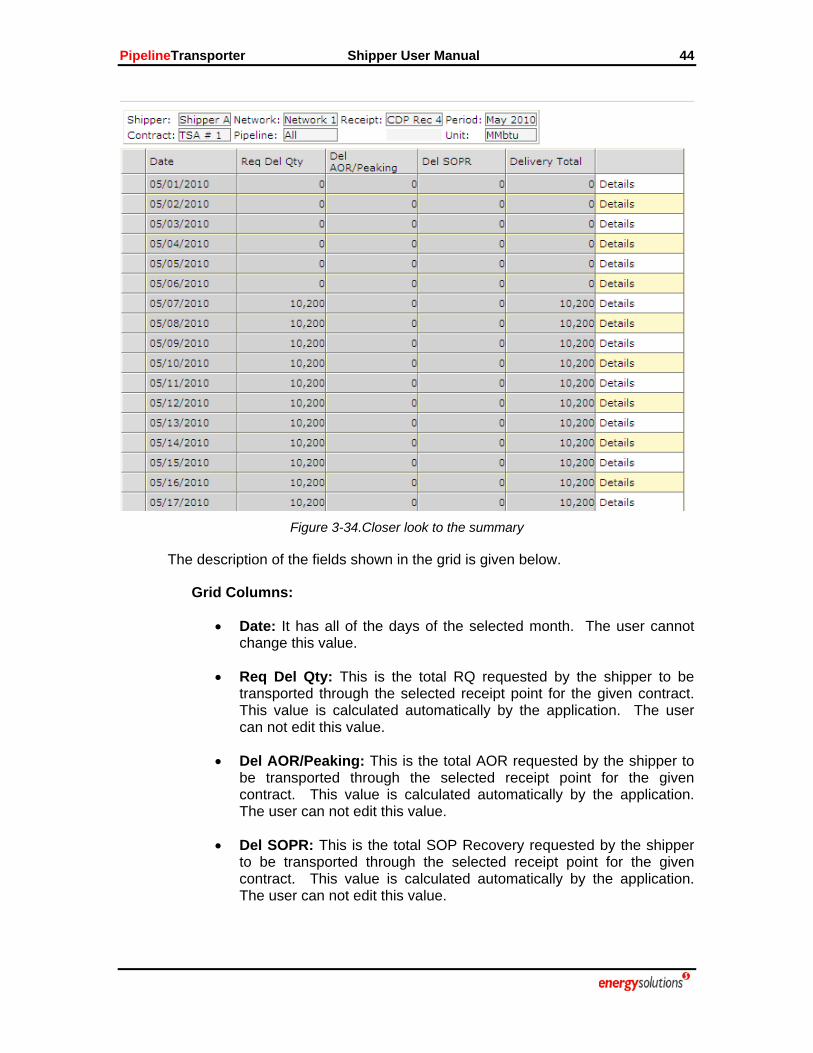
Figure 3-34.Closer look to the summary
The description of the fields shown in the grid is given below.
Grid Columns:
• Date: It has all of the days of the selected month. The user cannot change this value.
• Req Del Qty: This is the total RQ requested by the shipper to be transported through the selected receipt point for the given contract. This value is calculated automatically by the application. The user can not edit this value.
• Del AOR/Peaking: This is the total AOR requested by the shipper to be transported through the selected receipt point for the given contract. This value is calculated automatically by the application. The user can not edit this value.
• Del SOPR: This is the total SOP Recovery requested by the shipper to be transported through the selected receipt point for the given contract. This value is calculated automatically by the application. The user can not edit this value.

PipelineTransporter Shipper User Manual 45
• Delivery Total: This is the sum of the three previous columns (Req Del Qty, Del AOR/Peaking and Del SOPR). This value is calculated automatically by the application. The user can not edit this value.
• Details: This button displays a floating window which shows the delivery gas detailed by delivery point (all the delivery points associated to the receipt point selected). The window is similar to the one shown below.
Figure 3-35 Summary - Details
A summary of the values used to filter the information displayed in the grid is located at the top of the grid. The boxes shown in this section are explained below (all the fields are read only):
Field Information:
• Shipper: This is the shipper selected
• Contract: This is the name of the contract selected.
• Network: This is the name of the network selected.
• Pipeline: This is the name of the pipeline selected.
• Receipt: This is the receipt point selected.
• Date: This is the date selected.
• Unit: This is the unit selected.
The description of the fields shown in the grid is given below (all the fields are read only).
Grid Columns:
• Date: This is the date selected.

PipelineTransporter Shipper User Manual 46
• Delivery Point: This is the delivery point at which the nominated gas must be delivered. There must be a transportation path connecting the receipt point to this delivery point.
• Req Del Qty: This is requested gas to be transported from the selected receipt point to the selected delivery point.
• AOR: This is AOR requested to be transported from the selected receipt point to the selected delivery point.
• SOPR: This is SOP Recovery requested to be transported from the selected receipt point to the selected delivery point.
• Delivery Total: This is the total gas requested to be transported from the selected receipt point to the selected delivery point.
3.2.6 CAPACITY RELEASE Pipeline Transporter uses a single web page to support the capacity release offer and bid process. The web page consists of a filter on the left hand side and two grids on the right hand side. The filter on the left is used to filter the ‘Offers’ grid. By selecting a row in the ‘Offers’ grid you are able to view the corresponding bids in the ‘Bids’ grid. Your ability to view corresponding bids is of course determined by several factors.
• Prearranged bids are only viewable by the shipper making the offer and the prearranged bidder.
• Sealed bids are only viewable by the shipper making the offer and the shipper making the bid. In other words, if Shipper A makes and offer that both Shipper B and Shipper C bid on then Shipper A will see bids by both Shipper B and Shipper C. But Shipper B will not see the bid by Shipper C and vice-versa.
• A bid is not viewable by any authorized shipper (neither releaser nor competing bidder) until the ‘bid status’ is changed from ‘Draft’ to ‘Posted’
Figure 3-36 Capacity Release
PipelineTransporter Shipper User Manual 47
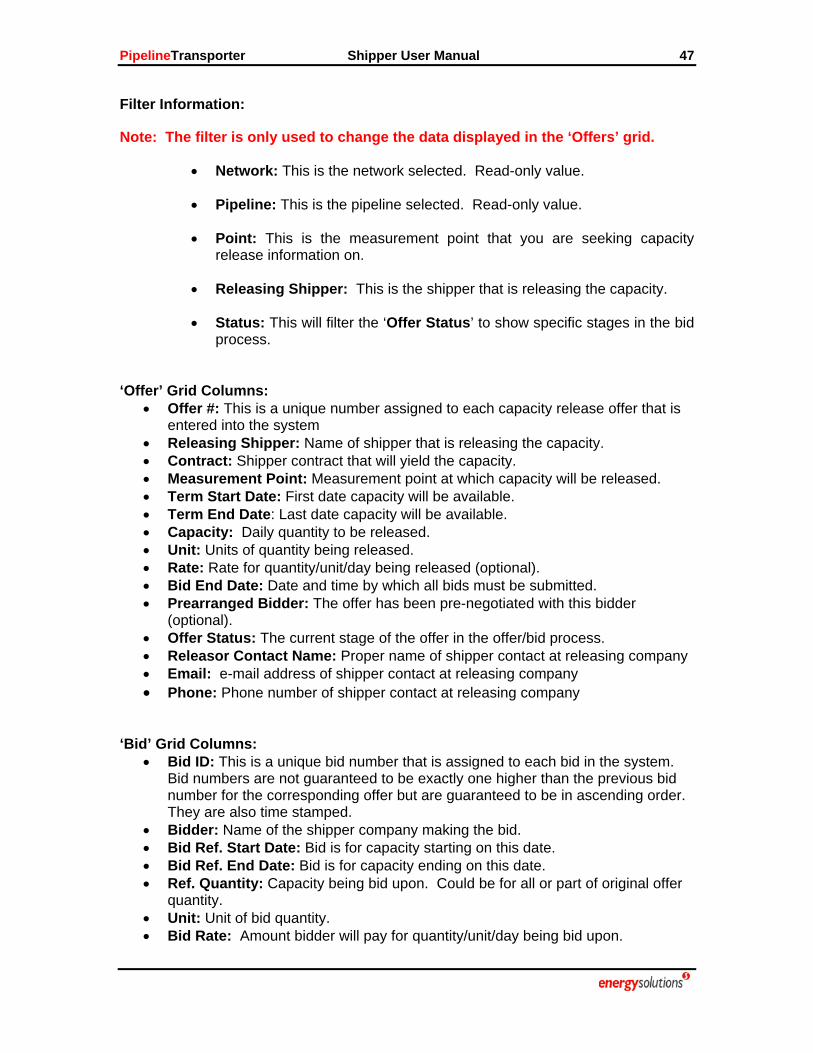
Filter Information:
Note: The filter is only used to change the data displayed in the ‘Offers’ grid.
• Network: This is the network selected. Read-only value.
• Pipeline: This is the pipeline selected. Read-only value.
• Point: This is the measurement point that you are seeking capacity release information on.
• Releasing Shipper: This is the shipper that is releasing the capacity.
• Status: This will filter the ‘Offer Status’ to show specific stages in the bid process.
‘Offer’ Grid Columns: • Offer #: This is a unique number assigned to each capacity release offer that is
entered into the system • Releasing Shipper: Name of shipper that is releasing the capacity. • Contract: Shipper contract that will yield the capacity. • Measurement Point: Measurement point at which capacity will be released. • Term Start Date: First date capacity will be available. • Term End Date: Last date capacity will be available. • Capacity: Daily quantity to be released. • Unit: Units of quantity being released. • Rate: Rate for quantity/unit/day being released (optional). • Bid End Date: Date and time by which all bids must be submitted. • Prearranged Bidder: The offer has been pre-negotiated with this bidder
(optional). • Offer Status: The current stage of the offer in the offer/bid process. • Releasor Contact Name: Proper name of shipper contact at releasing company • Email: e-mail address of shipper contact at releasing company • Phone: Phone number of shipper contact at releasing company
‘Bid’ Grid Columns: • Bid ID: This is a unique bid number that is assigned to each bid in the system.
Bid numbers are not guaranteed to be exactly one higher than the previous bid number for the corresponding offer but are guaranteed to be in ascending order. They are also time stamped.
• Bidder: Name of the shipper company making the bid. • Bid Ref. Start Date: Bid is for capacity starting on this date. • Bid Ref. End Date: Bid is for capacity ending on this date. • Ref. Quantity: Capacity being bid upon. Could be for all or part of original offer
quantity. • Unit: Unit of bid quantity. • Bid Rate: Amount bidder will pay for quantity/unit/day being bid upon.

PipelineTransporter Shipper User Manual 48
• Bid Status: A status of ‘Draft’ indicates that the bid has not been formally submitted.
• Reject Offer or Withdraw Bid: Once a bid is submitted, it cannot be deleted but it can be withdrawn. Or a pre-arranged bid with a shipper can be rejected.
• Bidder Contact Name: Proper name of bidding party at receiving company • Email: e-mail address of bidder contact at receiving company • Phone: Phone number of bidder contact at receiving company • Bid Created At: Time stamp that bid was first entered into system. Could
represent ‘Draft’ status or ‘Posted’ status. It depends on the status value when the item was originally entered prior to pressing Update for the first time.
• Last Changed At: Time stamp corresponding to the last time the bid information was updated.
‘Offer’ Grid Restrictions:
• Only offers with a status of ‘Draft’ can be deleted. Once ‘Posted’ it can only be removed from the bid process by changing its status to ‘Withdrawn’.
• Once a status of ‘Posted’ has been assigned to a record the only fields that you are allowed to change are the status and the contact information fields.
• The only optional item in the record is the bid rate. All other fields must be specified.
• Individual fields are validated prior to saving the data. ‘Bid’ Grid Restrictions:
• You can only bid on offers with a status of ‘Posted’ and the bidding deadline must not have elapsed.
• Bids with a status of ‘Draft’ are allowed to be deleted. • Once a status of ‘Posted’ has been assigned to a record the only fields that you
are allowed to change are the reject/withdraw field and the contact information fields.
• Any bid can be marked as rejected/withdrawn prior to the bid deadline • There are no optional fields in this record. • Individual fields are validated prior to saving the data.

PipelineTransporter Shipper User Manual 49
3.3 ALLOCATION
3.3.1 PDA CONFIGURATION
Figure 3-37 PDA Configuration
This screen is used to configure the PDA rule for the measurement points in the system. Except the administrator, the login users can only see points that they operate. Only one rule can be applied to a point per day. Rules whose effective date belong to a locked/closed/adjusted/consolidated invoice period are not editable and deletable.
Filter Information:
• Point: This is the list of points operated by the current user. The system fills up the values for the combo box automatically. Select a point to configure its allocation rule.
Field Information:
• Eff. Date: This is the date that the selected allocation rule is effective. The field is only editable for new row.
• PDA Rule: This is the list of allocation rules used in the system: The combo box will become disabled when the effective date of the row belongs to a released/closed/ consolidated period. Select a rule, then click ‘Update’ to designate the rule to the point. Below is the complete description of all allocation rules:
Ranked (RANKED): Each contract is assigned a relative ranking to establish a priority order. Starting with the highest priority contract and continuing for as long as there is any remaining unallocated quantity, the

PipelineTransporter Shipper User Manual 50
scheduled quantity for each contract nomination is allocated to that contract and deducted from the total quantity to be allocated. If there is not enough remaining unallocated quantity to allocate the scheduled quantity to the next priority contract, all remaining unallocated quantity is allocated to that contract. Any contract with a lower priority than the last allocated contract is allocated no quantities. If after all contracts have been allocated there still remain some unallocated quantities, all of the remaining unallocated quantities are allocated to the lowest priority contract. Rank 1 is the highest priority. All equal priority contracts will be prorated. Percentage (PERC): The allocation is derived by taking the total quantity to be allocated at a location and multiplying it by the percentage(s) provided. The percentages must total 100%. Swing (SWING): One contract is designated as the "swing". All other scheduled contracts are allocated the scheduled quantity. The contract identified as "swing" is allocated the remaining difference between total quantity to be allocated and quantities allocated to non-swing contracts, in accordance with instructions provided with the PDA. The swing contract can be allocated a negative quantity. The swing contract can change daily. Pro Rata (PRORATA): The total quantity to be allocated at a location is multiplied by the ratio established by taking each individual scheduled contract (at the location) and dividing it by the total of all scheduled contracts. Total quantity allocated should equal 100% of whole number. Give any remaining unallocated quantity to the last entry. Swing Pro Rata (SWINGPRO): Just like swing but not allowed to allocate a negative value to the swing contract. The contracts that received an allocation at this point must have their values pro rated by the negative quantity. The swing contract would receive an allocation of zero. Operator Provided (OP): A mutually agreed upon allocation methodology that indicates that the operator will supply the allocation quantities. OBA (OBA): An OBA should work just like a swing contract that does not need to have a nomination. One contract is designated as the "OBA". All other scheduled contracts are allocated the scheduled quantity. The contract identified as "OBA" is allocated the remaining difference between total quantity to be allocated and quantities allocated to non-OBA contracts, in accordance with instructions provided with the PDA. The OBA contract can be allocated a negative quantity. The OBA contract can change daily. Shipper Ranked (RANKED): Each shipper is assigned a relative ranking to establish a priority order. Starting with the highest priority shipper and continuing for as long as there is any remaining unallocated quantity, the scheduled quantity for each shipper nomination is allocated to that
PipelineTransporter Shipper User Manual 51
shipper and deducted from the total quantity to be allocated. If there is not enough remaining unallocated quantity to allocate the scheduled quantity to the next priority shipper, all remaining unallocated quantity is allocated to that shipper. Any shipper with a lower priority than the last allocated shipper is allocated no quantities. If after all shippers have been allocated there still remain some unallocated quantities, all of the remaining unallocated quantities are allocated to the lowest priority shipper. Rank 1 is the highest priority. All equal priority shippers will be prorated. Shipper Percentage (PERC): The allocation is derived by taking the total quantity to be allocated at a location and multiplying it by the percentage(s) provided. The percentages must total 100%. Shipper Swing (SWING): One shipper is designated as the "swing". All other scheduled shippers are allocated the scheduled quantity. The shipper identified as "swing" is allocated the remaining difference between total quantity to be allocated and quantities allocated to non-swing shipper, in accordance with instructions provided with the PDA. The swing shipper can be allocated a negative quantity. The swing shipper can change daily. Pro Rata (PRORATA): The total quantity to be allocated at a location is multiplied by the ratio established by taking each individual scheduled shipper (at the location) and dividing it by the total of all scheduled shippers. Total quantity allocated should equal 100% of whole number. Give any remaining unallocated quantity to the last entry. Shipper Swing Pro Rata (SWINGPRO): Just like swing but not allowed to allocate a negative value to the swing shipper. The shippers that received an allocation at this point must have their values pro rated by the negative quantity. The swing shipper would receive an allocation of zero. Shipper Operator Provided (OP): A mutually agreed upon allocation methodology that indicates that the operator will supply the allocation quantities.
Shipper OBA (OBA): An OBA should work just like a swing shipper that does not need to have a nomination. One shipper is designated as the "OBA". All other scheduled shippers are allocated the scheduled quantity. The shipper identified as "OBA" is allocated the remaining difference between total quantity to be allocated and quantities allocated to non-OBA shippers, in accordance with instructions provided with the PDA. The OBA shipper can be allocated a negative quantity. The OBA shipper can change daily.
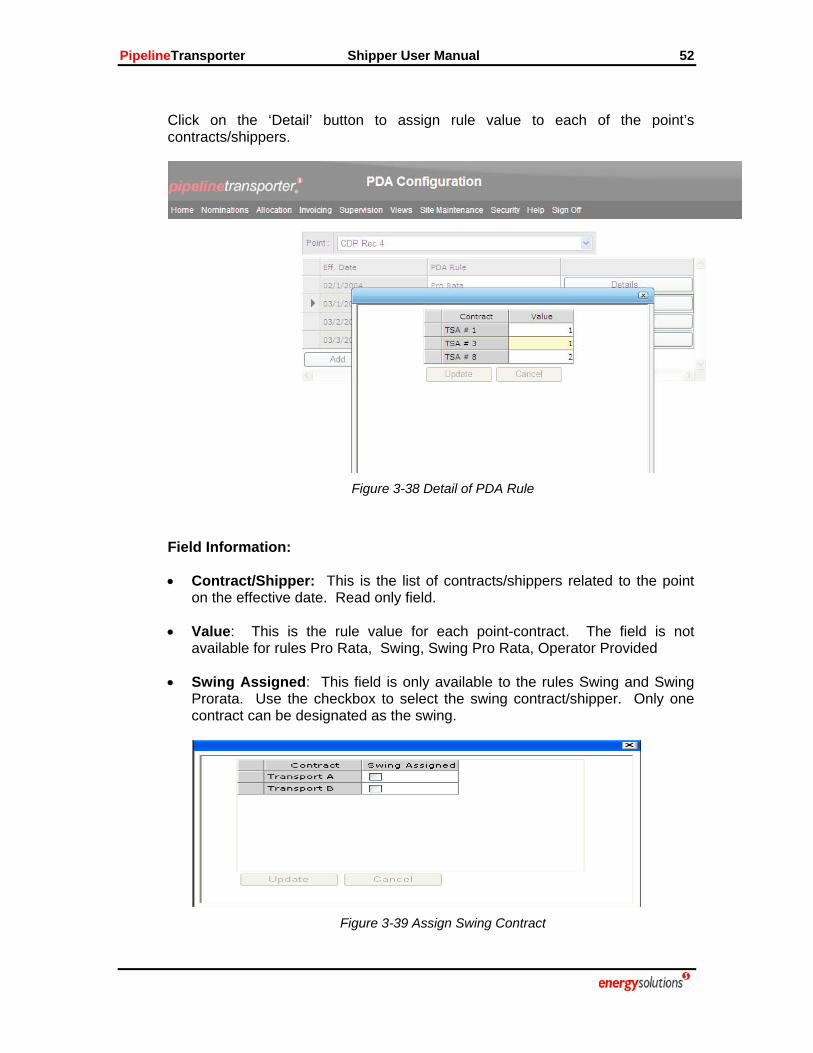
PipelineTransporter Shipper User Manual 52
Click on the ‘Detail’ button to assign rule value to each of the point’s contracts/shippers.
Figure 3-38 Detail of PDA Rule
Field Information:
• Contract/Shipper: This is the list of contracts/shippers related to the point on the effective date. Read only field.
• Value: This is the rule value for each point-contract. The field is not available for rules Pro Rata, Swing, Swing Pro Rata, Operator Provided
• Swing Assigned: This field is only available to the rules Swing and Swing Prorata. Use the checkbox to select the swing contract/shipper. Only one contract can be designated as the swing.
Figure 3-39 Assign Swing Contract
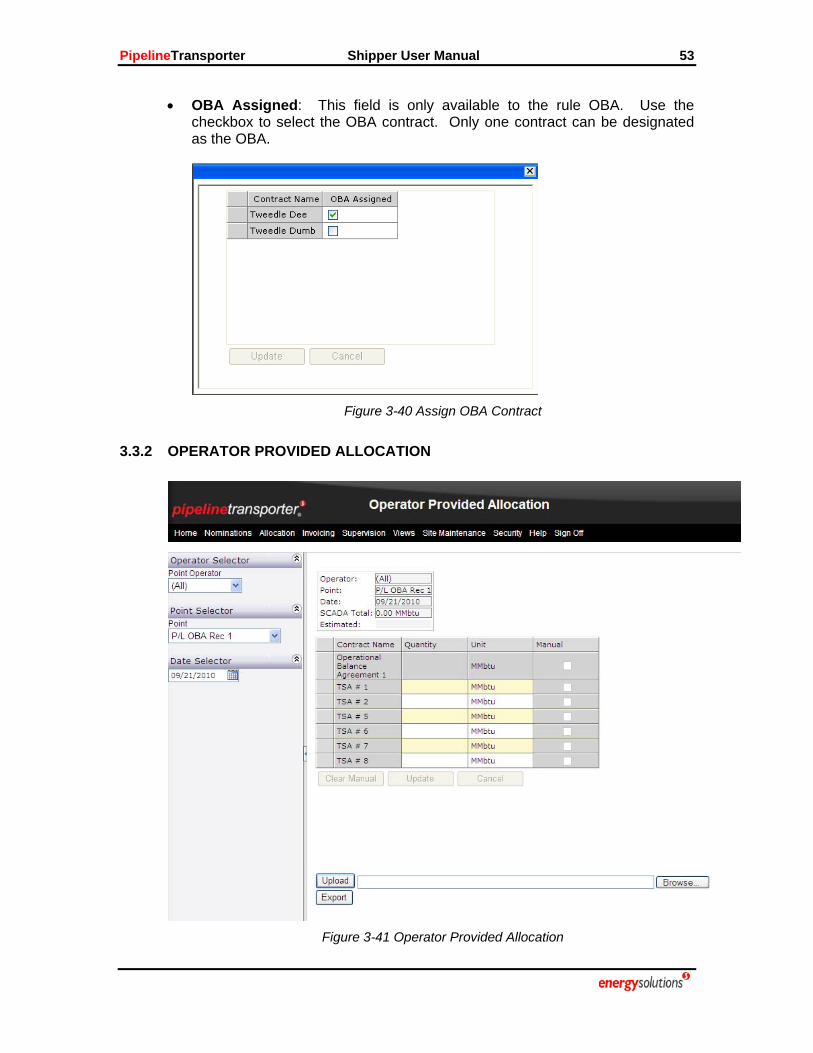
PipelineTransporter Shipper User Manual 53
• OBA Assigned: This field is only available to the rule OBA. Use the checkbox to select the OBA contract. Only one contract can be designated as the OBA.
Figure 3-40 Assign OBA Contract
3.3.2 OPERATOR PROVIDED ALLOCATION
Figure 3-41 Operator Provided Allocation
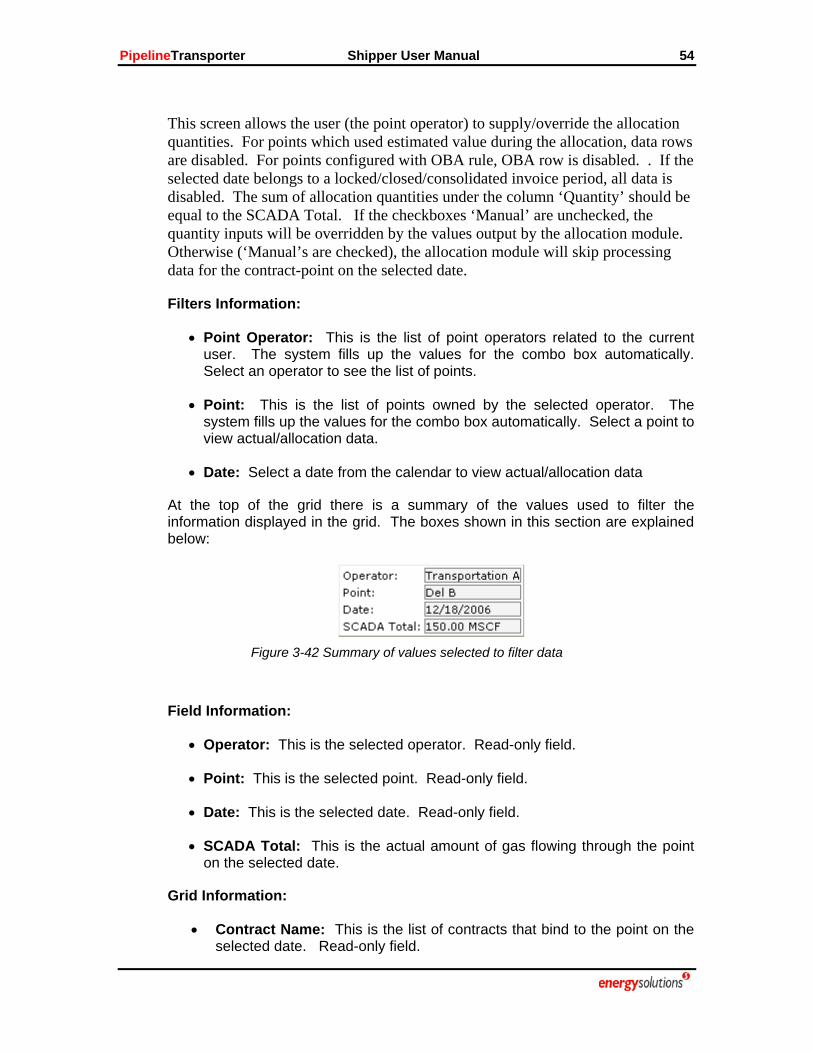
PipelineTransporter Shipper User Manual 54
This screen allows the user (the point operator) to supply/override the allocation quantities. For points which used estimated value during the allocation, data rows are disabled. For points configured with OBA rule, OBA row is disabled. . If the selected date belongs to a locked/closed/consolidated invoice period, all data is disabled. The sum of allocation quantities under the column ‘Quantity’ should be equal to the SCADA Total. If the checkboxes ‘Manual’ are unchecked, the quantity inputs will be overridden by the values output by the allocation module. Otherwise (‘Manual’s are checked), the allocation module will skip processing data for the contract-point on the selected date.
Filters Information:
• Point Operator: This is the list of point operators related to the current user. The system fills up the values for the combo box automatically. Select an operator to see the list of points.
• Point: This is the list of points owned by the selected operator. The system fills up the values for the combo box automatically. Select a point to view actual/allocation data.
• Date: Select a date from the calendar to view actual/allocation data
At the top of the grid there is a summary of the values used to filter the information displayed in the grid. The boxes shown in this section are explained below:
Figure 3-42 Summary of values selected to filter data
Field Information:
• Operator: This is the selected operator. Read-only field.
• Point: This is the selected point. Read-only field.
• Date: This is the selected date. Read-only field.
• SCADA Total: This is the actual amount of gas flowing through the point on the selected date.
Grid Information:
• Contract Name: This is the list of contracts that bind to the point on the selected date. Read-only field.
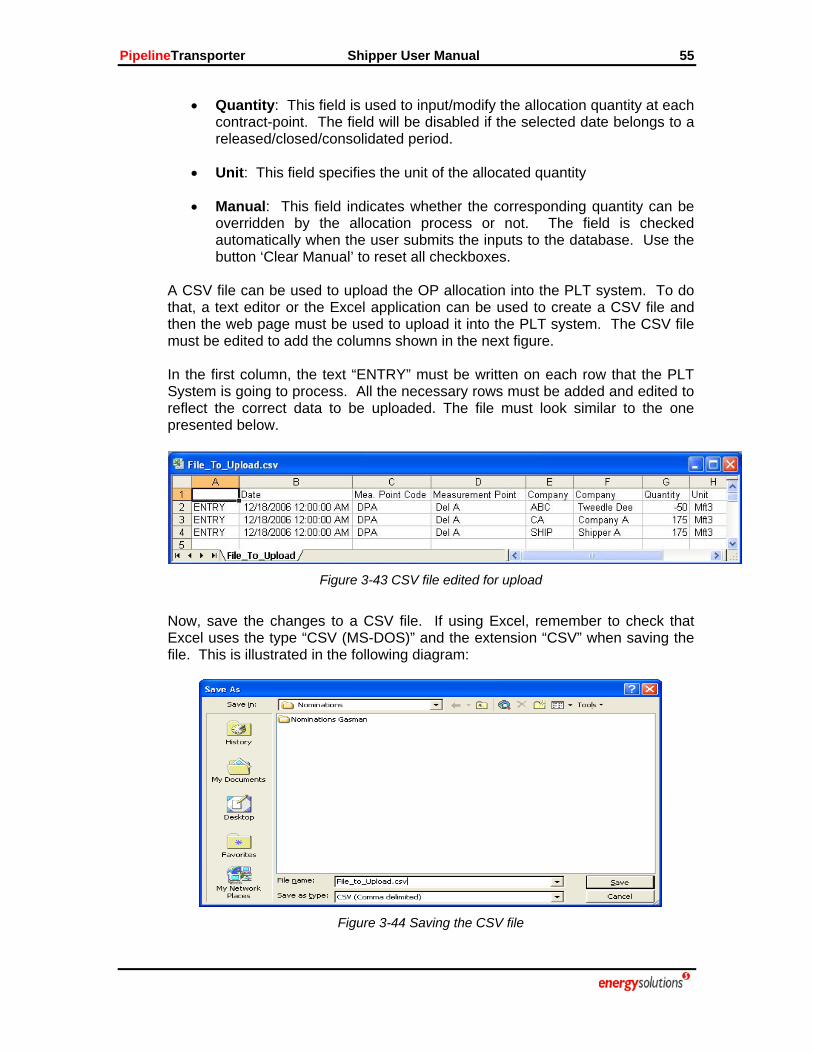
PipelineTransporter Shipper User Manual 55
• Quantity: This field is used to input/modify the allocation quantity at each contract-point. The field will be disabled if the selected date belongs to a released/closed/consolidated period.
• Unit: This field specifies the unit of the allocated quantity
• Manual: This field indicates whether the corresponding quantity can be overridden by the allocation process or not. The field is checked automatically when the user submits the inputs to the database. Use the button ‘Clear Manual’ to reset all checkboxes.
A CSV file can be used to upload the OP allocation into the PLT system. To do that, a text editor or the Excel application can be used to create a CSV file and then the web page must be used to upload it into the PLT system. The CSV file must be edited to add the columns shown in the next figure. In the first column, the text “ENTRY” must be written on each row that the PLT System is going to process. All the necessary rows must be added and edited to reflect the correct data to be uploaded. The file must look similar to the one presented below.
Figure 3-43 CSV file edited for upload
Now, save the changes to a CSV file. If using Excel, remember to check that Excel uses the type “CSV (MS-DOS)” and the extension “CSV” when saving the file. This is illustrated in the following diagram:
Figure 3-44 Saving the CSV file

PipelineTransporter Shipper User Manual 56
The first step to upload the CSV file is to specify the location of the file to be uploaded. Use the “Browse” button shown in the next figure.
Figure 3-45 Controls to Upload a CSV file
The following screen will appear:
Figure 3-46 Specifying the location of the CSV file
Once the CSV file has been located, the PLT system will be ready to upload the nominations. In the following screen the PLT System shows, in the box located at the bottom, the name of the CSV file that can be uploaded.

PipelineTransporter Shipper User Manual 57
Figure 3-47 PLT ready to upload CSV file
To start the upload process, click the “Upload” button located at the left side of the box showing the path and name of the CSV file. The system will take some time to upload and process the information.

PipelineTransporter Shipper User Manual 58
3.3.3 VIEW ALLOCATION RESULTS
Figure 3-48 View Allocation Results
This screen displays the results of the allocation by measurement point. From here, the user can view the scheduled and allocated data related to the selected point on the selected date range. Data in the grid is grouped by contract. Rows carried the plus sign (+) indicate the presents of the details and can be toggled or collapsed. The last row computes the sum of all contracts.
Filter Descriptions:
• Point: This is the list of points which the current user can view. The system fills up the values for the combo box automatically. Select a point from the list.
• Begin Date: This is the begin date of the viewing period. Select a date.
• End Date: This is the end date of the viewing period. Select a date.
• Apply: Click on the button to view allocated data.
Grid Description:
• Contract: This is name of the contract that binds to the point on the given date. range
• Scheduled: This shows the total scheduled quantity for the contract at the selected point on the selected date range.

PipelineTransporter Shipper User Manual 59
• Allocated: This shows the total allocated quantity for the contract at the selected point on the selected date range.
• Unit: This specifies the unit of the allocated quantity. Toggle the plus sign (+) to view daily data of the contract point.
Figure 3-49 - Daily data of the contract point
• Date: This is the data date.
• Scheduled: This is the scheduled quantity for the contract at the selected point on the date.
• Allocated: This is the allocated quantity for the contract at the selected point on the date.
• Unit: This is the unit of the data quantity.
• Estimated: This indicates whether the allocated value is derived from estimation or not. Estimation is used during the allocation process if the actual gas at point is not reported to the system.

PipelineTransporter Shipper User Manual 60
3.4 PRE-INVOICING MODULE SCREENS AND PROCESSES
3.4.1 DYNAMIC VARIABLES
Sometimes a penalty includes terms whose values must be entered by the client (shipper). These terms are known as Dynamic Variables and are created by the administrator of the PLT System using the windows application.
In order to allow the shippers (client) to view and enter the values for the Dynamic Variables, the following web page is included in the web application.
Figure 3-50 Dynamic Variables
The left side of the screen shows the control panel used to filter the information shown in the grid. The explanation of the fields shown in the control panel is below.

PipelineTransporter Shipper User Manual 61
Figure 3-51 Control Panel used to filter
Filter Parameters:
• Shipper: This is the shipper owner of the contract. The list of available shippers is updated automatically from the information configured in the system. For web-enabled access, this field is automatically selected based on the account used to log into the system and it is not possible to change it.
• Contract: This is the contract that the dynamic variable information is to be viewed or entered for.
• Invoicing Period: This is the invoice period that the dynamic variable information is to be viewed or entered for.
• Variable: This is the dynamic variable of interest. It must have been previously configured through the windows interface.
• Unit: This is actually a read-only field that indicates the unit system for previously entered values as well as the unit system that all new values must adhere to.
After entering the required data into the filter, the system will display a table of information for which data has been inserted.

PipelineTransporter Shipper User Manual 62
Figure 3-52 Close look to Dynamic Variables
This form displays a grid containing the data that has been previously entered as well as allows for the entry of new data. When the web application user is a transporter’s employee, the web form also allows for the importing of a CSV file to upload data.
To do that, a text editor or the Excel application can be used to create a CSV file and then the web page must be used to upload it into the PLT system. The CSV file must be edited to add the columns shown in the next figure. In the first column, the text “ENTRY” must be written on each row that the PLT System is going to process. All the necessary rows must be added and edited to reflect the correct contract code, dynamic variable code, date, value and unit code to be uploaded. The file must look similar to the one presented below.

PipelineTransporter Shipper User Manual 63
Figure 3-53 CSV file edited for upload
Note: The unit column is supplied for validity checking against the unit system that the dynamic variable is configured to receive.
Now, save the changes to a CSV file. If using Excel, remember to check that Excel uses the type “CSV (MS-DOS)” and the extension “CSV” when saving the file. This is illustrated in the following diagram:
Figure 3-54 Saving the CSV file
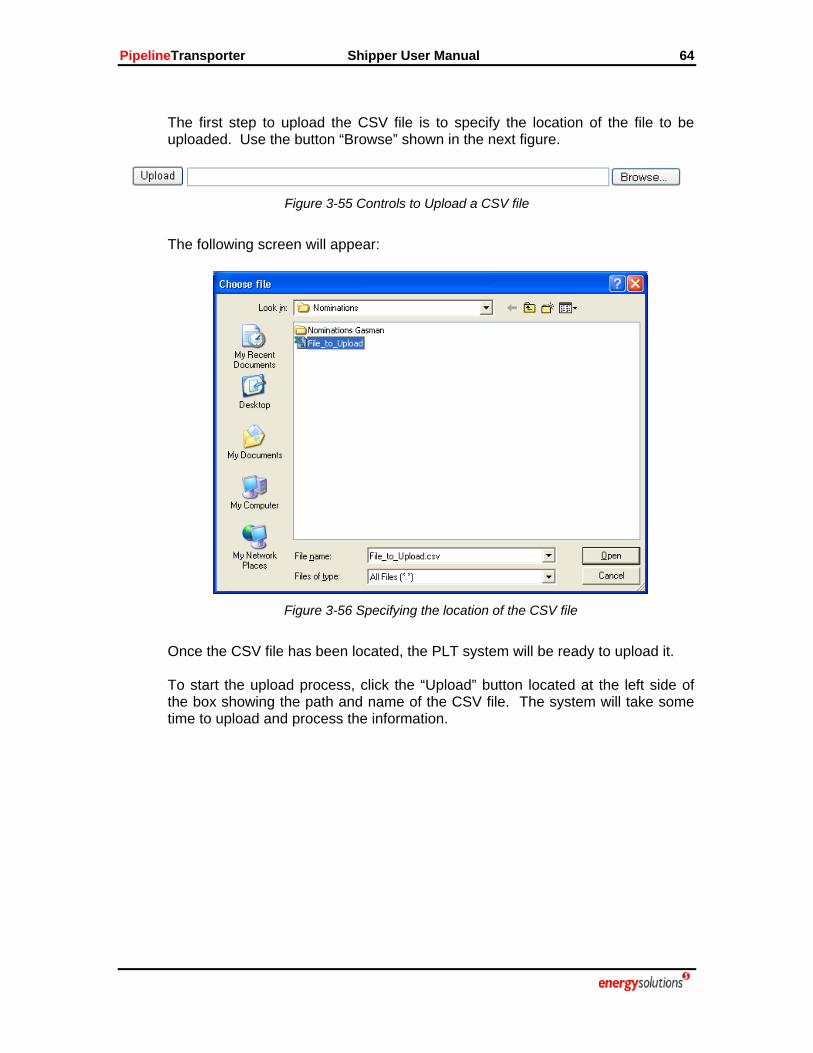
PipelineTransporter Shipper User Manual 64
The first step to upload the CSV file is to specify the location of the file to be uploaded. Use the button “Browse” shown in the next figure.
Figure 3-55 Controls to Upload a CSV file
The following screen will appear:
Figure 3-56 Specifying the location of the CSV file
Once the CSV file has been located, the PLT system will be ready to upload it. To start the upload process, click the “Upload” button located at the left side of the box showing the path and name of the CSV file. The system will take some time to upload and process the information.

PipelineTransporter Shipper User Manual 65
3.4.2 INVOICE DETAILS
Figure 3-57 Invoice Details
This is the complete view of the invoice data. The screen displays the summaries of allocation, adjustments, service and penalty charges for the contracts related to the selected network, company, contract type, and invoice period. Data displayed in each grid is populated based on the login user. The administrator can see data of all contracts. The regular users can only see data related to their contracts. The Invoice Details is composed of five main grids: Information and Allocation, Manual Adjustments, General Services, Penalties and Other Charges, and Prior Period Adjustements. Data in each grid can be toggled or collapsed. The last row computes the sum of all contracts. Rows carried the plus sign (+) indicate the presents of the details. ‘Export’ button below each grid is used to export the data to an excel file.
Filter Descriptions
• Network: The combo box lists available networks in the system.
• Company: The combo box lists all companies belong to the selected network.

PipelineTransporter Shipper User Manual 66
• Invoice Period: Combo box that lists existing invoice periods for the selected network, company, and contract types.
Grid Descriptions: Summary Information and Allocation Detail
Figure 3-58 - Summary Information and Allocation Detail
This is the master grid of the screen. The first data row display the summary contents of the five grids. • Contract: This is the code of the contract related to the selected network,
company, contract type, and invoice period. • Total Contract Quantity: This is the total gas allocated to the contract
during the given invoice period. • Total Contract Value: This is the sum of Total Contract Allocation Value,
Total Contract Manual Adjustment Value, Total Contract General Services Value, and Total Contract Penalty and Other Charges Value.
• Total Contract Allocation Value: This is the total fee charged to the contract based on the allocated quantity and the tariffs during the given invoice period.
• Total Contract Manual Adjustment Value: This is the total manual adjustment made to the contract during the given invoice period.
• Total Contract General Services Value: This is the total fee charged to the contract based on the general service quantity and the tariff during the given invoice period.
• Total Contract Penalty and Other Charges Value: This is the total fee charged to the contract based on the penalty quantity and the tariff during the given invoice period.
• Total PPA Quantity Adjustment: This is the total prior period adjustment made to the contract during the given invoice period.
• Total Net PPA Value Adjustment: This is the total PPA value credited/debited to the contract during the given invoice period.
Toggle the plus sign (+) to view the summary of allocated data at contract level.
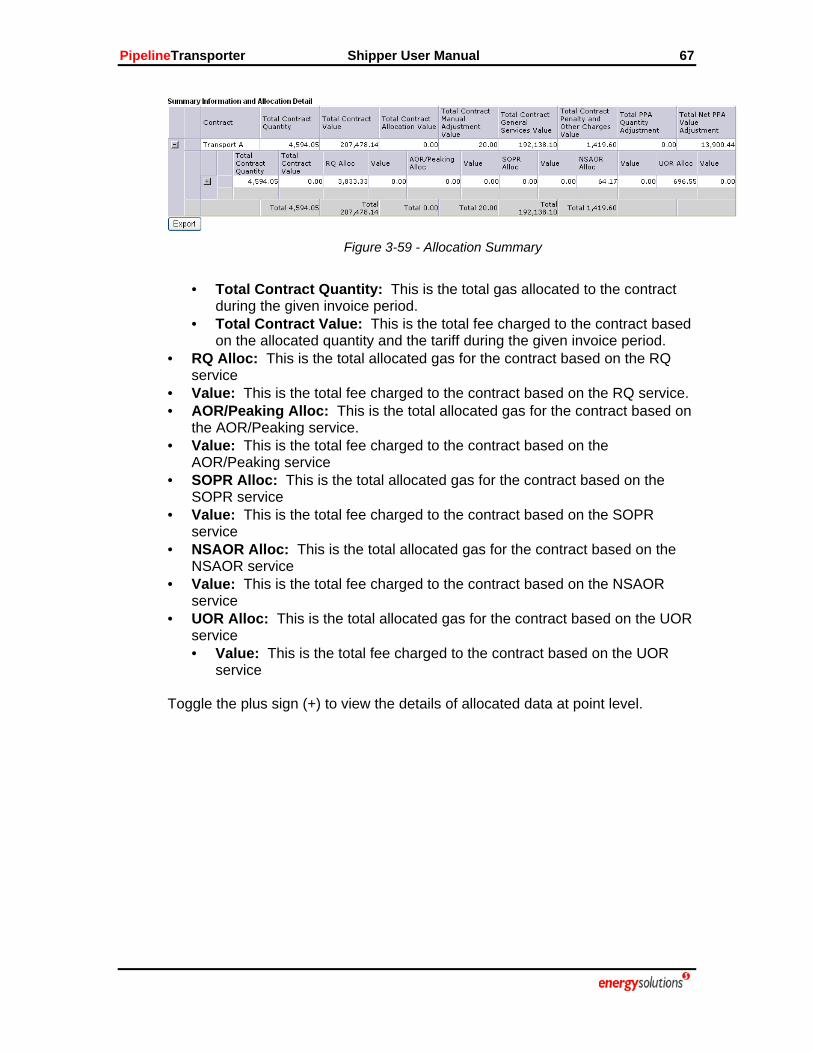
PipelineTransporter Shipper User Manual 67
Figure 3-59 - Allocation Summary
• Total Contract Quantity: This is the total gas allocated to the contract
during the given invoice period. • Total Contract Value: This is the total fee charged to the contract based
on the allocated quantity and the tariff during the given invoice period. • RQ Alloc: This is the total allocated gas for the contract based on the RQ
service • Value: This is the total fee charged to the contract based on the RQ service. • AOR/Peaking Alloc: This is the total allocated gas for the contract based on
the AOR/Peaking service. • Value: This is the total fee charged to the contract based on the
AOR/Peaking service • SOPR Alloc: This is the total allocated gas for the contract based on the
SOPR service • Value: This is the total fee charged to the contract based on the SOPR
service • NSAOR Alloc: This is the total allocated gas for the contract based on the
NSAOR service • Value: This is the total fee charged to the contract based on the NSAOR
service • UOR Alloc: This is the total allocated gas for the contract based on the UOR
service • Value: This is the total fee charged to the contract based on the UOR
service Toggle the plus sign (+) to view the details of allocated data at point level.
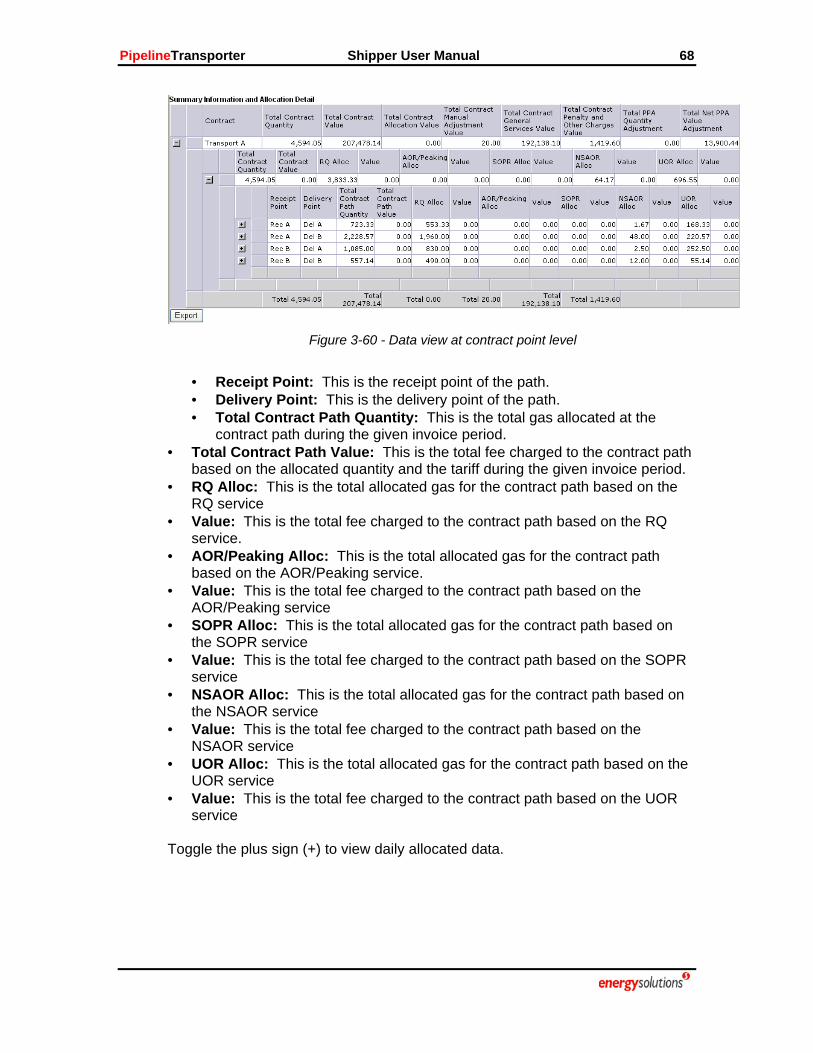
PipelineTransporter Shipper User Manual 68
Figure 3-60 - Data view at contract point level
• Receipt Point: This is the receipt point of the path. • Delivery Point: This is the delivery point of the path. • Total Contract Path Quantity: This is the total gas allocated at the
contract path during the given invoice period. • Total Contract Path Value: This is the total fee charged to the contract path
based on the allocated quantity and the tariff during the given invoice period. • RQ Alloc: This is the total allocated gas for the contract path based on the
RQ service • Value: This is the total fee charged to the contract path based on the RQ
service. • AOR/Peaking Alloc: This is the total allocated gas for the contract path
based on the AOR/Peaking service. • Value: This is the total fee charged to the contract path based on the
AOR/Peaking service • SOPR Alloc: This is the total allocated gas for the contract path based on
the SOPR service • Value: This is the total fee charged to the contract path based on the SOPR
service • NSAOR Alloc: This is the total allocated gas for the contract path based on
the NSAOR service • Value: This is the total fee charged to the contract path based on the
NSAOR service • UOR Alloc: This is the total allocated gas for the contract path based on the
UOR service • Value: This is the total fee charged to the contract path based on the UOR
service Toggle the plus sign (+) to view daily allocated data.
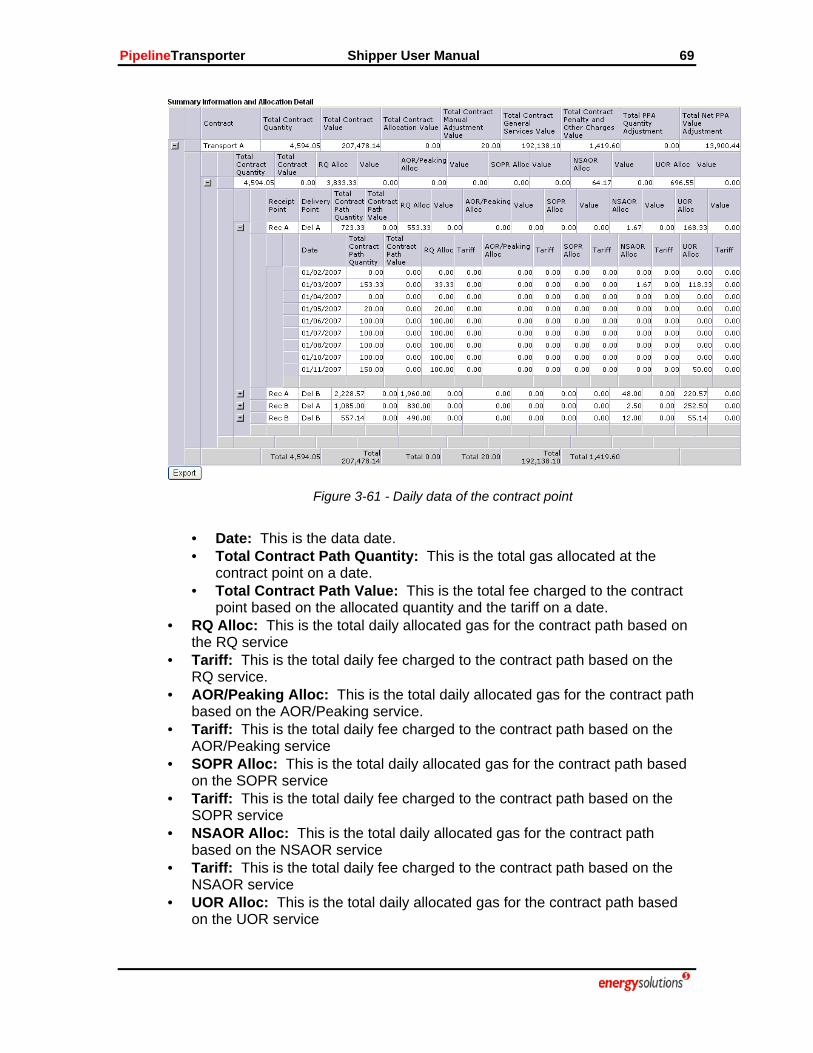
PipelineTransporter Shipper User Manual 69
Figure 3-61 - Daily data of the contract point
• Date: This is the data date. • Total Contract Path Quantity: This is the total gas allocated at the
contract point on a date. • Total Contract Path Value: This is the total fee charged to the contract
point based on the allocated quantity and the tariff on a date. • RQ Alloc: This is the total daily allocated gas for the contract path based on
the RQ service • Tariff: This is the total daily fee charged to the contract path based on the
RQ service. • AOR/Peaking Alloc: This is the total daily allocated gas for the contract path
based on the AOR/Peaking service. • Tariff: This is the total daily fee charged to the contract path based on the
AOR/Peaking service • SOPR Alloc: This is the total daily allocated gas for the contract path based
on the SOPR service • Tariff: This is the total daily fee charged to the contract path based on the
SOPR service • NSAOR Alloc: This is the total daily allocated gas for the contract path
based on the NSAOR service • Tariff: This is the total daily fee charged to the contract path based on the
NSAOR service • UOR Alloc: This is the total daily allocated gas for the contract path based
on the UOR service

PipelineTransporter Shipper User Manual 70
• Tariff: This is the total daily fee charged to the contract path based on the UOR service
Manual Adjustments
Figure 3-62 – Manual Adjustment Summary
This grid displays the manual adjustments made to the contracts related to the selected network, company, contract type, and invoice period. • Contract: This is the code of the contract related to the selected network,
company, contract type, and invoice period • Total Adjustment: This is the total manual adjustment made to the contract
during the given invoice period. • Credit: This is the total value credited to the contract during the given
invoice period. • Debit: This is the total value debited from the contract during the given
invoice period Toggle the plus sign (+) to view the daily details of the contract manual adjustment.
Figure 3-63 - Daily data of the contract manual adjustment
• Date: This is the data date. • Code: This is the unique code of the manual adjustment • Description: This is the description of the manual adjustment.
• Credit: This is the total value credited to the contract on a date. • Debit: This is the total value debited from the contract on a date.
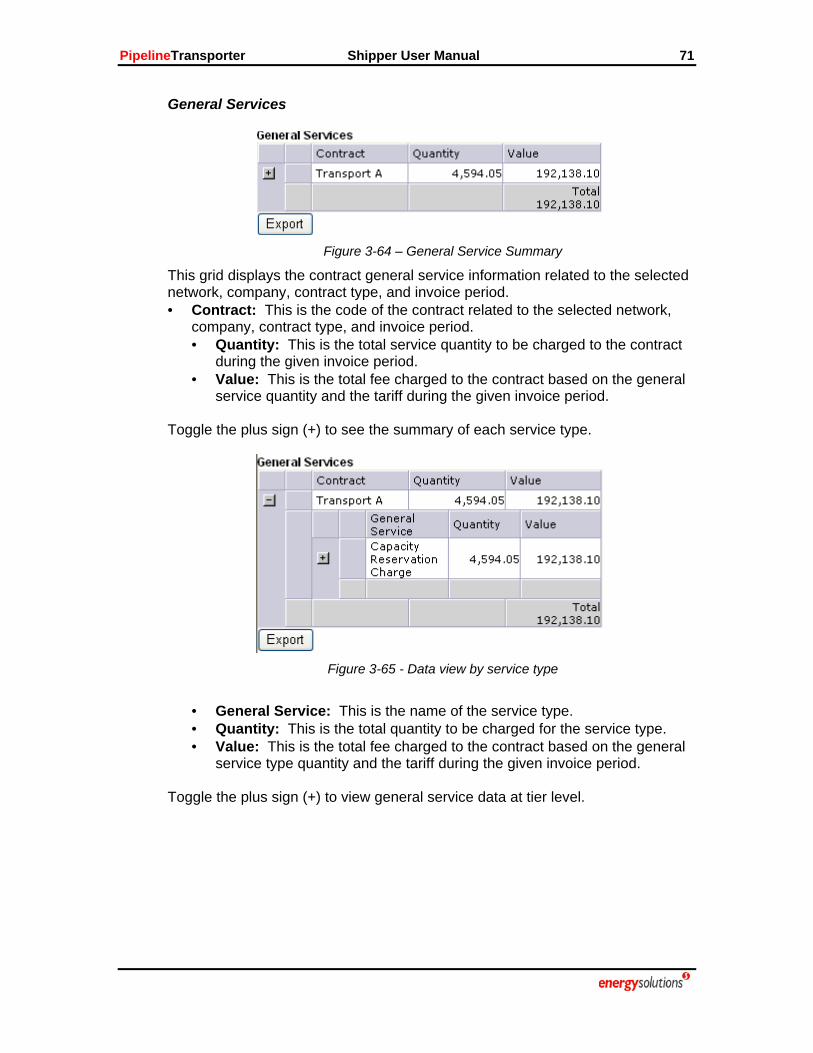
PipelineTransporter Shipper User Manual 71
General Services
Figure 3-64 – General Service Summary
This grid displays the contract general service information related to the selected network, company, contract type, and invoice period. • Contract: This is the code of the contract related to the selected network,
company, contract type, and invoice period. • Quantity: This is the total service quantity to be charged to the contract
during the given invoice period. • Value: This is the total fee charged to the contract based on the general
service quantity and the tariff during the given invoice period. Toggle the plus sign (+) to see the summary of each service type.
Figure 3-65 - Data view by service type
• General Service: This is the name of the service type. • Quantity: This is the total quantity to be charged for the service type. • Value: This is the total fee charged to the contract based on the general
service type quantity and the tariff during the given invoice period. Toggle the plus sign (+) to view general service data at tier level.

PipelineTransporter Shipper User Manual 72
Figure 3-66 - Daily data of the contract point
• Tier Level: This is the level of tiers. Smaller number represents higher
priority. • Quantity: This is the quantity to be charged at the tier level. • Tariff: This is the total fee charged to the contract based on the tier level
and the tariff during the given invoice period. Penalties and Other Charges
Figure 3-67 – Summary of Penalties and Other Charges
This grid presents the contract penalty information related to the selected network, company, contract type, and invoice period.
• Contract: This is the code of the contract related to the selected network, company, contract type, and invoice period.
• Value: This is the total penalty charge for the contract based on the penalty quantity and the tariff during the given invoice period.
Toggle the plus sign (+) to view the penalty value for each penalty type.
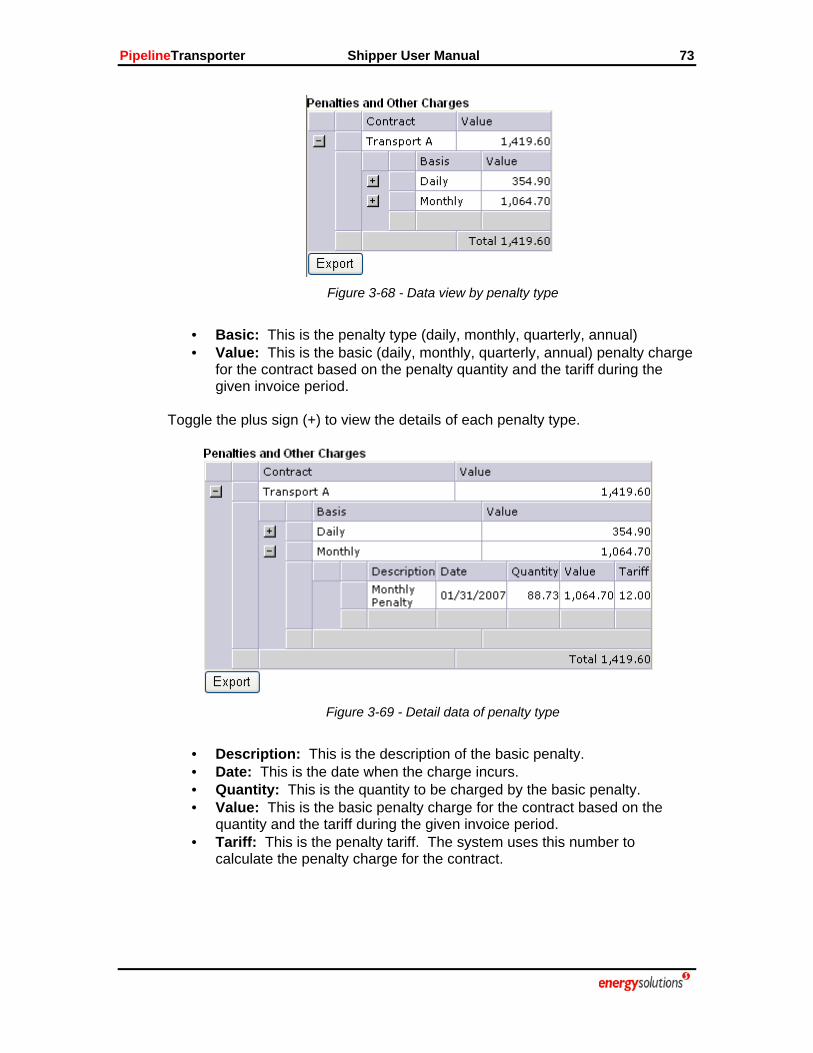
PipelineTransporter Shipper User Manual 73
Figure 3-68 - Data view by penalty type
• Basic: This is the penalty type (daily, monthly, quarterly, annual) • Value: This is the basic (daily, monthly, quarterly, annual) penalty charge
for the contract based on the penalty quantity and the tariff during the given invoice period.
Toggle the plus sign (+) to view the details of each penalty type.
Figure 3-69 - Detail data of penalty type
• Description: This is the description of the basic penalty. • Date: This is the date when the charge incurs. • Quantity: This is the quantity to be charged by the basic penalty. • Value: This is the basic penalty charge for the contract based on the
quantity and the tariff during the given invoice period. • Tariff: This is the penalty tariff. The system uses this number to
calculate the penalty charge for the contract.

PipelineTransporter Shipper User Manual 74
Prior Period Adjustments
Figure 3-70 – Prior Period Adjustment Summary
This grid displays the prior period adjustments made to the contracts related to the selected network, company, contract type, and invoice period. • Contract: This is the code of the contract related to the selected network,
company, contract type, and invoice period • Quantity: This is the total quantity adjusted by the PPAs for the contract
during the given invoice period. • Net Adjustment Value: This is the total value adjusted by the PPA for the
contract during the given invoice period. Toggle the plus sign (+) to view the details of each prior period adjustment.
Figure 3-71 - Daily data of the contract manual adjustment
• Invoice Period: This is the invoice period when the PPA was created. • PPA ID: This is the unique identification of the PPA • Quantity: This is the quantity adjusted by the PPA. • Net Adjustment Value: This is the value adjusted by the PPA. • PPA Name: This provides a link to view the data of the PPA. Refer to
the chapter 3.4.3 PREVIEW PPA for screenshots and details on PPA preview.

PipelineTransporter Shipper User Manual 75
3.4.3 PREVIEW PPA
Figure 3-72 - Preview PPA
This screen displays changes made to the contract during a PPA invoice. Data displayed in each grid should reflect the original value, new value and the difference
Filter Descriptions
• Concluded: The checkbox to filter the list of PPAs existing in the system. If it is checked, all PPAs listed in the PPA combo box are concluded. Otherwise, all are non-concluded.
• PPA: The combo box that lists concluded/non-concluded PPAs.
• Contract: This is the list of contracts related to the selected PPA.
• Invoicing Period: This is the invoice period which was opened by the selected PPA.
• Preview: Click the button to preview PPA data..
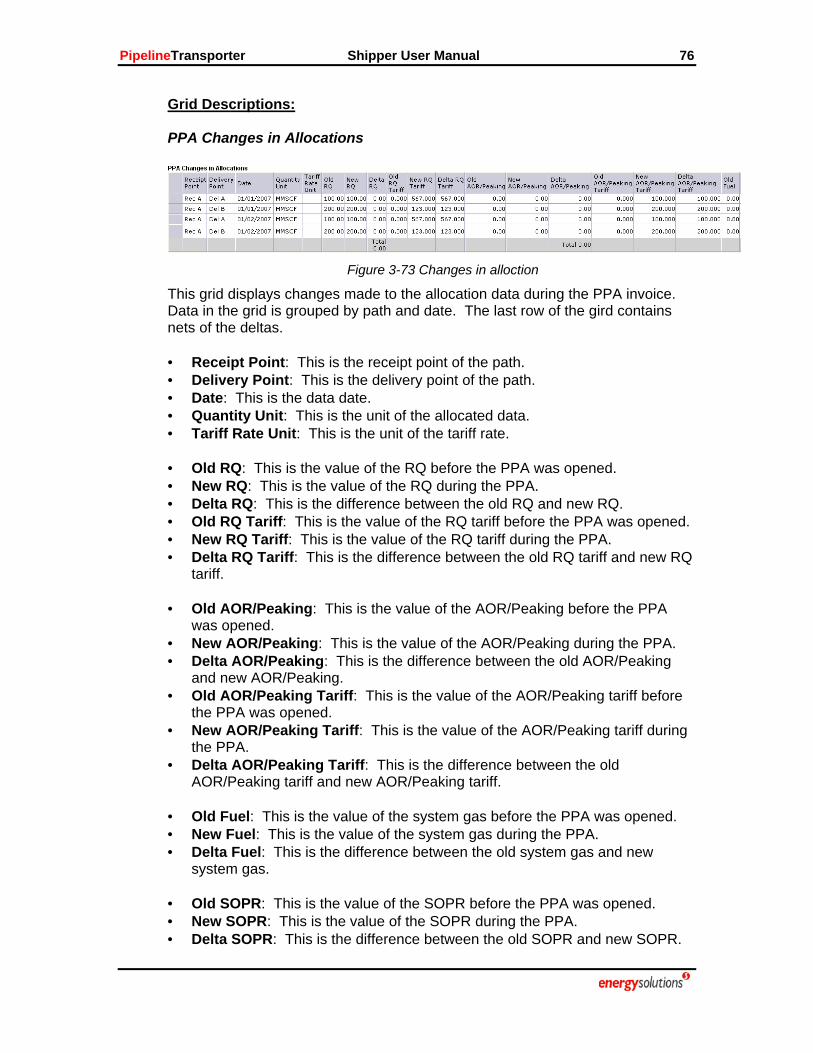
PipelineTransporter Shipper User Manual 76
Grid Descriptions: PPA Changes in Allocations
Figure 3-73 Changes in alloction
This grid displays changes made to the allocation data during the PPA invoice. Data in the grid is grouped by path and date. The last row of the gird contains nets of the deltas. • Receipt Point: This is the receipt point of the path. • Delivery Point: This is the delivery point of the path. • Date: This is the data date. • Quantity Unit: This is the unit of the allocated data. • Tariff Rate Unit: This is the unit of the tariff rate. • Old RQ: This is the value of the RQ before the PPA was opened. • New RQ: This is the value of the RQ during the PPA. • Delta RQ: This is the difference between the old RQ and new RQ. • Old RQ Tariff: This is the value of the RQ tariff before the PPA was opened. • New RQ Tariff: This is the value of the RQ tariff during the PPA. • Delta RQ Tariff: This is the difference between the old RQ tariff and new RQ
tariff. • Old AOR/Peaking: This is the value of the AOR/Peaking before the PPA
was opened. • New AOR/Peaking: This is the value of the AOR/Peaking during the PPA. • Delta AOR/Peaking: This is the difference between the old AOR/Peaking
and new AOR/Peaking. • Old AOR/Peaking Tariff: This is the value of the AOR/Peaking tariff before
the PPA was opened. • New AOR/Peaking Tariff: This is the value of the AOR/Peaking tariff during
the PPA. • Delta AOR/Peaking Tariff: This is the difference between the old
AOR/Peaking tariff and new AOR/Peaking tariff.
• Old Fuel: This is the value of the system gas before the PPA was opened. • New Fuel: This is the value of the system gas during the PPA. • Delta Fuel: This is the difference between the old system gas and new
system gas.
• Old SOPR: This is the value of the SOPR before the PPA was opened. • New SOPR: This is the value of the SOPR during the PPA. • Delta SOPR: This is the difference between the old SOPR and new SOPR.

PipelineTransporter Shipper User Manual 77
• Old SOPR Tariff: This is the value of the SOPR tariff before the PPA was opened.
• New SOPR Tariff: This is the value of the SOPR tariff during the PPA. • Delta SOPR Tariff: This is the difference between the old SOPR tariff and
new SOPR tariff. • Old NSAOR: This is the value of the NSAOR before the PPA was opened. • New NSAOR: This is the value of the NSAOR during the PPA. • Delta NSAOR: This is the difference between the old NSAOR and new
NSAOR. • Old NSAOR Tariff: This is the value of the NSAOR tariff before the PPA was
opened. • New NSAOR Tariff: This is the value of the NSAOR tariff during the PPA. • Delta NSAOR Tariff: This is the difference between the old NSAOR tariff
and new NSAOR tariff. • Old NSAOR: This is the value of the UOR before the PPA was opened. • New NSAOR: This is the value of the UOR during the PPA. • Delta NSAOR: This is the difference between the old UOR and new UOR. • Old NSAOR Tariff: This is the value of the UOR tariff before the PPA was
opened. • New NSAOR Tariff: This is the value of the UOR tariff during the PPA. • Delta NSAOR Tariff: This is the difference between the old UOR tariff and
new UOR tariff.
PPA Changes for Daily Penalties
Figure 3-74 - Changes in daily penalty
This grid displays changes made to the daily penalty data during the PPA invoice. Data in the grid is shown by date. • Penalty: This is the name of the daily penalty. • Date: This is the data date. • Original Value: This is the daily penalty value before the PPA was opened. • New Value: This is the daily penalty value during the PPA • Delta Value: This is the difference between the original value and the new
value. • Unit: This is the unit of the daily penalty value • Original Tariff: This is the daily penalty tariff before the PPA was opened. • New Tariff: This is the daily penalty tariff during the PPA • Delta Tariff: This is the difference between the original penalty tariff and the
new penalty tariff. • Unit: This is the unit of the daily penalty tariff
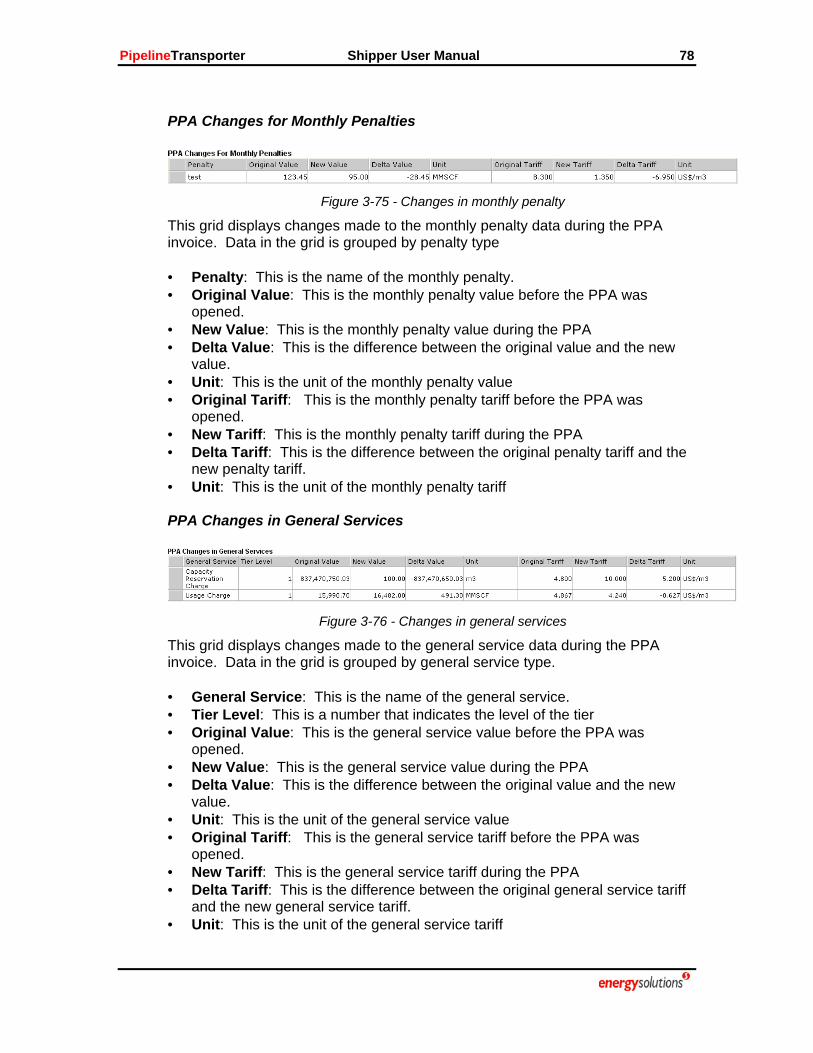
PipelineTransporter Shipper User Manual 78
PPA Changes for Monthly Penalties
Figure 3-75 - Changes in monthly penalty
This grid displays changes made to the monthly penalty data during the PPA invoice. Data in the grid is grouped by penalty type • Penalty: This is the name of the monthly penalty. • Original Value: This is the monthly penalty value before the PPA was
opened. • New Value: This is the monthly penalty value during the PPA • Delta Value: This is the difference between the original value and the new
value. • Unit: This is the unit of the monthly penalty value • Original Tariff: This is the monthly penalty tariff before the PPA was
opened. • New Tariff: This is the monthly penalty tariff during the PPA • Delta Tariff: This is the difference between the original penalty tariff and the
new penalty tariff. • Unit: This is the unit of the monthly penalty tariff
PPA Changes in General Services
Figure 3-76 - Changes in general services
This grid displays changes made to the general service data during the PPA invoice. Data in the grid is grouped by general service type. • General Service: This is the name of the general service. • Tier Level: This is a number that indicates the level of the tier • Original Value: This is the general service value before the PPA was
opened. • New Value: This is the general service value during the PPA • Delta Value: This is the difference between the original value and the new
value. • Unit: This is the unit of the general service value • Original Tariff: This is the general service tariff before the PPA was
opened. • New Tariff: This is the general service tariff during the PPA • Delta Tariff: This is the difference between the original general service tariff
and the new general service tariff. • Unit: This is the unit of the general service tariff
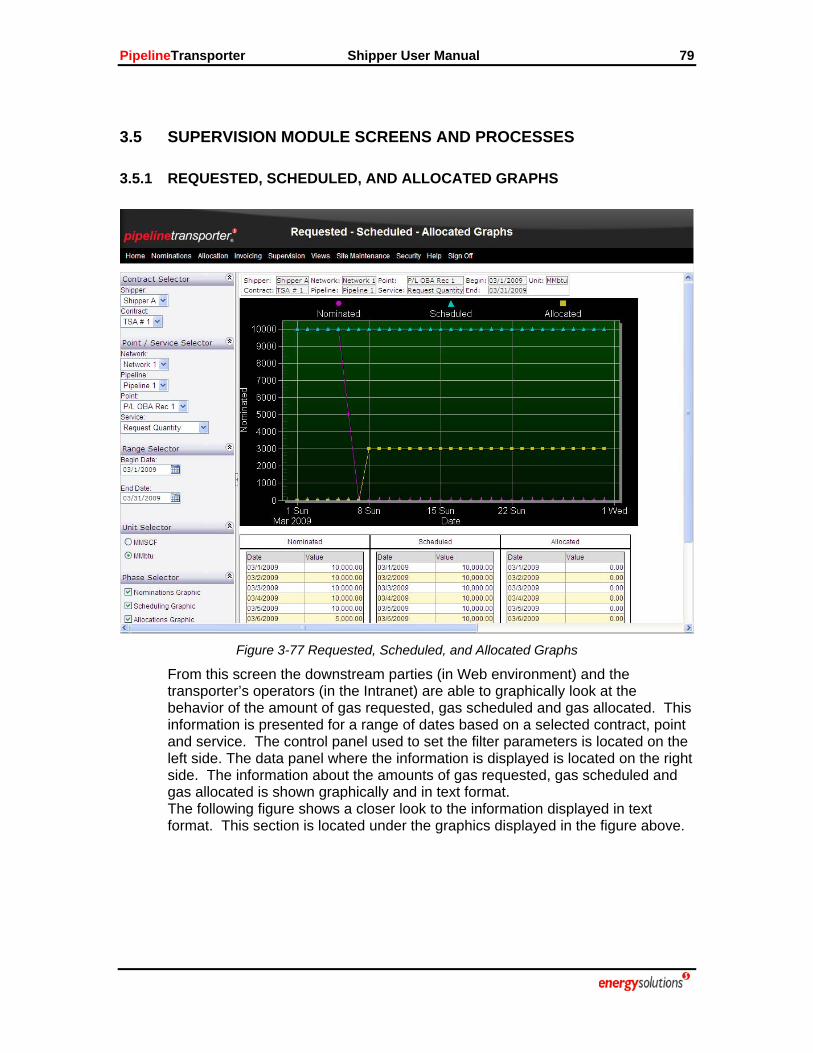
PipelineTransporter Shipper User Manual 79
3.5 SUPERVISION MODULE SCREENS AND PROCESSES
3.5.1 REQUESTED, SCHEDULED, AND ALLOCATED GRAPHS
Figure 3-77 Requested, Scheduled, and Allocated Graphs
From this screen the downstream parties (in Web environment) and the transporter’s operators (in the Intranet) are able to graphically look at the behavior of the amount of gas requested, gas scheduled and gas allocated. This information is presented for a range of dates based on a selected contract, point and service. The control panel used to set the filter parameters is located on the left side. The data panel where the information is displayed is located on the right side. The information about the amounts of gas requested, gas scheduled and gas allocated is shown graphically and in text format. The following figure shows a closer look to the information displayed in text format. This section is located under the graphics displayed in the figure above.
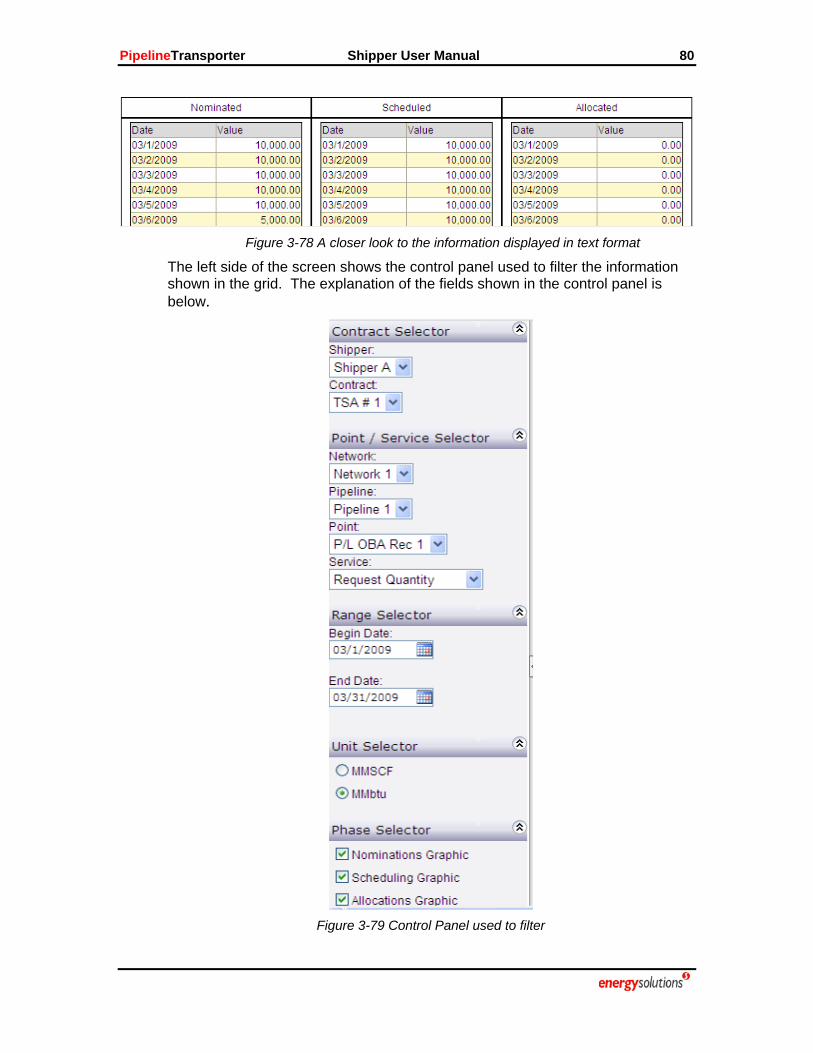
PipelineTransporter Shipper User Manual 80
Figure 3-78 A closer look to the information displayed in text format
The left side of the screen shows the control panel used to filter the information shown in the grid. The explanation of the fields shown in the control panel is below.
Figure 3-79 Control Panel used to filter

PipelineTransporter Shipper User Manual 81
Filter Information:
• Shipper: This is the shipper who does the nominations. The list of available shippers is automatically updated from the information configured in the system. For web-enabled access, this field is automatically selected based on the account used to log into the system and it is not possible to change it.
• Contract: This is the name of the contract. The list of available contracts is automatically updated based on the shipper selected.
• Network: This is the name of the gas pipeline network. This field is updated automatically based on the contract selected.
• Pipeline: This is the name of the pipeline. The list of available pipelines is automatically updated based on the contract/network selected.
• Point: This is the measurement point which gas is going to be reported (graphically and in text). The list of possible measurement points is updated automatically based on the contract and pipeline selected.
• Service: This is the transportation gas service to be reported. The list of possible services is predefined by the system (RQ, AOR, SOP Recovery, Fuel and Imbalance).
• Range Selector: This is the selected period defined by a begin date and an end date. The user can select any date using a calendar provided by the system.
• Unit: This is the unit used to express all the gas amounts. The system provides radio buttons to select either the system standard volumetric unit (i.e. m3) or the system standard energy unit (i.e. mbtu).
• Phases: These are the three phases on which the system can report the gas amounts. The PLT System handles three phases: Requested Gas (nominated), Scheduled Gas and Allocated Gas. Using check boxes, the user can select any combination of phases to be reported graphically and in text.
The right side of the screen shows the data panel used to display the grid and also includes other useful controls. At the top of the grid there is a summary of the values used to filter the information displayed in the grid. The boxes shown in this section are explained below:
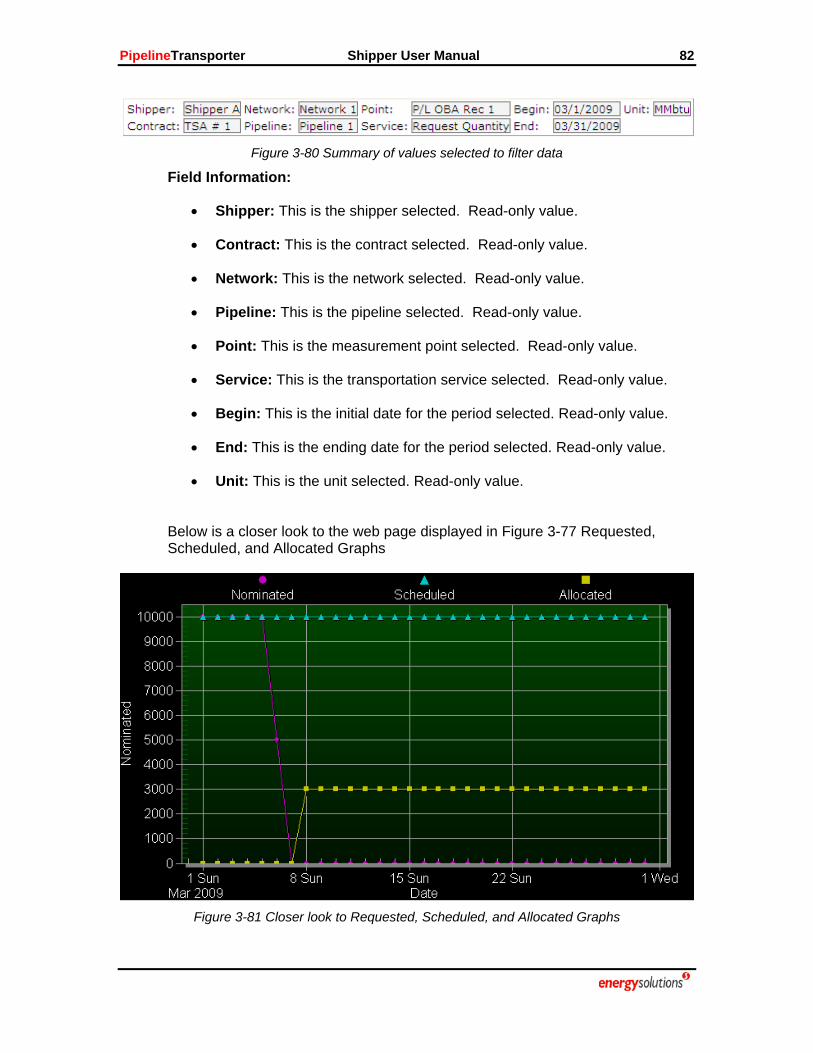
PipelineTransporter Shipper User Manual 82
Figure 3-80 Summary of values selected to filter data
Field Information:
• Shipper: This is the shipper selected. Read-only value.
• Contract: This is the contract selected. Read-only value.
• Network: This is the network selected. Read-only value.
• Pipeline: This is the pipeline selected. Read-only value.
• Point: This is the measurement point selected. Read-only value.
• Service: This is the transportation service selected. Read-only value.
• Begin: This is the initial date for the period selected. Read-only value.
• End: This is the ending date for the period selected. Read-only value.
• Unit: This is the unit selected. Read-only value.
Below is a closer look to the web page displayed in Figure 3-77 Requested, Scheduled, and Allocated Graphs
Figure 3-81 Closer look to Requested, Scheduled, and Allocated Graphs

PipelineTransporter Shipper User Manual 83
There is a specialized menu available to adjust the appearance of the graphic that can be used also to maximize its size and to export it as an external graphic file (i.e. jpg file). The content and explanation of this menu is beyond the scope of this manual but it is recommended that the user explore and try all the options. To show up the menu, right click on the graphic. The following context menu will appear.
Figure 3-82 Specialized menu to change graphic attributes
Figure 3-83 is an example of a graphic obtained after changes were made to some attributes through the specialized menu options.
Figure 3-83 Example of an edited graphic
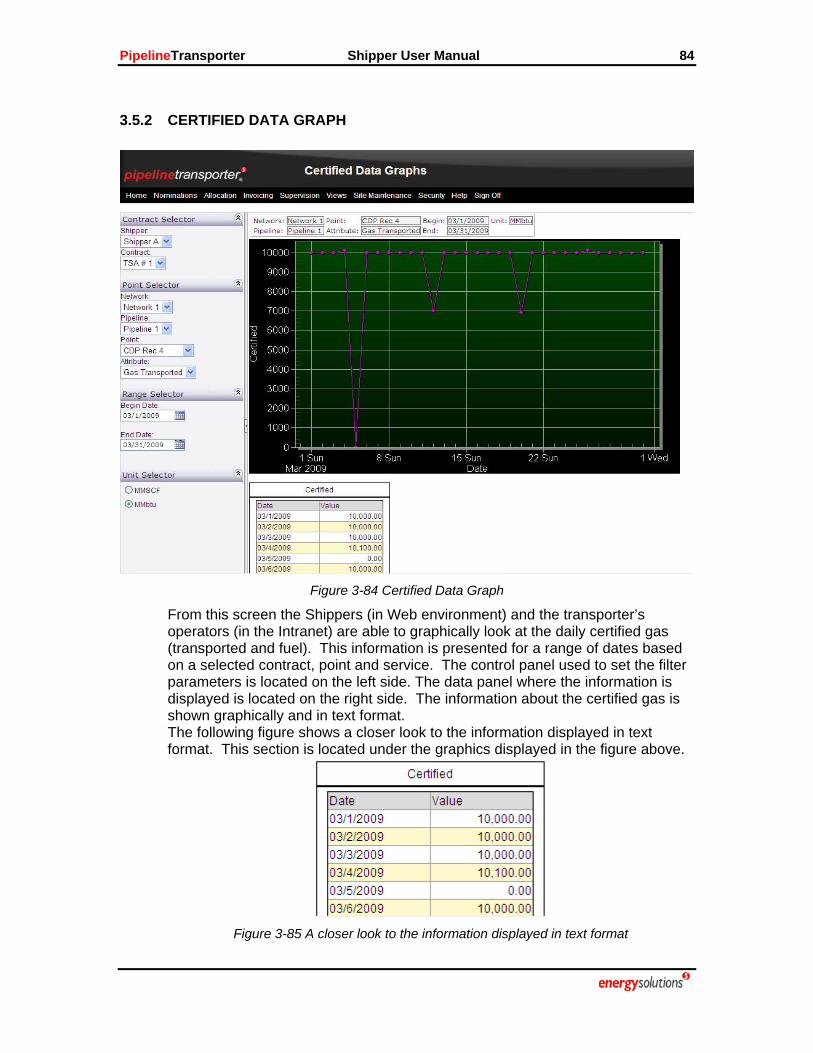
PipelineTransporter Shipper User Manual 84
3.5.2 CERTIFIED DATA GRAPH
Figure 3-84 Certified Data Graph
From this screen the Shippers (in Web environment) and the transporter’s operators (in the Intranet) are able to graphically look at the daily certified gas (transported and fuel). This information is presented for a range of dates based on a selected contract, point and service. The control panel used to set the filter parameters is located on the left side. The data panel where the information is displayed is located on the right side. The information about the certified gas is shown graphically and in text format. The following figure shows a closer look to the information displayed in text format. This section is located under the graphics displayed in the figure above.
Figure 3-85 A closer look to the information displayed in text format

PipelineTransporter Shipper User Manual 85
The left side of the screen shows the control panel used to filter the information shown in the grid.
Figure 3-86 Control Panel used to filter
Filter Information:
• Shipper: This is the shipper who owns the contract. The list of available shippers is automatically updated from the information configured in the system. For web-enabled access, this field is automatically selected based on the account used to login into the system and it is not possible to change it.
• Contract: This is the name of the contract. The list of available contracts is automatically updated based on the shipper selected.
• Network: This is the name of the gas pipeline network. This field is updated automatically based on the contract selected.
• Pipeline: This is the name of the pipeline. The list of available pipelines is automatically updated based on the contract/network selected.

PipelineTransporter Shipper User Manual 86
• Point: This is the measurement point which certified gas is going to be reported (graphically and in text). The list of possible measurement points is updated automatically based on the contract and pipeline selected.
• Attribute: This is the type of gas certified to be reported. The list of possible values is predefined by the system as Transported Gas and Fuel.
• Period: This is the selected period defined by a begin date and an end date. The user can select any date using a calendar provided by the system.
• Unit: This is the unit used to express all the gas amounts. The system provides radio buttons to select either the system standard volumetric unit (i.e. m3) or the system standard energy unit (i.e. mbtu).
The right side of the screen shows the data panel used to display the grid and also includes other useful controls.
At the top of the grid there is a summary of the values used to filter the information displayed in the grid. The boxes shown in this section are explained below:
Figure 3-87 Summary of values selected to filter data
Field Information:
• Network: This is the network selected. Read-only value.
• Pipeline: This is the pipeline selected. Read-only value.
• Point: This is the measurement point selected. Read-only value.
• Attribute: This is the type of certified gas selected. Read-only value.
• Begin: This is the initial date for the period selected. Read-only value.
• End: This is the ending date for the period selected. Read-only value.
• Unit: This is the unit selected. Read-only value.
Below is a closer look to the web page displayed in Figure 3-84 Certified Data Graph.
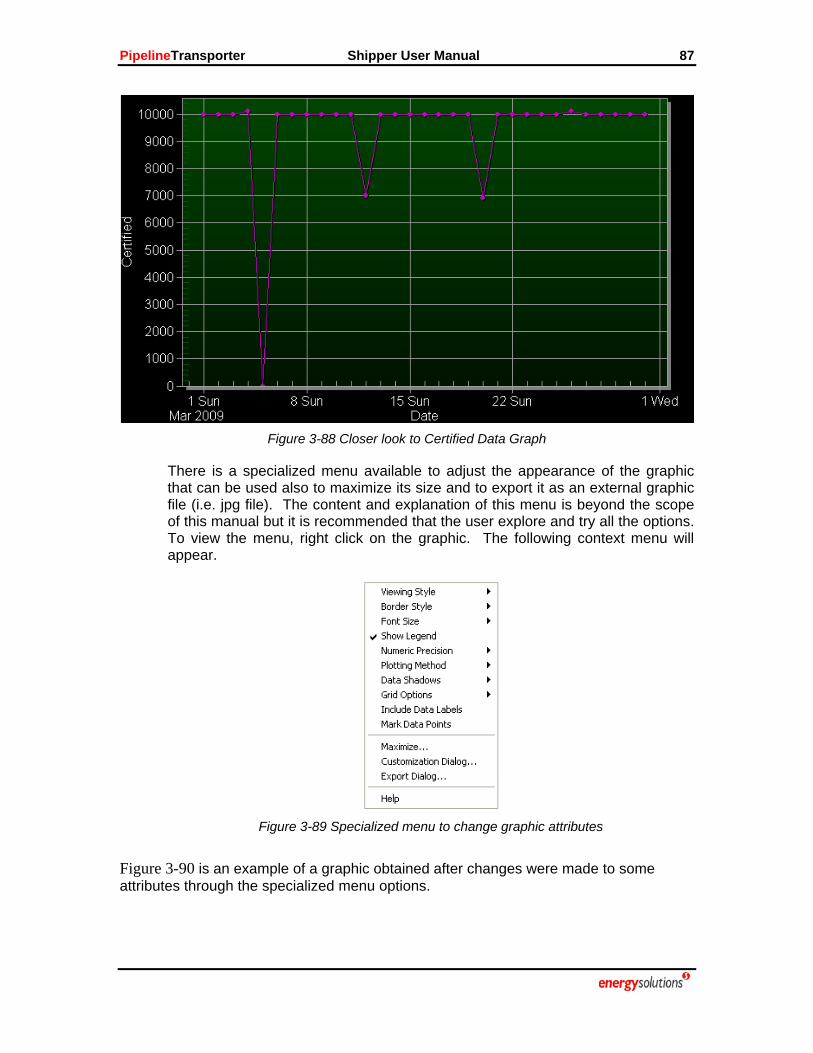
PipelineTransporter Shipper User Manual 87
Figure 3-88 Closer look to Certified Data Graph
There is a specialized menu available to adjust the appearance of the graphic that can be used also to maximize its size and to export it as an external graphic file (i.e. jpg file). The content and explanation of this menu is beyond the scope of this manual but it is recommended that the user explore and try all the options. To view the menu, right click on the graphic. The following context menu will appear.
Figure 3-89 Specialized menu to change graphic attributes
Figure 3-90 is an example of a graphic obtained after changes were made to some attributes through the specialized menu options.

PipelineTransporter Shipper User Manual 88
Figure 3-90 Example of an edited graphic

PipelineTransporter Shipper User Manual 89
3.6 VIEWS MODULE SCREENS AND PROCESSES
3.6.1 CRYSTAL REPORT
Figure 3-91 Crystal Report Tree
This web page allows the user to browse and view predefined Crystal reports in the system. The number of Crystal reports listed under the tree depends on the role of the login user. From the left panel, select a Crystal report under the tree. The action brings up the report interface on the right.
Figure 3-92 Crystal Report Parameters
Input values for all listed parameters and click button ‘Apply’ to view the report. Below is the sample screenshot of Certified Values report.
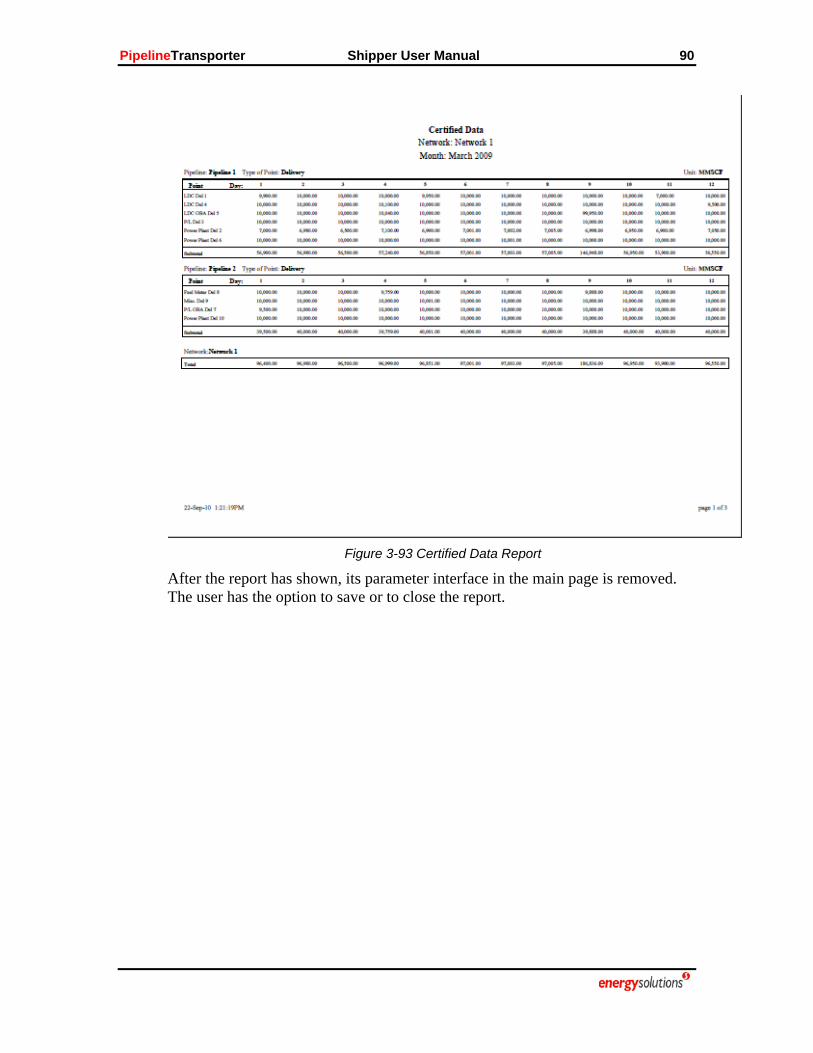
PipelineTransporter Shipper User Manual 90
Figure 3-93 Certified Data Report
After the report has shown, its parameter interface in the main page is removed. The user has the option to save or to close the report.

PipelineTransporter Shipper User Manual 91
3.6.2 VIEW - STANDARD
Figure 3-94 View - Standard
This web page is used to view data in the database based on the predefined queries.
To create a data view, a predefined query must be selected using the combo box “Predefined Queries”. The data view is populated immediately after the query is selected.
Below is an example of a data view.
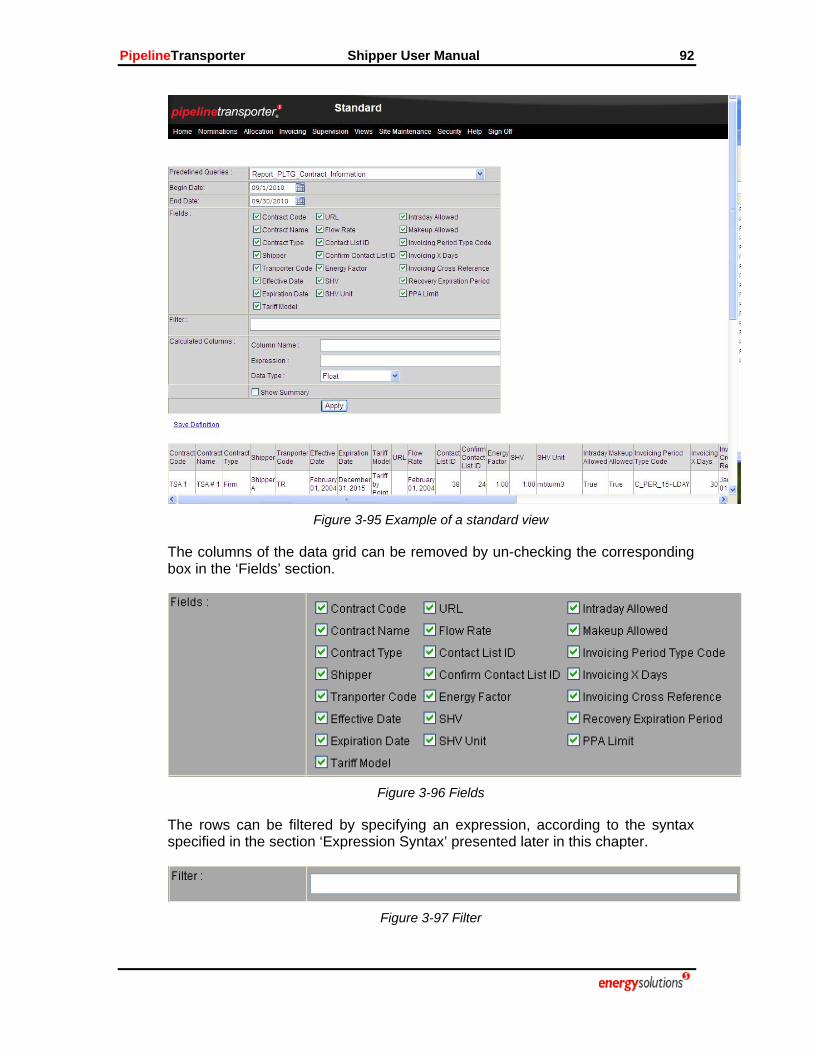
PipelineTransporter Shipper User Manual 92
Figure 3-95 Example of a standard view
The columns of the data grid can be removed by un-checking the corresponding box in the ‘Fields’ section.
Figure 3-96 Fields
The rows can be filtered by specifying an expression, according to the syntax specified in the section ‘Expression Syntax’ presented later in this chapter.
Figure 3-97 Filter

PipelineTransporter Shipper User Manual 93
New columns can be added to the report. An expression must be specified for the new column (for syntax see ‘Expression Syntax’). This new column will be put immediately in the view and will be added into the “Fields” selector list so that it can be hidden later.
Figure 3-98 Calculated Columns
The button “Apply” (see Figure 3-95 Example of a view) must be used to apply the changes done to the view (checking or un-checking columns, filter rows or creating new columns).
A summarizing row can be added at the end of the grid to calculate the total, minimum, maximum and average of numeric columns. To do that the check box “Show Summary” must be checked.
Figure 3-99 Show Summary
By clicking the ‘Save Definition’ button the user is taken to the following section of the web page:
Figure 3-100 Save Definition
By giving an ID and a name to the view, the definition is saved in the database. After the data view is saved the following popup window is displayed confirming the result.
Figure 3-101 Confirmation

PipelineTransporter Shipper User Manual 94
From the web page View - Standard (see Figure 3-94 View - Standard) it is also possible to print and to export a report.
To print the report use the “Print” button which will display a screen like the one shown below. This screen is a preview of the information being printed.
Figure 3-102 Preview of the report to be printed
The following popup window is displayed later by the windows system to select the available printers.
Figure 3-103 Selecting the Printer
To export the report use the “Export” button which will download the report data to a CSV file. The following popup window is displayed to request the action to do with the downloaded file.
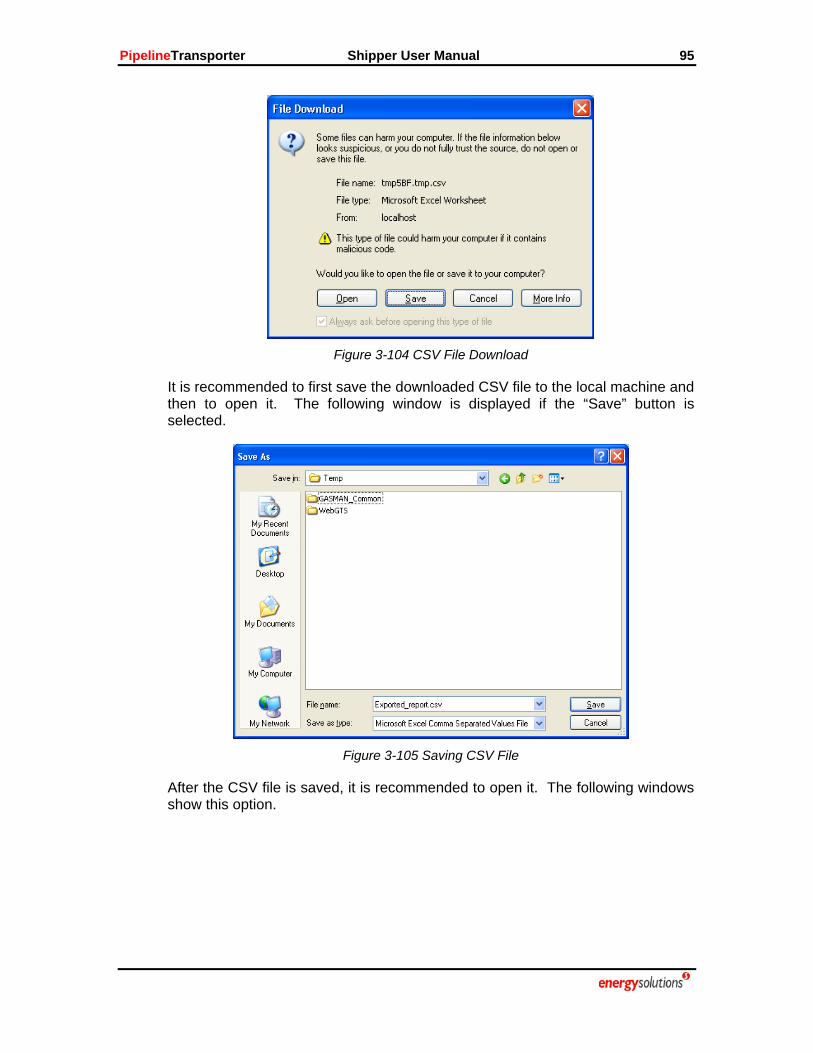
PipelineTransporter Shipper User Manual 95
Figure 3-104 CSV File Download
It is recommended to first save the downloaded CSV file to the local machine and then to open it. The following window is displayed if the “Save” button is selected.
Figure 3-105 Saving CSV File
After the CSV file is saved, it is recommended to open it. The following windows show this option.

PipelineTransporter Shipper User Manual 96
Figure 3-106 Download complete
The following figure shows an example of a report downloaded as a CSV file. For the example, the CSV file was opened using the Excel application.
Figure 3-107 Viewing CSV File (downloaded report)
3.6.2.1 EXPRESSION SYNTAX
When creating an expression, use the Column Name to refer to columns. For example, if the Column Name for one column is "UnitPrice", and another "Quantity", the expression would be:
"UnitPrice * Quantity"
When creating an expression for a filter, enclose strings with single quotes:
"LastName = 'Jones'"
The following characters have special meaning and must be escaped, as shown below, if they are to be used in a column name:
\n (newline)
\t (tab)
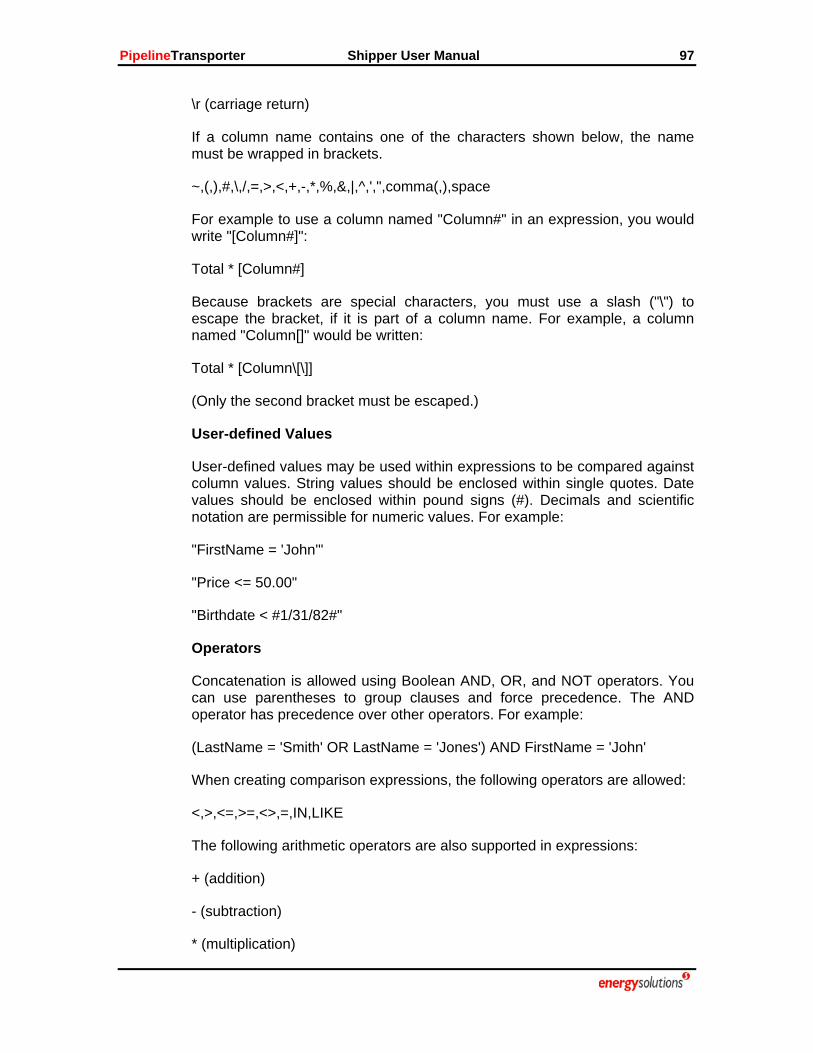
PipelineTransporter Shipper User Manual 97
\r (carriage return)
If a column name contains one of the characters shown below, the name must be wrapped in brackets.
~,(,),#,\,/,=,>,<,+,-,*,%,&,|,^,',",comma(,),space
For example to use a column named "Column#" in an expression, you would write "[Column#]":
Total * [Column#]
Because brackets are special characters, you must use a slash ("\") to escape the bracket, if it is part of a column name. For example, a column named "Column[]" would be written:
Total * [Column\[\]]
(Only the second bracket must be escaped.)
User-defined Values
User-defined values may be used within expressions to be compared against column values. String values should be enclosed within single quotes. Date values should be enclosed within pound signs (#). Decimals and scientific notation are permissible for numeric values. For example:
"FirstName = 'John'"
"Price <= 50.00"
"Birthdate < #1/31/82#"
Operators
Concatenation is allowed using Boolean AND, OR, and NOT operators. You can use parentheses to group clauses and force precedence. The AND operator has precedence over other operators. For example:
(LastName = 'Smith' OR LastName = 'Jones') AND FirstName = 'John'
When creating comparison expressions, the following operators are allowed:
<,>,<=,>=,<>,=,IN,LIKE
The following arithmetic operators are also supported in expressions:
+ (addition)
- (subtraction)
* (multiplication)
PipelineTransporter Shipper User Manual 98
/ (division)
% (modulus)
String Operators
To concatenate a string, use the + character.
Wildcard Characters
Both the * and % can be used interchangeably for wildcards in a LIKE comparison. If the string in a LIKE clause contains a * or %, those characters should be escaped in brackets ([]). If a bracket is in the clause, the bracket characters should be escaped in brackets (for example [[] or []]). A wildcard is allowed at the beginning and end of a pattern, or at the end of a pattern, or at the beginning of a pattern. For example:
"ItemName LIKE '*product*'"
"ItemName LIKE '*product'"
"ItemName LIKE 'product*'"
Wildcards are not allowed in the middle of a string. For example, 'te*xt' is not allowed.

PipelineTransporter Shipper User Manual 99
3.6.3 OPEN SAVED VIEWS
Figure 3-108 View – Open a saved view
This web page is used to open a view previously modified and saved.
To open a data view, a selection must be done from the list provided by the PLT System. To select the saved view, click on the view name shown in the second column of the grid.
Below is shown an example of a saved view.
Figure 3-109 Example of a saved view
From this point, all the functionality of the web page is the same as the one presented in section 3.6.2.
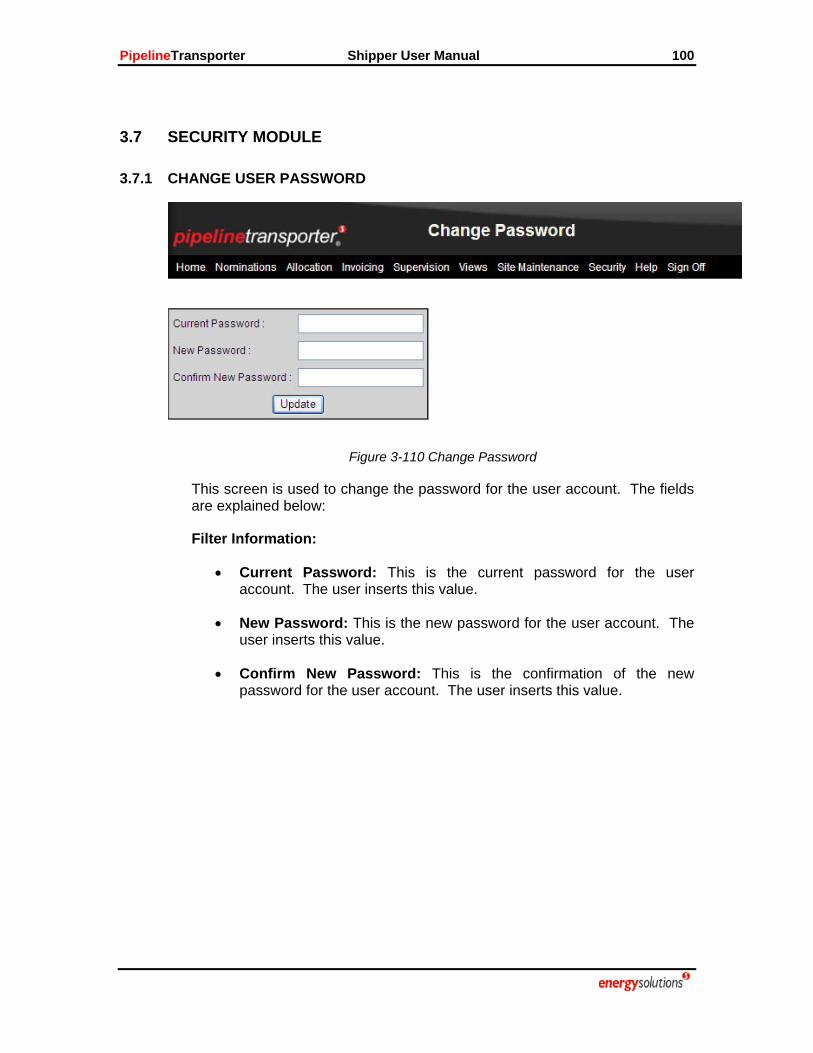
PipelineTransporter Shipper User Manual 100
3.7 SECURITY MODULE
3.7.1 CHANGE USER PASSWORD
Figure 3-110 Change Password
This screen is used to change the password for the user account. The fields are explained below:
Filter Information:
• Current Password: This is the current password for the user account. The user inserts this value.
• New Password: This is the new password for the user account. The user inserts this value.
• Confirm New Password: This is the confirmation of the new password for the user account. The user inserts this value.