shining cities on a hill or lights under a bushel
TRANSCRIPT

L A V E A B R A C H M A N
J A N U A R Y 2 2 , 2 0 1 5
P R E S E N T A T I O N T O
T H E C E N T E R F O R U R B A N A N D
R E G I O N A L A N A L Y S I S
T H E O H I O S T A T E U N I V E R S I T Y

ABOUT GREATER OHIO POLICY CENTER
A non-partisan non-profit based
in Columbus, Ohio that
champions revitalization and
sustainable redevelopment in
Ohio through policy and
practice:
• Revitalize Ohio’s urban
cores and metropolitan
regions
• Achieve sustainable land
reuse and economic growth

GOPC’S RECENT REPORTS

CENTRAL CHALLENGES
How do we transform Ohio’s cities &
regions for the next economy?
• Rebuilding the city/ rebuilding market demand
• Creating new economic engines
• Building opportunity for the city’s population
How are Ohio Cities Doing?


LEGACY CITIES
Formerly industrial cities that have
experienced significant population
and/or job loss since 1960

LEGACY CITIES UPDATE: MIXED RETURNS
18 cities with population of at
least 50,000 in 2010 & loss of at
least 20% from peak
0
200,000
400,000
600,000
800,000
1,000,000
1,200,000
1,400,000
1,600,000
1,800,000
Population Change 2000-2010
2000
2010

-50
-40
-30
-20
-10
0
10
20D
etr
oit
Cle
vela
nd
Bu
ffalo
Bir
min
gh
am
Pit
tsb
urg
h
St.
Lo
uis
Ph
ila
delp
hia
Balt
imo
re
TOTAL25-34
CITIES FOLLOW DIFFERENT TRAJECTORIES
Some legacy cities show signs of a turnaround,
including Philadelphia, Pittsburgh, Baltimore,
and Syracuse. (2000-2010)
• Can we identify the
factors that have led to
greater regeneration in
some cities?
• Can we apply lessons
of success (or failure)
elsewhere?
• What can cities do in an
age of limited state and
federal support?
Change in (total & young adult) population between 2000-
2010


1. REBUILDING THE PHYSICAL CITY & MARKET
DEMAND
Strategies that are making an impact:
• Targeting resources in viable neighborhoods
• Focusing on rebuilding the downtown
• Repurposing vacant land for new uses

TARGETING RESOURCES IN VIABLE
NEIGHBORHOODS
Maximizes the impact of available scarce resources.
Over-the-Rhine
Cincinnati, OhioSlavic Village
Cleveland, Ohio
Green and Gold Asset and
Place-Based Investment
Strategy
Dayton, Ohio

TARGETED NEIGHBORHOOD PROGRESS
Slavic Village Recovery in
Cleveland:
• Sales prices of the initial homes reached the
targeted amount necessary to cover rehab
costs and make a small $5,000-$10,000
profit; received an appraisal value above the
listed $60,000 sale price.
• Neighborhood morale is high and neighbors
are positive about the project.
• Investment is taking place in the
neighborhood suggesting increased market
confidence
Slavic Village in
Cleveland, Ohio

TARGETED NEIGHBORHOOD PROGRESS
Cincinnati’s Over-the-Rhine:
• Between 2000-2013, median household income has risen from $9,431 to $13,815, which is more than a 46% increase.
• Between 2000-2013, owner occupancy has risen from 2.20% to 6.28%, which is more than a 185% increase.
• Between 2007-2013, the percent of certified tax delinquent properties fell from 9.5% to 6.85%.
• The poverty rate has fallen from, 76.00% in 1990, to 58.74% in 2000, to 33.78% in 2010.

TARGETED NEIGHBORHOOD PROGRESS
Change in Income Distribution in Columbus’ Weinland Park from 2000-2012, compared to Benchmark Neighborhoods
0%
10%
20%
30%
40%
50%
60%
70%
80%
90%
100%
WP, 2000 WP, 2012 BenchmarkNeighborhoods
$100,000
$75,000-$99,999
$50,000-$74,999
$35,000-$49,999
$25,000-$34,999
$15,000-$24,999
<$15,000
15.80%
18.90%
16.50%
7.60% 7.80%
10.60%
0%
2%
4%
6%
8%
10%
12%
14%
16%
18%
20%
Vacancy Rate1990
Vacancy Rate2000
Vacancy RateEstimated for
2012
Weinland Park
City of Columbus
Percent of housing vacancy in Weinland Park

FOCUSING ON REBUILDING THE DOWNTOWN
Many cities are seeing downtown population growth
0
5000
10000
15000
20000
25000
Baltimore Cleveland St.Louis Cincinnati
20002010

FOCUSING ON REBUILDING THE DOWNTOWNProgress is being made in downtowns
Ohio example: Downtown Cleveland Alliance
Downtown Cleveland Alliance, a BID, is implementing
Clean & Safe Program, economic development assistance,
marketing & special events, advocacy and strategic
projects.
… leading to downtown
redevelopment, attracting
people & businesses

…BUT CONTINUED POPULATION LOSS
15% or greater population
loss from 2000 to 2010
Population growth in
Downtown area >15%

OVERALL POPULATION LOSS IN OHIO’S LEGACY
CITIES…

Historic Building in the West End, Cincinnati, Ohio
Photo from http://www.hamiltoncountylandbank.org/portfolio-items/1201-linn/
Hamilton County Land Reutilization Corporation currently accepting
redevelopment proposals for the space.
RE-PURPOSE VACANT LAND FOR NEW USES
- Alternative/green
uses
- Brownfields to
productive reuses
- Land banks hold
properties and clear
delinquent taxes,
liens

VACANCY RATES STILL INCREASING
9.0%
9.5%
10.0%
10.5%
11.0%
11.5%
12.0%
12.5%
13.0%
13.5%
2007 2012
Akron, OH
Cincinnati, OH--KY--INCleveland, OH
Dayton, OH
Detroit, MI
Toledo, OH--MI
Housing Vacancy Rates in Legacy Cities

2. CREATING NEW ECONOMIC ENGINES
FOR THE CITY AND REGION
Strategies having an impact:
• Leveraging Anchor Institutions
• Building a Competitive Advantage
• Regional regrowth
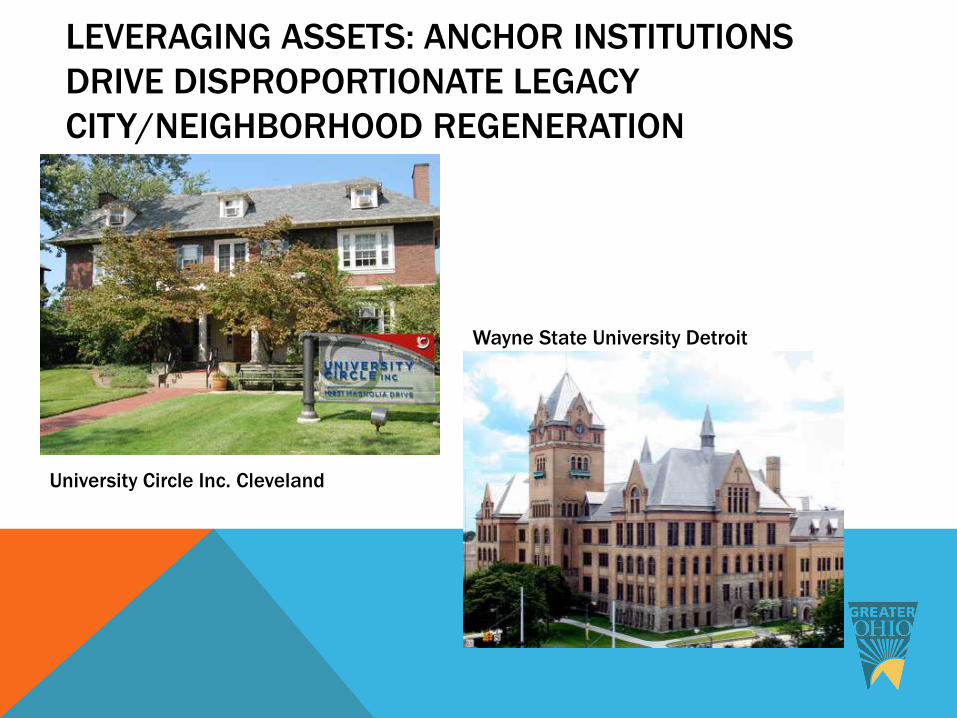
LEVERAGING ASSETS: ANCHOR INSTITUTIONS
DRIVE DISPROPORTIONATE LEGACY
CITY/NEIGHBORHOOD REGENERATION
Wayne State University Detroit
University Circle Inc. Cleveland

LEVERAGING ASSETS TO BUILD COMPETITIVE
ADVANTAGE -
University Circle
Cleveland, Ohio Cincinnati, Ohio Dayton, Ohio
Uptown Consortium Dayton Tech Town
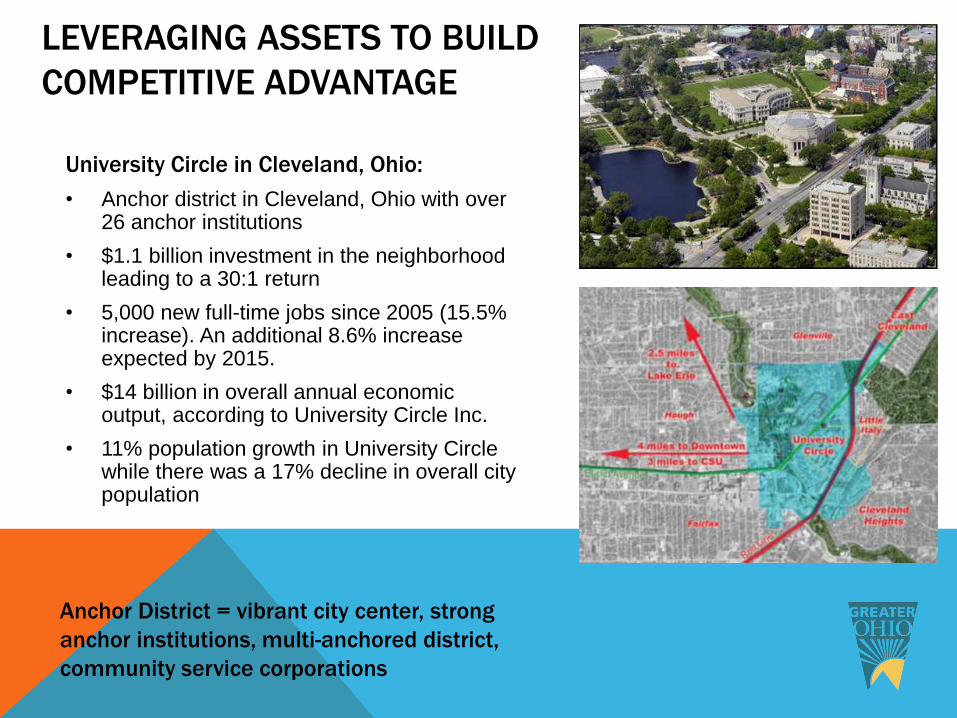
University Circle in Cleveland, Ohio:
• Anchor district in Cleveland, Ohio with over 26 anchor institutions
• $1.1 billion investment in the neighborhood leading to a 30:1 return
• 5,000 new full-time jobs since 2005 (15.5% increase). An additional 8.6% increase expected by 2015.
• $14 billion in overall annual economic output, according to University Circle Inc.
• 11% population growth in University Circle while there was a 17% decline in overall city population
Anchor District = vibrant city center, strong
anchor institutions, multi-anchored district,
community service corporations
LEVERAGING ASSETS TO BUILD
COMPETITIVE ADVANTAGE
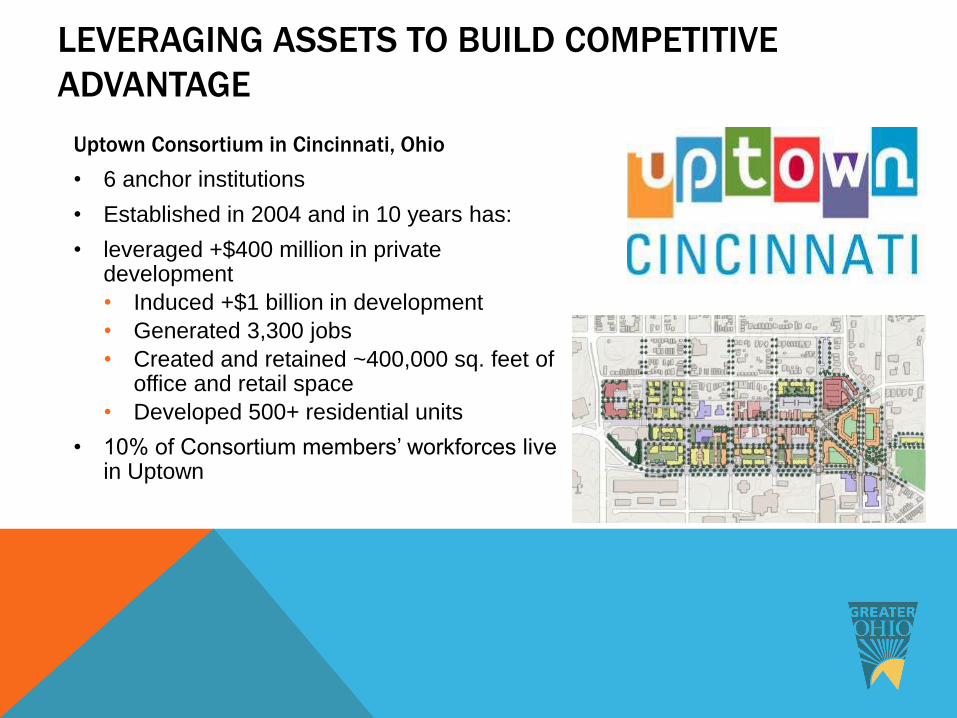
Uptown Consortium in Cincinnati, Ohio
• 6 anchor institutions
• Established in 2004 and in 10 years has:
• leveraged +$400 million in private development
• Induced +$1 billion in development
• Generated 3,300 jobs
• Created and retained ~400,000 sq. feet of office and retail space
• Developed 500+ residential units
• 10% of Consortium members’ workforces live in Uptown
LEVERAGING ASSETS TO BUILD COMPETITIVE
ADVANTAGE

CITIES ARE EXPLORING OTHER ECONOMIC
ENGINES
ENTERTAINMENT
AND TOURISM
TECHNOLOGY
What potential do these
sectors have to generate
job and business growth
in legacy cities?

Cleveland
Akron
Canton
Youngstown
Lorain
Northeast OHIO:
five legacy cities
embedded in a
single region of
over 5,000 mi2
ESTABLISHING REGIONAL INITIATIVES
Urban centers are embedded in larger regions – need for greater
regionalism

ESTABLISHING REGIONAL INITIATIVES
Central Ohio’s insight2050

WHY REGIONS MATTER FOR ECONOMIC
REGROWTH
• Cities and their regions are
economically interdependent
• Collaborations and new governance
structures can increase fiscal
efficiency and economic attraction.

TOO MUCH LOCAL GOVERNMENT ADDS TO
RESOURCE CONSTRAINTS86% of states have fewer governments per 100 square miles than Ohio
Source: Greater Ohio Policy Center, Census of Governments; Government Organization, 2007
0
2
4
6
8
10
12
14
16 14 12 11 10 8 6 5 4 3 2 1 <0
Nu
mb
er
of
Sta
tes
Number of Governments per 100 miles
Ohio
Less than Ohio (43)More than Ohio (6)

RISING LEGACY COSTS & DECLINING TAX BASE
Ohio’s aging infrastructure:
• It is estimated that Ohio will need over $25 billion to
maintain and upgrade aging water infrastructure over
the next 20 years.
• Federal consent decree to reduce the number of
sanitary sewer overflows
Tax base shrinking with population loss

3. BUILDING OPPORTUNITY
Challenges:
• Many residents are not benefiting from regeneration
• Neighborhoods in decline are disproportionately
affecting low income populations
• Remaining economic/racial disparities that bring down
the rest of the region

LEGACY CITIES HAVE AN INCOME/POVERTY GAP
0
10
20
30
40
50
60
70
80
Ca
mde
n
Cle
vela
nd
Detr
oit
Gary
San F
ran
cis
co
Seatt
le
Po
rtla
nd
Bosto
n
% below poverty level
% more than 2X poverty
% of population
below poverty level
compared to % of
population in
households earning
2X poverty level

LEGACY CITIES SHARE A JOBS/EDUCATION MISMATCH
0.00%
10.00%
20.00%
30.00%
40.00%
50.00%
60.00%C
levela
nd
Detr
oit
Ne
wa
rk
San F
ran
cis
co
Se
att
le
Port
lan
d
Jobs in city
Workers living in city
All adults 25+ in city
Share of jobs and
workers with BA/BS
or higher degree

RACIAL DISPARITIES IN INCOME ARE GROWING
0
20
40
60
80
100
120
Baltimore Buffalo Cincinnati Cleveland Pittsburgh St. Louis
White median
Black median 2000
Black median 2011
Median income
Of African-American
Households as a
Percentage of white
Non-Latino median

CONCENTRATIONS OF POVERTY IN URBAN AREAS
Example of equity challenge in Akron, Ohio
Source: Brookings Institute


EDUCATED YOUNG ADULTS PREFER CITIES
Share of city population that is 25-34 years old with a
bachelor’s degree or higher in 2000 and 2013.
1%
3%
5%
7%
9%
11%
13%
2000 2013

NATIONALLY, LEGACY CITY POP GROWTH IS LARGELY
DRIVEN BY THE MILLENNIAL GENERATION
0.00%
5.00%
10.00%
15.00%
20.00%
25.00%
30.00%
35.00%
40.00%
45.00%
Baltimore Philadelphia Pittsburgh St. Louis
City share of statepopulation
City share of 25-34year old collegegraduates
City share of 2000-2011 INCREASE in 25-34 year old collegegraduates

OHIO CITIES MUST DO MORE
TO ATTRACT & RETAIN YOUNG PROFESSIONALS
Number of 25-34 year olds with a bachelor’s degree or higher in 2000 and 2013.
1,192 1,512
3,970
7,228
10,153
12,535
9961,451
4,104
7,0907,719
13,774
0
2,000
4,000
6,000
8,000
10,000
12,000
14,000
Youngstown 0% Canton 0.1% Dayton 0.4% Akron 0.1% Toledo -0.8% Cleveland 0.9%
2000 YP population 2013 YP population
Change in share of population:
OPPORTUNITY TO LEVERAGE & ATTRACT THIS
POPULATION
• Some legacy cities are attracting increasing
numbers of Millennials
• Ohio’s cities will need to do more to attract this
population in order to compete
• What are the barriers? What still needs to be done?


STRATEGIES FOR THE FUTURE• Rebuild the central core
Making job and population growth in the core foster citywide regeneration
• Sustain viable neighborhoods Sustaining neighborhoods facing demographic and economic
challenges
• Repurpose vacant land for new uses Utilizing the city’s inventory of vacant land and buildings for
regeneration
• Use assets to build competitive advantage Creating sustainable economic growth based on assets

STRATEGIES FOR THE FUTURE
• Use economic growth to increase
community and resident well-being
Overcoming forces leading to increased economic and racial inequalities
• Build stronger local governance and
partnerships
Creating multifaceted public/private partnerships capable of driving sustained regeneration
• Increase the ties between cities and their
regions
Building effective regional linkages to foster stronger economic growth throughout a region

BUILDING AN URBAN STATE POLICY AGENDA IS PIVOTAL
Conceptually – align state policy and local action; leverage and incentivize private market investment
Leading examples:
• Brownfields Cleanup Fund (grants/loans)
• Land banks
• Expedited foreclosure
• Historic tax credits
• Neighborhood assistance program tax credits
• Assess ODOT funding priorities
• Promoting public-private partnerships for funding infrastructure


STRATEGIES
• Make change happen through strategic incrementalism
• taking incremental steps grounded in a coherent vision of
the future
• Consider a special paradigm for smaller/medium-sized
cities:
• Distinguish between those that are too big to fail and others