shimoni michal; borghysdirk & acheroy marc
TRANSCRIPT

BruHyp Workshop, 7 October 2005, B
ruges, B
elgium
Shimoni Michal; Borghys Dirk & Acheroy Marc
Schroder Reinhard; Martin Chiari & Helmut Suess

BruHyp Workshop, 7 October 2005, B
ruges, B
elgium
HySAR GOALThe main objective of this research is to resolve the classification ambiguity of several man-made objects in urban and industrial scenes using fused polarimetricSAR, InSAR and hyperspectral data.
Main assumptionWhile the polarimetric SAR measurements are sensitive to the surface geometry and the dielectric constant of the illuminated surface, hyperspectral data provide information related to the biochemical origin and environment of the observed area.
Target FeaturesResidences, industrial buildings, nuclear power plants, airports and roads in rural-urban and industrial scenes

BruHyp Workshop, 7 October 2005, B
ruges, B
elgium
CONTENTS
* Research area* E-SAR and E-SAR in HySAR* Comparison of characteristics between HyMap and E-SAR* Image processing methodologies:
Hyperspectral, PolSAR and Fusion
* Object detection based on logistic regression (LR)* Classification detection based on (LR)* Discrimination of roof materials
* Detection of dominant scatter point* Classification of man-made structure using the
Pauli decomposition* Combination of SAR and Hyperspectral resultsE
-SA
RH
yMA
P

BruHyp Workshop, 7 October 2005, B
ruges, B
elgium
* Gundrremingen power plant* Nuclear power plant structure classification using
HyMAP data* Textural filter – SAR / Xhh* Classification of power plant structure based on
Pauli decomposition* Pixel based fusion of multi channel SAR data
* Conclusion and future research

BruHyp Workshop, 7 October 2005, B
ruges, B
elgium
RESEARCH AREAS

BruHyp Workshop, 7 October 2005, B
ruges, B
elgium
E-SAROperatorDLR, on DO-228
Frequency RangeX (9,6 GHz) L (1,3 GHz)C (5,3 GHz) P (450 MHz)S (3,3 GHz)
PolarizationThe polarization of the radar signal is selectable: horizontal and verticalL-band operates in full polarisation (HH, VV, HV, VH)
Methods of MeasurementSAR-InterferometrySAR-Polarimetry
Range Resolution2,3 m (high resolution)4,5 m (medium resolution)Resolution (Azimuth)0,6 m (1 look), 2 m (3 looks)> 3 m (from 6 looks)
Swath Width on Ground3 km (narrow swath)5 km (wide swath)

BruHyp Workshop, 7 October 2005, B
ruges, B
elgium
E-SAR in HySARFrequency RangeX (9,6 GHz) L (1,3 GHz)
PolarizationL-band (HH, VV, HV, VH); X-band (HH)
Methods of MeasurementSAR-Interferometry (Single path)SAR-Polarimetry
Range ResolutionResolution (Azimuth)1,5 m (1 look), 4,0 m (4 looks)
Many technical problems- Localisation of corner reflectors;
- Single path interferometry produced bad interferogram (not yet operational);
- Some “ read out” problems;
- Flew all the 3 X scenes again in the end of August 2005.
L-Band SAR-image of Oberpfaffenhofen

BruHyp Workshop, 7 October 2005, B
ruges, B
elgium
COMPARISON OF CHARECTERISTICS BETWEEN HyMAP AND E-SAR SENSORS
Parameter Hyperspectral SAR
FrequenyWavelength
120 THz - 750 THz0,4 µm – 2,5 µm
1 GHz – 10GHz0,03 m - 0,3 m
angle of incidence vertical 27° - 65°
Daytime/Nighttime only usable during daytime Daytime and nighttime
Weather dependence not usable in bad weather nearly independent of weather
Identification of materials possible impossible
Detection of surface condition (roughness)
impossible possible

BruHyp Workshop, 7 October 2005, B
ruges, B
elgium
IMAGE PROCESSING METHODOLOGIESHyperspectralPre-processing (Radiomatrical, atmospheric, geometrical, polishing and gain & offset corrections);
Data and noise reduction – MNF / PCA / LR;
Object detection based on logistic regression;
Classification based on LR / using the Matched Filtering (MF) / Mixture Tuned Matched Filtering (MTMF) algorithms;
Post-classification – Majority/Minority analysis.
SARPre-processing (Speckle reduction using multi-looking and Gamma filtering);
Texture filtering (mean, homogeneity, dissimilarity, entropy, second moment & skewness);
Detection of dominant points;
Detection of man-made structure using Pauli-decomposition;
Classification – Maximum Likelihood

BruHyp Workshop, 7 October 2005, B
ruges, B
elgium
Pixel based fusion (low-level fusion) of SAR multi-polarisation;
Pixel based fusion (low-level fusion) of SAR multi-channels (X, L);
Decision based fusion (high level fusion) of hyperspectral and SAR classification.
Fusion

BruHyp Workshop, 7 October 2005, B
ruges, B
elgium
HYPERSPECTRAL - OBJECT DETECTION
Based on Logistic Regression (LR)
( )
++
+=
∑
∑
=
=N
iii
N
iii
yx
yxC
yxC
Cp
10
10
,
),(exp1
),(exp
TgtClass
ββ
ββr
Logistic RegressionFinds an optimal combination of channels for detecting a given class, based on the learning set:
Implicit channel selection by using step-wise optimisation method for finding βi s.

BruHyp Workshop, 7 October 2005, B
ruges, B
elgium
NChan24199
1628
Channel Selection by Logistic Regression

BruHyp Workshop, 7 October 2005, B
ruges, B
elgium
Results of the detector based on Logistic Regressio n
HyMAP image of Gilching, Germany (R – 14, G - 9, B – 5)
Buildings detection based on LR Roads detection base d on LR

BruHyp Workshop, 7 October 2005, B
ruges, B
elgium
Evaluation of channel selection and class detection

BruHyp Workshop, 7 October 2005, B
ruges, B
elgium
Classification based on Logistic Regression
Classification based on LR
Cadastral image
Buildings
Roads
Paths
Railways
Background

RailwaysPaths BuildingsRoads Forests
BruHyp Workshop, 7 October 2005, B
ruges, B
elgium
Correct Detection
Undetected
False Alarm
Detection Result Ground Truth One channel of image
Evaluation of LR classification per Class
BruHyp Workshop, 7 October 2005, B
ruges, B
elgium
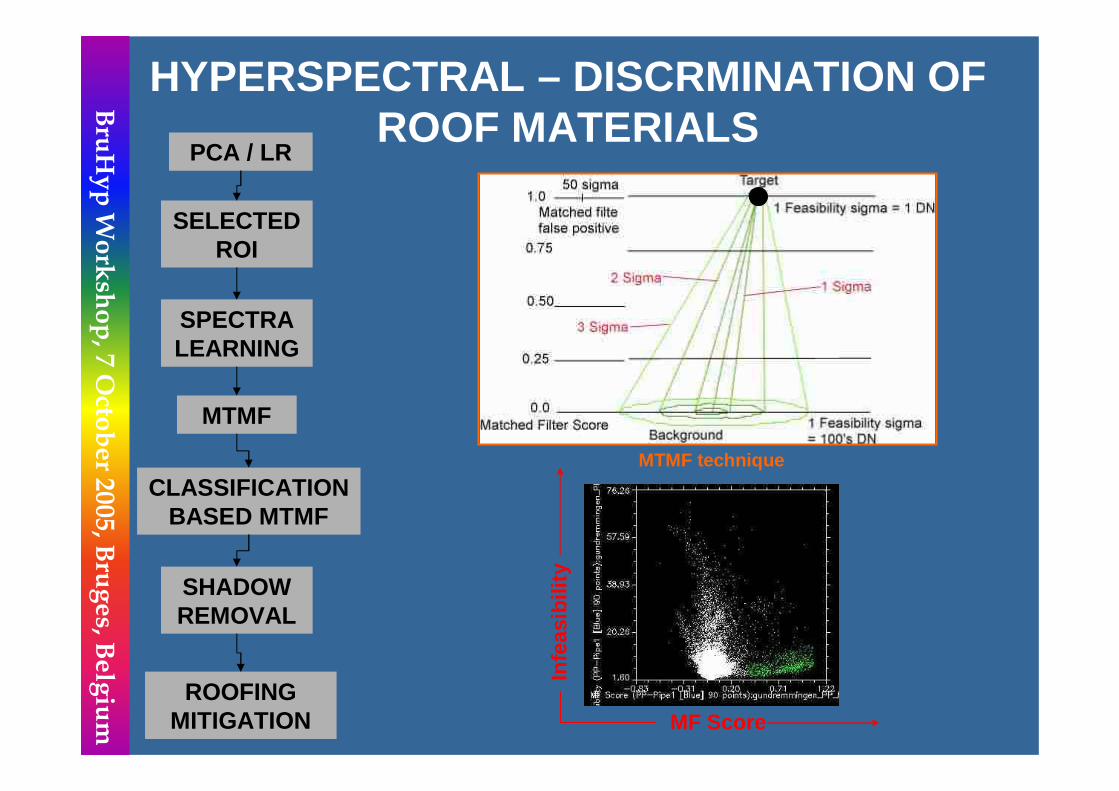
HYPERSPECTRAL – DISCRMINATION OF ROOF MATERIALS
PCA / LR
SELECTED ROI
SPECTRA LEARNING
MTMF
CLASSIFICATION BASED MTMF
SHADOW REMOVAL
ROOFING MITIGATION
MTMF technique
MF Score
Infe
asib
ility

BruHyp Workshop, 7 October 2005, B
ruges, B
elgium
HyMAP image of Gilching, Germany (R – 14, G - 9, B – 5)

BruHyp Workshop, 7 October 2005, B
ruges, B
elgium
MTMF classification of roofing materials (zoom-inn)
HyMAP image of Gilching, Germany (R – 14, G - 9, B – 5)

BruHyp Workshop, 7 October 2005, B
ruges, B
elgium
SAR - DETECTION OF DOMINANT SCATTER POINTS
Image Data Data Window 1,2,3,4,…,N
Comparison with
Threshold
Threshold Calculation
Point Target Map &
Further Processing
Pixel under Test
Method for the detection of dominant scatter points
E-SAR / X image of Oberpfaffenhofen

BruHyp Workshop, 7 October 2005, B
ruges, B
elgium
Detection of dominant scatter points - results
Point scatters on the E-SAR / X image of Oberpfaffe nhofen

BruHyp Workshop, 7 October 2005, B
ruges, B
elgium
SAR – CLASSIFICATION OF MAN MADE STRUCTURE
Polarisation
Conventional SAR operate with a fixed single-polarization antenna for transmission and reception of radio frequency signals.
In this way only a single scattering coefficient is measured for a specific combination of transmitted and received polarization, which is proportional to the received backscattered power at a particular combination of linear polarization (HH, HV, VH or VV).
For a SAR system that coherently transmits and receives both signals from an an orthogonally polarized antenna pair, the scattering process can be modelled as a linear transformation described by a matrix [S];
[ ]
=
vvhv
vhhh
SS
SSS (1)

BruHyp Workshop, 7 October 2005, B
ruges, B
elgium
Instead of the matrix notation, one may use a four element complex vector k
r
[ ] [ ] [ ]Tvvhv
vhhh kkkkSTracekSS
SSS 3210 ,,)(
2
1 =Ψ=→
=
r(2)
where Trace ([S]) is the sum of the diagonal element of [S] and Ψ is a complete set of 2 X 2 complex basis matrices.
The Pauli basis (formed by the pauli spin matrices)
(3){
−
−
=Ψ
0
02,
01
102,
10
012,
10
012
i
iρ
The corresponding vector is then
[ ])(,,,2
1hvvhvhhvvvhhvvhh SSiSSSSSSk −+−+=ρ
r(4)
ρkr

BruHyp Workshop, 7 October 2005, B
ruges, B
elgium
Pauli decomposition in SAR
horizontal vertical
h → h, 0º v → v, 0º h → h, 0º v → v, 180º h → v v → h
odd scattering even scattering crosspolariser(single bounce) (double bounce) (45º double bounce)
The Pauli decomposition is calculated from the original single look complex radar data and provides information about three independent scatter mechanisms in three channels:
R G B - HH, VV, (HV+VH)/2

BruHyp Workshop, 7 October 2005, B
ruges, B
elgium
Pauli decomposition channels R G B - HH, VV, (HV+VH)/2
Pauli decomposition of E-SAR / L-Band SAR image ( R: even scattering, G: crosspolariser, B: odd scattering)
Maximum likelihood classification of L-Band E-SAR data based on Pauli decomposition
Forest
Roads and runway
Buildings
Grassland

BruHyp Workshop, 7 October 2005, B
ruges, B
elgium
COMBINATION OF SAR AND HYPERSPECTRAL DATA
Decision (context) based fusion demands pixel accuracy.
Combination of SAR and Hyperspectral classification results superimposed on IKONOS high resolution image
Roads
Buildings
Pixel based fusion demands sub-pixel accuracy;

BruHyp Workshop, 7 October 2005, B
ruges, B
elgium
The first of three boiling-water nuclear reactors at Germany'sGundremmingen plantbegan operating in 1966 but was permanently shut down after being decommissioned in 1983.
Additional cooling systems were installed for the remaining two operational reactors at the plant in 1995.
GUNDRREMINGEN NUCLEAR POWER PLANT

BruHyp Workshop, 7 October 2005, B
ruges, B
elgium
POWER PLANT - HYPERSPECTRAL
HyMap RGB (B14, B9, B5) MNF component (C4, C3, C2)
Selected ROI on MNF (26)
SPECTRA LEARNING (18)

BruHyp Workshop, 7 October 2005, B
ruges, B
elgium
Matched Filtering (MF)
Cooling tower Plume
H2O concentration
Plume classification using MF
Water classification using MF

BruHyp Workshop, 7 October 2005, B
ruges, B
elgium
POWER PLANT Structures
Dome structure
Power plant structures classification using MF
Power plant structures diagram based on the classification results
Power plant structures, roads and fences classification using MF

BruHyp Workshop, 7 October 2005, B
ruges, B
elgium
POWER PLANT – SAR/XHH
Dissimilarity
Entropy
Mean
Homogeneity
Second moment
TEXTURE FILTERS
Power plant – ESAR x band
Power plant structure – Fusion of 5 different texture filters
Power plant – Synthetic colors
Plume

BruHyp Workshop, 7 October 2005, B
ruges, B
elgium
POWER PLANT – SAR/L full polarisation
Power plant – ESAR / L full polarisation
Pauli decomposition – R (HH) G (VV) B ((HV + VH)/2)
Texture Filter (skewnes)Texture filter (skewnes) results over the pauli decomposition

BruHyp Workshop, 7 October 2005, B
ruges, B
elgium
POWER PLANT – SARPixel based fusion - X and L bands + polarisations
SAR / L classification
SAR / X classification
Majority filtering
Buffer check X band
Classified structure
Pixel structure ??
YESNO
YES
Fusion results X (magenta) + L (purple) bands

BruHyp Workshop, 7 October 2005, B
ruges, B
elgium
Conclusion and future researchLogistic regression used for man made object detection, channel selection and classification
Is fast and accurate technique for robust classification of man made materials;Is a good technique for hyperspectral data reduction;An extensive ground truth data is no needed;The robust classification made using LR produced better results than MF.
Future researchPhysical explanation for selected channels;Influence of pre-processing level.
For hyperspectral data it is possible to rely on a pixel-wise classifier for extraction of residences, roads, industrial buildings and building materials.

BruHyp Workshop, 7 October 2005, B
ruges, B
elgium
For SAR images a pixel-wise classifier can be used for large buildings or for identifying built-up areas.However it is not possible to detect individual houses in an urban environment using SAR, mainly due to the imaging geometry.
“Point scatterers” detected in SAR images are strongly correlated with man-made structures signals.
A classifier based on polarimetric decomposition methods is useful for detection of large buildings and roads in SAR.However, a specific detector for linear feature is more effective for smaller roads and buildings.
Combining SAR multi-channel information produces better detection and classification of man-made structures than single channel data.

BruHyp Workshop, 7 October 2005, B
ruges, B
elgium
Generally, we have found that data fusion of SAR- andhyperspectral data give complementary information regarding the urban scene and are useful for road detection.However, data fusion of E-SAR and hyperspectral was not sufficient for building detection due to difference imaging geometry.
Refined methods have to be developed and applied for future improvements.