shift to digital strategy
TRANSCRIPT

Shift to Digital Strategy

Contents Shift to Digital Strategy
• Introduction
• The Digital Value Chain
• Edenred Digital Strategy
• Financial Impacts
• New Growth Opportunities
2

Why shifting to digital makes sense for all
stakeholders
3
Analysis of stakeholder needs led to the decision to accelerate
the shift to digital at end-2010
Edenred
B
C A
Clients: optimized and simplified processes, cost savings
Beneficiaries: convenient, fashionable solution
Affiliates: simplified administrative process, value-added services,
cost savings
Better control over fund allocation and
traceability
Clear correlation between card transactions
penetration and reduction in the informal
economy
Source: AT Kearney analysis
A win-win solution for all stakeholders
An efficient tool for public authorities

Why shifting to digital makes sense for Edenred
4
Rationale for the shift to digital
First mover / Competitive advantage
New growth opportunities
Financial impacts
Issue volume growth
New sources of revenue, which offset the reduction in lost products
Reduced operating costs, leading to an operating flow-through ratio* objective of above 50% post-transition
Shorter float holding period, offset by higher volumes
*Ratio between the like-for-like change in operating EBIT and like-for-like change in operating revenue
Market demand
A strategic priority for the Group

Contents Digital Strategy
• Introduction
• The Digital Value Chain
• Our Digital Strategy
• Financial Impacts
• New Growth Opportunities
5

How to Shift to Digital
6
2009
30%
2012
50%
>70%
2016
Program Launch
Phase
Program
Management Phase
A strategic move from paper to digital,
implying changes in the value chain
and interactions with new stakeholders
1
2
Two Main Phases
A country-by-country process

Digital vs. Paper Value Chain:
Program Launch Phase
7
Paper
Value Chain
Digital
Value Chain
Solution creation
Set up of processing capabilities
Affiliation network manager
Set up of POS devices
1
2
3
4
1
2
3
Set up of capabilities and network for the launch of a program (paper or digital),
implying non-recurring costs
An additional capability in the digital value chain: the set up of POS devices
Phase 1: Program Launch
Program Launch
Phase
1
Set up of interfaces between POS
and processors 5

Set Up of POS Devices
8
Owned POS
Conditions for setting up our own POS:
Need for strategic control
Specific technical features of the solution
Lack of equipment at the merchant POS
Edenred examples:
Turkey for meal vouchers: electronic payment
terminals or mobile phones
Italy for meal vouchers
Brazil and Mexico for Ticket Car
Use of existing POS
Conditions for the use of existing POS:
No need for strategic control
Existing infrastructure corresponds to
technical solution requirements
Sufficient merchant coverage
Edenred examples:
Brazil for meal and food vouchers
France for Ticket Clean Way
Belgium for meal vouchers
POS devices: two options
Program Launch
Phase
1

Digital vs. Paper Value Chain:
Program Management Phase
9
Paper
Value Chain
Digital
Value Chain
Acquirer (technical or banking)
Issuer
3
1
Settlement manager 6
Processor / Authorization 5
Switch (international or domestic) 4
Payment scheme (Visa,
MasterCard, CB in France,
Carnet in Mexico...)
Banking or Private
settlement
1
4 Private settlement
Production
Redecard and Cielo (Brazil),
ATOS (Belgium)…
PPS, FIS, TSYS…
The digital value chain is less integrated than the paper value chain
Edenred is the program manager for the full value chain (paper or digital)
Phase 2: Program Management
Program Distributor 2 2
3
Program
Management Phase
2

New Stakeholders
in the Digital Value Chain
10
Acquirer (technical or banking)
Processor /
Authorization
Switch (international or domestic
payment schemes)
Technical acquirer:
Allows collection of financial and
non-financial data from a
transaction at POS
Transfers the data directly to
authorization platforms
Banking acquirer:
Allows collection of financial data
from a transaction at POS
Transfers the data to switching
platforms
Intermediary between issuer and acquirer, which: Defines the rules of a
transaction
Executes transaction switch
Technical entity which: Ensures the technical
processing of a transaction
Provides IT data to issuers and acquirers
Program
Management Phase
2
Provider can be the same entity, but
the type of service offered is different

Coexistence of Two Models
within the Digital Value Chain
11
Private Model
Acquirer
Settlement management
Authorization
Switch
Banking Model
Issuer
Program Manager control point
Intermediary control point
Technical acquirers Banking acquirers (through MID or MCC*)
Domestic or international payment schemes
Settlement rules defined by the scheme (usually 24h.)
Private model: full control but higher implementation costs
Banking model: lower control but lower costs and quicker implementation
* Data acquiring is controlled by the program manager through MID (Merchant Identification Code) but not through MCC (Merchant Code Category) MID is a code attributed to a single merchant by a payment scheme, whereas MCC is a code attributed to a category of merchants (ex: restaurants)
Program
Management Phase
2
Private software set up in the POS, alongside banking software
Use of the standard banking software (already part of the POS)
Private settlement negotiated between issuers and merchants

Focus on the Private Model
12
Program
Management Phase
2
Private Model
Merchant fee is collected directly from merchants
Merchant /
POS terminal
Merchant transactions acquisition
4
Merchant
acquirer Processor
Software
End-user /
Cardholder
Issuer
Card issuance
Client
1
Loading 2
Processor
6
Merchant reimbursement
(settlement)
5
Processing and authorization of the
transaction
3 Cardholder payment
Technical Acquirer
Same circuit as the banking model
Different circuit compared with the banking model
Technical acquirers
Private settlement negotiated
betwwen issuers and acquirers
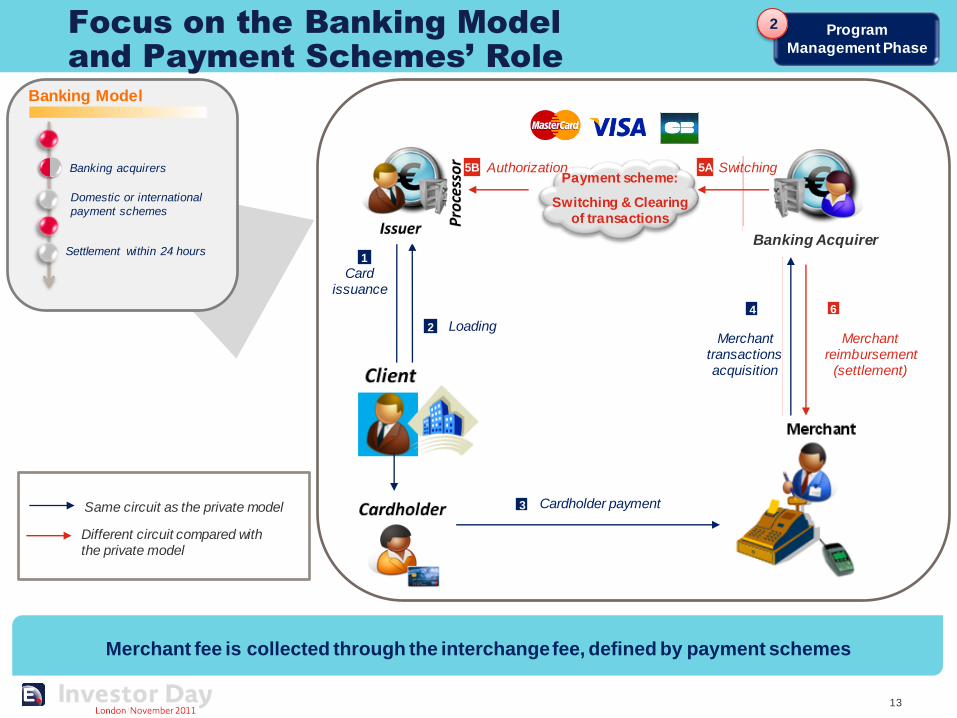
Focus on the Banking Model
and Payment Schemes’ Role
13
Banking Model
Merchant /
POS terminal
Merchant transactions acquisition
4
Merchant
acquirer Processor
Software
End-user /
Cardholder
Issuer
Card issuance
Client
1
Loading 2
Processor
Payment scheme:
Switching & Clearing of transactions
6
Merchant reimbursement
(settlement)
Merchant fee is collected through the interchange fee, defined by payment schemes
Program
Management Phase
2
5A
3 Cardholder payment
Banking Acquirer
Same circuit as the private model
Different circuit compared with the private model
Banking acquirers
Domestic or international
payment schemes
Settlement within 24 hours
Switching 5B Authorization

Focus on the Mobile Value Chain
14
Program
Management Phase
2
Mobile Phone Devices
Mobile value chain is the same as card value chain
Specific features of the mobile value chain:
Different technology (mobile vs. card)
Mobile operators play the role of acquirers
Different options for mobile technology use: “Mobile to POS” transaction (beneficiary has to be equipped with an NFC mobile and merchant with an NFC POS
or mobile)
“NFC card to mobile” transaction (beneficiary has to be equipped with an NFC card and merchant with an NFC
POS or mobile)
Mobile is an alternative technology, but the digital value chain remains the same

Contents Shift to Digital Strategy
• Introduction
• The Digital Value Chain
• Edenred Digital Strategy
• Financial Impacts
• New Growth Opportunities
15

New
revenue sources
Reduced
operating costs
Overall Digital Strategy
16
Volume growth
Acceleration of the shift to digital since the demerger:
objective of 41% digital issue volume at year-end 2011,
50% at year-end 2012 and more than 70% post-2016
Long-term positive effects for Edenred
Acceleration of the shift to digital
Digital issue volume
2009
30%
2012
50%
>70%
41% 34%
2010
2011E
2016

Choice of Digital Model
17
Private Model
Choice criteria:
High volume program
Filtered-loop network
Edenred examples:
Meal and Food cards in Brazil
Meal cards in Belgium
Meal cards in Turkey
Banking Model
Choice criteria:
Low volume program
Open-loop network (with filter option)
Edenred examples:
Expendia Smart in Italy
Solred card in Spain
Two options depending on local conditions
and program characteristics

Choice of Technology
18
Edenred is technology agnostic
A wide range of technologies in the digital universe
Technology selection criteria:
Client demand
Local environment (percentage of merchants and beneficiaries equipped with the technology)
Edenred operates with all types of
technologies
Ex: currently 3 countries with mobile pilots

Digital Transition Map
19
Latin America
59% digital IV
Europe
6% digital IV
Rest of the World
59% digital IV
Latin America and Rest of the World in final stage of digital roll-out
Start of digital roll-out in almost all European countries
Group’s target: 50% of digital issue volume by year-end 2012
(end-2009)
(end-2011E)
71%
10%
62%
Contents Shift to Digital Strategy
• Introduction
• The Digital Value Chain
• Edenred Digital Strategy
• Financial Impacts
• New Growth Opportunities
20

Short and long-term financial impacts of the
digital transition
21
Short-term Long-term
1. Stable take-up rate(2)
2. 5% to 10% cost reduction
3. Shorter float holding periods
offset by higher volumes
1. No major investment linked to the
shift to digital solutions (authorization and settlement platforms already deployed)
2. Extra costs during the speed up
phase (2011/2012): €10m to €15m
per year
1
2
3
1
2
Operating flow-through ratio(1) around 30%
in 2011/2012, reflecting continued increase in operating margin despite
extra costs during migration to digital
Objective of operating flow-through ratio(1)
above 50% post 2012
(1) Ratio between the like-for-like change in operating EBIT and like-for-like change in operating revenue (2) Take-up rate: ratio of operating revenue to issue volume

Extra costs during the speed-up phase (1/2)
22
Speed-up phase (2011/2012)
Project launch costs (non-recurring)
Market survey
Digital ecosystem study
Analysis of the regulations
Functionalities definition
Start-up costs (non-recurring)
Creation of acquiring and processing solutions
Middle-office adaptation or creation
Installation of applications on POS
Affiliation of merchants, and training in the use
of the applications (specific sales force)
Ongoing paper
solution costs
Issuance and
reimbursement costs
Logistics costs
New recurring costs
(digital)
Cost of beneficiary
support hotlines
Data acquiring and
processing
2

Extra costs during the speed-up phase (2/2)
23
2010 2011 2012
€4m €4m
€10-15m
€14-19m
€4m
€10-15m
€10-15m
€24-34m
Digital
extra-costs
One-off extra costs during the digital speed-up phase (2011/2012):
€10-15m per year
2013-2016
2

New sources of revenue to be developed
Couponing and loyalty services for affiliates and/or beneficiaries
Consumption statistics to drive more and better targeted beneficiaries to affiliates
Leverage our network relationships and the
knowledge of end-users’ habits
Creation of new sources of revenue
Card issuance fee
Card reissuance fee
Merchant affiliation fee
Merchant annuity
Bank transfer fee
Quick reimbursement fee
Stable Operating Revenue / Issue Volume ratio
24
Post digital transition, stable take-up rate rate (1)
Brazilian Experience Invent 2016
Reduction in Lost & Expired products
No significant change in expired products
Reduction in lost products
CL
IEN
T
ME
RC
HA
NT
Edenred
B
C A
1
(1) Take-up rate: ratio of operating revenue to issue volume

100/0 70/30 50/50 30/70 0/100
Affiliation/Training (card launch)
Call centers
IT costs
Production and logistics
Sales
Support functions (marketing, finance…)
Post-transition Cost Reduction
25
100 109
100 95
92
(Split between paper and digital Issue Volume)
Type of costs
40%-50% ~30% ~50% >50% >50% Operating Flow-trough ratio
5% to 10% cost reduction post digital transition,
depending on volume generated by the solution
60% reduction
New recurring costs (+10%)
Cost trend at constant volume - Illustration (Base 100)
35
35
30
2

Float Holding Period Reduction
26
User
Retention
1 3
Client
Retention
User
Retention Merchant
Retention
1 2 3 4 5
Order
Delivery
Edenred
Retention
Float holding period (100% paper) ~ 8.5 weeks
Float holding period (100% digital) ~ 7 weeks
Order
Load
Holding period reduction at two stages of the cycle:
client delivery stage and merchant retention stage
Edenred
Retention
3 5
Paper Cycle
Card Cycle
3

Contents Shift to Digital Strategy
• Introduction
• The Digital Value Chain
• Edenred Digital Strategy
• Financial Impacts
• New Growth Opportunities
27

Digital Transition: Opening New Horizons
28
A well-known, but
restricted territory
New markets New Customers
New needs
New solutions New competition
Web2.0 community…
Large territories offering
opportunities for innovation
and differentiation
Since the 1960’s 2012 Invent 2016
From Paper… Digital Transition… To Electronic

Digital will help Edenred to Invent 2016
29
Leverage relationships with all our stakeholders to invent new growth markets
Sustainably accelerating growth
Edenred
Beneficiaries
Clients Affiliates
Public Social Programs
Employee Benefits
Expense management
Incentives & Rewards
Promotion
Loyalty
New growth areas
Invent 2016
More value-added, customized solutions Value-added services
to make merchants more attractive!
Customized offer based on behavior
Savings Discount Customized
Offer