shell uk title pge department of earth science and ... · department of earth science and...
TRANSCRIPT

SHELL UK
TITLE PGE
Department of Earth Science and Engineering
Centre of Petroleum Studies
“Fault Seal Breakdown Analysis in HP/HT Field – A Study of Egret Field in the North Sea”
By
Percy Paul Obeahon
A project carried out in Shell UK for the completion of M.Sc. in Petroleum Engineering at Imperial
College
September 2012

ii Fault Seal Breakdown Analysis in HP/HT Field
DECLARATION OF OWN WORK
I declare that this thesis:
“Fault Seal Breakdown Analysis in HP/HT Field – A Study of Egret Field in the North Sea”
Is entirely my own work and that where any material could be construed as the work of others, it is fully cited and referenced,
and/or with appropriate acknowledgement given.
Signature: …………………………………….………………………...
Name of student: PERCY PAUL OBEAHON
Name of supervisors: MR. GERMEN YPMA (Shell U.K)
PROFESSOR ALAIN GRINGARTEN (Imperial College)

Fault Seal Breakdown Analysis in HP/HT Field iii
“Do not believe everything you read.”
Alain Gringarten

iv Fault Seal Breakdown Analysis in HP/HT Field
ACKNOWLEDGEMENTS
I would like to thank my Parents and Church family, the Centre for Global Evangelism for all the love and tremendously
invaluable support they have shown me all my life. I would not be who I am today without that support.
This project would not have been completed without the help of my supervisors Prof. Alain Gringarten (Imperial College) and
Germen Ypma (Shell). Special thanks to Jorrit Glastra, Kachi Onyeagoro, Mark Wood, Shankar Rao, Poornesh Govinda and
Terence wells at Shell U.K. for providing guidance at crucial points of the project. Thank you all for sharing your knowledge
with me. Special thanks also go to Anco Maan (Chief Reservoir Engineer – Shell Europe) and Osayande Igiehon (Chief
Reservoir Engineer – Shell Sub-Saharan Africa) for giving me the opportunity to do my project with the company and for the
study leave granted.
I thank my numerous friends and colleagues. Thank you for your unflinching support. Your indirect contribution to this work
is deeply appreciated.

Fault Seal Breakdown Analysis in HP/HT Field v
Table of Contents TITLE PAGE .................................................................................................................................................................................. i
DECLARATION OF OWN WORK ............................................................................................................................................. ii
ACKNOWLEDGEMENTS .......................................................................................................................................................... iv
LIST OF TABLES ....................................................................................................................................................................... vii
LIST OF FIGS ............................................................................................................................................................................ viii
MAIN REPORT – Fault Seal Breakdown Analysis in HP/HT Field .........................................................................................1
Abstract .....................................................................................................................................................................................1
Introduction ...............................................................................................................................................................................1
Field History .............................................................................................................................................................................2
Problem Statement/Justification.. ..............................................................................................................................................2
Objectives of the Project.. .........................................................................................................................................................2
Literature Review ......................................................................................................................................................................3
Approach ...................................................................................................................................................................................4
Pressure Transient Analysis (Apprasial well) ...........................................................................................................................4
Discussion of Result.. ................................................................................................................................................................5
Production Analysis (Producer well) ........................................................................................................................................6
Discussion of Result.. ................................................................................................................................................................7
Scenario 1.. ................................................................................................................................................................................8
Scenario 2... ...............................................................................................................................................................................8
Deconvolution (Producer well) .................................................................................................................................................9
Dynamic Reservoir Simulation ............................................................................................................................................... 10
Modelling Strategy.. ................................................................................................................................................................ 10
Reservoir Model Construction.. .............................................................................................................................................. 11
History Matching Results.. ...................................................................................................................................................... 11
Results and Discussion ............................................................................................................................................................ 14
Conclusion .............................................................................................................................................................................. 15
Recommendation.. .................................................................................................................................................................. 15
Acknowledgments ................................................................................................................................................................... 15
Nomenclature .......................................................................................................................................................................... 15
References ............................................................................................................................................................................... 16
APPENDIX A ............................................................................................................................................................................... 17
A.1: Milestone in Fault Seal Breakdown Analysis andCritical Literature Review.. ............................................................... 17
A.2: Summary of Papers Reviewed. ....................................................................................................................................... 19

vi Fault Seal Breakdown Analysis in HP/HT Field
A.3: Summary of Advances in Fault Seal Breakdown Analysis . ........................................................................................... 28
A.4: Program/Simulation Workflow . ..................................................................................................................................... 28
APPENDIX B ............................................................................................................................................................................... 29
B.1: Futher details on PTA and Interpretation Result (Apprasial well).. ................................................................................ 29
APPENDIX C ............................................................................................................................................................................... 32
C.1: Further details on PA and Interpretation Result (Producer well).. .................................................................................. 32
C.2: Further details on Deconvolution Result (Producer well).. ............................................................................................. 34
APPENDIX D ............................................................................................................................................................................... 35
D.1: Further details on Dynamic Reservoir Simulation.. ........................................................................................................ 35
APPENDIX E ............................................................................................................................................................................... 37
E.1: Summary of Fault Seal Breakdown Analysis investigated using Mbal (Analytic Approach).. ....................................... 37

Fault Seal Breakdown Analysis in HP/HT Field vii
LIST OF TABLES
MAIN REPORT – Fault Seal Breakdown Analysis in HP/HT Field ..................................................................................1
Table 1: Input Parameters used in PTA ....................................................................................................................................5
APPENDIX A
Table A.1: Milestone in Fault Seal Breakdown study ............................................................................................................. 17
APPENDIX B
Table B.1: PTA results comparison ........................................................................................................................................ 30
APPENDIX D
Table D.1: STOIIP estimate comparison for different Compartment ..................................................................................... 35

viii Fault Seal Breakdown Analysis in HP/HT Field
LIST OF FIGS
Fig 1: Top structure map for Skagerrak reservoir showing reservoir compartment ..................................................................2
Fig 2: Field X-section ...............................................................................................................................................................2
Fig 3: Variation in Fault throw, thickness and clay content ......................................................................................................3
Fig 4: Field pressure profile for 8 years of production ..............................................................................................................3
Fig 5: QA/QC on pressure gauges.............................................................................................................................................5
Fig 6: Analytic model on pressure and pressure derivative response for FP2 ...........................................................................5
Fig 7: Analytic model on deconvolved pressure and pressure derivative response for FP1 and FP2 .......................................5
Fig 8: Numerical model on pressure and pressure derivative response for FP2........................................................................6
Fig 9: Numerical simulation using saphir .................................................................................................................................6
Fig 10: Upper Skagerrak Facies distribution map .....................................................................................................................6
Fig 11: Boundaries captured in geological model .....................................................................................................................6
Fig 12: STOIIP estimate using normalized rate cummlative plot for pressure decline period ..................................................7
Fig 13: Fetkovich plot for pressure decline period ....................................................................................................................7
Fig 14: 4D seismic showing depletion area...............................................................................................................................8
Fig 15: Skagerrak U3 formation showing boundaries ...............................................................................................................8
Fig 16: Scenerio 1 – Fault Seal analysis geometry using topaze ...............................................................................................9
Fig 17: Scenerio 2 – Fault Seal analysis geometry using topaze ...............................................................................................9
Fig 18: Scenerio 1 & 2 – History match on historical production and pressure using topaze ...................................................9
Fig 19: Deconvolved derivative for producer well using TLSD ............................................................................................. 10
Fig 20: Schematic showing host rock, Kf and distances used in computing seal factors ......................................................... 11
Fig 21: Apprasial well KH variation with depth ...................................................................................................................... 11
Fig 22: Stage 1 – Pressure distribution profile after 3 years of production ............................................................................. 12
Fig 23: Stage 1- History match result when well depletes compartment A ............................................................................ 12
Fig 24: Wells and perforation intervals ................................................................................................................................... 12
Fig 25: Fault Pc against KF ..................................................................................................................................................... 12
Fig 26: History match result without the influence of B5 ....................................................................................................... 13
Fig 27: Saturation distribution before waterthrough ............................................................................................................... 13
Fig 28: Saturation distribution after waterthrough .................................................................................................................. 13
Fig 29: Stage 2 – Pressure distribution profile in 2008 ........................................................................................................... 13
Fig 30: History match result .................................................................................................................................................... 14
Fig 31: Initial pressure distribution across fault ...................................................................................................................... 14
Fig 32: Pressure distribution across fault in 2005 ................................................................................................................... 14
Fig 33: Pressure distribution across fault in 2008 ................................................................................................................... 14
APPENDIXB
Fig B.1: Semi-Log plot for FP2 .............................................................................................................................................. 29
Fig B.2: Semi-Log plot for FP1 and FP2 ................................................................................................................................ 29
Fig B.3: History plot for numerical simulation ....................................................................................................................... 29
Fig B.4: History plot for deconvolution .................................................................................................................................. 29
Fig B.5: Full skagerrak U3 top structural map ........................................................................................................................ 31
APPENDIX C
Fig C.1: Historical cummulative production allocated to Egret field ...................................................................................... 32
Fault Seal Breakdown Analysis in HP/HT Field ix
Fig C.2: Scenerio 3 – Fault Seal Analysis geometry using topaze .......................................................................................... 33
Fig C.3: Scenerio 3 – History match on historical production and pressure using topaze ...................................................... 33
Fig C.4: Early-late time match on deconvolved pressure and pressure derivative response using Saphir .............................. 34
Fig C.5: Late- late time match on deconvolved pressure and pressure derivative response using Saphir ............................... 34
Fig C.6: Fault breakdown analytical solution geometries as modelled using Saphir .............................................................. 34
APPENDIX D
Fig D.1: Relative permeability curve for different porosity class generated from analog (Skua Field) .................................. 35
Fig D.2: Capillary pressure curve for different porosity class generated from analog (Skua Field) ....................................... 36
Fig D.3: Match on Historical Rate (Model Constraint) ........................................................................................................... 36
APPENDIX E
Fig E.1: Modeling reservoir compartment using MBal ........................................................................................................... 37
Fig E.2: Schematic showing fault leakage scenerio ................................................................................................................ 37
Fig E.3: Phase 1- Rapid decline in reservoir pressure ............................................................................................................. 38
Fig E.4: Phase 2- Reservoir pressue stabilization above bubble point .................................................................................... 38
Fig E.5: History match result using MBal ............................................................................................................................... 39


Fault Seal Breakdown Analysis in HP/HT Field – A study of Egret Field in
the North Sea Percy Paul Obeahon
Imperial College London Supervisors: Prof. Alain Gringarten
Industry Supervisor: Germen Ypma (Shell U.K)
Abstract
This work presents the results of a study conducted on a high pressure/ high temperature (HP/HT) heavily faulted reservoir in
the North Sea. The reservoir pressure declined by half the initial pressure for the first seven months of production then
experienced pressure stabilization for the next eight years with pressure above bubble point pressure, thus suggesting recharge
from another compartment. In recent times, fault seal breakdown are seen to have significant impact on recovery. The ability to
predict these impacts of faults on well productivity is critical to optimal well placement, reservoir management and field
development decisions, particularly for high pressure high temperature deep water developments.
Though history matches are invariably non-unique, there is a danger that fault transmissibility multipliers are used to
compensate for other problems associated with reservoir models. This work fills the knowledge gaps in dynamic fault seal
modeling by presenting a new concept on how to characterize sealing nature of reservoir boundaries and achieve history
matches in reservoirs where seal factors changes dynamically. This was achieved using pressure transient analysis, production
analysis and deconvolution method. The report demonstrates that using well test interpretation results and a systematic
approach to fault seal breakdown, history matched-dynamic model that will explain fault seal breakdown can be constructed.
This project also reviews the evolution of fault seal breakdown analysis over the last century and shows improvements over the
past decades.
Well test interpretation models can be reconciled with geological models. Result obtained from well test interpretation was
incorporated and validated using dynamic model to improve history match results. Fault seal breakdown investigated using
pressure transient analysis, production analysis, deconvolution and history matching identified the same fault as the leaky
boundary. In particular, history matched model that incorporated all the analyses carried out revealed that in addition to
absolute fault seal, when capillary threshold pressure of approximately 1000psi is exceeded, fault seal breaks down.
Introduction
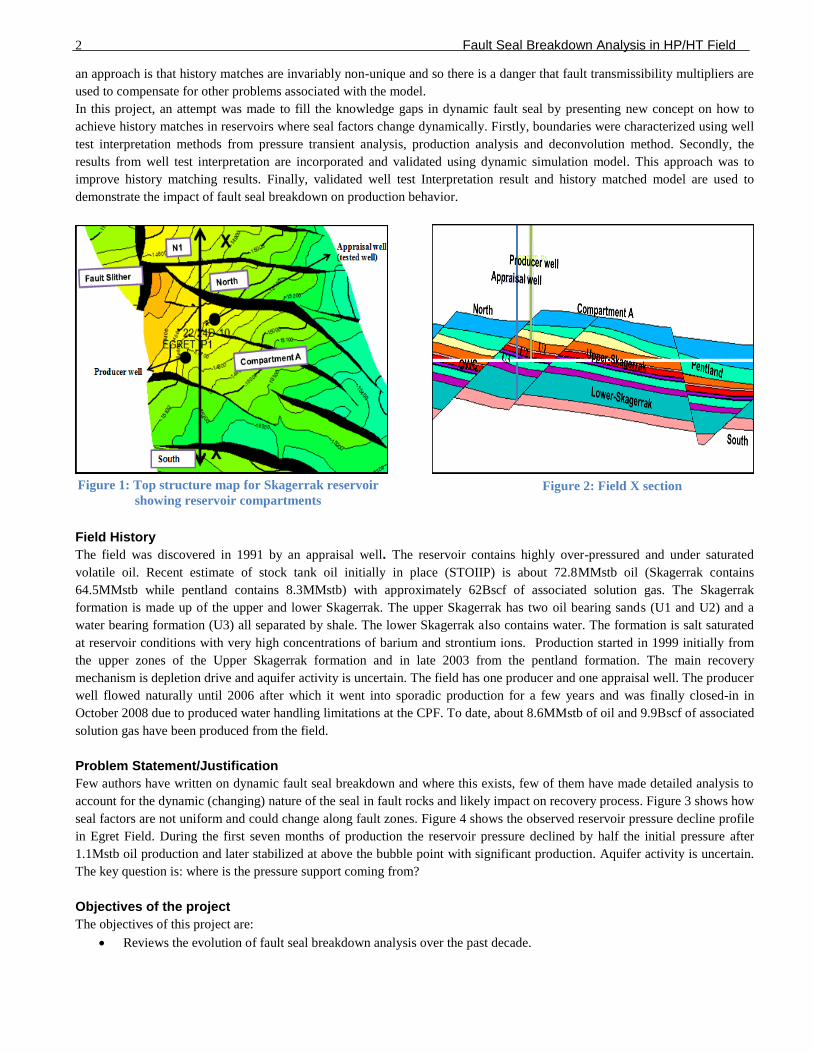
This work evaluates fault seal breakdown in Triassic Skagerrak formation of the Egret field. This field is part of the HP/HT
Central Graben area of the central North Sea. Egret structure is defined as a faulted footwall structure with dip closure to the
east (Figure 1). The Triassic Skagerrak Formation forms the main reservoir and overlying Jurassic Pentland a secondary unit
(Figure 2). Both formations are truncated over the crest of the structure by the Base cretaceous unconformity. The Upper
Skagerrak comprises fluvial channel and sheet flood sandstones, inter-bedded with calcretic soils and lacustrine shale. Recent
4D seismic mapped at least 5 separate compartments separated by fault.
It is well known that faults can severely compartmentalize reservoirs resulting in reduced hydrocarbon recovery when they act
as flow barriers or improve hydrocarbon recovery when they breakdown during production. In recent times the understanding
of how faults may affect fluid flow within reservoirs and how to account for the presence of their seal capacity in dynamic
simulation model has been improved by activities of many researchers. Historically this has been attempted by altering the
fault transmissibility multipliers on the grid blocks adjacent to faults in a particular manner until a history match of the actual
production data is obtained (Knai and Knipe, 1998). A problem with this approach is that it assigns a uniform seal factor over
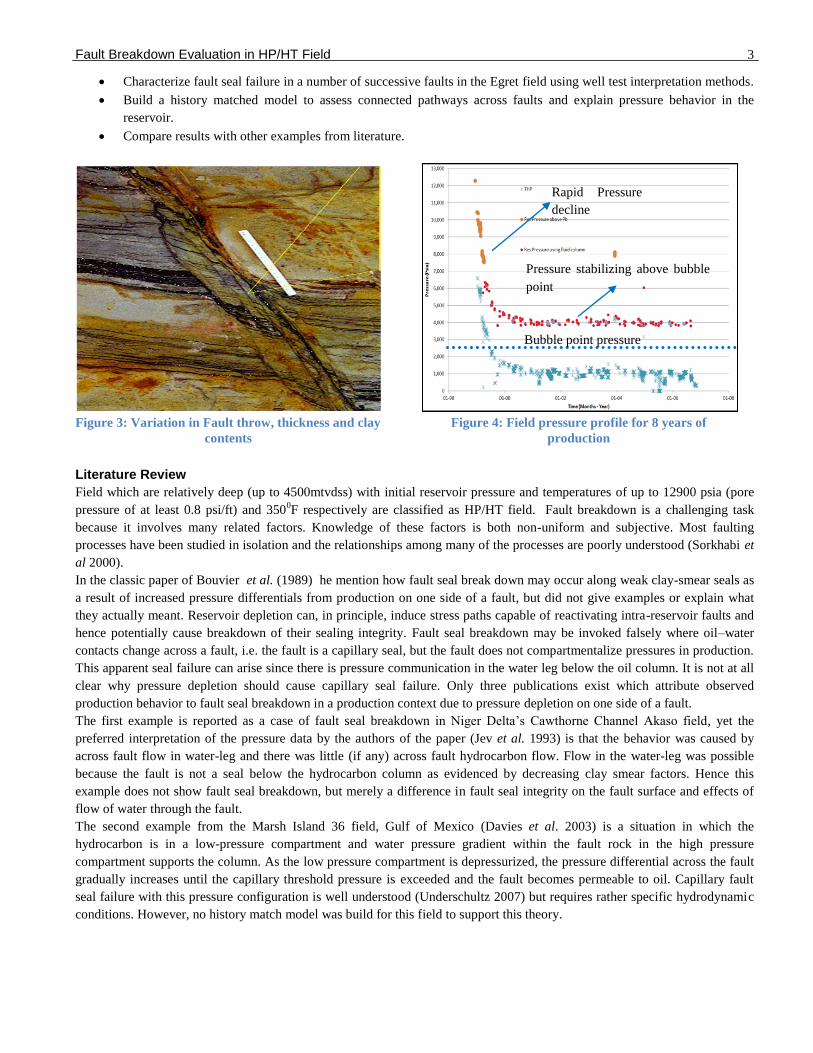
the fault plane and ignores the fact that the seal factor naturally varies over the fault plane due to variations in fault throw
(Figure 3), fault rock permeability (KF), thickness, shale content and host rock permeability (KH). Another problem with such
2 Fault Seal Breakdown Analysis in HP/HT Field
an approach is that history matches are invariably non-unique and so there is a danger that fault transmissibility multipliers are
used to compensate for other problems associated with the model.
In this project, an attempt was made to fill the knowledge gaps in dynamic fault seal by presenting new concept on how to
achieve history matches in reservoirs where seal factors change dynamically. Firstly, boundaries were characterized using well
test interpretation methods from pressure transient analysis, production analysis and deconvolution method. Secondly, the
results from well test interpretation are incorporated and validated using dynamic simulation model. This approach was to
improve history matching results. Finally, validated well test Interpretation result and history matched model are used to
demonstrate the impact of fault seal breakdown on production behavior.
Field History
The field was discovered in 1991 by an appraisal well. The reservoir contains highly over-pressured and under saturated
volatile oil. Recent estimate of stock tank oil initially in place (STOIIP) is about 72.8MMstb oil (Skagerrak contains
64.5MMstb while pentland contains 8.3MMstb) with approximately 62Bscf of associated solution gas. The Skagerrak
formation is made up of the upper and lower Skagerrak. The upper Skagerrak has two oil bearing sands (U1 and U2) and a
water bearing formation (U3) all separated by shale. The lower Skagerrak also contains water. The formation is salt saturated
at reservoir conditions with very high concentrations of barium and strontium ions. Production started in 1999 initially from
the upper zones of the Upper Skagerrak formation and in late 2003 from the pentland formation. The main recovery
mechanism is depletion drive and aquifer activity is uncertain. The field has one producer and one appraisal well. The producer
well flowed naturally until 2006 after which it went into sporadic production for a few years and was finally closed-in in
October 2008 due to produced water handling limitations at the CPF. To date, about 8.6MMstb of oil and 9.9Bscf of associated
solution gas have been produced from the field.
Problem Statement/Justification
Few authors have written on dynamic fault seal breakdown and where this exists, few of them have made detailed analysis to
account for the dynamic (changing) nature of the seal in fault rocks and likely impact on recovery process. Figure 3 shows how
seal factors are not uniform and could change along fault zones. Figure 4 shows the observed reservoir pressure decline profile
in Egret Field. During the first seven months of production the reservoir pressure declined by half the initial pressure after
1.1Mstb oil production and later stabilized at above the bubble point with significant production. Aquifer activity is uncertain.
The key question is: where is the pressure support coming from?
Objectives of the project
The objectives of this project are:
Reviews the evolution of fault seal breakdown analysis over the past decade.
Figure 1: Top structure map for Skagerrak reservoir
showing reservoir compartments Figure 2: Field X section
Fault Breakdown Evaluation in HP/HT Field 3
Characterize fault seal failure in a number of successive faults in the Egret field using well test interpretation methods.
Build a history matched model to assess connected pathways across faults and explain pressure behavior in the
reservoir.
Compare results with other examples from literature.
Objectives
Literature Review
Field which are relatively deep (up to 4500mtvdss) with initial reservoir pressure and temperatures of up to 12900 psia (pore
pressure of at least 0.8 psi/ft) and 3500F respectively are classified as HP/HT field. Fault breakdown is a challenging task
because it involves many related factors. Knowledge of these factors is both non-uniform and subjective. Most faulting
processes have been studied in isolation and the relationships among many of the processes are poorly understood (Sorkhabi et
al 2000).
In the classic paper of Bouvier et al. (1989) he mention how fault seal break down may occur along weak clay-smear seals as
a result of increased pressure differentials from production on one side of a fault, but did not give examples or explain what
they actually meant. Reservoir depletion can, in principle, induce stress paths capable of reactivating intra-reservoir faults and
hence potentially cause breakdown of their sealing integrity. Fault seal breakdown may be invoked falsely where oil–water
contacts change across a fault, i.e. the fault is a capillary seal, but the fault does not compartmentalize pressures in production.
This apparent seal failure can arise since there is pressure communication in the water leg below the oil column. It is not at all
clear why pressure depletion should cause capillary seal failure. Only three publications exist which attribute observed
production behavior to fault seal breakdown in a production context due to pressure depletion on one side of a fault.
The first example is reported as a case of fault seal breakdown in Niger Delta’s Cawthorne Channel Akaso field, yet the
preferred interpretation of the pressure data by the authors of the paper (Jev et al. 1993) is that the behavior was caused by
across fault flow in water-leg and there was little (if any) across fault hydrocarbon flow. Flow in the water-leg was possible
because the fault is not a seal below the hydrocarbon column as evidenced by decreasing clay smear factors. Hence this
example does not show fault seal breakdown, but merely a difference in fault seal integrity on the fault surface and effects of
flow of water through the fault.
The second example from the Marsh Island 36 field, Gulf of Mexico (Davies et al. 2003) is a situation in which the
hydrocarbon is in a low-pressure compartment and water pressure gradient within the fault rock in the high pressure
compartment supports the column. As the low pressure compartment is depressurized, the pressure differential across the fault
gradually increases until the capillary threshold pressure is exceeded and the fault becomes permeable to oil. Capillary fault
seal failure with this pressure configuration is well understood (Underschultz 2007) but requires rather specific hydrodynamic
conditions. However, no history match model was build for this field to support this theory.
Figure 4: Field pressure profile for 8 years of
production
Pressure stabilizing above bubble
point
Rapid Pressure
decline
Figure 3: Variation in Fault throw, thickness and clay
contents
Bubble point pressure
4 Fault Seal Breakdown Analysis in HP/HT Field
The third reported case of fault seal breakdown is discussed by Gilham in 2005, and involves a fault in the Shearwater HP/HT
reservoir in the Central North Sea. The gas water contact is the same across the fault, and evidence that the fault was a static
seal at the onset of production was interpreted from different fluid compositions measured in samples acquired from wells
drilled on each side of the fault. Dynamic evidence for initial fault sealing and later breakdown in Shearwater was derived
from interpretation of a P ⁄Z plot (Gilham et al. 2005). They interpreted a sharp change in linear slope in the Shearwater P ⁄Z
plot, but a close examination of the plot indicates that a curved trend may be equally likely. This would imply that a low
transmissibility (but non-sealing) fault is present throughout the period considered, and does not require any changes in fault
properties (Dake 2001; Zijlstra et al. 2007). In summary, therefore, the case for both static fault seal as well as for subsequent
fault seal breakdown in the Shearwater field may not be unequivocal.
The first attempts to incorporate geologically reasonable fault properties into production simulation models involved the
calculation of transmissibility multiplier based on the absolute permeability and thickness of fault rocks (Knai and Knipe,
1998). These calculations do not capture the multiphase behaviours of fault rocks (Fisher and Knipe, 2001). A key problem
with this approach is that a Huge number of pseudo-functions are needed to be calculated to take into account the large
variation in the properties (e.g. thickness, absolute permeability), flow rates and whether or not the faults is going through
drainage or imbibitions during production (Christie, 1996). The second attempt (Manzocchi 1999) involves calculating
transmissibility multiplier based on KF. The key problem with this approach is that KF only depends on shale gouge ratio
(SGR) and fault displacement. The calculation does not capture the impact of KH on KF.
There is a greater consensus as to how faulted rock should be modelled in production simulation studies, largely because the
controlling properties are inherently more predictable (sealing capacity of faults is controlled by the weakest point). Methods
for calculating faults in flow simulation models have been reviewed recently by Onyeagoro, Fisher & Jolley in 2007. They
concluded that the most important aspect is ensuring that the correct juxtapositions are contained in the model and that
geologically reasonable KF and thickness values are used to calculate transmissibility multiplier. In some situations such as
structures with high net to gross reservoirs and cataclastic fault rocks, two-phase fault rock properties should be considered as
capillary properties may be significant.
Approach
This methodology involves characterizing reservoir boundary using an integrated approach. Results derived from pressure
transient analysis (PTA), production analysis (PA), deconvolution and other information pertinent to this field were used to
obtain history matched model. In calculating transmissibility multipliers, SGR, KH, KF and fault thickness are considered. In
this work the effect of clay smear potential (CSP) is not considered, this is because shale layers present in HP/HT fields,
presents little or no ductility. Hence, CSP will have little effect on KF.
At first, Interpretation models are presented from analyzing well test data available for the appraisal (tested) well and Fault seal
analysis (Production analysis) as well as deconvolution on production data available for the producer well. This was done
using the well test interpretation software package Ecrin 4.20 from Kappa engineering.
Information derived from well test interpretation is reconciled with the existing static model, and boundaries identified from
well test interpretation are verified for existence within the available static geological model. In cases where they do not exist
they are introduced. The dynamic model (history matching) was constructed using Dynamo a Shell reservoir modeling
simulator package. The dynamic modelling is divided into 2 stages:
Stage 1: Rapid decline in reservoir pressure
Stage 2: Flattening of reservoir pressure.
Pressure transient analysis (Appraisal well) The objective was to identify reservoir boundaries, connectivity and estimate reservoir permeability. The appraisal well is a
vertical well drilled in 1991 into the eastern fault block of the upper and lower Skagerrak reservoir. The oil bearing Skagerrak
interval 14324 - 14604 ft TVDSS was tested and found to produce 410API oil at a stabilized rate of 4300 bbl/day (test GOR
1000 - 1100 scf/stb). Bottom-hole pressure (BHP) data is available for two Build ups and two drawdown tests conducted using
two down-hole gauges positioned at different depths (Figure 5). The comparison of the two gauges suggests that they are
slightly out of sync. The top gauge (brown line in Figure 5) was shifted by -0.0001 hr to synchronize it with the bottom gauge
(reference gauge). In order to check the drift, the top gauge was depth shifted to the bottom gauge’s (green line in Figure 5)
depth by adding 2.2 psi (difference of 3 ft), there is a good correlation between the two gauges and negligible drift. Both

Fault Breakdown Evaluation in HP/HT Field 5
gauges are suitable for interpretation. The bottom gauge was used as the reference gauge for the analysis presented in this
work.
The pressure difference plot with bottom gauge as the reference gauge is shown in Figure 5, ideally in a build-up period; the
pressure difference should be zero after correcting for depth. During the flow period (FP), the difference is non zero on account
of frictional pressure drop between the gauges. During shut-in period, there is after flow occurring in the wellbore due to well
bore storage which should be detected in the difference plot. The difference plot in this case suggests that there is after flow for
a very short period (<0.2 hrs) and hence a very short well bore storage period can be expected in the diagnostic plots. The data
has a frequency of 5 minutes with a 1psi resolution (poor resolution). The Input parameters and sources for information used
for PTA are summarized in Table 1.
Table 1: Input Parameters used in PTA
Discussion of Result
Figure 6 shows the log-log plot for the second build up (main flow period). It lasted for 50hrs. When trying to obtain a match
we applied a low degree of smoothing. This was done to capture the boundary effect because the data had a high frequency (5
minutes). The most suitable interpretation model obtained analytically from pressure and pressure derivative match was an
open rectangle model.
We deconvolved the two available flow periods, to validate the open rectangle geometry. This same geometry seems to match
the deconvolved pressure and pressure derivative response for the two flow periods. Figure 7 shows the match on
deconvolution response. The difference between the results obtained by different interpretation methods is within the
Parameters
Input
Values Sources
Thickness, ft 210
Completion
Report
Well Radius, ft 0.291
Well status
diagram
Porosity, % 0.21 Log Data
Oil FVF, bbl/day 1.68 PVT
Viscosity, cp 0.33 PVT
Total
compressibility, sip 1.5E-06
Skua Field
(Analogue)
Figure 6: Analytic model on Pressure and pressure
derivative response for FP2
Figure 7: Analytic model on Deconvolved Pressure
and pressure derivative for FP1 and FP2
Figure 5: QA/QC on pressure gauges

6 Fault Seal Breakdown Analysis in HP/HT Field
confidence interval (Azi et al). The wellbore storage seems to be discontinued before 0.1 hrs. This is in line with the
observation in the difference plot.
The open rectangle interpretation model was also verified using numerical simulation method. Figure 8 shows the result
obtained by superimposing the Skagerrak U3 (mid-perforation Interval) structural map on the voronoi grid in Saphir (Figure
9). The red box in Figure 9 shows the additional boundary introduced during numerical simulation. This additional boundary
was not captured on the Skagerrak structural map.
Investigation of the stratigraphic model across the perforation interval reveals the presence of a shale barrier between the tested
and producer well (See Figure 10). This shale layer gradually thins out deeper into the U2 formation. Barriers captured in
stratigraphic model might not actually exit since they are based on stochastic population. However, boundary captured from
well test interpretation is validated by the stratigraphic model.
Figure 11 shows the reservoir boundaries captured on geological model. The white circle in Figure 11 shows a gap between
Boundary 5 (B5) and boundary 3 (B3) contrary to numerical simulation result that show that these boundaries intersect (Figure
9). Identical pressure and pressure derivative behavior similar to PTA interpretation results for the tested well can only be
obtained if B5 is extended to reach B3 in the geological model. The true existence and extent of this barrier was considered
during history matching.
Production Analysis (Producer well)
Production from this field started January 1999 with an initial takeoff rate of 7.5Mstb/day. The well has been shut in since
October 2008 due to well lift and high salinity water production (350000ppm). Prior to being shut in, total oil production was
Figure 8: Numerical model on Pressure and pressure
derivative response for FP2
Figure 9: Numerical simulation using Saphir
Boundary not present on
Skagerrak structural map
Figure 10: Upper Skagerrak Facies distribution map
Figure 11: Boundaries captured in geological model
Producer well
Tested well
B3
B1 B2
B5
B6
B4
B5
B3
B1
B2
B4
B5 B6
Fault Seal Breakdown Analysis in HP/HT Field 7
8.6MMstb, total water production 1.6MMstb and total associated gas production: 9.9Bscf (Appendix C.2). Water production
started July 2001 with a very suspicious high rate (allocated rate based on monthly well test). Permanent down-hole gauge was
initially installed but stopped working after the first 3 months of production, so most of the pressure data available for the field
are tubing head pressures (THP). The BHP data used for analysis was generated from historical THP using Hagedorn and
brown correlation. For quality control check, the calculated BHP was compared with results obtained using two extreme
correlations: Fancer Brown’s correlation and Duns & Ros modified correlation. Fancer Brown correlation assumes no slippage
as a result over predicts BHP while Duns & Ros modified correlation under predicts BHP because it considers pressure losses.
The comparison shows that the result obtained is within acceptable limit. The top of perforation was used as the depth
reference point with an uncertainty of about ± 1500 psi (maximum difference between Hagedorn and brown correlation and the
two extreme correlations). This was done using the production and system performance analysis software (PROSPER)
The objectives of performing production analysis are as follows:
1. Estimation connected oil volume during rapid pressure depletion
2. Verify influx of fluid from another compartment into the producing block using numerical interpretation method. This
is achieved by changing the fault transmissibility multiplier (FTM) on the fault until a satisfactory match on
Skagerrak historical data is obtained.
3. Identify the broken down fault using deconvolution and estimate distance travelled by pressure transient after fault
seal failure. We shall also attempt to predict the origin of fault seal failure based on distance obtained
Since the fault leak occurred before the perforation of the Pentland formation (October 2003) Production analysis was
restricted to the Skagerrak historical production data. Moreover, it is difficult to get a match on changing KH using the
available well test interpretation software package.
The information used for this analysis includes: historical production data, completion data, 2005 4D seismic interpretation
results and PTA interpretation result. To capture the uncertainty associated with areal and vertical continuity of the boundary
identified from PTA (B5), Sensitivity on the area extent and leakage factor associated with B5 was investigated when trying to
obtain a match on Skagerrak historical data.
Discussion of Result
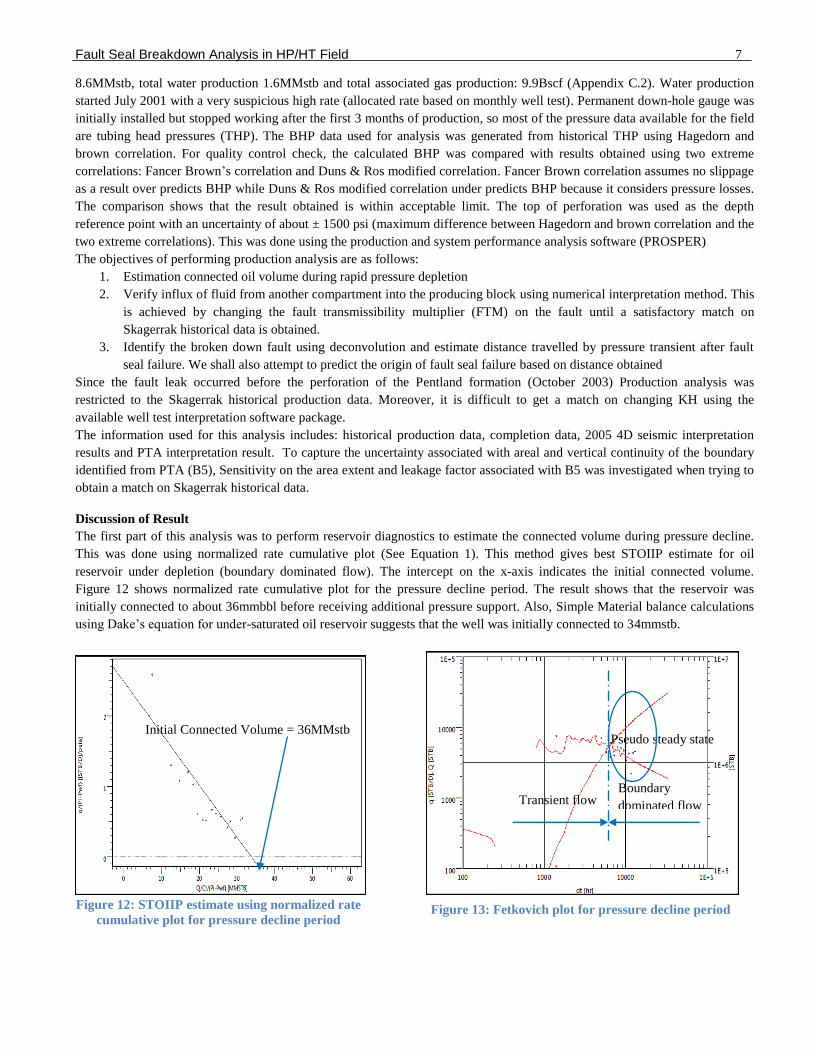
The first part of this analysis was to perform reservoir diagnostics to estimate the connected volume during pressure decline.
This was done using normalized rate cumulative plot (See Equation 1). This method gives best STOIIP estimate for oil
reservoir under depletion (boundary dominated flow). The intercept on the x-axis indicates the initial connected volume.
Figure 12 shows normalized rate cumulative plot for the pressure decline period. The result shows that the reservoir was
initially connected to about 36mmbbl before receiving additional pressure support. Also, Simple Material balance calculations
using Dake’s equation for under-saturated oil reservoir suggests that the well was initially connected to 34mmstb.
Figure 12: STOIIP estimate using normalized rate
cumulative plot for pressure decline period
Figure 13: Fetkovich plot for pressure decline period
Boundary
dominated flow Transient flow
Initial Connected Volume = 36MMstb Pseudo steady state

8 Fault Seal Breakdown Analysis in HP/HT Field
(t)P - P
q(t)
Wi
VS)(
Qn
wi PPCt
Q
……………….………………………..……………………………………………… (1)
Figure 13 shows the Fetkovich plot during pressure decline. The Fetkovich plot is used to identify transient flow and boundary
dominated flow condition (See Equation 2). From the match on the Fetkovich generated response we see that pseudo steady
state (PSS) was reached during pressure decline. This indicates that the well is initially depleted by a compartment.
& VS Elapsed time (hrs) ………………………………………………………………………………………... (2)
Fault seal was investigated using Topaze. Here we superimposed the Skagerrak map on the voronoi grid in Topaze, boundaries
identified from 2005 4D seismic interpretation (Figure 14) as sealing was used as our external boundaries (B1, B4 and B5).
Here we made sure the volume of the constructed reservoir was the same with the Skagerrak volume estimate (64 mmstb),
history matching was based on changing fault transmissibility multiplier (FTM) also known as seal factor for different
boundaries and extending the area length of B5 (boundary identified from PTA). A number of different solutions gave a
satisfactory history match on the Skagerrak historical data. The two most feasible scenarios based on other supporting evidence
such as 4D seismic interpretation result (Figure 14) are presented in this work.
Scenario 1: Field geology has it that the left side of B3 has a small throw (ST) while the right side has a large throw (LT). See
Figure 15. The expectation is that the weakest point on the fault is the region with smallest fault throw, to represent this
behavior B3 was subdivided into two. History match result was obtained by assigning ST an FTM of 0.05 and LT an FTM of
0.005 for B3, all other boundaries were closed (FTM=0). Figure 16 shows the reservoir boundaries and FTM for this scenario.
The boundary identified from PTA (B5) was captured in the model. However, B5 was not extended to reach B1. This was done
to allow flow from the left compartment into the producer well. The direction of movement is shown by the blue arrow.
Scenario 2: In this case, history match was obtained by assigning FTM of 0.005 to ST of B3 and 0.01 FTM to B5. All other
boundaries were closed (FTM =0). Figure 17 shows the reservoir boundaries and FTM for this scenario.
The work presented here suggests that there is most likely fault seal failure across side ST of B3 (the side with the lower
throw) and that B5 is most likely leaky to some extent as observed in the two cases.
Figure 18 shows the history match on Skagerrak historical data obtained for both scenarios. The red continuous line in Figure
18 shows the match on liquid rate, the red dotted line a match on cumulative liquid production while the green line shows the
match on flowing BHP. Similar match on historical production were obtained for both scenarios. The blue circle in figure 18
highlights deviation from historical data because of re-perforating the pentland formation and U3 water bearing Skagerrak
(increasing the value of KH).
Q n q(t)
Figure 14: 4D Seismic showing depletion area
Figure 15: Skagerrak U3 formation showing boundaries
B3
B2
B1
B4
B6
B4
B3
B2
B1
B6 B5
ST
LT
400ft
Compartment A
North
N1
N2 B7

Fault Seal Breakdown Analysis in HP/HT Field 9
Deconvolution (Producer Well)
Gringarten (2010) gave an intuitive description on practical use of deconvolution and showed how we can use the method to
show compartmentalization and pressure recharge from other layers which could not be observed from conventional analysis.
A similar approach was applied to this work.
The deconvolved derivative response for the Skagerrak production data prior to increasing perforated interval is shown in
Figure 19. This was done using TLSD (Imperial college software). The deconvolved pressure derivative response is boundary
dominated. For boundary dominated flow conditions, the response is not sensitive to initial pressure so it was easy to estimate
the initial reservoir pressure. The brown and green lines in Figure 19 yields identical response with an initial pressure (Pi) of
12382 psi compared to the black line with incorrect Pi. (RFT gives a Pi of 12380psi at a datum of 14013ft tvdss).
Note that early and middle time deconvolved derivative responses are not seen most likely because the production data for the
first two months were not included in the analysis, due to unavailability. Moreover early time response in deconvolved
derivative is an average. In describing the deconvolved derivative behavior, the late times response is broken down into early-
late, middle-late and late-late times.
The red line in Figure 19 shows the deconvolved derivative response for the Skagerrak historical production data. At early-late
times, when the pressure transient encounters B1 and B3 (Figure 15), the deconvolved response is that of a half unit slope
shown in yellow line (before recharge), The early-late time half unit slope here suggest that B1 and B3 were initially sealing, at
middle-late times, the pressure derivative follows a transition. The transition here occurs around 5000hrs (in the 7th month)
with duration of about 6 months (8 months period) and suggests that B3 becomes a leaky fault and production is supported by
Figure 16: Scenario 1- Fault Seal analysis geometry
using topaze
Figure 17: Scenario 2 - Fault Seal analysis geometry
using topaze
B1
Producer well
B4
B5 B5
B3
B2
B1
B4
B2
FTM= 0.005
FTM= 0.05
B3
FTM = 0.005
FTM = 0.01
Producer well
B6 B6
Deviation because of increasing
perforation length
Figure 18: Scenario 1 & 2 – History match on historical production and pressure using Topaze

10 Fault Seal Breakdown Analysis in HP/HT Field
fluid pressure and volume from the North block. This is supported by the observed pressure behavior in the field. The
deconvolved derivatives eventually stabilized at another half unit slope at late-late times shown in blue line which corresponds
to B1 and B4. This means its takes 8 months for the pressure transient to move from B3 to B4.
As a final step, two open rectangular models were applied to the deconvolved response obtained using Saphir (Appendix C.2).
This was done to compute the distance between B3 and B4. A distance of approximately 400ft was travelled by the pressure
transient before hitting B4. A possible location for this distance is suggested by the blue arrow in Figure 15. It highlight
possible location of this distance gotten by inspecting the distance between B3 and B4, but it could be anywhere around that
region. This interpretation is consistent with results from Fault leakage investigation (PA) performed using Topaze. Both
method identified the same fault to be leaky (B3) and also suggests that seal failure starts from the side with the smallest throw.
Dynamic Reservoir Simulation
Modeling Strategy
The objective of the dynamic simulation is to gain understanding of the pressure behavior and produce a history matched
model that will identify the leaky fault among a number of successive faults in this field. Result obtained from dynamic
simulation will be validated for consistency with well test interpretation result and 4D seismic interpretation result. The model
KH will be generated from porosity-permeability relationship established for the field. This is represented in equation 3 below
................................................................................................................................................... (3)
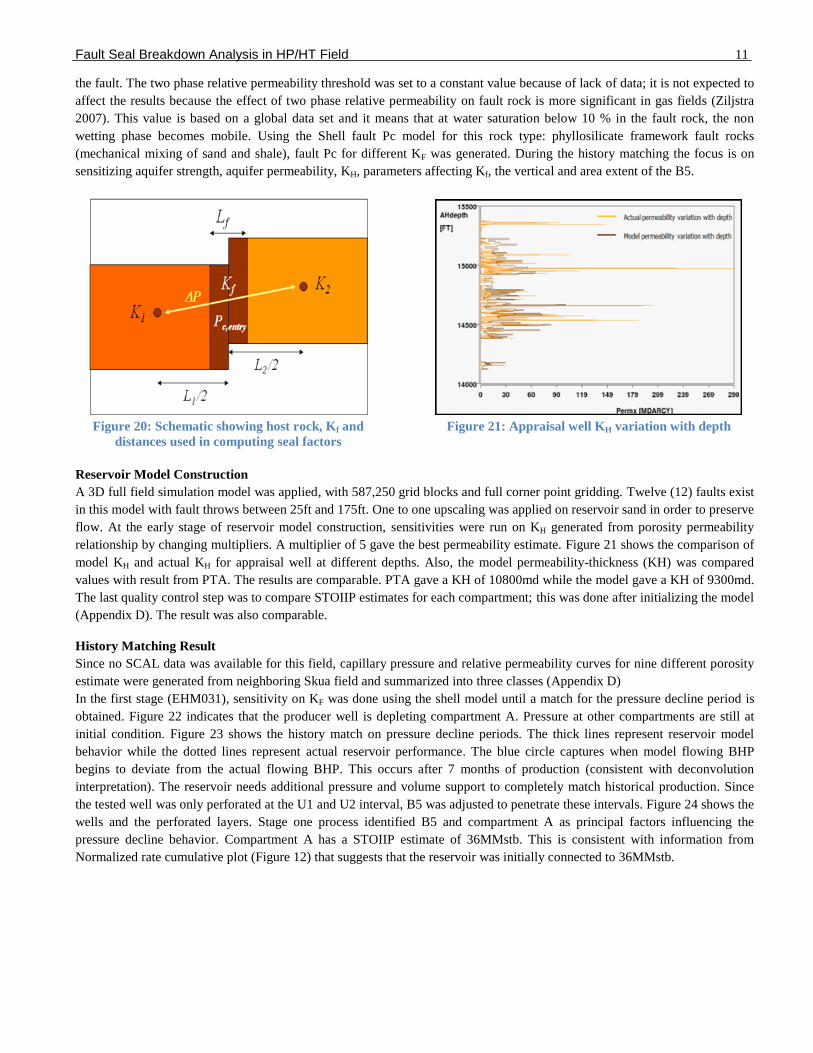
In the first stage, the focus is on identifying initial producing compartment; the KF at various points within the fault is
computed using the Shell KF model. The KF relationship is derived as a function of host rock permeability, SGR and fault
throws. The static fault seal factors (FTM) will be generated for various values of KF using equation 4. Figure 20 shows the
distances to fault for each grid block as used in multiplier calculations.
…………………………………….………………….… (4)
In the second stage approach, the effect of fault capillary pressure (Pc) on flow across fault by introducing a dynamic seal
factor is considered. The dynamic seal factor is a function of 2 phase relative permeability and capillary threshold pressure in
fK
fL
22K
fL -2L
12K
fL -1L
22K
2L
12K
1L
faulthout bility witTransmissi
faulth bility witTransmissi seal static
Figure 19: Deconvolved derivative for the producer well using TLSD
Early-late
Middle-late
Late-late
Late times
½ slope
Fault breakdown time
½ slope
Fault Seal Breakdown Analysis in HP/HT Field 11
the fault. The two phase relative permeability threshold was set to a constant value because of lack of data; it is not expected to
affect the results because the effect of two phase relative permeability on fault rock is more significant in gas fields (Ziljstra
2007). This value is based on a global data set and it means that at water saturation below 10 % in the fault rock, the non
wetting phase becomes mobile. Using the Shell fault Pc model for this rock type: phyllosilicate framework fault rocks
(mechanical mixing of sand and shale), fault Pc for different KF was generated. During the history matching the focus is on
sensitizing aquifer strength, aquifer permeability, KH, parameters affecting Kf, the vertical and area extent of the B5.
Reservoir Model Construction
A 3D full field simulation model was applied, with 587,250 grid blocks and full corner point gridding. Twelve (12) faults exist
in this model with fault throws between 25ft and 175ft. One to one upscaling was applied on reservoir sand in order to preserve
flow. At the early stage of reservoir model construction, sensitivities were run on KH generated from porosity permeability
relationship by changing multipliers. A multiplier of 5 gave the best permeability estimate. Figure 21 shows the comparison of
model KH and actual KH for appraisal well at different depths. Also, the model permeability-thickness (KH) was compared
values with result from PTA. The results are comparable. PTA gave a KH of 10800md while the model gave a KH of 9300md.
The last quality control step was to compare STOIIP estimates for each compartment; this was done after initializing the model
(Appendix D). The result was also comparable.
History Matching Result
Since no SCAL data was available for this field, capillary pressure and relative permeability curves for nine different porosity
estimate were generated from neighboring Skua field and summarized into three classes (Appendix D)
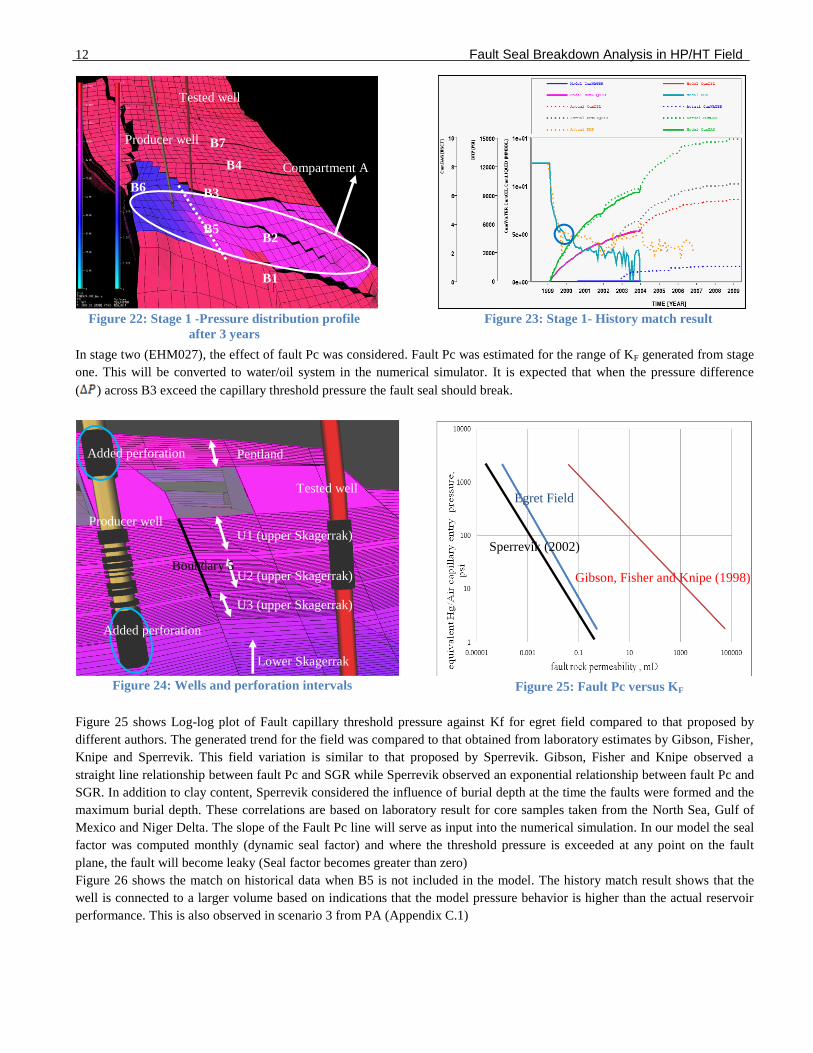
In the first stage (EHM031), sensitivity on KF was done using the shell model until a match for the pressure decline period is
obtained. Figure 22 indicates that the producer well is depleting compartment A. Pressure at other compartments are still at
initial condition. Figure 23 shows the history match on pressure decline periods. The thick lines represent reservoir model
behavior while the dotted lines represent actual reservoir performance. The blue circle captures when model flowing BHP
begins to deviate from the actual flowing BHP. This occurs after 7 months of production (consistent with deconvolution
interpretation). The reservoir needs additional pressure and volume support to completely match historical production. Since
the tested well was only perforated at the U1 and U2 interval, B5 was adjusted to penetrate these intervals. Figure 24 shows the
wells and the perforated layers. Stage one process identified B5 and compartment A as principal factors influencing the
pressure decline behavior. Compartment A has a STOIIP estimate of 36MMstb. This is consistent with information from
Normalized rate cumulative plot (Figure 12) that suggests that the reservoir was initially connected to 36MMstb.
Figure 20: Schematic showing host rock, Kf and
distances used in computing seal factors
Figure 21: Appraisal well KH variation with depth
12 Fault Seal Breakdown Analysis in HP/HT Field
In stage two (EHM027), the effect of fault Pc was considered. Fault Pc was estimated for the range of KF generated from stage
one. This will be converted to water/oil system in the numerical simulator. It is expected that when the pressure difference
( ) across B3 exceed the capillary threshold pressure the fault seal should break.
Figure 25 shows Log-log plot of Fault capillary threshold pressure against Kf for egret field compared to that proposed by
different authors. The generated trend for the field was compared to that obtained from laboratory estimates by Gibson, Fisher,
Knipe and Sperrevik. This field variation is similar to that proposed by Sperrevik. Gibson, Fisher and Knipe observed a
straight line relationship between fault Pc and SGR while Sperrevik observed an exponential relationship between fault Pc and
SGR. In addition to clay content, Sperrevik considered the influence of burial depth at the time the faults were formed and the
maximum burial depth. These correlations are based on laboratory result for core samples taken from the North Sea, Gulf of
Mexico and Niger Delta. The slope of the Fault Pc line will serve as input into the numerical simulation. In our model the seal
factor was computed monthly (dynamic seal factor) and where the threshold pressure is exceeded at any point on the fault
plane, the fault will become leaky (Seal factor becomes greater than zero)
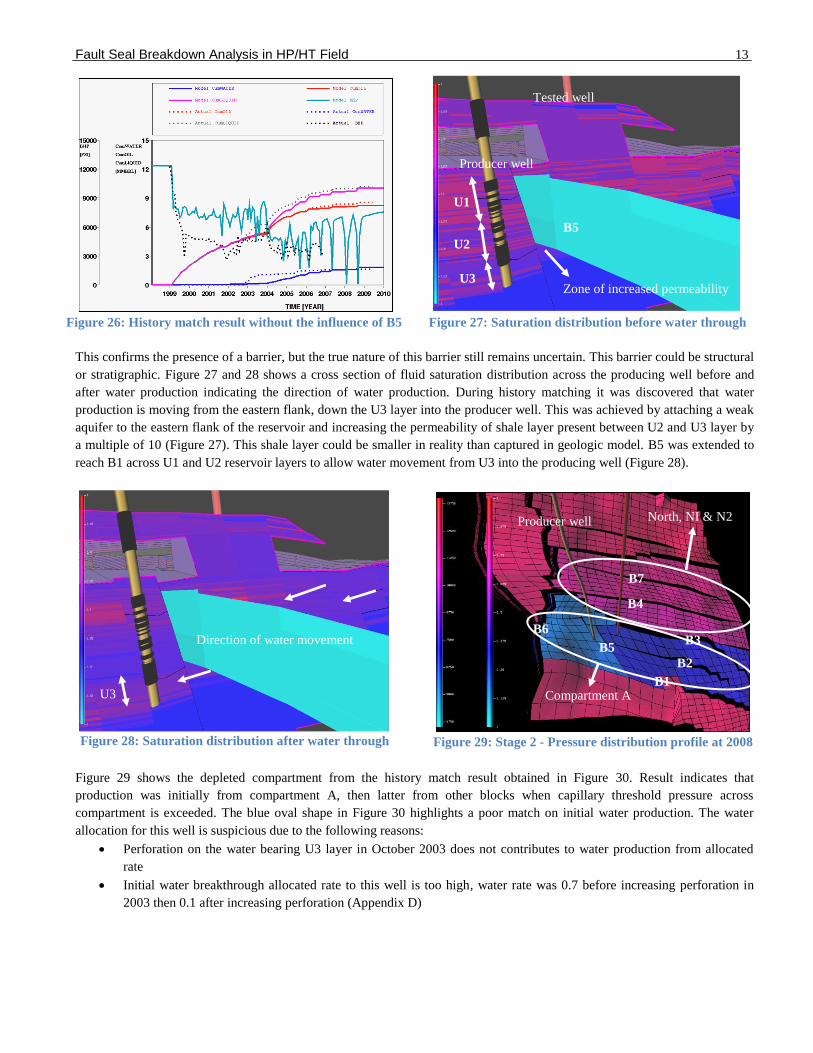
Figure 26 shows the match on historical data when B5 is not included in the model. The history match result shows that the
well is connected to a larger volume based on indications that the model pressure behavior is higher than the actual reservoir
performance. This is also observed in scenario 3 from PA (Appendix C.1)
Figure 22: Stage 1 -Pressure distribution profile
after 3 years
B1
Producer well
B3 B6
Tested well
Compartment A
Figure 23: Stage 1- History match result
B5
Figure 25: Fault Pc versus KF
Gibson, Fisher and Knipe (1998)
Sperrevik (2002)
Figure 24: Wells and perforation intervals
Egret Field
Pentland
U1 (upper Skagerrak)
U2 (upper Skagerrak)
U3 (upper Skagerrak)
Lower Skagerrak
Producer well
Tested well
Boundary 5
Added perforation
B2
Added perforation
B4
B7
Fault Seal Breakdown Analysis in HP/HT Field 13
This confirms the presence of a barrier, but the true nature of this barrier still remains uncertain. This barrier could be structural
or stratigraphic. Figure 27 and 28 shows a cross section of fluid saturation distribution across the producing well before and
after water production indicating the direction of water production. During history matching it was discovered that water
production is moving from the eastern flank, down the U3 layer into the producer well. This was achieved by attaching a weak
aquifer to the eastern flank of the reservoir and increasing the permeability of shale layer present between U2 and U3 layer by
a multiple of 10 (Figure 27). This shale layer could be smaller in reality than captured in geologic model. B5 was extended to
reach B1 across U1 and U2 reservoir layers to allow water movement from U3 into the producing well (Figure 28).
Figure 29 shows the depleted compartment from the history match result obtained in Figure 30. Result indicates that
production was initially from compartment A, then latter from other blocks when capillary threshold pressure across
compartment is exceeded. The blue oval shape in Figure 30 highlights a poor match on initial water production. The water
allocation for this well is suspicious due to the following reasons:
Perforation on the water bearing U3 layer in October 2003 does not contributes to water production from allocated
rate
Initial water breakthrough allocated rate to this well is too high, water rate was 0.7 before increasing perforation in
2003 then 0.1 after increasing perforation (Appendix D)
Figure 26: History match result without the influence of B5
Figure 29: Stage 2 - Pressure distribution profile at 2008
Figure 28: Saturation distribution after water through
Direction of water movement
U3
Producer well
Producer well
Figure 27: Saturation distribution before water through
Compartment A
North, NI & N2
B3
B1
B2
B5
B6
Tested well
Producer well
B5
U1
U2
U3 Zone of increased permeability
B4
B7

14 Fault Seal Breakdown Analysis in HP/HT Field
Figure 31 shows the initial pressure distribution for various compartments while Figure 32 shows the pressure distribution
across the compartments after 6 years of depletion. In 2005 production was from the North and N1 block with a little bit of
depletion in the N2 block. Investigation shows that when fault threshold Pc of approximately 1000psi was exceeded B3, B4
and B7 breaks down. This occurs at around 2005. This pressure behavior across the compartment is similar to the pressure
depletion across the field as suggested by 2005 seismic interpretation result (Figure 14).
Figure 33 shows the pressure depletion across the field in 2008 just before shut in. This indicates that the well is depleting the
four compartments.. B6 and B1 were made sealing and excluded from the dynamic fault seal calculations because seismic
interpretation result shows that they are sealing. Fault seal do not fail across the pentland formation. The history matched
model developed in this work will be validated for use based on the 4D seismic interpretation latter in the year.
Results and Discussion
The primary aim of this study was to show how well test interpretation could be useful and validated in history matching
process where fault seal breakdown affects production and also identify fault breakdown using dynamic seal factors. PTA
captured the presence of a barrier between wells, with an uncertainty around nature of the barrier. Fetkovich plot for the first
year of production indicates early boundary effect. Fault seal analysis on Skagerrak historical data using topaze identifies B3
and B5 to be the leaky boundary. Deconvolution not only identified B3 to be the leaky fault but also identified region where
seal failure started. This was evident from the distance travelled by the pressure transient during the transition period.
Incorporating B3 and Fault Pc computed from different Kf in a dynamic model, it was possible to obtain a match on historical
production. Fault seal analysis using topaze and history matched model confirms the existence of B5 (Boundary introduced as
a result of pressure transient interpretation result). Well test interpretation result and history matched model suggest B1 as a no
Figure 30: Stage 2: History match result
Figure 31: Initial Pressure distribution across fault
North N1 N2 Compartment A
Figure 32: Pressure distribution across fault at 2005
Figure 33: Pressure distribution across fault at 2008
B3
North N1 N2
11700psi
Compartment A
12300psi
o
N1 N2 North Compartment A
B3
B3
B4
B4
B4
7100psi 11300psi 7000psi 11600psi 11100psi
12500psi 12500psi 12500psi
11000psi
12500psi
B7
B7 B7

Fault Seal Breakdown Analysis in HP/HT Field 15
flow boundary whereas the structural model indicates discontinuity along the extent of the fault. Results obtained from
matching history are consistent with that from PA and deconvolution (Figure 24 and 25). Additionally, history matched results
identified fault capillary seal failures to be responsible for flow across all faults. The dynamic model also suggests that we are
currently depleting the N2 block. This can all be validated from new 4D Seismic data acquisition or reprocessing. Result
obtained from History matching is consistent with that from scenario 2 in production analysis and 4D seismic interpretation.
Uncertainties are expected in our results based on flow rate allocation error (monthly well test) and THP measurement error.
However, the range in error is not expected to greatly affect the conclusions. The fault rock two phase relative permeability
threshold was set to a constant value due to lack of relative permeability measurement. These are not also expected to affect
our result because this effect in fault rock is more significant in gas field (Ziljstra 2007).
Conclusion
The following conclusions arise from the work. They are:
1. This report have discussed and demonstrated some well test analysis techniques for investigating fault seal breakdown
in hydrocarbon-bearing reservoirs. Results obtained from well test interpretation techniques are consistent with that
obtained from history matched simulation model
2. Connected volumes were controlled by Fault Seal, intra shale layers and capillary threshold pressure
3. Fault B1, B3 and B7 breaks down when ∆P of approximately 1000psi across fault is exceeded.
4. Fault seal breakdown do not occur across the pentland formation
5. The history matched dynamic model can be validated from the New 4D Seismic data interpretation.
6. Fault seal breakdown investigation should be an integrated approach between all subsurface disciplines with input
from a structural geology expert
7. An oil field in the North Sea was used as case study and has been presented to demonstrate the usefulness of the
procedure
Further work Recommended
I hereby recommend the following.
1. New vintage 4D Seismic data acquisition or reprocessing of the existing data to confirm the sealing nature of B1 and
to also validate the reliability of the model, if we see depletion across the N2 compartment.
2. Acquisition of core data for capillary pressure and relative permeability measurement.
3. The interpretation method presented in this work should be applied to neighboring field or other HP/HT fields to
validate presented concepts.
Acknowledgments
The author thanks the staff of Shell U.K. for the access to the software used in this work. My appreciation also goes to
Petroleum Technology Development Fund Abuja, Nigeria for the scholarship to study at Imperial College.
Nomenclature
CSP = Clay Smear Potential
HP/HT = High pressure/High temperature
Kf = Fault Permeability in mD
KH = Host rock Permeability in mD
KV= Host rock vertical Permeability in mD
KH = Permeability thickness in mD-ft
TVDSS = True vertical depth subsea
GOR = Gas oil Ratio in scf/stb
BHP = Bottom hole pressure
ST = Short throw
LT = Large throw
FTM = Fault transmissibility multiplier
PA = Production Analysis
Pc= Capillary entry pressure in psi
PTA = Pressure Transient Analysis
SGR = Shale Gouge Ratio
FP = Flow Period (build up)
Lf = Fault thickness
Li = Length of grid block
Pi = Initial pressure in Psi
Bo = Oil formation volume factor in bbl/stb
Q = cumulative production in MMstb
QN = Normalized cumulative production in MMstb
Ct = Total compressibility in sip
ø = Porosity in %
Bscf = Billion standard cubic feet
References Acharya U.K., Eisenberg R.A., Breneman R.J., Adeogba A.A.:“Integrated Fault seal Characterization for Reservoir Management” Paper SPE
38090 presented at the 1997 SPE Asia Pacific Conference and Exhibition held in Kuala Lumpur, April 14-16.
Al-Busafi B., Fisher Q. J., Harris S. D. and Kendall M.:“The Impact of Faults Representation on History Match and Future Generated
seismic Impedance Response in Reservoir Models – Case Study for Pierce Field, North Sea” Paper SPE 93429 presented at the 2005 SPE
Europe/EAGE Annual Conference held in Madrid, Spain, June 13-16. 3.
Arild Selvig, Torbjorn Fristad, J. K. Silseth.:“A Stochastic Fault Modeling Procedure Applied to a North Sea Reservoir” Paper SPE 25010
presented at the 1992 European Conference held in Cannes, France, November 16-18.
Barry J. J., Bentley M. R.:“Representation of Fault sealing in a Reservoir Simulation: Cormorant Block IV, UK. North Sea” Paper SPE
22667 presented at the 1991 SPE 66th Annual Technical Conference and Exhibition held in Dallas, Texas, October 6-9.
Cuisiat F., Skurtveit E., Cleave R.:“Fault seal prediction in unconsolidated sediments with a novel experimental apparatus” Paper ISBN 978-
0-415-45084-3, Presented in 2007 at the 11th Congress of the International Society for Rock Mechanics, London
Davis R.K., An L., Jones P., Mathis A. and Cornethe C.:“Fault seal analysis South Marsh Island 36 field, Gulf of Mexico” 2003 AAPG
Bulletin, Volume 87, 479-491.
Edris N. R., Stephen K .D., Shams A., Macbeth C.:“Updating Fault Transmissibilities in Simulations by Successively Adding Data to an
Automated Seismic History Matching Processes: A Case Study” Paper SPE 113557 presented at the 2008 Europec/EAGE Annual
Conference held in Rome, Italy June 9-12.
Fisher Q. J.: “Recent Advances in Fault Seal Analysis as an Aid to Reservoir Characterization and Production Simulation Modeling” Paper
SPE 94460 presented at the 2005 SPE Europec/EAGE Annual Conference held in Madrid, Spain June 13-16.
Gringarten A. C.:“Practical use of well test deconvolution” Paper SPE 134534 presented at the 2010 SPE Annual Technical Conference and
Exhibition held in Florence, Italy September 20-22.
Manzocchi T., Childs C. and Walsh J. J.:“Faults and Fault Properties in Hydrocarbon Flow models”: A Report (2010) presented by the Fault
Analysis Group, UCD School of geological Sciences, University College Dublin, Dublin 4, Ireland 100, 102- 103, 105.
McClung G., Coote L. and Davidson W.:“Eastern Trough Project Heron Cluster Operations and Producing From Complex HP/HT Subsea
Fields” Paper SPE 56901 presented at the 1999 Offshore Europe Conference held in Aberdeen, Scotland, September 7-9.
Mckie Tom, Jolley S. J. and Kristensen M. B.: Stratigraphic and structural compartmentalization of dryland fluvial reservoirs: Triassic
Heron Cluster, Central North Sea reported written by Shell U.K. and Shell Canada, 176.
Onyeagoro Kachi, Steve Naruk, Frans Van der Vlugt, Mark Barton, Carlos Pirmez and Ciaran:“ Impact of structural and stratigraphic
heterogeneities in deep water development” Paper SPE 111909 presented at the 2007 SPE Annual Technical Conference and Exhibition
held in Abuja, Nigeria. August 6-8.
Rodriguez L.G., Cunha L.B., Chalaturrnyk R.:“Coupled Flow simulation in a Deepwater Reservoir: Fault Leakage Analysis” Paper CIPC-
017, presented at the 2009 Canadian International Petroleum Conference, Calgary, Alberta, Canada, June 16-18.
Sorkhabi R., Sukuki U. and Sato D.:“Structural Evaluation of Petroleum Sealing Capacity of Faults” Paper SPE 59405 presented at the 2000
SPE Asia Pacific Conference on Integrated Modelling for Asset Management, Yokohama, Japan, April 25-26.
Suleiman M. Al-Hinai, J. Fisher, A. Grattoni: “Recent Advances in the Understanding and Incorporation of the Multiphase Fluid Flow
Properties of Fault Rocks into Production Simulation Models” Paper SPE 105375 presented at the 15th SPE Middle east Oil and Gas
Show and Conference held in Bahrain International Exhibition Centre, Bahrain, March 11-14.
William A., Chris Townsend.:“The Effects of Faulting on Production from a Shallow Marine Reservoir – A study of the Relative Importance
of Fault Parameters” Paper SPE 49023 presented at the 1998 SPE Annual Technical Conference and Exhibition held in New Orleans,
Louisiana September 27-30.
Zijlstra E. B., Reemst P. H. M., Fisher Q. J.:“Incorporation of Fault properties into production simulation models of Permian reservoirs from
the southern North Sea. In: structurally Complex Reservoirs (eds Jolley S.J., Barr D, Walsh J.J. Knipe R.J.)” 2007, Geological Society of
London Special Publication, 292, 295-308

Fault Seal Breakdown Analysis in HP/HT Field 17
Appendix A
A.1: Milestones in Fault Seal Breakdown Analysis and Critical Literature Review
Table A.1: Milestones in Fault Seal Breakdown Analysis
Author Paper No. Year Paper Title Major Contribution
J. J. Barry
M. R. Bentley
SPE 22667 1991 Representation of Fault sealing
in a Reservoir Simulation:
Cormorant Block IV, UK. North
Sea.
1. First to provide a semi-
quantitative modeling
procedure of fault sealing
assuming clay smear and shale
juxtaposition to be the primary
sealing mechanisms.
2. Showed that combination of
fault seal and reservoir
simulation model effectively
enhances final reservoir
model.
Arild Selvig
Torbjorn Fristad
J. K. Silseth
SPE 25010 1992 A Stochastic Fault Modeling
Procedure Applied to a North
Sea Reservoir
Provided a methodology for
relating the uncertainty in fault
characteristics (fault geometry
and transmissibility) to
uncertainty in time-dependent
production characteristics.
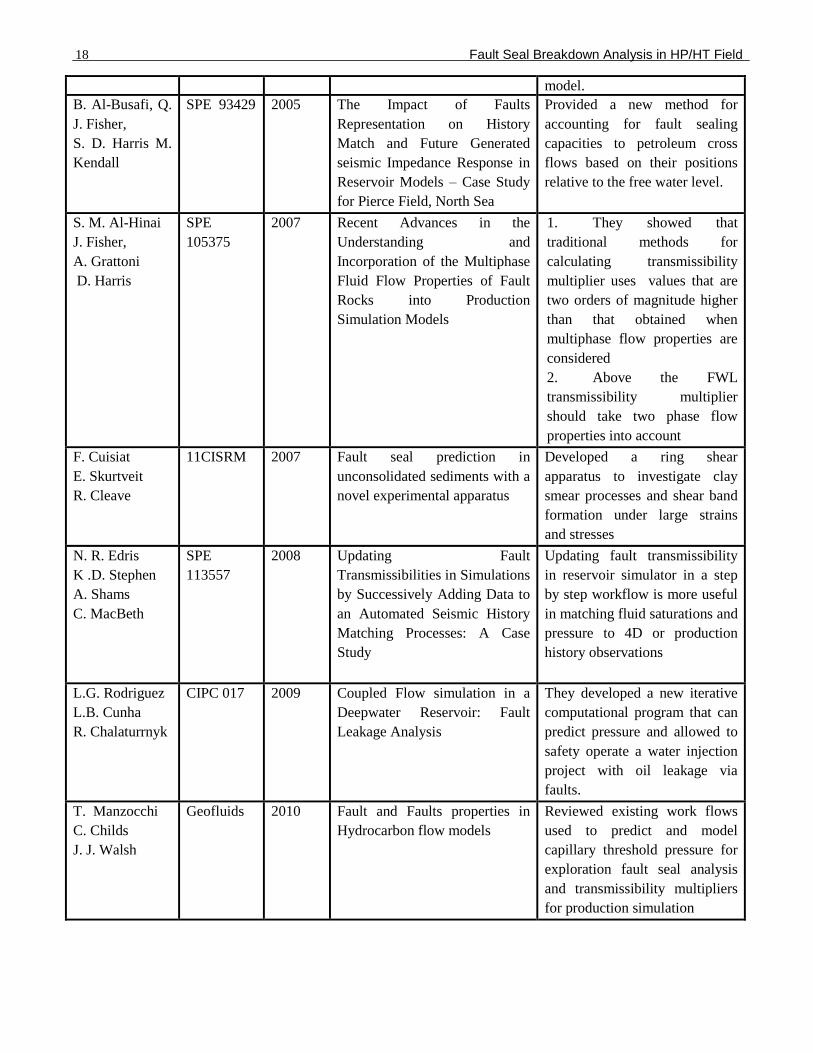
William A.
Chris Townsend
SPE 49023 1998 The Effects of Faulting on
Production from a Shallow
Marine Reservoir – A study of
the Relative Importance of Fault
Parameters
1. Showed that Fault plane
seal and cross faults are the
most important factors affecting
recovery
2. Showed that Fault
displacement and several
sedimentary parameter had no
significant influence on
recovery
R. Sorkhabi
U. Sukuki
D. Sato
SPE 59405 2000 Structural Evaluation of
Petroleum Sealing Capacity of
Faults
Presented a conceptual model
for evaluating Individual faults
as petroleum seals or pathways
Q. J. Fisher SPE 94460 2005 Recent Advances in Fault Seal
Analysis as an Aid to Reservoir
Characterization and Production
Simulation Modeling
First to document the impact of
multiphase flow across fault by
including effects of capillary
pressure and relative
permeability characteristics of
faults in reservoir simulation
18 Fault Seal Breakdown Analysis in HP/HT Field
model.
B. Al-Busafi, Q.
J. Fisher,
S. D. Harris M.
Kendall
SPE 93429 2005 The Impact of Faults
Representation on History
Match and Future Generated
seismic Impedance Response in
Reservoir Models – Case Study
for Pierce Field, North Sea
Provided a new method for
accounting for fault sealing
capacities to petroleum cross
flows based on their positions
relative to the free water level.
S. M. Al-Hinai
J. Fisher,
A. Grattoni
D. Harris
SPE
105375
2007 Recent Advances in the
Understanding and
Incorporation of the Multiphase
Fluid Flow Properties of Fault
Rocks into Production
Simulation Models
1. They showed that
traditional methods for
calculating transmissibility
multiplier uses values that are
two orders of magnitude higher
than that obtained when
multiphase flow properties are
considered
2. Above the FWL
transmissibility multiplier
should take two phase flow
properties into account
F. Cuisiat
E. Skurtveit
R. Cleave
11CISRM 2007 Fault seal prediction in
unconsolidated sediments with a
novel experimental apparatus
Developed a ring shear
apparatus to investigate clay
smear processes and shear band
formation under large strains
and stresses
N. R. Edris
K .D. Stephen
A. Shams
C. MacBeth
SPE
113557
2008 Updating Fault
Transmissibilities in Simulations
by Successively Adding Data to
an Automated Seismic History
Matching Processes: A Case
Study
Updating fault transmissibility
in reservoir simulator in a step
by step workflow is more useful
in matching fluid saturations and
pressure to 4D or production
history observations
L.G. Rodriguez
L.B. Cunha
R. Chalaturrnyk
CIPC 017 2009 Coupled Flow simulation in a
Deepwater Reservoir: Fault
Leakage Analysis
They developed a new iterative
computational program that can
predict pressure and allowed to
safety operate a water injection
project with oil leakage via
faults.
T. Manzocchi
C. Childs
J. J. Walsh
Geofluids 2010 Fault and Faults properties in
Hydrocarbon flow models
Reviewed existing work flows
used to predict and model
capillary threshold pressure for
exploration fault seal analysis
and transmissibility multipliers
for production simulation

Fault Seal Breakdown Analysis in HP/HT Field 19
A.2: This section presents a one page summary of each of the papers presented in Table A.1
SPE 22667 (1991)
Representation of Fault sealing in a Reservoir Simulation: Cormorant Block IV, UK. North Sea.
Authors: M. R. Bentley and J. J. Barry.
Contribution to the understanding of Fault Seal & Breakdown Analysis
They both presented a procedure for combining the reservoir simulation and fault seal models
Objective of the paper:
The paper objective was to demonstrate how to effectively represent sealing potential of reservoir rocks in
numerical simulators
Methodology used:
Fault seal in Cormorant Block IV was modeled using a reservoir simulator assuming Clay smear and sand shale
juxtaposition to be the primary sealing mechanism
Conclusion reached:
Fault sealing was semi-quantitatively modeled using an empirical relationship describing the potential
for clay smear development during extensional faulting
Results from clay smear modeling were built into a numerical reservoir simulation to help define cross
flow paths over major in-field faults
Iterative introduction of ranked leak paths into the simulation model should be done during history
match, and an effective calibration of the clay smear model against production data
Numerical simulation using a curvilinear grid successfully reproduced the material balance behavior of
a strongly compartmentalized field
The fault seal model provides an effective enhancement to the reservoir simulation, illustrating the
benefit of an integrated geological/ reservoir engineering approach to reservoir modeling
Comments:
Multiphase flow properties such as relative permeability and capillary pressure across the faults were not
considered in the simulation model.

20 Fault Seal Breakdown Analysis in HP/HT Field
SPE 25010 (1992)
A Stochastic Fault Modeling Procedure Applied to a North Sea Reservoir
Authors: Arild Selvig, Torbjorn Fristad and J. K. Silseth
Contribution to the understanding of Fault Seal & Breakdown Analysis
They developed a procedure to compare uncertainty in fault characteristics (fault geometry and transmissibility) to
uncertainty in time-dependent production characteristics.
Objective of the paper:
The paper discusses the impact of undetectable, small faults on the field production performance compare
Methodology used:
Stochastic fault modeling approach was used. The useful of this method relies on the precision of the statistical
input data. The problem was split into two parts;
The fault pattern generation
The generation of fault zone transmissibilities
Conclusion reached:
Incomplete knowledge about infield faulting is more the rule than the exception for many North Sea
reservoirs
Stochastic modeling of highly faulted reservoirs can help capture different outcome range which is useful
prior to deciding on the field development plan
The procedure proposed in this work is very useful when information about the infield fault pattern is
sparse
Comments:
Conclusion based on application of methods to only one Reservoir in the North Sea
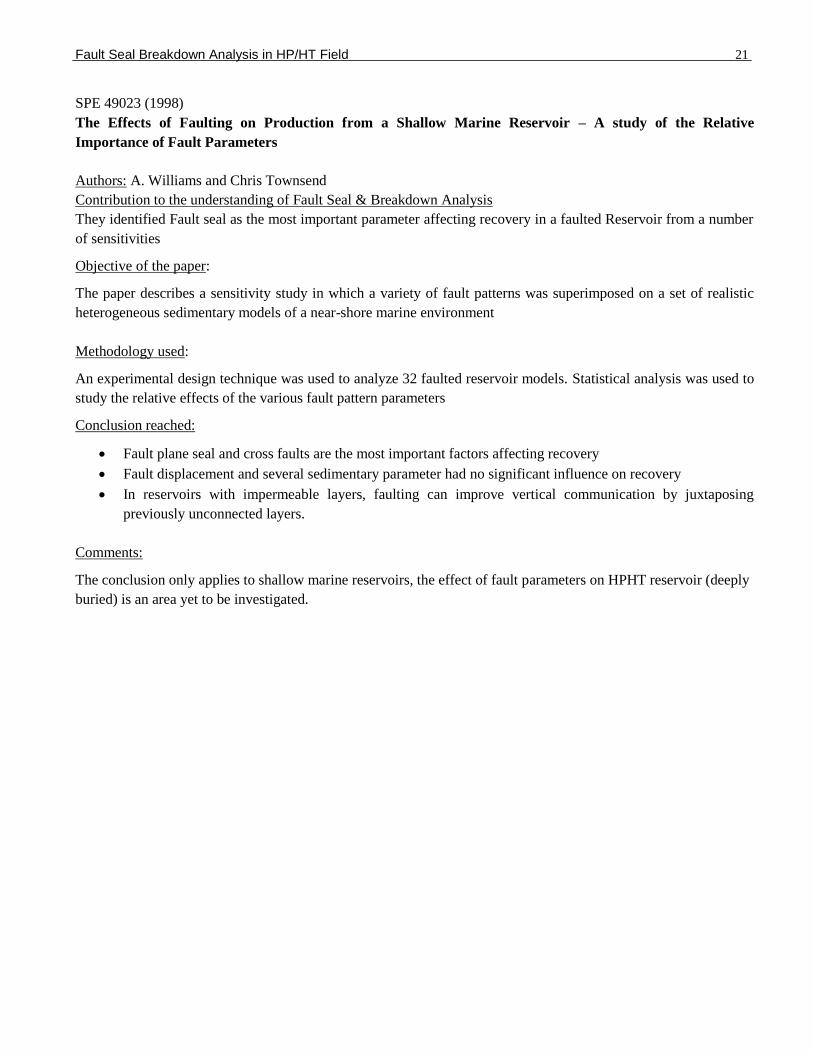
Fault Seal Breakdown Analysis in HP/HT Field 21
SPE 49023 (1998)
The Effects of Faulting on Production from a Shallow Marine Reservoir – A study of the Relative
Importance of Fault Parameters
Authors: A. Williams and Chris Townsend
Contribution to the understanding of Fault Seal & Breakdown Analysis
They identified Fault seal as the most important parameter affecting recovery in a faulted Reservoir from a number
of sensitivities
Objective of the paper:
The paper describes a sensitivity study in which a variety of fault patterns was superimposed on a set of realistic
heterogeneous sedimentary models of a near-shore marine environment
Methodology used:
An experimental design technique was used to analyze 32 faulted reservoir models. Statistical analysis was used to
study the relative effects of the various fault pattern parameters
Conclusion reached:
Fault plane seal and cross faults are the most important factors affecting recovery
Fault displacement and several sedimentary parameter had no significant influence on recovery
In reservoirs with impermeable layers, faulting can improve vertical communication by juxtaposing
previously unconnected layers.
Comments:
The conclusion only applies to shallow marine reservoirs, the effect of fault parameters on HPHT reservoir (deeply
buried) is an area yet to be investigated.

22 Fault Seal Breakdown Analysis in HP/HT Field
SPE 59405 (2000)
Structural Evaluation of Petroleum Sealing Capacity of Faults
Authors: R. Sorkhabi, U. Sukuki and D. Sato
Contribution to the understanding of Fault Seal & Breakdown Analysis
They highlighted the fact that to completely understand the behavior of fault we need to understand the tectonic
setting (remote stress), fault style (type and shape), fault geometric parameters (throw and length), fault rock
characteristics (clay smearing, cataclasis, cementation), fault damage zone (fault zone width, fracture density,
orientation and connectivity and mineral vein and deformation band), host rock characteristics and chronology of
fault activities.
Objective of the paper:
The paper objective was to provide a conceptual model based on quantitative information and an integration of
various parameters necessary for evaluation of individual faults as petroleum seals or pathways.
Methodology used:
They built a conceptual model to summarize various issues related to fault sealing evaluation
Conclusion reached:
The study from available data indicate that CSP of >15, SSF of <7, and SGR of >18% are threshold values
for fault sealing in normal faults.
Analysis of fracture density, aperture, orientation and connectivity, as well as fault-zone diagenesis are
therefore important in fault-sealing evaluation
Comments:
The paper did not attempt to quantify the sealing capacity or leaking conditions of faults.

Fault Seal Breakdown Analysis in HP/HT Field 23
SPE 94460 (2005)
Recent Advances in Fault Seal Analysis as an Aid to Reservoir Characterization and Production Simulation
Modeling
Authors: Q. J. Fisher
Contribution to the understanding of Fault Seal & Breakdown Analysis
Fisher was the first to document the impact of multiphase flow across fault by including effects of capillary
pressure and relative permeability characteristics of faults in reservoir simulation model.
Objective of the paper:
The paper shows results obtained from comparing fault transmissibility obtained from Reservoir Simulator to that
obtained from Cores.
Methodology used:
The approach was to conduct a forward seal analysis
Analyzed permeability and pressure threshold of numerous (>2000) faults rocks from cores
Calculate transmissibility multipliers based on the fault offset and clay distribution within the reservoir
Assess whether or not this could help explain the production data.
Conclusion reached:
Multiphase flow properties of fault should be incorporated during reservoir simulation to better simulate
real reservoir processes
Comments:
Fisher’s work did not say much about how the Multiphase flow properties of fault rock were measured.
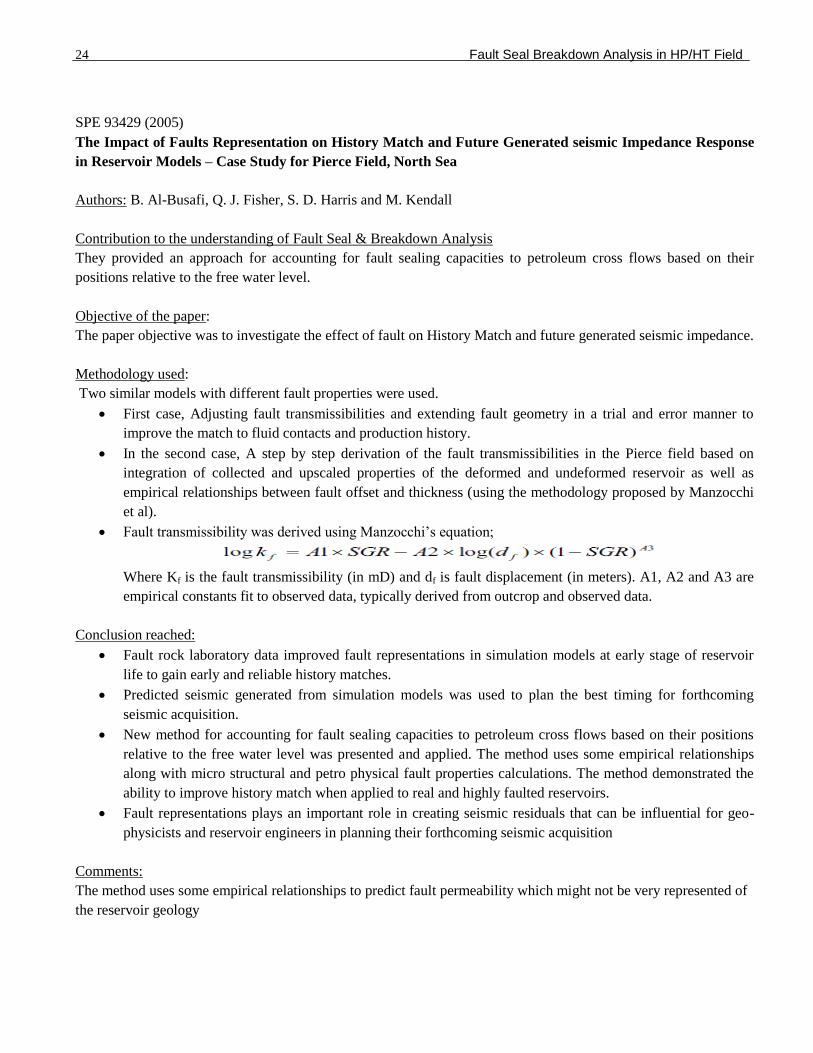
24 Fault Seal Breakdown Analysis in HP/HT Field
SPE 93429 (2005)
The Impact of Faults Representation on History Match and Future Generated seismic Impedance Response
in Reservoir Models – Case Study for Pierce Field, North Sea
Authors: B. Al-Busafi, Q. J. Fisher, S. D. Harris and M. Kendall
Contribution to the understanding of Fault Seal & Breakdown Analysis
They provided an approach for accounting for fault sealing capacities to petroleum cross flows based on their
positions relative to the free water level.
Objective of the paper:
The paper objective was to investigate the effect of fault on History Match and future generated seismic impedance.
Methodology used:
Two similar models with different fault properties were used.
First case, Adjusting fault transmissibilities and extending fault geometry in a trial and error manner to
improve the match to fluid contacts and production history.
In the second case, A step by step derivation of the fault transmissibilities in the Pierce field based on
integration of collected and upscaled properties of the deformed and undeformed reservoir as well as
empirical relationships between fault offset and thickness (using the methodology proposed by Manzocchi
et al).
Fault transmissibility was derived using Manzocchi’s equation;
Where Kf is the fault transmissibility (in mD) and df is fault displacement (in meters). A1, A2 and A3 are
empirical constants fit to observed data, typically derived from outcrop and observed data.
Conclusion reached:
Fault rock laboratory data improved fault representations in simulation models at early stage of reservoir
life to gain early and reliable history matches.
Predicted seismic generated from simulation models was used to plan the best timing for forthcoming
seismic acquisition.
New method for accounting for fault sealing capacities to petroleum cross flows based on their positions
relative to the free water level was presented and applied. The method uses some empirical relationships
along with micro structural and petro physical fault properties calculations. The method demonstrated the
ability to improve history match when applied to real and highly faulted reservoirs.
Fault representations plays an important role in creating seismic residuals that can be influential for geo-
physicists and reservoir engineers in planning their forthcoming seismic acquisition
Comments:
The method uses some empirical relationships to predict fault permeability which might not be very represented of
the reservoir geology

Fault Seal Breakdown Analysis in HP/HT Field 25
SPE 105375 (2007)
Recent Advances in the Understanding and Incorporation of the Multiphase Fluid Flow Properties of Fault
Rocks into Production Simulation Models
Authors: Suleiman M. Al-Hinai, Quentin J. Fisher, Carlos A. Grattoni and Simon D. Harris
Contribution to the understanding of Fault Seal & Breakdown Analysis
They presented a technique for measuring relative permeability and capillary pressure measurements for fault rocks
and also presented an approach for incorporating them into a production simulation model.
Objective of the paper:
The paper objective was to review different existing methods for incorporating multiphase flow properties into
simulation models and recommend some possible approaches for treating faults in simulators
Methodology used:
Fault specimen were taken from extensional lossiemouth fault zone in the Clashach quarry near Burghead
in north-east Scotland
Microstructural properties were then examined using an X-ray computed tomography (CT) system
Porosity was measured using a helium expansion porosimeter
Gas and water relative permeability measurements were made de saturation technique
Capillary pressures are obtained from J-functions
Methods for Incorporating them into Simulation models are then presented
Conclusion reached:
In zone below the FWL the transmissibility multiplier should be calculated using the formula below
o
In the transition zone directly above the FWL, TM should be set initially at zero until the threshold
pressure is exceeded
At height above the FWL where the threshold pressure is exceeded, the transmissibility multiplier should
be calculated using the formula below
Comments:
The models presented in the paper was only tested for a gas field, it was not tested for oil reservoirs where we
might have effects of three phase relative permeability
26 Fault Seal Breakdown Analysis in HP/HT Field
SPE 113557 (2008)
Updating Fault Transmissibilities in Simulations by Successively Adding Data to an Automated Seismic
History Matching Processes: A Case Study
Authors: N. R. Edris, K .D. Stephen, A. Shams, and C. MacBeth
Contribution to the understanding of Fault Seal & Breakdown Analysis
They demonstrated the fact that updating fault transmissibility in reservoir simulator in a step by step workflow is
extremely useful in matching fluid saturations and pressure to 4D or production history observations
Objective of the paper:
This paper present the result of investigating the impact of successively updating faults by adding new data to
observed dataset and comparing the results to that obtained from a single history match where all data is used
Methodology used:
Optimized history data by using a multi-dimensional inversion technique based on calculated misfit between
observed and predicted data (UKCS Schiehallion reservoir using six years of production data and six seismic
surveys). The steps involved include:
Matching the first year of seismic history using short simulations
Using the best Model from above, improving uncertainty measures of the parameter space
Repeat the process by including a second year of Data
Repeat the process by including four year of Data
Perform a second inclusive run using all the data and compare results obtained using the two methods
Conclusion reached:
Compared to the traditional method the step by step workflow of history match used in this work provides
a good history match leading to improved confidence and higher quality of field development and
management process
Slightly better models were obtained when we explore the parameter space first with short simulations. It is
possible to avoid unnecessarily long history matching runs
We can improve our estimate of uncertainty and can identify parameters that are relatively unimportant
Comments:
Conclusion based on application of methods to one Reservoir: Schiehallion Reservoir

Fault Seal Breakdown Analysis in HP/HT Field 27
CIPC 017 (2009)
Coupled Flow simulation in a Deepwater Reservoir: Fault Leakage Analysis
Authors: L.G. Rodriguez, L.B. Cunha and R. J. Chalaturrnyk
Contribution to the understanding of Fault Seal & Breakdown Analysis
They developed a new iterative computational program that can predict allowed to safety operate a water injection
project with oil leakage via faults.
Objective of the paper:
Explore the production uncertainties in an undeveloped oil reservoir, under water injection project, with a major
internal fault and the role of geomechanics in the fault reactivation
Methodology used:
Use an Iterative algorithm for coupling multiphase reservoir flow simulation and geomechanics to
investigate fault reactivation.
Used two numerical simulators, one that emphasizes flow through porous media aspects and the other on
the geomechanical behavior.
Conclusion reached:
1. Oil and gas production in stress-sensitive reservoirs may be simulated by coupled numerical modeling. The
relationship of stress with permeability, and fault strain with transmissibility can be set-up based on
sufficient laboratory tests.
2. Parameters influencing fault leakage include reservoir temperature, injection pressure, reservoir pressure,
fault permeability and well location with respect to fault position
Comments:
Conclusion based on application of methods to an offshore unconsolidated sandstone reservoir field located in
Campos Basin of Brazil

28 Fault Seal Breakdown Analysis in HP/HT Field
A.3: Summary of advances in Fault seal breakdown analysis
A.4: Program/Simulation Workflow

Fault Seal Breakdown Analysis in HP/HT Field 29
Appendix B
B.1: Further details on Pressure Transient Analysis and Interpretation Result (Appraisal well)
Pressure Transient Analysis and Interpretation Result
Figure B.1: Semi-Log Plot for FP2
Figure B.2: Semi-Log Plot for FP1 and FP2
Figure B.3: History plot for numerical
simulation
Figure B.4: History plot for deconvolution
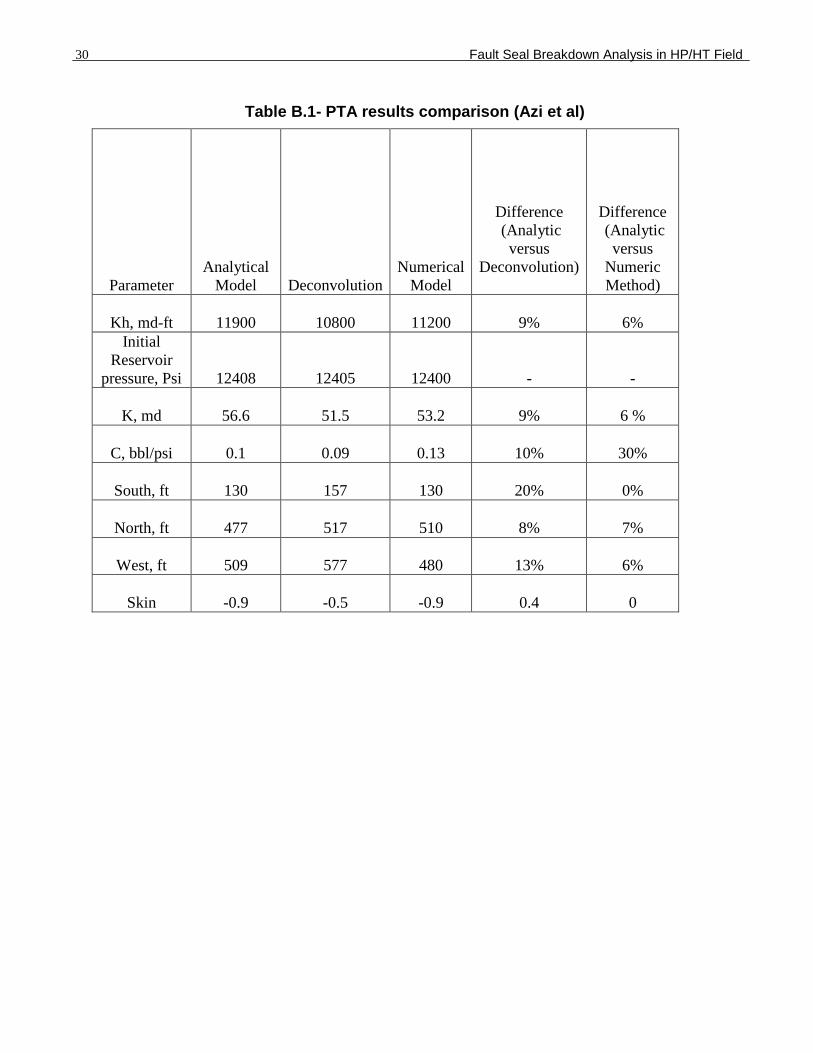
30 Fault Seal Breakdown Analysis in HP/HT Field
Table B.1- PTA results comparison (Azi et al)
Parameter
Analytical
Model Deconvolution
Numerical
Model
Difference
(Analytic
versus
Deconvolution)
Difference
(Analytic
versus
Numeric
Method)
Kh, md-ft 11900 10800 11200
9%
6%
Initial
Reservoir
pressure, Psi 12408 12405 12400
-
-
K, md 56.6 51.5 53.2
9%
6 %
C, bbl/psi 0.1 0.09 0.13
10%
30%
South, ft 130 157 130
20%
0%
North, ft 477 517 510
8%
7%
West, ft 509 577 480
13%
6%
Skin -0.9 -0.5 -0.9
0.4
0

Fault Seal Breakdown Analysis in HP/HT Field 31
Figure B.5: Full Skagerrak U3 top structural map
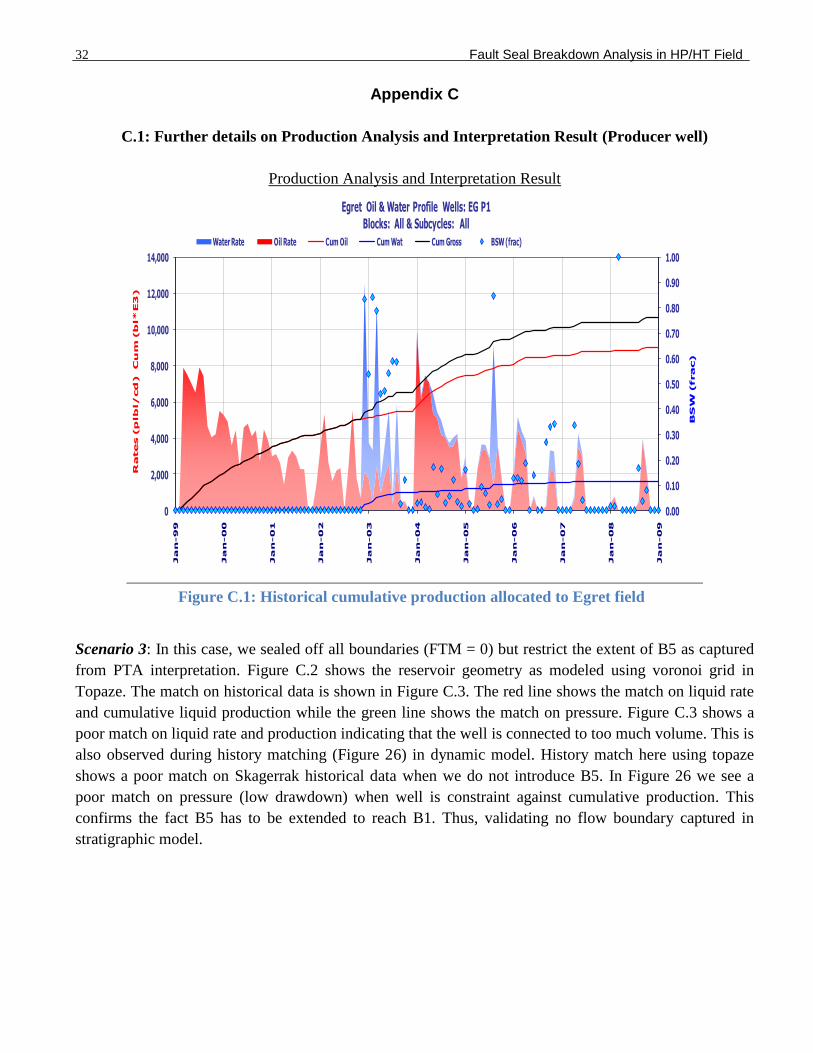
32 Fault Seal Breakdown Analysis in HP/HT Field
Appendix C
C.1: Further details on Production Analysis and Interpretation Result (Producer well)
Production Analysis and Interpretation Result
0.00
0.10
0.20
0.30
0.40
0.50
0.60
0.70
0.80
0.90
1.00
0
2,000
4,000
6,000
8,000
10,000
12,000
14,000
Ja
n-9
9
Ja
n-0
0
Ja
n-0
1
Ja
n-0
2
Ja
n-0
3
Ja
n-0
4
Ja
n-0
5
Ja
n-0
6
Ja
n-0
7
Ja
n-0
8
Ja
n-0
9
BS
W (
fra
c)
Ra
te
s (
plb
l/cd
)
Cu
m (
bl*
E3
)
Egret Oil & Water Profile Wells: EG P1
Blocks: All & Subcycles: All
Water Rate Oil Rate Cum Oil Cum Wat Cum Gross BSW (frac)
Scenario 3: In this case, we sealed off all boundaries (FTM = 0) but restrict the extent of B5 as captured
from PTA interpretation. Figure C.2 shows the reservoir geometry as modeled using voronoi grid in
Topaze. The match on historical data is shown in Figure C.3. The red line shows the match on liquid rate
and cumulative liquid production while the green line shows the match on pressure. Figure C.3 shows a
poor match on liquid rate and production indicating that the well is connected to too much volume. This is
also observed during history matching (Figure 26) in dynamic model. History match here using topaze
shows a poor match on Skagerrak historical data when we do not introduce B5. In Figure 26 we see a
poor match on pressure (low drawdown) when well is constraint against cumulative production. This
confirms the fact B5 has to be extended to reach B1. Thus, validating no flow boundary captured in
stratigraphic model.
Figure C.1: Historical cumulative production allocated to Egret field

Fault Seal Breakdown Analysis in HP/HT Field 33
Figure C.2: Scenario 3 - Fault seal analysis geometry using topaze
B2
B1
B3
B4
B5 B6
Producer well
Deviation from historical cumulative production
Figure C.3: Scenario 3 – History match on historical production and pressure using Topaze

34 Fault Seal Breakdown Analysis in HP/HT Field
C.2: Further details on Deconvolution Result (Producer well)
Deconvolution using Saphir
The Saphir response shows a very high wellbore storage that was not visible from the response obtained
using TLSD. This is not feasible since production was ongoing at the time. However our focus was the
boundary effect. Both methods exhibit the end of initial half unit slope (B1 and B3) and start of latter half
unit slope (B1 and B4). The transition is exactly the same and lasted for about 6000hr (8 months).
The match on the early-late time response in Figure C.4 corresponds to an open rectangular geometry.
The transition lasted for about 6000hrs (8 months). The match on the late-late time response in Figure
C.5 also corresponds to an open rectangular geometry. The difference in distance between the two
geometries corresponds to the distance travelled by the pressure transient during the transition and it is
approximately 400ft. See Figure C.6 for the geometry configuration for this response
Figure C.5: Late-late time match on
deconvolved pressure and pressure derivative
response using Saphir
Figure C.4: Early-late time match on
deconvolved pressure and pressure derivative
response using Saphir
Beginning of transitions = 5500hrs End of transitions = 11000hrs
400ft
Figure C.6: Fault Breakdown analytical solution geometry as modeled using Saphir
Producer well
B1
B3
B1 B1
B4
B3 B3

Fault Seal Breakdown Analysis in HP/HT Field 35
Appendix D
D.1: Further details on dynamic reservoir simulation
Dynamic Reservoir Simulation
Table D1- STOIIP Estimates comparison for different compartment
Static volume Dynamic volume
Skagerrak &
Pentland
STOIIP
(mmstb)
Skagerrak &
Pentland
STOIIP
(mmstb)
Compartment
A 38.9
Compartment
A 36
North 6.3 North 7
N1 11.3 N1 12
N2 8 N2 7
N Graben 2.1 N Graben 3
Fault Slither 6.2 Fault Slither 8
Total 72.8 Total 73
Figure D.1: Relative permeability curve for different porosity
class generated from analog (Skua field)

36 Fault Seal Breakdown Analysis in HP/HT Field
12 different porosity estimates for both relative permeability and capillary pressure were analyzed from
the neighboring Skua field. The curves shown in Figure E.1 and E.2 above summarize the 12 different
porosity estimate into three classes. For porosity less than 0.164 the black curve shown in Figure E.1 and
E.2 is used to define the relative permeability or capillary pressure, similarly for porosity between 0.164
and 0.207, the red curve is used and finally for rock with porosity greater than 0.271 the blue curve is
used.
Figure D.2: Capillary pressure curve for different porosity class
generated from analog (Skua field)
Figure D.3: Match on Historical Rate (Model Constraint)

Fault Seal Breakdown Analysis in HP/HT Field 37
Appendix E
E.1: Summary of Fault Breakdown Analysis on Egret field investigated using MBal (Analytic Method)
Egret Fault Breakdown Analysis using MBal
Objective of study:
The objective of this study was to use material balance to gain understanding of the field production
performance by history matching historical production and pressure data
Methodology used:
The modeling was divided into three phase:
Phase 1: Rapid decline in reservoir pressure
Phase 1: Flattening of reservoir pressure decline and period covering up to 2003 add perf
intervention
Phase 1: Post intervention covering period up to the well shut in
Figure E.1: Modeling reservoir
compartment using MBal
Figure E.2: Schematics showing
fault leakage scenario

38 Fault Seal Breakdown Analysis in HP/HT Field
Phase 1 Results and Observation:
Phase 2 Results and Observation:
Observations
1. Rapid and linear pressure drop
2. No sign of pressure support
3. 6000 psi decline after 1.1mstb production
4. Appraisal well test shows small connected
volume
Observations
1. Flattening of decline observed after 1.1mstb
and 6000psi depletion
2. Flattening not expected until below bubble
point in reservoir if no change in connected
STOIIP
3. Recharging during shut down
4. Pressure profile cannot be explained if
connected to only small volume
5. pressure support most likely from a leaky fault
Figure E.3: Phase 1- Rapid decline in
reservoir pressure
Figure E.4: Phase 2- Reservoir pressure
stabilization above bubble point
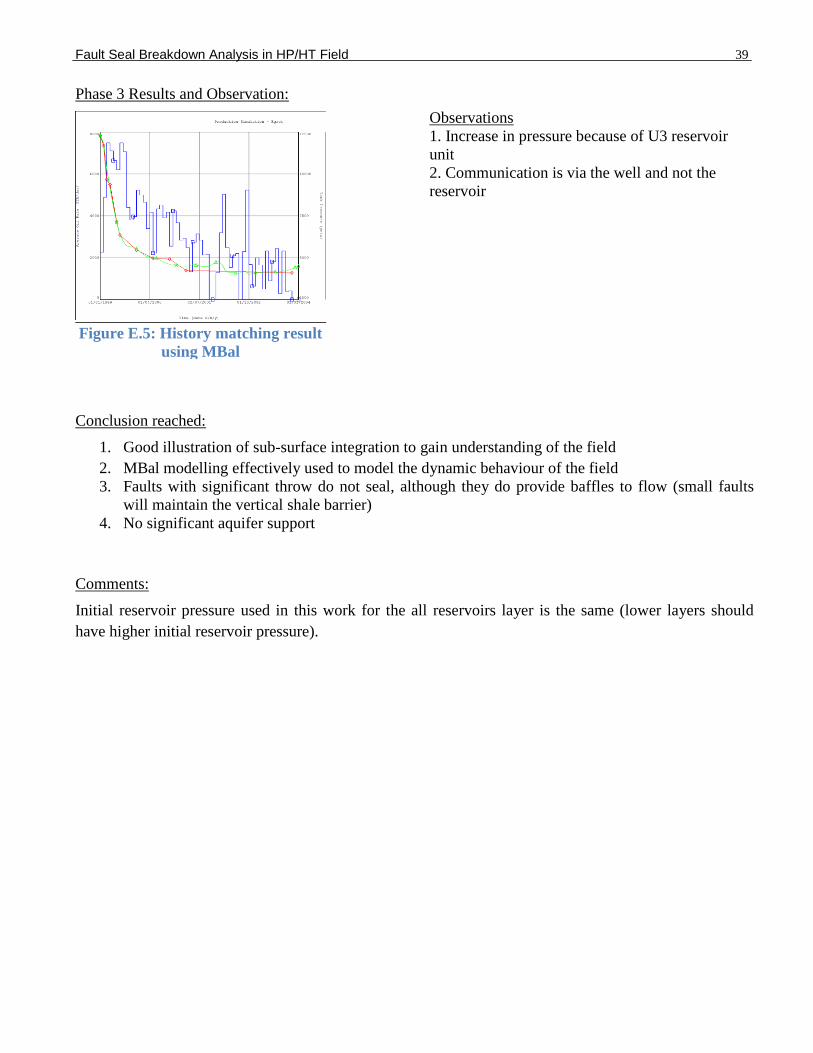
Fault Seal Breakdown Analysis in HP/HT Field 39
Phase 3 Results and Observation:
Conclusion reached:
1. Good illustration of sub-surface integration to gain understanding of the field
2. MBal modelling effectively used to model the dynamic behaviour of the field
3. Faults with significant throw do not seal, although they do provide baffles to flow (small faults
will maintain the vertical shale barrier)
4. No significant aquifer support
Comments:
Initial reservoir pressure used in this work for the all reservoirs layer is the same (lower layers should
have higher initial reservoir pressure).
Observations
1. Increase in pressure because of U3 reservoir
unit
2. Communication is via the well and not the
reservoir
Figure E.5: History matching result
using MBal