sheldon litwin md presentation-6-5-2011 - oregon acc · 2 sheldon e. litwin, m.d. obesity-related...
TRANSCRIPT

1
Sheldon E. Litwin, M.D.Chief, Cardiology Division, Georgia Health Sciences
University
Disclosures:
None
Obesity and the Heart: Can Weight Loss Reverse Remodeling and Slow
Atherosclerosis?
Sheldon E. Litwin, M.D.
The problem…
♦Prevalence of overweight and obesity are increasing (~70% of people in the USA)♦5% severely obese (2.8% Male, 6.9% Female)
In the last quarter we saw remarkable gains.
10%…15%…even 20%!
With minimal losses, all signs point to
unprecedented growth in the future. In other
words…
Net worth is up!!
Net WEIGHT is up.
Sheldon E. Litwin, M.D.
Obesity Facts
♦ Leading “preventable” cause of death (now > tobacco use), estimated 300,000/year*♦ Cardiovascular disease, cancer, diabetes, OSA,
arthritis, depression♦ Mortality most strongly associated with cardiovascu lar
disease– CAD, CHF, sudden death, stroke
♦ Cost (in 1995 dollars) ~ $99.2 billion$51.6 billion direct / $47.6 billion indirect
♦ 5.7% of total health care costs in 1995

2
Sheldon E. Litwin, M.D.
Obesity-related morbidity and mortality
♦Nearly all studies show reduced life expectancy in obese subjects– Cancer prevention study (> 1 million subjects)– Large Chinese study (> 150,000 subjects)– 2 recent papers in NEJM (2006)♦ “U” shaped relationship between BMI and
mortality♦ 25 y.o. severely obese male has 22% ↓ in life
expectancy (loss of 12 years of life)
Obesity and the risk of heart failure. Kenechiah et al, NEJM 2002;347:305
Obese
Overweight
Normal
Based on BMI at time of enrollment.
Mean age at enrollment was 53 years.
Of the patients who had an echo near the time of CHF dx, most had a reduced EF.
Sheldon E. Litwin, M.D.
Obesity and CAD Risk Factors
♦Hypertension♦Dyslipidemia
– Particularly low HDL, high TG
♦Diabetes/glucose intolerance♦Sleep disordered breathing♦Inflammatory state♦Physical inactivity

3
Sheldon E. Litwin, M.D.
Obesity and age of first MI. Madala et al. JACC 2008
CRUSADE registry, 189,000 patients, 2001-2007
Most obese subgroup (BMI > 40) were 15 years younger than leanest subgroup at time of first MI
Sheldon E. Litwin, M.D.
Other potential causes of CHF in obesity
♦HTN♦LVH♦High output state
– Increased blood volume– Increased lean and fat body mass
♦Fat infiltration/lipotoxicity
Sheldon E. Litwin, M.D.
What physicians do about obesity…
� Our advice is not useful, not followed or ineffective
�Weight loss achieved by lifestyle modification is not maintained
� Long term use of diet drugs is unsafe or unstudied; however, obesity is clearly chronic
�Severe obesity is refractory to drug and diet therapy

4
Sheldon E. Litwin, M.D.
Pharmacological Rx of ObesityDrug Class Current status
Phentermine/fenfluramine (phen-fen)
NE reuptake blockerSerotonin release & uptake
Withdrawn due to valve damage & PHTN
Sibutramine NE & serotonin reuptake blocker
Withdrawn due to adverse CV effects
Rimonabant cannabinoid receptor inhibitor
Withdrawn due to depression/suicide
Orlistat Lipase inhibitor OTC (small weight loss, GI side effects)
Phentermine/Topiramate NE reuptake blockerAnticonvulsant, migraine
Investigational*
Metformin Biguanide (� glucogeogen) Approved DMII
Exenatide, Liraglutide GLP-1 agonists Approved DMII
Fluoxetine, Sertraline SSRI’s Rx of depression
Bupropion Dopamine reuptake inhib investigational
Zonisamide anticonvulsantSerotonin/dopamine agonist
investigational
Sheldon E. Litwin, M.D.
Effects of low dose, controlled release, phentermin e plus topiramate combination on weight and associated com orbities in overweight and obese adults (CONQUER): A randomized , placebo-controlled phase 3 trialGadde KM, et al Lancet 2011; 377:1341-52
Sheldon E. Litwin, M.D.
Bariatric surgery: the only therapy that really works
Roux en Y GBPRestrictive/malabsorptive

5
Sheldon E. Litwin, M.D.
Gaps in bariatric surgical research
♦Generalizability♦Safety♦Longitudinal Outcomes/durability
– Adequate control group
♦Differences between procedures– restrictive vs. malabsorptive
Courcalis AP, Flum DR. JAMA 2005; 254:1957-1960
Sheldon E. Litwin, M.D.
Morbidity and Mortality Related to Gastric Bypass Surgery (2001-2015)
♦ Body weight and composition♦ Lipid profile♦ Fasting glucose, insulin,
HgbA1C♦ Echocardiography♦ Limited polysomnography♦ PFT’s♦ Blood pressure♦ Exercise Testing♦ Physical activity/diet♦ Quality of life assessment♦ CAC scoring
� 1156 severely obese subjects (BMI > 40 kg/m 2 or > 35 with complications)
� 423 GBS, 412 seeking surgery but denied by insurance, 321 controls not seeking surgery
� ~850 subjects had overnight admission to GCRC with extensive testing
� Return visit at 2 years, 5 years and 10 years
Single center, prospective registry, University of Utah
Sheldon E. Litwin, M.D.
Baseline demographics and Cardiovascular risk factors
Sugery cases Denied controls
Age 42 42
BMI 47 46
Systolic BP 126 126
Diastolic BP 71 72
Heart Rate 73 71
Glucose 102 106
Hb A1C 5.8 5.9
Insulin 20 17*
HOMA-IR 5.1 4.6
LDL 107 107
HDL 46 44
Triglycerides 185 185
Apnea-hypopnea index
22 21

6
Sheldon E. Litwin, M.D.
Echocardiographic dataNonobese (n=59)
Obese (n=455)
P value
BMI (kg/m2) 24 45 <0.001
Systolic BP (mmHg) 113 123 0.001
Diastolic BP (mmHg) 69 70 NS
Heart Rate (bpm) 67 73 <0.001
Septal thickness (cm) 0.9 1.1 <0.001
PW thickness (cm) 0.8 1.0 <0.001
LVIDd (cm) 4.4 4.7 0.001
Relative wall thickness 0.40 0.46 <0.001
LV mass index (g/ht2.7) 40 58 <0.001
Fractional Shortening (%) 35 35 NS
Mid wall FS (%) 17 15 <0.001
Sheldon E. Litwin, M.D.
Interaction between BMI,HTN and OSA
Avelar et al, Hypertension 2007;49:34
Sheldon E. Litwin, M.D.
The Impact of Obesity on the Left Ventricle: MESA
Turkbey et al, JACC imaging. 2010;3:266-274

7
Sheldon E. Litwin, M.D.
Picture brought in by a proud and happy participant in our study at the time of his 2 year follow up visit
Average weight loss in GBS subjects at 2 years = -100 lbs
Average change in BMI at 2 years = -15 units
Sheldon E. Litwin, M.D.
Abdominal CT ScansNonsurgery Subjects Surgery Subjects
Sheldon E. Litwin, M.D.

8
Sheldon E. Litwin, M.D.
Cured Diseases
Table 8. Percent of Subjects with New Onset or Resolved DiseaseDisease Surgery
CasesDeniedControls
RandomControls
DiabetesResolved 81 21 9Incidence since baseline 1 4 8HypertensionResolved 45 8 5Incidence since baseline 1 6 10
CAD incidence 1 0 0Stroke incidence 0 0 1Cancer incidence 1 1 2
Sheldon E. Litwin, M.D.
Survival
♦5 deaths at 2 year time point (2 cases, 3 denied, 95% complete follow up)♦Perioperative mortality low and
comparable to published data♦Compare to older medicare patients
undergoing GBS with much higher 6-12 month mortality– Worse in males– Worse with surgeons performing lower
numbers of procedures
Sheldon E. Litwin, M.D.
LV mass after GBS
50
75
100
125
150
175
200
Baseline 2 Year F/U
LV m
ass (
g)
NonsurgGBS
NS p < 0.0001
r = 0.49t = 13.46p < 0.0001

9
Sheldon E. Litwin, M.D.
Mid wall fractional shortening
Sheldon E. Litwin, M.D.
Tissue Doppler Imaging
• Tissue Doppler Images of septal mitralannulus were measured in early diastole(E’), late diastole (A’) and systole (S’).
S’
E’ A’
Sheldon E. Litwin, M.D.
TDI in GBS patients
♦TDI not part of routine echo at the beginning of the study♦Did not begin acquiring this data until
more than half way through the baseline studies♦Subsequent slides, will show
comparison of 2 year data in ~ 250 subjects/group (GBS vs. Nonsurgery)

10
Sheldon E. Litwin, M.D.
Tissue Doppler (2 year data)
*1.06 ± .36
0.87 ± .29
E’ /A’
GastricBypass
Non-Surgical
*8.3 ± 1.6*10.1 ± 2.1*10.2 ± 2.6
8.8 ± 2.011.1 ± 2.69.2 ± 2.3
S’ (cm/s)A’ (cm/s)E’ (cm/s)
Significantly higher in Gastric Bypass group
Significantly lower in Gastric Bypass group
* p < 0.05 vs. Nonsurg
Sheldon E. Litwin, M.D.
Clinical Correlates of TDI
.121 .081 - .239 .203A’
.092 .023 - .122 .133S’
- .241* - .296* .298* - .251*E’/A’
- .232 - .302* .185 - .152E’
Fasting Glucose(mg/dL)
SystolicBloodPressure(mmHg)
ExerciseDuration(sec)
BMI(kg/m2)
Inversely related variables with statistical signif icancePositively related variables with statistical signi ficance
Sheldon E. Litwin, M.D.
Importance of Left Atrial Size
♦Multiple studies show left atrial size to be a very powerful predictor of survival♦Atrial size is thought to be an indicator of
the average filling pressures over time (the “hemoglobin A1C of the heart”)

11
Sheldon E. Litwin, M.D.
Atrial Fibrillation and Obesity
The association between atrial fibrillation and BMI disappeared when LA dimension was put into the multivariate analysis
Sheldon E. Litwin, M.D.
Decreased Left Atrial Volume after GBS
5455565758596061626364
Baseline 2 Year
GBSNonsurg
*
Sheldon E. Litwin, M.D.

12
Sheldon E. Litwin, M.D.
Change in weight vs. LV mass: Effects of weight regainde las Fuentes, et al. JACC 2009;54:2376-81
Dietary interventionAverage weight loss 9.9 kg
Diet vs. Surgery?Rider, et al. JACC 2009;54:718-26
Weight loss in diet group = 12 kgWeight loss in surgery group = 33 kg
Sheldon E. Litwin, M.D.
SOS 10 year data: Banding vs. GBS
Sheldon E. Litwin, M.D.
Predicted change in CV risk♦Obesity associated with unfavorable CV risk
factors♦ Favorable changes in BP, lipids, glucose
homeostasis after surgery♦Meta-analysis of 6 studies reporting changes
in CV risk factors after bariatric surgery♦ 10 year Framingham or PROCAM risk
calculated from 7% to 3.5% and 4.1% to 2%, respectively (RR reduction 18-79%)– Batsis et al, Am J Cardiol 2008;102:930-937

13
Sheldon E. Litwin, M.D.
Can weight loss slow or reverse the progression of CAD?
Sheldon E. Litwin, M.D.
Coronary CalciumCACS = 285 CACS > 4000
Sheldon E. Litwin, M.D.
Obesity and the presence or progression of coronary calcification
♦Dallas Heart Study (JACC 2007;50:752)
♦ CAC prevalence significantly greater in 5th vs. 1st quintile of BMI, but increased stepwise across quintiles of waist circumference and waist/hip♦ WHR independ predictor
after adjustment for standard risk factors
♦MESA (Circ 2007;115:2722)
♦ Risk factors for progression of CAC♦ Newly detectable CAC
6% per yr♦ With existing CAC,
median annual change 14-21 Agatston units♦ BMI mild, but signif
predictor of progression♦ Diabetes strongest
predictor of progression

14
Sheldon E. Litwin, M.D.
CAC Progression and risk of MI
Raggi, ATVB, 2007;24:1272
Sheldon E. Litwin, M.D.
Can GBS slow progression of CAD?
• Subjects returning for 5 year follow up offered coronary calcium scanning
• IRB approved, signed consent form• Enrolled 136 consecutive subjects
• CAC score• Single abdominal slice at L4 to determine visceral
adipose tissue volume
Sheldon E. Litwin, M.D.
Results of CAC Substudy
GBS group No surgery
P value
N=61 N=72
Weight change (pounds) -93 +0.3 <0.01
Visceral adipose tissue (mL): mean ± SD
55 ± 39 143± 63 <0.01
Systolic BP change (mmHg) -4.6 -6.6 NS
LDL cholesterol change (mg/dL) -7.8 4.0 0.04
Glucose change -18 -11 NS

15
Sheldon E. Litwin, M.D.
Results of CAC SubstudyGBS No surgery P
value
n=61 n=72
CAC score: mean ± SD (range)
33 ± 114 (0-645)
107 ± 340 (0-2517) <0.01
CAC score: zero 67% (n=41) 43% (n=31)
<0.01CAC score: 1-10 16% (n=10) 22% (n=16)
CAC score: 11-100 10% (n=7) 18% (n=13)
CAC score: >100 7% (n=4) 17% (n=12)
•GBS patients more likely to have zero CAC; OR = 2.3, p=0.04•Independent of gender, age, smoking, systolic BP, a nd LDL cholesterol
Sheldon E. Litwin, M.D.
Limitations
• No baseline CAC score• Risk factors for cardiovascular disease similar at
baseline
• Non surgical patients had no weight loss• Would diet induced weight loss be the same or
better?
• Few “hard end-points” so far• Don’t know if lower CAC scores translates into lowe r
CV events
Sheldon E. Litwin, M.D.
Conclusions
• Severely obese with GBS surgery• Lower CAC than obese without surgery• More likely to have zero CAC
• GBS may slow progression of coronary atherosclerosis, at least partially independent of traditional risk factors
• Long follow up in our study (5 years) and Women’s Health Initiative (7 years) may explain the ability to detect slowing of CAC progression

16
Sheldon E. Litwin, M.D.
Conclusions
♦Should we offer GBS more liberally?– Less severe obesity– Younger ages
♦Is GBS cost-effective?♦Proof that surgically-induced weight loss
reduces cardiovascular events– MI/ACS– Atrial fibrillation, other arrythmias– CHF
Does Obesity Affect Response to Treatment in Acute Decompensated Heart
Failure?: A Diuretic Optimization Strategies Evaluation (DOSE) Trial Substudy
Achal Gupta, Josef Stehlik, Steven McNulty, Kerry M . Lee, Edward M. Gilbert, Feras M. Bader, Kevin Anstrom, Deborah Budge, Abdallah G. Kfoury, Rami Alharethi, David A. Bull, Margaret M. Redield, G. Michael Felk er, Divya R. Verma, Stavros G. Drakos, Theophilus E. Ow an, Christopher M. O’Connor and Sheldon E. Litwin
• Obesity might affect diuretic responsiveness:- pharmacokinetics- risk of chronic kidney disease- � intra-abdominal pressure �� renal perfusion
• Diuretic Optimization Strategies Evaluation (DOSE) study- randomized 308 pts with acute HF to low (1.0 x dail y oral dose) vs. high (2.5 x daily oral dose) intensi fication intravenous diuretic therapy - mean BMI = 33.6.
Post Hoc analysis splitting patients by enrollment BMI < 30 or ≥ 30 kg/m 2
Background

17
Sheldon E. Litwin, M.D.
Results: Patient Characteristics♦ Obese and non-obese patients had similar gender
distribution, etiology of HF, qualifying furosemide dosage, number of HF hospitalizations in the past 12 months, history of atrial fibrillation and basel ine serum creatinine.
BMI≤30 (N=119) BMI>30 (N=173) P-Value
Age 69.7±13.1 64.3±13.5 <0.001
LVEF (%) 32.5±16.7 36.6±17.9 0.029
Diabetes Mellitus 38% 61% <0.001
Systolic BP (mm Hg) 114±17 121±21 0.004
NT Pro-BNP (pg/mL) 10,135±7898 5,630±6479 <0.001
Results: Primary & Secondary Endpoints
BMI≤30 (N=119)
BMI>30 (N=173)
P-Value
Global assessment of symptoms Visual analog scale(VAS) area under the curve ( AUC) (72 hrs)
4180±1452 4329±1417 0.666
Free from congestion at 72 hrs (%) 14.0±16 14.2±24 0.969
Fluid loss at 72 hrs (mL) 3654±3036 4631±3184 0.019
NT Pro-BNP, change at 72hrs (pg/mL)
-2165±4665 -1153±3731 0.825
Serum creatinine (mg/dL)- change at at 72 hrs- change at 60 days
-0.00±0.280.05±0.41
0.09±0.310.11±0.45
0.0060.368
Worsening Renal Function (Cr � > 0.3 mg/dl)
- at 72 hrs- 60 days
13%22%
22%22%
0.0640.934
Sheldon E. Litwin, M.D.
Fluid Loss
Low Intensification Strategy
High Intensification Strategy
P-Value
BMI≤30(N=61) (N=58)
0.018Fluid loss (ml, 72 hrs) 2945±2268 4409±3555
BMI>30(N=83) (N=90)
0.014Fluid loss (ml, 72 hrs) 3962±2726 5272±3467

18
Worsening Renal Function
024681012141618
24 48 72
Worse
ning r
enal
functi
on (%
)
Hours from randomization
High intensification strategy
024681012141618
24 48 72
Worse
ning r
enal
functi
on (%
)
Hours from randomization
Low intensification strategy
Non obese (BMI <=30)Obese (BMI > 30)
Sheldon E. Litwin, M.D.
Time to First Event: Death, Re-hospitalization, ER Visit
Sheldon E. Litwin, M.D.
Conclusions
♦High intensification intravenous diuretic treatment in obese patients produces greater volume loss without additional detrimental effect on renal function. This strategy may be preferable as initial approach in the growing population of obese patients with heart failure.
♦ Additional study specifically targeted to treatment of obese subjects with HF is warranted
19
Sheldon E. Litwin, M.D.
Obesity and the heart
♦Increased CV morbidity and mortality– CHF, AF, CAD, stroke, sudden death
♦Weight loss reverses risk factors– LVH, LAE, CV risk factors (BP, glucose,
lipids)
♦Possible slowing of atherosclerosis♦First data suggesting treatment
strategies based on adiposity
Sheldon E. Litwin, M.D.
Thank YouSteve HuntTed AdamsSara Frogley
Russel VinickNathan WannerMike StrongRobert Pendleton
Theophilus OwanTravis AultTiffany PriesterRonny Jiji Nathaniel HallZachary Williams Kimberly Morley
Tom ClowardTom NuttallJim WalkerFrank Yanowitz
Sonographers & Staff at Univ of Utah Echo lab
Erick AvelarNate SegersonBrigham SmithKevin PreeceLillian KhorDivya KapoorJames Gallagher
Josef StehlikAchal GuptaDOSE investigators
Sheldon E. Litwin, M.D.
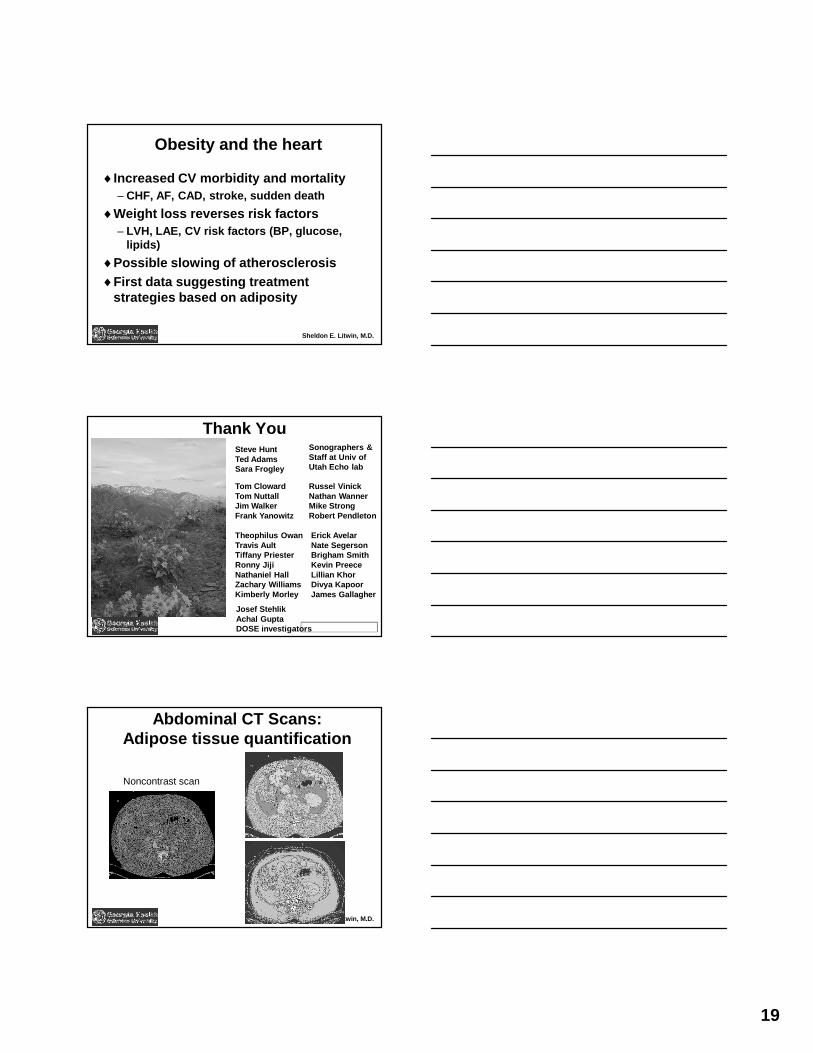
Abdominal CT Scans:Adipose tissue quantification
Noncontrast scan
Nonsurgery Subjects

20
Sheldon E. Litwin, M.D.
Noncontrast Heart CTNonsurgery Subject Surgery Subject
4 Ch
SAX
4 Ch
SAX
Sheldon E. Litwin, M.D.
Epicardial Fat: New risk factor?
♦ Visceral fat believed to contribute directly to met abolic syndrome (insulin resistance)♦ Epicardial fat suggested to behave similarly and th us increase
risk of CAD (produces inflammatory cytokines)♦ At 5 year f/u, epicardial fat was lower in GBS vs. Nonsurg subjects
(89 cc vs. 150 cc, p < 0.05).♦ Correlation between visceral and epicardial fat (ov erall r = 0.8, p <
0.001; GBS r = 0.71, Nonsurg r = 0.72)♦ Epicardial fat correlates w BMI (r = 0.63) & waist circumference (r
= 0.69)♦ Epicardial fat volume not different in those with z ero CAC vs.
those with > zero CACS (113 cc vs. 155 cc Nonsurg) ♦ Conclusions: Visceral fat declines more than epicar dial fat after
GBS. Epicardial fat volume is related to BMI, waist circumference and visceral fat. However, no clear link between ep icardial fat and coronary calcification was found.
Sheldon E. Litwin, M.D.
Subclinical LV dysfunction in obesity
♦ Several studies showing normal ejection fraction, but decreased midwall fractional shortening, strain and strain rate♦Mechanism is probably increased radial
excursion due to concentric hypertrophy, but reduced longitudinal shortening due to myocyte dysfunction♦Unclear if these abnormalities improve with
weight loss

21
Sheldon E. Litwin, M.D.
Diastole
Myocyte shortening
Systole
Overestimation of Myocardial Function in LVH
Diastole
Nor
mal
LVH
70%
Systole EF
55%
Sheldon E. Litwin, M.D.
Pseudonormal systolic function
Sheldon E. Litwin, M.D.
What is strain?
♦ Regional deformation (shortening or lengthening)– Like fractional shortening of a piece of myocardium
♦ How is it measured?– MRI tissue tagging– Tissue Doppler– Speckle tracking
♦ Regional myocardial function in systole or diastole– Speckle tracking not sensitive to transducer positi on or
angulation– Not affected by translation, tethering or function of adjacent
segments
♦ Can assess longitudinal, radial or circumferential deformation, movement and velocity

22
Sheldon E. Litwin, M.D.
Speckle Tracking
Unique patterns (“fingerprints”) in the myocardium created by myofibers and backscatter
Sheldon E. Litwin, M.D.
Velocity Vector Imaging™
Sheldon E. Litwin, M.D.
Normal Strain
23
Sheldon E. Litwin, M.D.
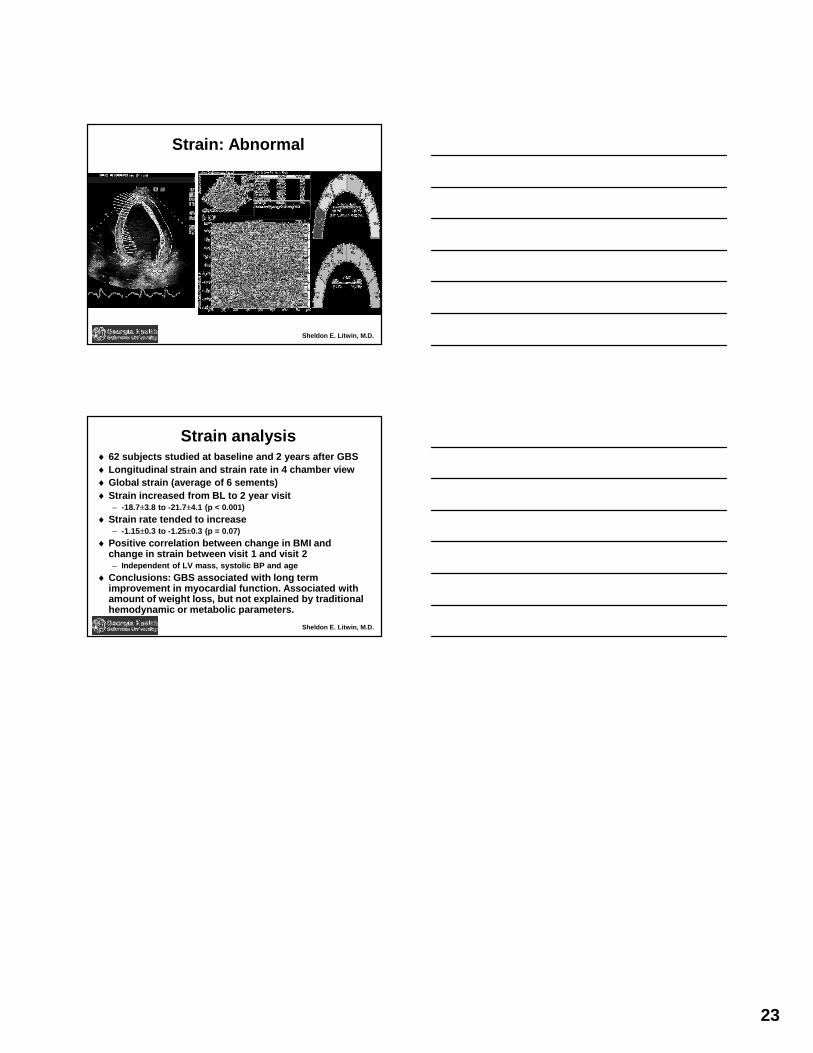
Strain: Abnormal
Sheldon E. Litwin, M.D.
Strain analysis♦ 62 subjects studied at baseline and 2 years after G BS♦ Longitudinal strain and strain rate in 4 chamber vi ew♦ Global strain (average of 6 sements)♦ Strain increased from BL to 2 year visit
– -18.7±3.8 to -21.7±4.1 (p < 0.001)
♦ Strain rate tended to increase– -1.15±0.3 to -1.25±0.3 (p = 0.07)
♦ Positive correlation between change in BMI and change in strain between visit 1 and visit 2– Independent of LV mass, systolic BP and age
♦ Conclusions: GBS associated with long term improvement in myocardial function. Associated with amount of weight loss, but not explained by traditi onal hemodynamic or metabolic parameters.