shear wave velocity as a key parameter that steers … wave velocity as a key parameter that steers...
TRANSCRIPT
8th
International Congress of Croatian Society of Mechanics
29 September – 2 October 2015
Opatija, Croatia
Shear Wave Velocity as a Key Parameter that
Steers Seismic Structural Design
Ivan KRAUS*, Damir DŽAKIĆ
+, Jovan Br. PAPIĆ
#
*Faculty of Civil Engineering Osijek, Crkvena 21, 31000 Osijek, Croatia
E-mails: [email protected]
+Projekt konstrukcija F.I. d.o.o., VI. Južna obala 15, Zagreb, Croatia
E-mail: [email protected]
#Faculty of Civil Engineering, Partizanski odredi 24, 1000 Skopje, Macedonia
E-mail: [email protected]
Abstract. Seismic design of safe and economically justified structures is a
multidisciplinary and challenging task. Due to complexity in modelling and high
computational cost, soil is usually modelled using discrete impedance functions. On
the other end, many code-based methods for design of earthquake resistant
structures introduce the response spectrum (RS). Albeit both impedance and RS
functions may govern design of e.g. nuclear facilities or hospital buildings, they
seldom recognize stress induced from structure to foundation soil. This paper shows
how this stress change the shear wave velocity distribution within foundation soil, a
major soil property that steers the selection and shape of the mentioned functions
and thus redirect structural design. A study was conducted: on a set of real soil
profiles collected by the authors; for both low and high structural loading and by
using different methods for correction of free-field measurements of shear wave
velocity within a soil profile to account for the overburden pressure.
1 Motivation
Seismic design of safe and economically justified structures is a multidisciplinary
and challenging task. Most of its complexity lies in soil, an infinite medium that
provides support for structures but also hazard entrenched in ground motions. Due to the
complexity in modeling and high computational cost, soil is usually modeled using
2
discrete impedance functions [1]. On the other end, today many different code-based
methods for the design of earthquake resistant structures exist [1]: equivalent lateral
force method, modal response spectrum analysis and nonlinear static pushover method,
among others. All the mentioned methods introduce response spectrum (RS) and are
widely used in structural design.
Albeit both impedance and RS functions may govern design of important structures
(e.g. nuclear facilities or hospitals) they rarely recognize stress induced from structure to
foundation soil. Indeed, this stress is of major importance here as it may change the
shear wave velocity distribution within foundation soil, a major soil property that steers
the both selection of RS and shape of impedance functions.
Within the seismic design of structures foundation soil is generally described by the
average shear wave velocity in the upper 30 m of the soil profile with free-field
conditions vs,30 (e.g. [1] – [9]). In this light, soils classified within norms (e.g. [3], [6],
[10], [11]) are defined according to the distribution of shear waves within the first 30 m
of the foundation soil profile since this depth represents a typical drilling depth for the
purposes of sampling and determination of soil characteristics (e.g. [7], [12], [13]). The
first 30 m depth description of soil conditions has been defined by Borcherdt in 1994
[5]. Nevertheless, it is clear that the parameter vs,30 is one of the key parameters in code
based design that govern earthquake loading on structures.
Engineering practice often assumes that foundation soils within a coded soil type
respond similarly to a particular earthquake. On the other end, it is well known that even
soils with the same value of shear wave velocity within the upper 30 m do not always
have the same fundamental period of vibration [1], as it is a function of deeper soil
layers [13], [14]. This is important to bear in mind as the fundamental period of
vibration of soil may be a strong indicator of the predominant earthquake period, and
thus strong indicator of the frequency content of an earthquake (e.g. [15] – [17]).
Moreover, it is also clear that building activities may alter soil conditions, which in turn
may lead to input motions that differ from the design motions used in structural analysis
[18]. Structural analyses are mainly conducted using the earthquake records obtained in
free-field conditions.
This paper shows how the presence of additional weight from a structure may
influence shear wave velocity distribution within a foundation soil profile and thus
redirect structural design. A study was conducted: on a set of real soil profiles collected
by the authors; for both low and high structural loading and by using different methods
for correction of shear wave velocity profiles to account for the overburden pressure.
2 Calculation of average shear wave velocity of a soil profile
Average shear wave velocity within the upper 30 m of a soil profile may be
determined by the following expression (e.g. [3], [7], [9], [11]):
Ni is
i
s
v
hv
,1 ,
30,
30
(1)
where hi is thickness of the i-th layer of a deposit, vs,i shear wave velocity at a shear
strain level of 10-5
or less of the i-th layer of a deposit, in a total of N layers within the
3
upper 30 m of a deposit. Also, in literature (e.g. [5], [7]) the following expression for the
estimation of the average shear wave velocity in seismically active regions may be
found:
Ni is
i
Ni
i
s
v
h
h
v
,1 ,
,1
30,
(2)
It is clear that the parameter vs,30 significantly lacks information when compared to
the whole shear wave velocity profile. This is also stressed by other researchers (e.g. [2],
[19], [20]). In this light, recent studies (e.g. [7], [19]) have shown that the shear wave
velocities can considerably differ with the depth of a profile, even when the values of
vs,30 are similar. Moreover, these studies suggest that the velocity profiles cannot be
sufficiently described if only upper 30 m of the foundation soil are observed, but also
that the parameter vs,30 is insufficient to describe the soil response. Recent studies
suggested (e.g. [9], [19]) that foundation soils would be better described if profiles up to
depths where shear wave velocity reach 800 m/s are known. But such profiles may reach
great depths. Obviously, it is always preferable to use the entire shear wave velocity
profile in analyses, yet this is often impossible due to economical reasons.
3 Effect of vertical pressure from structure on shear wave velocity distribution
in soil
American guidelines for design of earthquake resistant structures [22] stress that the
classification of soil types with regard to the shear wave velocity distribution within the
upper 30 m of deposit is justified for analysis of shallow founded structures.
Additionally, National Institute of Standards and Technology (NIST) [18] recommends
that the shear wave velocity should be calculated for conditions when the soil is loaded
by a structure, using the following expression:
2/
,'
'')(
n
v
vv
sFsz
zzzvv
(3)
where vs(z) is shear wave velocity in the free-field at depth z, σ'v(z) effective stress
from the soil self-weight at the depth z, Δσ'v(z) increment of vertical stress due to weight
of the structure at the depth z, n coefficient that varies from approximately 0.5 for
granular soils to 1.0 for cohesive soils. Additional vertical stress in the soil, due to
weight of the structure, has the greatest influence on the distribution of the shear wave
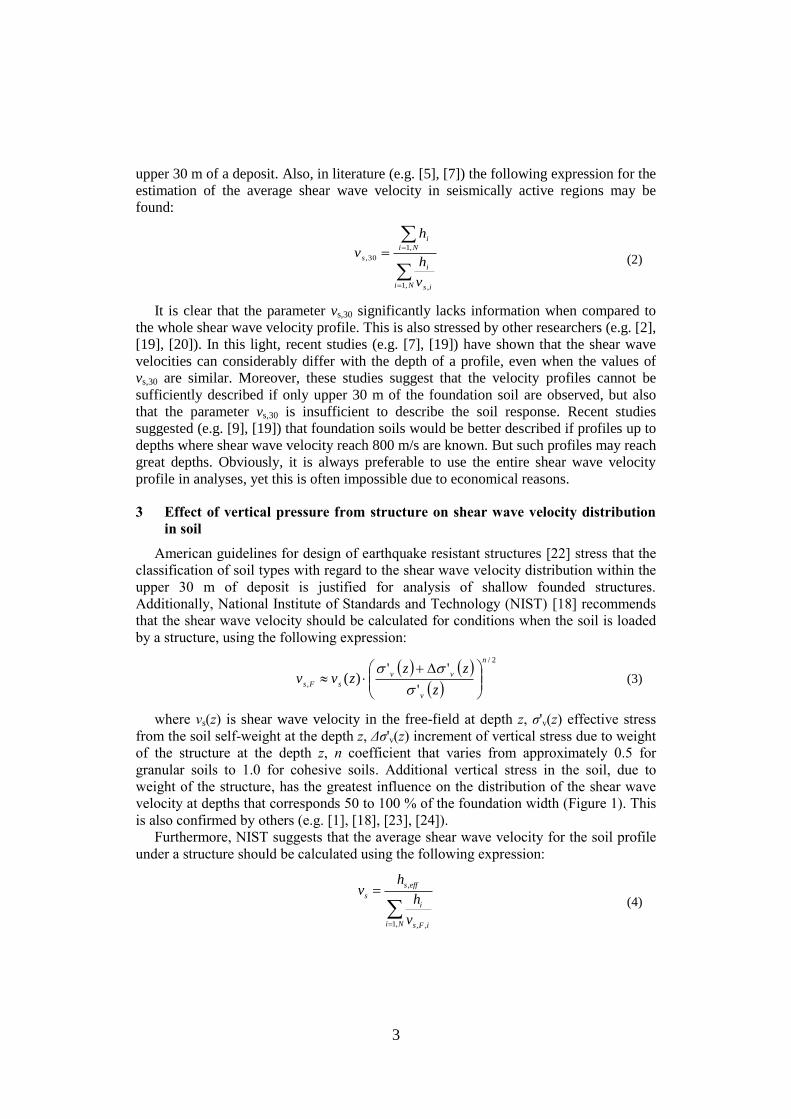
velocity at depths that corresponds 50 to 100 % of the foundation width (Figure 1). This
is also confirmed by others (e.g. [1], [18], [23], [24]).
Furthermore, NIST suggests that the average shear wave velocity for the soil profile
under a structure should be calculated using the following expression:
Ni iFs
i
effs
s
v
h
hv
,1 ,,
, (4)
4
where hs,eff is effective depth of the soil profile affected by weight of the structure, hi,eff
thickness of the i-th layer within the effective depth of the soil, vs,F,i effective value of a
shear wave velocity for the i-th layer of the soil under the structure. This approach is
assumed to be valid for structures with rigid foundations [18].
Figure 1: Stress bulb in soil under the foundation [24] (edited by the authors)
The effective vertical stress in the soil due to self-weight may be estimated using the
following expression [24]:
zgz
wv ' (5)
where ρ is soil mass density, ρw water mass density, g gravitational acceleration, z
observed depth in soil profile. In the case of dry soils, water density in expression (5)
should be ignored.
3.1 Boussinesq method
When the foundation soil is loaded with rectangular or square foundation, additional
vertical stress in the soil profile under the middle of the foundation may be estimated
using the Boussinesq solution for distribution of stresses, using the following expression
[25]:
222
1
222
22
22 1sin
1
21
1
2'
nnm
m
nmn
nm
nm
nmqz
v
(6)
where q is uniform vertical load per unit area, and m and n are parameters that take into
account the foundation geometry and observed depth in the foundation soil. The two
parameters can be calculated by using following expressions:
5
f
f
B
Lm (7)
fB
zn (8)
where Lf and Bf are half-length and half-width of the foundation respectively, z observed
depth in the foundation soil, measured from the ground surface. For practical reasons,
the calculation of additional stresses within the soil, using the expression (6) will be
referred to as them-n method further in this paper.
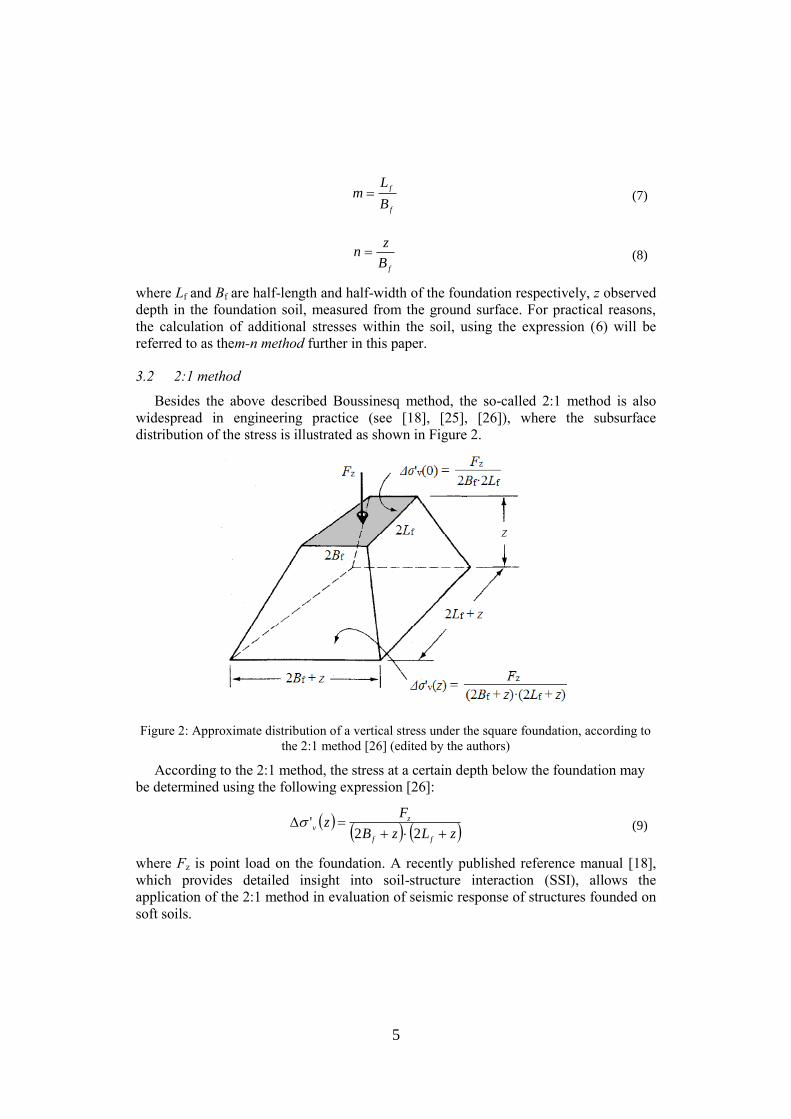
3.2 2:1 method
Besides the above described Boussinesq method, the so-called 2:1 method is also
widespread in engineering practice (see [18], [25], [26]), where the subsurface
distribution of the stress is illustrated as shown in Figure 2.
Figure 2: Approximate distribution of a vertical stress under the square foundation, according to
the 2:1 method [26] (edited by the authors)
According to the 2:1 method, the stress at a certain depth below the foundation may
be determined using the following expression [26]:
zLzB
Fz
ff
z
v
22
' (9)
where Fz is point load on the foundation. A recently published reference manual [18],
which provides detailed insight into soil-structure interaction (SSI), allows the
application of the 2:1 method in evaluation of seismic response of structures founded on
soft soils.
6
4 Study environment: selected soil profiles and structures
To demonstrate how the vertical loading from a structure affects the shear wave
velocity distribution in soil the two above described methods are applied on ten real,
randomly selected and well explored soil profiles from Croatia, Romania, Montenegro
and Greece. A reference list for the used soil profiles is given in Table 1.
Table 1: Description and references for soil profiles observed in this study
Profile No. City Country Source
1 Bar Montenegro [31]
2 Bucharest Romania [32]
3 Lefkada Greece [32]
4 Osijek Croatia [1]
5 Osijek Croatia [1] 6 Ploče Croatia [1] 7 Sirova Katalena Croatia [1] 8 Sisak Croatia [1] 9 Thessaloniki Greece [32]
10 Ulcinj Montenegro [31]
Every soil profile noted in Table 1 has been associated with a corresponding soil
class as defined in Eurocode [3]. For the observed soil profiles it is assumed that the
water table is very deep. Following the definition provided in Eurocode [3], soil class A
include profiles whose average shear wave velocity exceeds 800 m/s, while the soil class
B is characterised by the average shear wave velocities that range from 360 to 800 m/s.
Soil class C includes profiles with average shear velocities between 180 and 360 m/s,
while the upper limit of average shear velocity for soil class D corresponds to 180 m/s.
Soil class E includes profiles from soil classes C and D but where the bedrock is located
at a depth of 20 m below the ground surface. Apart from the soil classes mentioned here
two special soil classes exist [3], but are not described here due to brevity.
A short study was conducted based on the assumption that a light (q = 100 kPa) and
heavy (q = 300 kPa) structure will be founded on the soil profile. Selection of the light
and heavy structures was done in line with studies carried out by well-known research
teams [27] – [30]. The structure is assumed to be regular and shallow founded on a
square foundation with side lengths of 20. The foundation length of 20 m corresponds to
the maximum depth considered for the soil class E defined in Eurocode [3].
5 Results and discussion
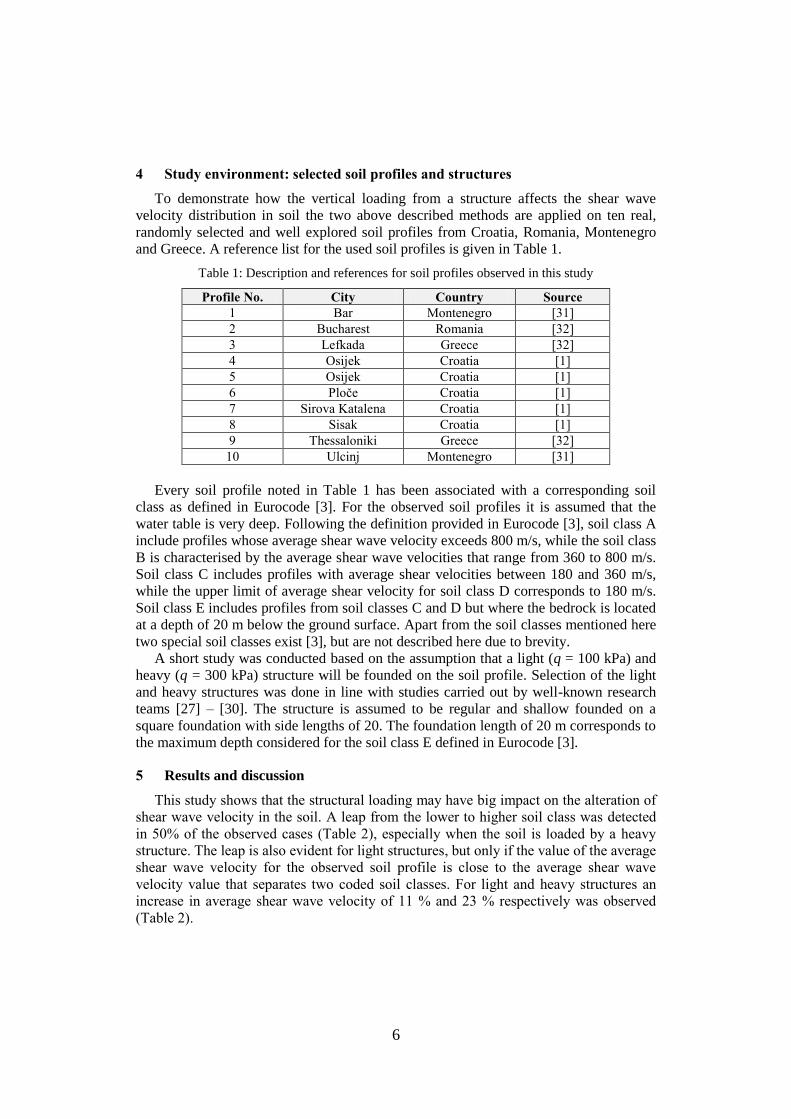
This study shows that the structural loading may have big impact on the alteration of
shear wave velocity in the soil. A leap from the lower to higher soil class was detected
in 50% of the observed cases (Table 2), especially when the soil is loaded by a heavy
structure. The leap is also evident for light structures, but only if the value of the average
shear wave velocity for the observed soil profile is close to the average shear wave
velocity value that separates two coded soil classes. For light and heavy structures an
increase in average shear wave velocity of 11 % and 23 % respectively was observed
(Table 2).
7
Table 2: Soil profiles observed in this study described by the average shear wave velocity for the
first 30 m of deposit in free-field and when loaded by a structure
Profile
No. City
Soil class according to [3]
(vs,30 in m/s)
Free-field m-n method 2:1 method
100 kPa 300 kPa 100 kPa 300 kPa
1 Bar B
(459)
B
(508)
B
(568)
B
(498)
B
(545)
2 Bucharest D
(165)
C
(181)
C
(203)
D
(178)
C
(195)
3 Lefkada C
(325)
B
(365)
B
(414)
C
(357)
B
(397)
4 Osijek C
(230)
C
(266)
C
(304)
C
(258)
C
(290)
5 Osijek D
(172)
C
(200)
C
(231)
C
(194)
C
(219)
6 Ploče D
(154)
C
(182)
C
(210)
D
(177)
C
(200)
7 Sirova
Katalena
C
(349)
B
(410)
B
(475)
B
(401)
B
(455)
8 Sisak C
(235)
C
(280)
C
(326)
C
(271)
C
(309)
9 Thessaloniki C
(288)
C
(319)
C
(355)
C
(313)
C
(342)
10 Ulcinj B
(400)
B
(438)
B
(483)
B
(431)
B
(467)
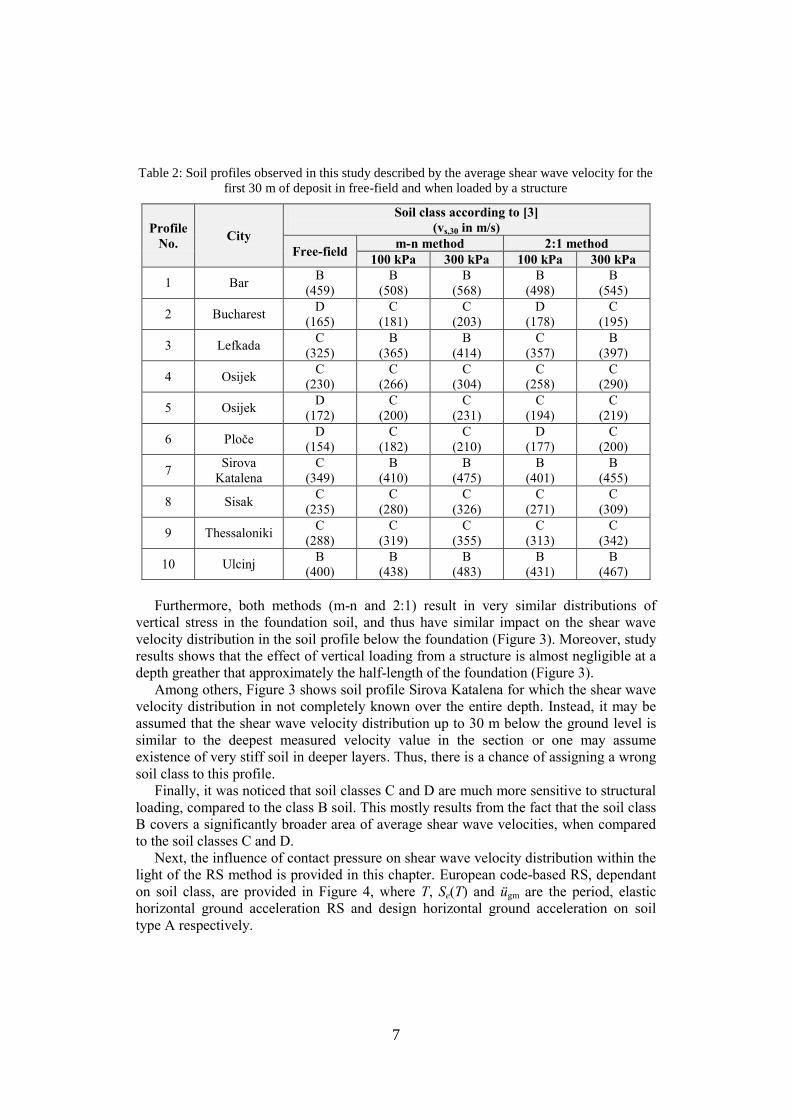
Furthermore, both methods (m-n and 2:1) result in very similar distributions of
vertical stress in the foundation soil, and thus have similar impact on the shear wave
velocity distribution in the soil profile below the foundation (Figure 3). Moreover, study
results shows that the effect of vertical loading from a structure is almost negligible at a
depth greather that approximately the half-length of the foundation (Figure 3).
Among others, Figure 3 shows soil profile Sirova Katalena for which the shear wave
velocity distribution in not completely known over the entire depth. Instead, it may be
assumed that the shear wave velocity distribution up to 30 m below the ground level is
similar to the deepest measured velocity value in the section or one may assume
existence of very stiff soil in deeper layers. Thus, there is a chance of assigning a wrong
soil class to this profile.
Finally, it was noticed that soil classes C and D are much more sensitive to structural
loading, compared to the class B soil. This mostly results from the fact that the soil class
B covers a significantly broader area of average shear wave velocities, when compared
to the soil classes C and D.
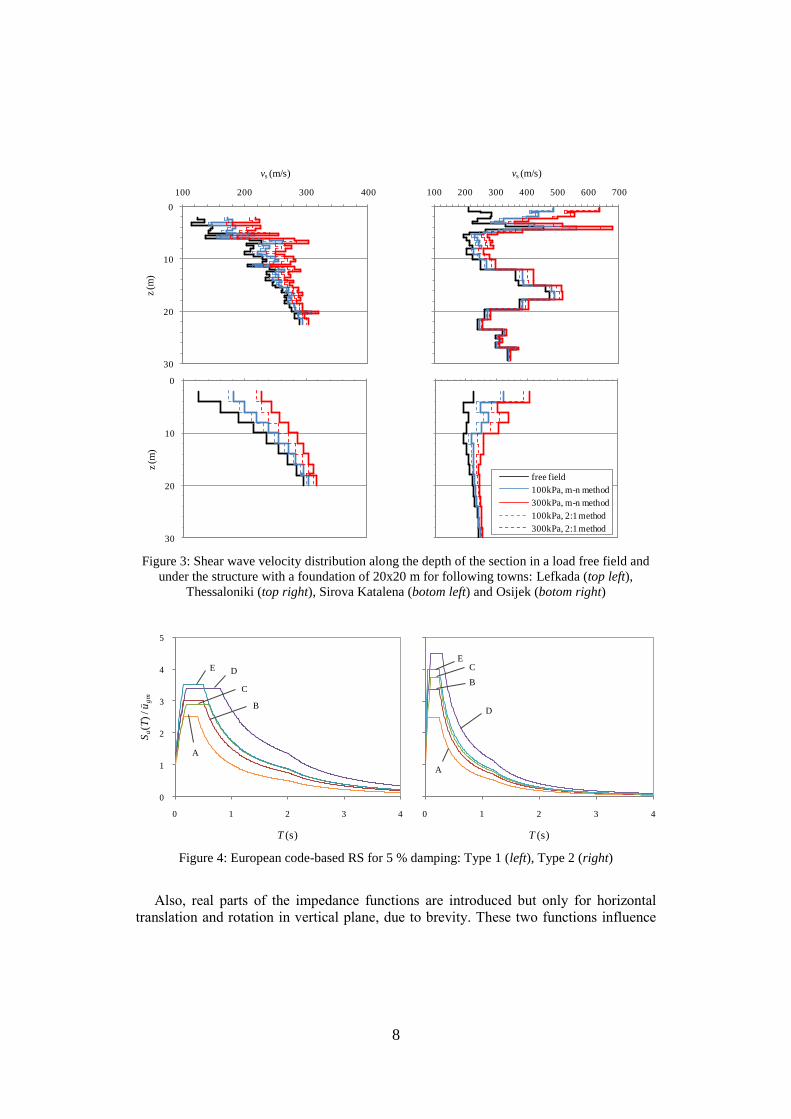
Next, the influence of contact pressure on shear wave velocity distribution within the
light of the RS method is provided in this chapter. European code-based RS, dependant
on soil class, are provided in Figure 4, where T, Se(T) and ügm are the period, elastic
horizontal ground acceleration RS and design horizontal ground acceleration on soil
type A respectively.
8
0
10
20
30
100 200 300 400
z (m
)
vs (m/s)
0
10
20
30
100 200 300 400 500 600 700
z (m
)
vs (m/s)
0
10
20
30
100 200 300 400
z(m
)
vs (m/s)
0
10
20
30
100 200 300 400 500 600 700
z (m
)
vs (m/s)
free field
100kPa, m-n method
300kPa, m-n method
100kPa, 2:1 method
300kPa, 2:1 method
Figure 3: Shear wave velocity distribution along the depth of the section in a load free field and
under the structure with a foundation of 20x20 m for following towns: Lefkada (top left),
Thessaloniki (top right), Sirova Katalena (botom left) and Osijek (botom right)
0
1
2
3
4
5
0 1 2 3 4
Sa(T
) / ü
gm
T (s)
A
D
C
B
E
0
1
2
3
4
5
0 1 2 3 4
Sa(T
) / ü
gm
T (s)
A
D
EC
B
Figure 4: European code-based RS for 5 % damping: Type 1 (left), Type 2 (right)
Also, real parts of the impedance functions are introduced but only for horizontal
translation and rotation in vertical plane, due to brevity. These two functions influence
9
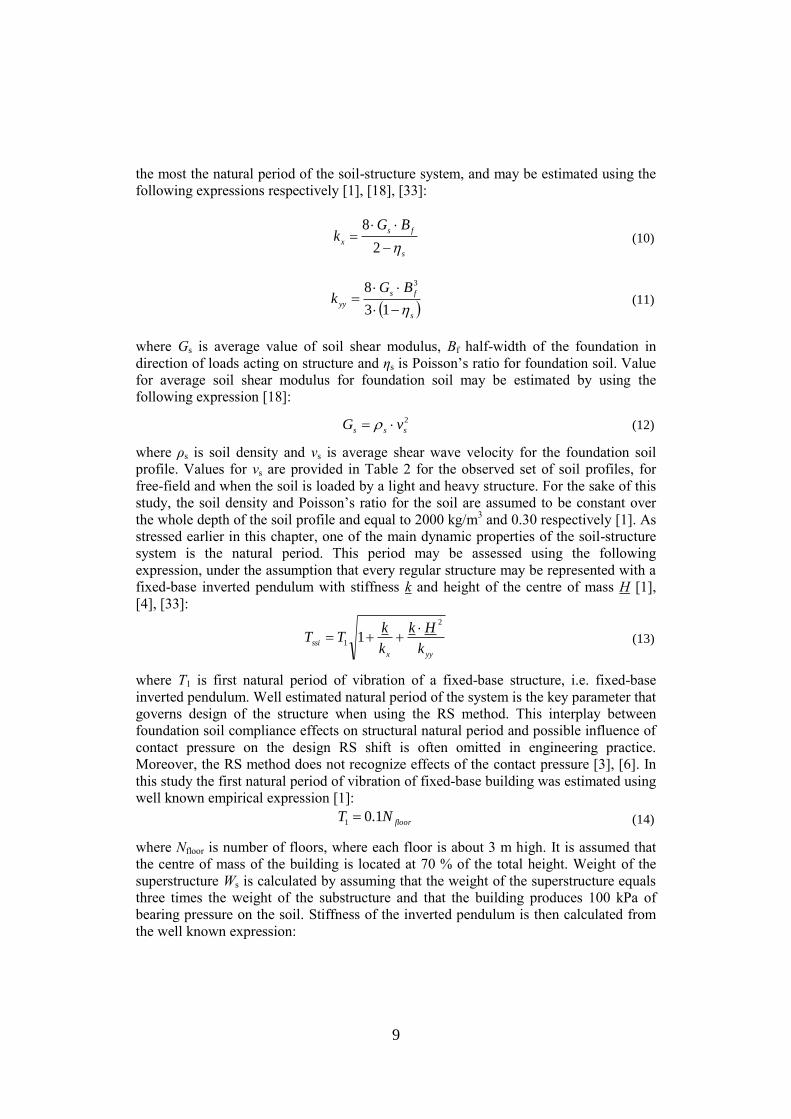
the most the natural period of the soil-structure system, and may be estimated using the
following expressions respectively [1], [18], [33]:
s
fs
x
BGk
2
8 (10)
s
fs
yy
BGk
13
8 3
(11)
where Gs is average value of soil shear modulus, Bf half-width of the foundation in
direction of loads acting on structure and ηs is Poisson’s ratio for foundation soil. Value
for average soil shear modulus for foundation soil may be estimated by using the
following expression [18]:
2
sssvG (12)
where ρs is soil density and vs is average shear wave velocity for the foundation soil
profile. Values for vs are provided in Table 2 for the observed set of soil profiles, for
free-field and when the soil is loaded by a light and heavy structure. For the sake of this
study, the soil density and Poisson’s ratio for the soil are assumed to be constant over
the whole depth of the soil profile and equal to 2000 kg/m3 and 0.30 respectively [1]. As
stressed earlier in this chapter, one of the main dynamic properties of the soil-structure
system is the natural period. This period may be assessed using the following
expression, under the assumption that every regular structure may be represented with a
fixed-base inverted pendulum with stiffness k and height of the centre of mass H [1],
[4], [33]:
yyx
ssik
Hk
k
kTT
2
11
(13)
where T1 is first natural period of vibration of a fixed-base structure, i.e. fixed-base
inverted pendulum. Well estimated natural period of the system is the key parameter that
governs design of the structure when using the RS method. This interplay between
foundation soil compliance effects on structural natural period and possible influence of
contact pressure on the design RS shift is often omitted in engineering practice.
Moreover, the RS method does not recognize effects of the contact pressure [3], [6]. In
this study the first natural period of vibration of fixed-base building was estimated using
well known empirical expression [1]:
floorNT 1.0
1 (14)
where Nfloor is number of floors, where each floor is about 3 m high. It is assumed that
the centre of mass of the building is located at 70 % of the total height. Weight of the
superstructure Ws is calculated by assuming that the weight of the superstructure equals
three times the weight of the substructure and that the building produces 100 kPa of
bearing pressure on the soil. Stiffness of the inverted pendulum is then calculated from
the well known expression:
10
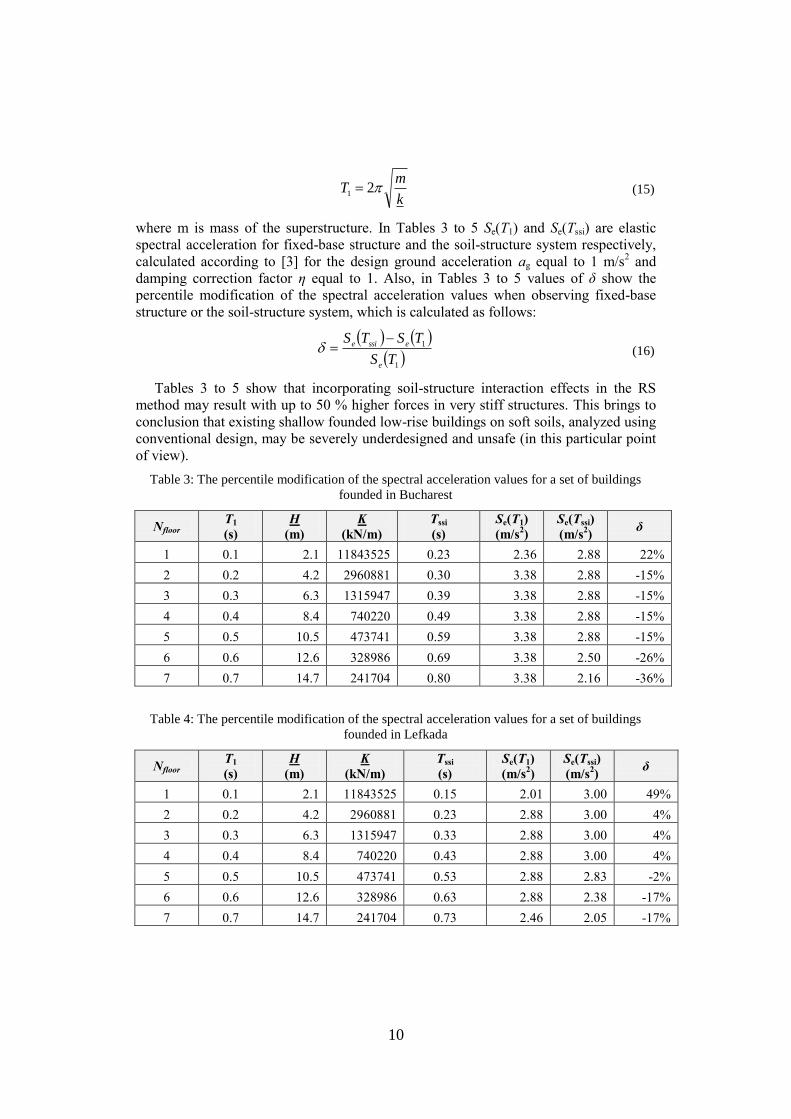
k
mT 2
1 (15)
where m is mass of the superstructure. In Tables 3 to 5 Se(T1) and Se(Tssi) are elastic
spectral acceleration for fixed-base structure and the soil-structure system respectively,
calculated according to [3] for the design ground acceleration ag equal to 1 m/s2 and
damping correction factor η equal to 1. Also, in Tables 3 to 5 values of δ show the
percentile modification of the spectral acceleration values when observing fixed-base
structure or the soil-structure system, which is calculated as follows:
1
1
TS
TSTS
e
essie
(16)
Tables 3 to 5 show that incorporating soil-structure interaction effects in the RS
method may result with up to 50 % higher forces in very stiff structures. This brings to
conclusion that existing shallow founded low-rise buildings on soft soils, analyzed using
conventional design, may be severely underdesigned and unsafe (in this particular point
of view).
Table 3: The percentile modification of the spectral acceleration values for a set of buildings
founded in Bucharest
Nfloor T1
(s)
H
(m)
K
(kN/m)
Tssi
(s)
Se(T1)
(m/s2)
Se(Tssi)
(m/s2)
δ
1 0.1 2.1 11843525 0.23 2.36 2.88 22%
2 0.2 4.2 2960881 0.30 3.38 2.88 -15%
3 0.3 6.3 1315947 0.39 3.38 2.88 -15%
4 0.4 8.4 740220 0.49 3.38 2.88 -15%
5 0.5 10.5 473741 0.59 3.38 2.88 -15%
6 0.6 12.6 328986 0.69 3.38 2.50 -26%
7 0.7 14.7 241704 0.80 3.38 2.16 -36%
Table 4: The percentile modification of the spectral acceleration values for a set of buildings
founded in Lefkada
Nfloor T1
(s)
H
(m)
K
(kN/m)
Tssi
(s)
Se(T1)
(m/s2)
Se(Tssi)
(m/s2)
δ
1 0.1 2.1 11843525 0.15 2.01 3.00 49%
2 0.2 4.2 2960881 0.23 2.88 3.00 4%
3 0.3 6.3 1315947 0.33 2.88 3.00 4%
4 0.4 8.4 740220 0.43 2.88 3.00 4%
5 0.5 10.5 473741 0.53 2.88 2.83 -2%
6 0.6 12.6 328986 0.63 2.88 2.38 -17%
7 0.7 14.7 241704 0.73 2.46 2.05 -17%
11
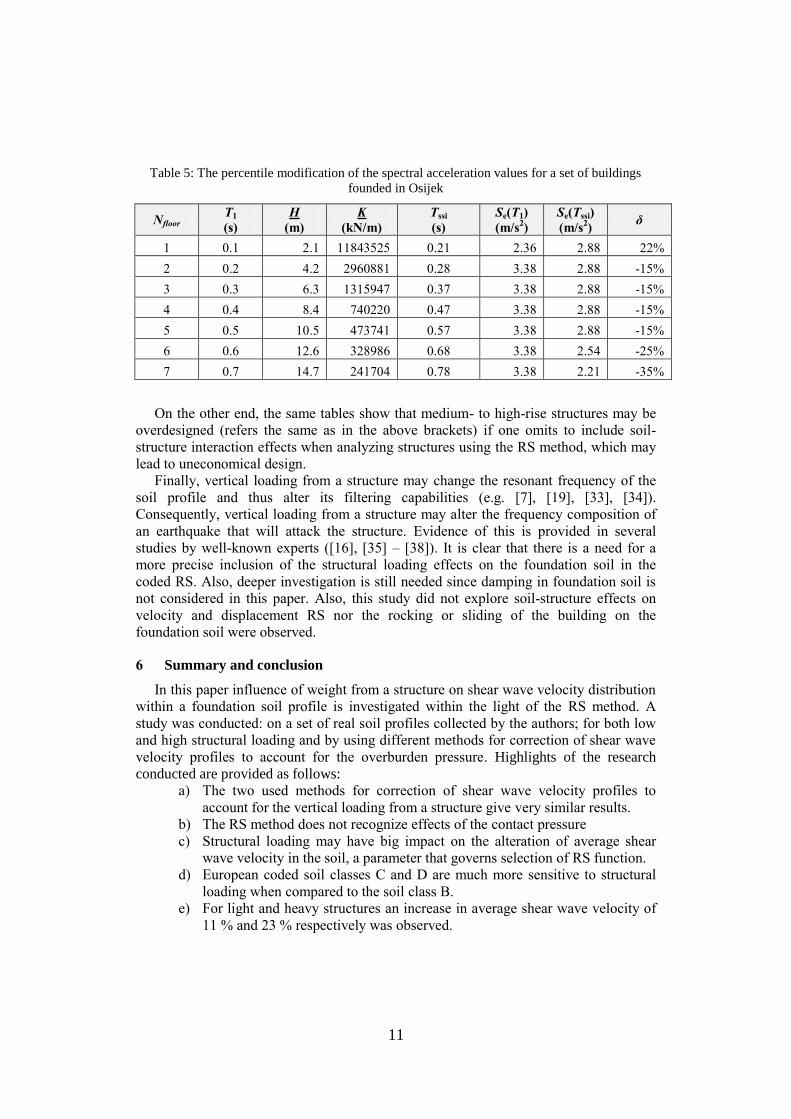
Table 5: The percentile modification of the spectral acceleration values for a set of buildings
founded in Osijek
Nfloor T1
(s)
H
(m)
K
(kN/m)
Tssi
(s)
Se(T1)
(m/s2)
Se(Tssi)
(m/s2)
δ
1 0.1 2.1 11843525 0.21 2.36 2.88 22%
2 0.2 4.2 2960881 0.28 3.38 2.88 -15%
3 0.3 6.3 1315947 0.37 3.38 2.88 -15%
4 0.4 8.4 740220 0.47 3.38 2.88 -15%
5 0.5 10.5 473741 0.57 3.38 2.88 -15%
6 0.6 12.6 328986 0.68 3.38 2.54 -25%
7 0.7 14.7 241704 0.78 3.38 2.21 -35%
On the other end, the same tables show that medium- to high-rise structures may be
overdesigned (refers the same as in the above brackets) if one omits to include soil-
structure interaction effects when analyzing structures using the RS method, which may
lead to uneconomical design.
Finally, vertical loading from a structure may change the resonant frequency of the
soil profile and thus alter its filtering capabilities (e.g. [7], [19], [33], [34]).
Consequently, vertical loading from a structure may alter the frequency composition of
an earthquake that will attack the structure. Evidence of this is provided in several
studies by well-known experts ([16], [35] – [38]). It is clear that there is a need for a
more precise inclusion of the structural loading effects on the foundation soil in the
coded RS. Also, deeper investigation is still needed since damping in foundation soil is
not considered in this paper. Also, this study did not explore soil-structure effects on
velocity and displacement RS nor the rocking or sliding of the building on the
foundation soil were observed.
6 Summary and conclusion
In this paper influence of weight from a structure on shear wave velocity distribution
within a foundation soil profile is investigated within the light of the RS method. A
study was conducted: on a set of real soil profiles collected by the authors; for both low
and high structural loading and by using different methods for correction of shear wave
velocity profiles to account for the overburden pressure. Highlights of the research
conducted are provided as follows:
a) The two used methods for correction of shear wave velocity profiles to
account for the vertical loading from a structure give very similar results.
b) The RS method does not recognize effects of the contact pressure
c) Structural loading may have big impact on the alteration of average shear
wave velocity in the soil, a parameter that governs selection of RS function.
d) European coded soil classes C and D are much more sensitive to structural
loading when compared to the soil class B.
e) For light and heavy structures an increase in average shear wave velocity of
11 % and 23 % respectively was observed.
12
f) Incorporating soil-structure interaction effects in RS method may result with
up to 50 % higher forces in very stiff structures.
g) Medium- to high-rise structures may be overdimensioned if one omits to
include soil-structure interaction effects when conducting analysis by using
the RS method.
h) Vertical loading from a structure may change resonant frequency of the soil
profile and thus it may alter filtering capabilities of the soil.
Further researches in this field will include the structural loading effects on the
foundation soil in the coded response spectra, as well as the damping in the foundation
soil and the SSI effects on velocity and displacement response spectrum. Also rocking
and sliding effects of the building on the foundation soil will be observed.
Acknowledgments
The first author would like to thank Mr. Goran Mitrović from the Geotechnical Department at
the Institut IGH d.d. for providing detailed and well explored soil profiles for this study (referred
and described in [1]). Also, the first author would like to thank to NISEE/PEER Library at the
University of California, Berkeley and the Technical Chamber of Greece Digital Library for
generously providing us with the paper referred here as [31].
References
[1] Kraus, I. Seismic response spectra of shallow founded structures on soft soils. PhD.
University of Osijek, 2014.
[2] Brown, L.T., Diehl, J.G., Nigbor, R.L. A simplified procedure to measure average
shear-wave velocity to a depth of 30 meters (VS30). Proceedings of the 12th World
Conference on Earthquake Engineering, Auckland, New Zealand, 2000.
[3] CEN (ComitéEuropéen de Normalisation). Eurocode 8: Design of structures for
earthquake resistance, Part 1: General rules, seismic actions and rules for buildings,
EN 1998-1. Brussels, Belgium, 2004.
[4] Kraus, I., Knappett, J.A., Morić, D. Seismic behavior of shallow founded inverted
pendulum on soft soil In: P. Ivanyi, ed., Abstracts of the 9th International PhD & DLA
Symposium, 92-92. Pollack Mihaly Faculty of Engineering and Information Technology,
Pecs, 2013.
[5] Borcherdt, R.D. VS30 - A site-characterization parameter for use in building codes,
simplified earthquake resistant design GMPEs, and ShakeMaps. Proceedings of the 15th
World Conference on Earthquake Engineering, Lisbon, Portugal, 2012.
[6] IAEE (International Association for Earthquake Engineering). Regulations for Seismic
Design: A World List, Tokyo, Japan, 2012. Available at: www.iaee.or.jp/worldlist.html
[November 21, 2013]
[7] Lee, S.-H., Sun, C.-G., Yoon, J.-K., Kim, D.-S. Development and Verification of a New
Site Classification System and Site Coefficients for Regions of Shallow Bedrock in
Korea. Journal of Earthquake Engineering, 16: 795-819, 2012.
[8] Trifunac, M.D. Earthquake response spectra for performance based design - A critical
review. Soil Dynamics and Earthquake Engineering, 37: 73-83, 2012.
[9] Pitilakis, K., Riga, E., Anastasiadis, A. Design spectra and amplification factors for
Eurocode 8. Bulletin of Earthquake Engineering, 10: 1377-1400, 2012.
[10] ASCE (American Society of Civil Engineers). Seismic analysis of safety-related nuclear
structures. ASCE/SEI 4-98. American Society of Civil Engineers, Reston, Virginia,
USA, 2000.
13
[11] ASCE (American Society of Civil Engineers). Minimum design loads for buildings and
other structures. ASCE/SEI 7-10. American Society of Civil Engineers, Reston,
Virginia, USA, 2010.
[12] Tang, H.T., Tang, Y.K., Stepp, J.C. Lotung large-scale seismic experiment and soil-
structure interaction method validation. Nuclear Engineering and Design, 123: 397-412,
1990.
[13] Pitilakis, K., Anastasiadis, A., Riga, E. New site classification scheme and associated
site amplification factors. SHARE Deliverable D4.3. 2012. Available at: www.share-
eu.org/node/52 [November 11, 2013]
[14] Pitilakis, K., Gazepis, C., Anastasiadis, A. Design Response Spectra and Soil
Classification for Seismic Code Provisions. Proceedings of the 13th World Conference
on Earthquake Engineering, Vancouver, B.C., Canada, 2004.
[15] Newmark, N.M., Hall, W.J. Seismic design criteria for nuclear reactor facilities.
Proceedings of the 4th World Conference on Earthquake Engineering, Santiago, Chile,
37-50, 1969.
[16] Trifunac, M.D., Ivanović, S.S, Todorovska, M.I. Apparent periods of a building. I:
Fourier Analysis. Journal of Structural Engineering, 127: 517-526, 2001.
[17] Choobbasti, A.J., Rezaei, S., Farrokhzad, F. Evaluation of site response characteristics
using microtremors. Građevinar, 65: 731-741, 2013.
[18] NIST (National Institute of Standards and Technology). Soil-Structure Interaction for
Building Structures, NIST/GCR 12-917-21. Prepared by the NEHRP Consultants Joint
Venture for the National Institute of Standards and Technology, Gaithersburg,
Maryland, USA, 2012. Available at: www.nehrp.gov [February 8, 2013]
[19] Régnier, J. et al. Revisiting Vs30 as a proxy parameter for site effects: a case study
using KiKnet data. Proceedings of 5th International Conference on Earthquake
Geotechnical Engineering (5ICEGE). Santiago, Chile, 800-804, 2011.
[20] Cadet, H., Bard, P.-Y., Duval, A.-M., Bertrand, E. Site effect assessment using KiK-net
data: Part 2. Site amplification prediction equation based on f0 and Vsz. Bulletin of
Earthquake Engineering, 10: 451-489, 2012.
[21] Lee, V.W, Trifunac, M.D. Should average shear-wave velocity in the 30 m of soil be
used to describe seismic amplification? Soil Dynamics and Earthquake Engineering, 30:
1250-1258, 2010.
[22] FEMA (Federal Emergency Management Agency). NEHRP (National Earthquake
Hazards Reduction Program) Recommended Seismic Provisions for New Buildings and
Other Structures. FEMA P-750. Prepared by the Building Seismic Safety Council for
the Federal Emergency Management Agency, Washington, D.C., USA, 2009. Available
at: www.fema.gov [October 22, 2012]
[23] Roje-Bonacci, T. Mehanika tla. 2nd Edition. University of Split, Tiskara Poljica d.o.o.,
Dugi rat, 2003 (in Croatian)
[24] Knappett, J.A., Craig, R.F. Craig's Soil Mechanics. 8th ed. Spon Press, Oxon, UK,
2012.
[25] Das, B.M. Shallow Foundations – Bearing Capacity and Settlement. 2nd ed. CRC Press,
Taylor & Francis Group, Boca Raton, 2009.
[26] Holtz, R.D., Kovacs, W.D. An introduction to geotechnical engineering. Prentice hall,
Englewood Cliffs, New Jersey, USA, 1981.
[27] Zeng, X., Steedman, R.S. Bearing capacity failure of shallow foundations in earthquake.
Géotechnique, 48: 235-256, 1998.
[28] Negro, P., Paolucci, R., Pedretti, S., Faccioli, A. E. Large scale soil-structure interaction
experiments on sands under cyclic loading. Proceedings of the 12th World Conference
on Earthquake Engineering, Auckland, New Zealand, 2000.
14
[29] Paolucci, R. et al. Seismic behaviour of shallow foundations: large scale experiments vs.
numerical modelling and implications for performance based design. In: Proceedings of
the 1st US-Italy seismic bridge workshop, Eucentre, Pavia, Italy, 107-111, 2007.
Available at: http://people.ce.gatech.edu/rd72/italy/index.html [April 1, 2014]
[30] Escoffier, S., Chazelas, J.L. Seismic soil structure interaction: a parametric study on
shallow foundations. In: C. Gaudin and D. White, eds. Proceedings of the 8th
International Conference on Physical Modelling in Geotechnics 2014 (ICPMG2014),
1045-1051, CRC Press, Perth, Australia, 2014.
[31] Talaganov, K., Aleksovski, D., Gadza, V. Analysis of the influence of local soil
conditions upon maximum accelerations based on data from 1979 Montenegro
earthquake. Proceedings of the 7th European Conference on Earthquake Engineering,
Technical Chamber of Greece, Athens, Greece, 2: 423-430, 1982.
[32] Ambraseys, N. et al. Dissemination of European Strong-Motion Data, Volume 2. CD
ROM collection. Engineering and Physical Sciences Research Council, United
Kingdom, 2004.
[33] JSCE (Japan Society of Civil Engineers). Earthquake resistant design codes in Japan.
Maruzen Co., Ltd. International Division, Tokyo, Japan, 2000.
[34] SNZ (Standards New Zealand). Structural design actions, Part 5: Earthquake actions -
New Zealand - Commentary, NZS 1170.5 Supp 1:2004. Wellington, New Zealand, 2004.
[35] Jennings, P.C., Bielak, J. Dynamics of building-soil interaction. Report No. EERL 72-
01. Earthquake Engineering Research Laboratory, California Institute of Technology,
Pasadena, California, USA, 1972.
[36] Poland, C., Soulages, J., Sun, J., Mejia, L. Quantifying the effect of soil-structure
interaction for use in building design. Data Utilization Report CSMIP/00-02(OSMS 00-
04), California Strong Motion Instrumentation Program, California Department of
Conservation, California, USA, 2000.
[37] Finn, W.D.L., Pandey, B.H., Ventura, C.E. Modeling soil-foundation-structure
interaction. The Structural Design of Tall and Special Buildings, 20: 47-62, 2011.
[38] Bech, D. et al. Common structural deficiencies identified in Canterbury buildings and
observed versus predicted performance. Earthquake Spectra, 30: 335-362, 2014.