shear stress partitioning in sparsely vegetated desert canopies
TRANSCRIPT

EARTH SURFACE PROCESSES AND LANDFORMS, VOL. 21,607-619 (1996)
SHEAR STRESS PARTITIONING IN SPARSELY VEGETATED DESERT CANOPIES
S. A. WOLFE
Terrain Sciences Division, Geological Survey of Canada, 5013-51st Street, Yellowknife. NT, Canada X l A IS5
W. G. NICKLING
Department of Geography, University of Guelph, Guelph, ON Canada, NlG 2 W1
Received 28 March 1994 Revised 16 February 1995
ABSTRACT
Shear velocity ratios were derived for six neighbouring localities representing rangeland, abandoned farmland and a playa, in the semi-arid region of the Sonoran Desert. Near-surface and above-canopy wind speeds, mostly below saltation thresh- old, were used to evaluate the partitioning of shear velocities and shear stresses between the plant canopy and the surface. The technique utilized represents an alternative to the threshold shear velocity ratio (R,) approach of Musick and Gillette (Land Degradation and Rehabilitation, 1990,2,87-94) and results demonstrate the need for partitioning over a range of wind speeds. Shear velocity ratios were variable over the playa and abandoned farmland, while variance in near-surface wind speeds was highest over shrub-dominated sites. The relationship between lateral cover (L,) and shear velocity (R) is comparable to previous findings utilizing R,, although methodological differences result in mean shear velocity ratios less than shear velocity ratios derived for threshold conditions. With respect to the model of Raupach et al. (Journal of Geophysical Research, 1993,98-D2,3023-3029), this may be attributed to the difference between measured shear stresses and the average shear stress on the exposed surface. At high lateral covers, shear velocity ratios are lower than threshold shear velocity ratios due to increased wake interactions or decreased drag on the shrub elements at higher wind speeds.
KEY WORDS wind erosion; vegetation; lateral cover; shear stress partitioning
INTRODUCTION
In arid regions, vegetation cover is an important factor in preventing soil loss due to wind erosion. In these regions, vegetation may respond dramatically to variations in precipitation, with increased cover in times of ample moisture and minimal cover during drought. In addition, destruction of vegetation by anthropogenic activities including cultivation, grazing and settlement often results in increased wind erosion. However, while the sensitivity of arid regions to disturbance and climatic stress is recognized, the potential for erosion due to decreased vegetation cover and surface disturbance is largely unknown. Fundamental to this problem is the question of how much vegetation cover is required to inhibit wind erosion in arid regions.
In the southwestern United States, including the Sonoran Desert in Arizona (Figure l), natural desert scrubland, rangeland and abandoned or fallow farmland are commonly vegetated with less than 30 per cent surface cover. Soils in these regions are derived primarily from alluvium containing a high proportion of fine-grained sediment which is highly susceptible to wind erosion (Campbell, 1972; Nakata et al., 1981; Hyers and Marcus. 198 1). Although a number of field studies have been conducted in this region (Glenden- ing, 1977; Lee, 1990; Musick and Gillette, 1990), the amount of vegetation cover required to protect these sparsely vegetated surfaces from wind erosion remains uncertain.
Consequently, methods are needed to measure and predict wind erosion susceptibility in sparsely vege- tated areas. This paper documents the methodology and results of shear stress partitioning in several
0 1996 by John Wiley 62 Sons, Ltd. CCC 0197-9337/96/070607-13

608 S. A. WOLFE AND W. G. NICKLING
Figure 1. Location of study area within the Sonoran Desert of Arizona in the southwestern United States
sparsely vegetated communities using a range of wind speeds, mostly below the threshold shear velocity of erodible soils. The study follows from the work of Stockton and Gillette (1990), Musick and Gillette (1990) and Raupach et al. (1993) on shear stress partitioning. Results are discussed in the context of these studies, with the goal of assessing the protection provided by sparse vegetation against wind erosion.
BACKGROUND
Shear stress partitioning may be used to determine the proportion of the total force of the wind exerted on the vegetation elements and the ground surface. The theoretical background for sheer stress partitioning applied to vegetated surfaces has been reviewed by Gillette and Stockton (1989), Stockton and Gillette (1990) and Wolfe and Nickling (1993). The principles of shear stress partitioning follow from Schlichting (1936):
F, = Fv + Fs (1)
where (F,) is the total force applied to a rough surface, (F,) is the force exerted on the vegetation elements and (F,) is the force on the intervening bare surface.
The partitioning of forces may be expressed in terms of the total shear stress ( T ~ ) :
Where A , is the plan view surface area of the vegetated surface, A , is the surface area not covered by vegetation and T~ is surface shear stress.
SHEAR STRESS PARTITIONING IN DESERT CANOPIES 609
Rewriting Equation (2), the fraction of the total momentum flux imparted to the surface (the shear stress ratio) is:
1 - (L) A070 = (2) (2) (3)
The sheer stress may be restated in terms of the shear velocity (Priestley, 1959):
(4) 2
7- = PaU*
where T is the sheer stress, po is the density of air and u, is the sheer velocity.
stress ratio: Musick and Gillette (1990) rely on the threshold of movement of erodible particles to determine the shear
where R, is the threshold shear velocity ratio, ( u , ~ ~ / u , ~ ~ ) . This method utilizes the threshold shear velocity of erodible particles in absence of vegetation (u*~J determined in a wind tunnel, and the threshold shear velocity with vegetation present (u,,,) using an anemometer array above the vegetation and a device to sense particle movement in the field (Stockton and Gillette, 1990).
Equation 5 may be used to determine the extent to which the vegetation community inhibits erosion of the bare soil. It may further be used in conjunction with lateral cover to predict the amount of vegetation cover required to inhibit erosion. Musick and Gillette (1990) used a solid cylinder as a model of plant canopy shape, defining the lateral cover (L,) as:
nS L, = - A
where n is the number of roughness elements per unit area, A , and S is the mean frontal-silhouette area per canopy:
S = - C hi4 N (7)
where h is canopy height, d is canopy diameter, and N is the number of canopies (Musick and Gillette 1990). Raupach et al. (1993) developed an equation to predict the dependence of the threshold shear velocity
ratio upon lateral cover based on the analytical treatment of drag partitioning by Raupach (1992). The prediction is:
R, = (1 - m a ~ c ) 0 ‘ 5 ( 1 + ~,BL,.)’” (8)
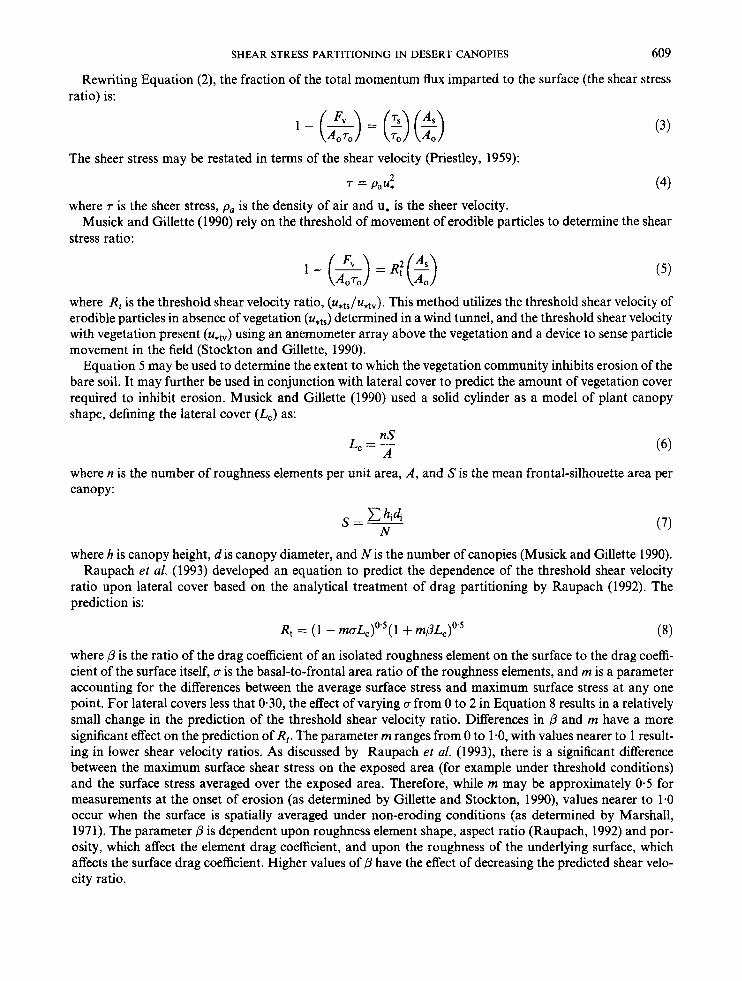
where p is the ratio of the drag coefficient of an isolated roughness element on the surface to the drag coeffi- cient of the surface itself, a is the basal-to-frontal area ratio of the roughness elements, and rn is a parameter accounting for the differences between the average surface stress and maximum surface stress at any one point. For lateral covers less that 0.30, the effect of varying u from 0 to 2 in Equation 8 results in a relatively small change in the prediction of the threshold shear velocity ratio. Differences in /3 and m have a more significant effect on the prediction of R,. The parameter rn ranges from 0 to 1.0, with values nearer to 1 result- ing in lower shear velocity ratios. As discussed by Raupach et al. (1993), there is a significant difference between the maximum surface shear stress on the exposed area (for example under threshold conditions) and the surface stress averaged over the exposed area. Therefore, while m may be approximately 0.5 for measurements at the onset of erosion (as determined by Gillette and Stockton, 1990), values nearer to 1.0 occur when the surface is spatially averaged under non-eroding conditions (as determined by Marshall, 1971). The parameter ,B is dependent upon roughness element shape, aspect ratio (Raupach, 1992) and por- osity, which affect the element drag coefficient, and upon the roughness of the underlying surface, which affects the surface drag coefficient. Higher values of p have the effect of decreasing the predicted shear velo- city ratio.

610 S. A. WOLFE AND W. G. NICKLING
Figure 2. Photographs of representative sites investigated illustrating varying degrees of vegetation cover. (A) Creosotebush-dominated rangeland site (RLL); (B) mixed creosotebush and bursage rangeland site (MRL2); (C) abandoned farmland (AF); and (D) playa (PL).
Raupach et al. (1993) verified the model using several independent data sets including the wind tunnel data of Marshall (1971), Lyles and Allison (1976) and Gillette and Stockton (1989), as well as the field data of Musick and Gillette (1990).. Raupach et al. (1993) suggest that, for flat, erodible, shrub-vegetated surfaces at the threshold of erosion, the coefficients p, CJ and m are approximately 100, 1 and 0.5 respectively.
Equations 5 and 8 consider the specialized case for the shear velocity ratio under threshold conditions ( R J . This ratio is significant, as it represents the ratio of shear velocities at the onset of wind erosion. It is a rela- tively simple task to record the onset of particle transport (uetv) using a monitoring device as described by Stockton and Gillette (1990). However, since the threshold shear velocity of the unvegetated soil (uJ is a function of soil variables including texture, crustal thickness, salts and moisture content (Gillette et al., 1980), it can vary considerably both spatially and temporally. For example, a sparsely vegetated, erodible surface may have a much higher threshold shear velocity when the soil is crusted compared to when the soil is uncrusted or disturbed. Furthermore, as Stockton and Gillette (1990) state, episodes of wind erosion are often widely and sporadically spaced in time. Therefore, from a methodological perspective, it may be impractical to monitor a surface for the onset of erosion as the threshold shear velocity is unlikely to remain constant with time. Consequently, it may be necessary to consider the shear velocity ratio for a range of wind speeds and shear velocities, rather than for a single set of threshold conditions.
An alternative to the threshold shear velocity ratio is to determine shear velocity ratios for simultaneous shear velocities of the bare soil (ues) and the vegetated surface ( u , ~ ) , irrespective of threshold conditions, and to substitute this ratio ( R ) into Equations 5 and 8, so that 5 becomes:
where R is the shear velocity ratio (u,,/ueV) and A J A , is the proportion of the area covered by the bare

SHEAR STRESS PARTITIONING IN DESERT CANOPIES 61 1
surface (one minus the percentage vegetation cover expressed as a fraction). The substitution of R for R, represents the generalized case for Equations 5 and 8 which considers shear stress partitioning between vege- tation and the intervening ground surface for all total stresses. From a practical perspective, the approach simplifies procedures by making measurements under a range of wind speeds including non-eroding condi- tions. To date, however, shear stress partitioning in sparsely vegetated canopies utilizing a range of wind speeds and shear velocities has not been investigated.
METHODS
Vegetation cover Vegetation measurements were made to estimate the lateral cover (L,) and the proportion of ground area
not covered by vegetation elements (AJA,) . Six field sites were investigated including two rangeland sites (RL1 and RL2) with pure stands of creosotebush (Larrea tridentata), two rangeland sites with mixed vegeta- tion of white bursage (Ambrosia dumosa) and creosotebush (sites MRLl and MRL2), an abandoned farm- land (site AF) with very sparse velvet mesquite (Prosopis julifora var. velutina), and a playa surface (site PL) devoid of vegetation. Figure 2 depicts the diversity of ground cover within the study area, as illustrated by two of the rangeland sites (RL2 and MRL2), the abandoned farmland (AF) and playa (PL).
At each site, all vegetation elements greater than 0-15 m high were surveyed within a rectangular area of at least 40 m by 60 m. Shrub vegetation on the abandoned farmland was very sparse and an area of 300 m2 was surveyed in order to obtain an adequate sample of the vegetation cover. Although more time-consuming than intrasite sampling and linear transects used previously (Lee, 1990; Musick and Gillette, 1990), this level of detail was deemed necessary to reduce the potential error in estimates of lateral cover. Plant height (h) and diameter ( d ) were determined for all plants over 0.1 5 m high. The average of two diameters measurements, taken at right angles, was used for the plant diameter.
Total shear velocities Wind speed profiles over the vegetation canopies were obtained using anemometers (calibrated to
f0.15ms-l) at heights of 1.5, 2.5, 3.5, 4.5, 5.5, 7-5, and 10.0m above the ground surface. Profiles were obtained from 15min averages, using a sampling interval of 5 s. Shear velocities over the vegetated surfaces (u,,) were calculated by fitting data from 2.5 to 10.0m to the Prandtl-von Karman equation:
where u, is the shear velocity, u, is the mean horizontal wind speed at height z, IC is the von Karman constant equal to 0.40, and z, is the aerodynamic roughness length.
The influence of buoyancy on wind profiles and shear velocities in hot desert conditions has been well documented (Frank and Kocurek, 1994). Thermal effects were addressed prior to calculations of aerodynamic variables. Temperatures were obtained from shielded thermistors at several heights. However, differences in temperatures between heights were commonly smaller than the precision of the thermistors (IltO.04OC) and were not considered reliable for stability corrections.Therefore, in order to overcome effects of atmospheric buoyancy, only profiles in which the average wind speed at a height of 10 m exceeded 5 m s-' and the minimum wind speed at a height of 1 a 5 m exceeded 1.5 m s-' were selected from the original data set. After removal of low wind speed data, profiles for which the coefficients of determination (r2) fell below 0.95 were removed to ensure that estimates of z, and u, were statistically significant at the 0.1 per cent level and that anomalous and non-neutral profiles were removed from the data set. Although not as rigorous as sta- bility corrections, in this way, data for which mechanical turbulence exceeded convective effects were prefer- entially selected for analysis.
Despite the vegetation cover, the use of a modified form of Equation 10 incorporating a displacement height was considered unnecessary. Theoretically, the displacement height over a vegetated surface should lie between the ground surface and the mean canopy height calculated using the method of least squares

612 S. A. WOLFE AND W. G. NICKLING
Table I. Summary of roughness length and shear velocities from anemometer masts including number of profiles (n), mean (n) and standard deviation (s) cal-
culated from Equation 10
Roughness length (z,) Shear velocity (u,) m) (m s-')
Site n x S R S
RL 1 12 1.21 1.07 0.33 0.04 RL2 110 7.13 4.66 0.51 0.06 MRLl 122 6.47 4.93 0.56 0.12 M RL2 150 8.44 3.23 0.59 0.09 AF 63 0.54 0.83 0.20 0.04 PL 30 0.04 0.06 0.20 0.02
were variable, with few values residing both below the height of the canopy and above the ground surface. Mean displacement heights also resulted in unrealistically low values of roughness length. The variability in displacement height is partially explained by the excellent fit of the profile date to the Prandtl-von Karman equation with displacement height set to zero. This suggests that actual displacement heights were small and would not notably affect shear velocities.
Shear velocities and roughness lengths were calculated from Equation 10 utilizing between 12 and 150 profiles. The number of profiles together with the mean (2) and standard deviation (s) of the roughness lengths and shear velocities are shown in Table I. Mean roughness lengths ranged from 0.0004m for the playa (PL) to 0 . 0 8 4 m for the mixed creosotebush and bursage rangeland site MRL2. Mean shear velocities ranged from 0.20 over the playa (PL) and abandoned farmland (AF) to 0.59 for site MRL2. Shear velocities and roughness lengths were higher over the vegetated sites, reflecting the increased surface roughness and momentum extraction.
Near-surface shear velocities Near-surface shear velocities were derived from atmospheric wind speeds at a height of 0.15 m and drag
coefficients measured in a portable wind tunnel. Drag coefficients were, in turn, derived from simultaneous measurements of near-surface wind speeds ( u ~ . ~ ~ ) from an anemometer and shear velocities ( u * ~ ) from a pitot tube rake in a portable field wind tunnel set up over each surface.
The wind tunnel, similar to that described by Nickling and Gillies (1989), was an open-floored, non- circulating, suction-type tunnel measuring 1.0 m wide, 0.75 m high and 12.0 m long. The working section was situated 10.0m from the intake to allow for the development of a boundary layer to a height of 150mm (Gillies, 1994). Six pitot tubes set at 10, 29, 48, 69, 110 and 160mm above the ground were used to determine near-surface shear velocities whereas an anemometer was used to obtain corresponding near-surface wind speeds at a height of 0.15 m. Between 26 and 60 profiles were obtained at each site for a range of wind speeds. Owing to logistical constraints, wind tunnel tests were made over a single location at each site resulting in the derivation of one drag coefficient per site. Wind tunnel tests were not conducted at sites RL2 and MRLl owing to the poor load-bearing capacity of the subsurface silts, which made wind tun- nel access impossible. Consequently, wind tunnel tests were conducted adjacent to the site MRLl whereas the drag coefficient was estimated at site RL2 based on the drag coefficient at the adjacent rangeland site (MRL2)
Under atmospheric conditions, near-surface shear velocities ( u * ~ ) were determined from wind speeds at a height of 0-15m ( u ~ . ~ ~ ) based on the equality:
UZ UZ - (wind tunnel) = - (atmosphere) u* u*
where u, is the wind speed at height z, within the established boundary layer of the wind tunnel. For wind speeds obtained within an established boundary layer, the profile above the bare surface may be

SHEAR STRESS PARTITIONING IN DESERT CANOPIES 613
described by Equation 10. Near-surface wind speed measurements from the anemometer and pitot tubes were taken within the boundary layer of the wind tunnel. Under atmospheric conditions, a fully developed boundary layer may not be established near the surface when large, closely spaced roughness elements are present. However, for desert shrub communities, a surface boundary layer may be developed to several tens of centimetres between elements (Glendening, 1977) such that Equation 11 may be accepted away from obstacles. Following from Equation 1 1, the near-surface shear velocity under atmospheric conditions may be approximated from:
u, (atm) u, (atm) = 4f4 (wind tunnel) u*
which may be stated in terms of the drag coefficient:
u, (atm) = u, (atrnld-
where Cd(,, is the drag coefficient at height z , equal to:
Using Equation 13, near-surface atmospheric shear velocities (u*~) were calculated from atmospheric wind speeds (u,) at a height of 0.15 m and wind tunnel drag coefficients (Cd(z)) derived at the same height. Near- surface wind speeds were obtained in the field from five anemometers each at a height of 0-1 5 m. The near- surface anemometers were distributed throughout each study site, with one anemometer located at the centre of the site and one in each corner of a 60 m by 40 m rectangular array. Near-surface wind speeds and above- canopy wind speed profiles were collected simultaneously utilizing 5 s sampling intervals and 15 min averages. In order to compensate for the spatial variability in surface stresses, mean near-surface shear velo- cities (u*J were obtained by averaging the measurements from the five near-surface wind speeds (u0.l5) for each 15 min period.
RESULTS
Vegetation cover Shrub vegetation was dominantly creosotebush and white bursage, with lesser Occurrences of mesquite. In places, per-
ennial bunch grasses and other herbaceous plants covered a proportion of the ground surface. Sites selected generally had bare soil surfaces dominated by shrub vegetation.
Table 11. Summary of vegetation parameters including mean (P), standard deviation (s), number of plants (n) and total percentage cover. Height and diameter are in metres
Creosotebush Bursage Mesquite
Height Diam Height Diam Height Diam Percentage Site x (4 f (4 n (4 f (4 n P (s) x (s) n cover
- - - - - - 8.45 RL 1 0.82 1.10 283
- - - - - - 10.30 RL2 1.06 1.39 217
MRLl 0.99 1.47 102 0.33 0.63 459 - 13.50
MRL2 1.02 1.32 390 0.30 0.53 205 - 26.28
- - - - - 1.20 1.32 23 0.04 AF
(0.23) (0.40)
(0.24) (0-50)
(0.25) (0.59) (0.09) (0.19)
(0.21) (0.41) (0.06) (0.14)
- -
- -
- (0.45) (0.71)

614 S. A. WOLFE AND W. G. NICKLING
Table 111. Individual species and total lateral covers (L,) determined using rectangular silhouette geometry and mean heights and widths of individual canopies
Site Creosotebush Bursage Mesquite Total
- 0.072 RL 1 0.072 - - 0.089 RL2 0.089 -
MRLl 0.059 0.034 0.093 MRL2 0.218 0.014 - 0.232 AF -
-
- 0.00034 0.00034
Table I1 summarizes the vegetation cover. The percentage cover represents the ground area covered by vegetation as viewed from above and was determined by summing the plan view area of each element (cal- culated from plant diameter). The total number of vegetation elements contained within each sample area is also shown, together with the mean (3) and standard deviation (s) of the vegetation height and diameter. Mesquite shrubs were the largest elements, averaging 1.20m high on the abandoned farmland (site AF). Creosotebush ranged in height from an average of 0.83 m at site RL1 to 1-06 m at site RL2, while bursage generally averaged 0.30 m. Bursage elements outnumbered creosotebush at the mixed rangeland site MRLl, while creosotebush dominated at site MRL2. The abandoned farmland was the most sparsely vegetated, with mesquite elements covering 0.04 per cent of the sample area. The exceptionally sparse vegetation cover at this site is likely due to a change in drainage caused by ditches around the farmland. Consequently, only moisture received in the form of precipitation reaches the soil. The surrounding areas receive additional moisture input from surface runoff derived upslope. Vegetation cover was greater at the other sites, ranging from 8.5 per cent at site RL1 to approximately 26.3 per cent at mixed rangeland site MRL2.
RL1 12, I
- 6
a 2
YI
' 0 .1 .2 .3 .4 .5 .6 .7 .8
MRL2 121 I
M R L l :I-
u., (ms-3 PL
12, I
E - 6
0
' 0 .1 .2 .3 .4 .S .6 .7 .8
u . ~ (ms-3
Figure 3. Relationship between near-surface wind speeds ( ~ 0 , ~ ~ ) and shear velocities (u,J for the study sites as measured in wind tunnel, with zero-intercept linear regression through data

SHEAR STRESS PARTITIONING IN DESERT CANOPIES 615
Table IV. Drag coefficients and coefficients of determination (2) derived from wind tunnel tests on the bare surfaces
Near-surface wind speed Coefficient of to shear velocity ratio Drag coefficient determination Number of
Site (%15/U*S) (cdO.15) lo’ (2) profiles
RL 1 RL2 MRLl MRL2 AF PL
14.1
19.7 140 20.5 16.2
- 5.03 5.10* 2.60t 5.10 2.38 3.81
0.56
0.69 0.91 0.73 0.61
- 66
60 57 31 26
-
Estimated value t Obtained adjacent to site MRL1, value of N 5.00 considered representative of site.
Table I11 presents the lateral covers for each site based on a cylindrical representation of the vegetation shape and the mean heights and widths in Table 11. The lateral cover is highest at site MRL2, followed by MRLl . These sites contained a mix of vegetation where bursage occupies some of the intervening spaces between creosotebush. The high lateral cover at site MRLZ corresponds to a surface dominated by creosote- bush whereas the lower lateral cover at site MRLl reflects a surface dominated by a population of bursage with fewer creosotebush (Table 11). The lower lateral cover at sites RL1, RL2 and AF reflects low density, single vegetation canopies. The sparse nature of the vegetation at the abandoned farmland is particularly evident from the very low lateral cover, even though the site contained the largest vegetation elements.
4 5 6 7 8 9 1 0 1 1 1 2
Wind Speed 10 m ( 4 s ) + P L O A F
3
4 5 6 7 8 9 1 0 1 1
Wind Speed 10 m (ds) * R L l 0 RLZ M R L l MRU
1
Figure 4. Relationship between shear velocity ratios (R) and wind speeds at 10m for (a) smooth sites (AF and PL) and (b) rough sites (RLl, RL2, MRLl and MRLZ)

616 S. A. WOLFE A N D W. G. NICKLING
Table V. Means X and standard deviation (s) of shear velocity ratios and shear stress ratios
Site Shear velocity ratio Shear stress ratio ( R ) (1 - P d 4 0 ~ 0 1 )
- X S .%
RL1 0.45 0.06 0.19 RL2 0.37 0.05 0.12 MRLl 0.25 0.06 0.05 MRL2 0.21 0.02 0.03 AF 0.09 0.21 0.8 1 PL 0.98 0.14 0.96
Near-surface shear velocities An important part of the procedure involved deriving drag coefficients by correlating near-surface wind
speeds ( u ~ . ~ ~ ) and shear velocities obtained in a wind tunnel. Wind speed profiles had a strong correlation with Equation 10 (of the 269 tests, only one profile was not significant at the 5 per cent level). Figure 3 shows the relationships between the anemometer wind speeds at a height of 0-15m and shear velo- cities obtained in the wind tunnel for each site (excluding site RL2 which could not be tested owing to logis- tical constraints). The lines represent zero-intercept linear regressions through the data. This restriction is preferable to unconstrained intercepts since the near-surface wind speeds ( u ~ . ~ ~ ) and shear velocities (u,,) must intercept at zero.
Table IV presents the ratio of the wind speed at 0.15 m to the shear velocity (U,,.15,uj,) and drag coefficients (Cdo.15) measured in the wind tunnel as well as the coefficients of determination ( r 2 ) for the regression in Fig- ure 3. The ratios were determined from the slope of the best-fit lines in Figure 3 while the drag coefficients were derived from Equation 14. All of the relationships were significant at the 5 per cent level. Because site RL2 could not be tested with the portable wind tunnel, a value of 5.10 x lop3 was used for the site represent- ing a surface drag comparable to the adjacent mixed rangeland site MRL2 (Figure 1). Similarly, The drag coefficient derived for site MRLl was, for logistical reasons, made on a more compact unvegetated surface adjacent to site MRL1. The drag coefficient of 2.60 x lop3 derived adjacent to the site is lower than the
1.5
8 1 3 '8 5 8 0.5
L.
L
r v)
a
log (Lc)
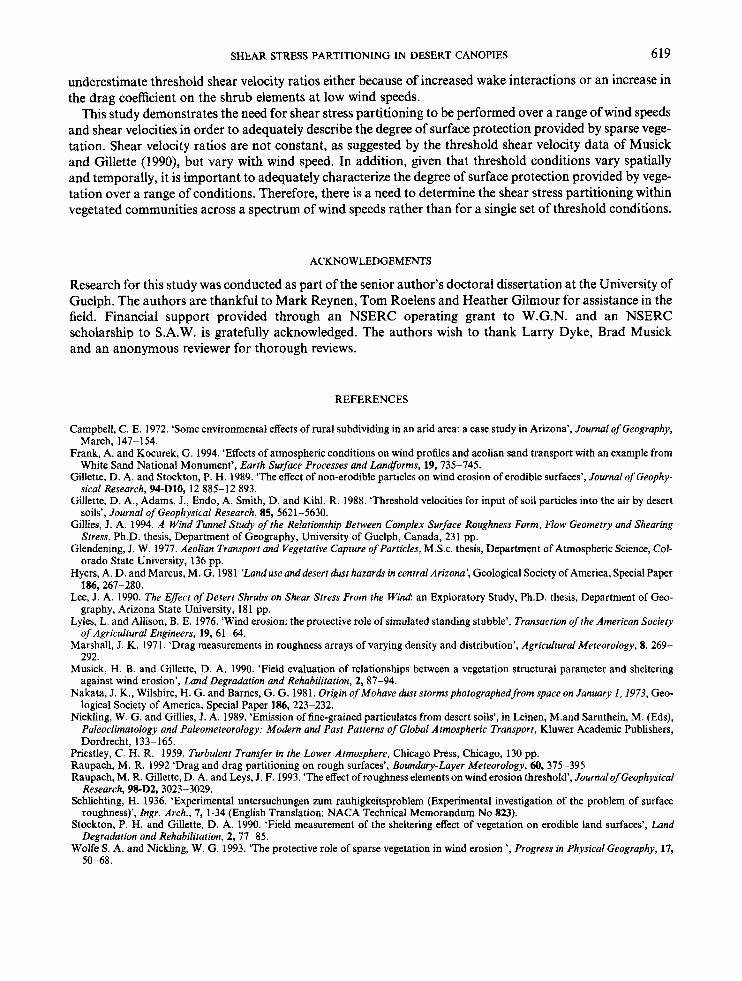
Figure 5. Shear velocity ratios (R) compared to Musick and Gillette (1990) and the model of Raupach er al. (1993). Model values are shown for @ equal to 80, 120, 160 and 200, and u and m held constant at 1 and 0.5, respectively. Bars indicate standard deviation.
SHEAR STRESS PARTITIONING IN DESERT CANOPIES 617
values for the other rangeland sites (RL1 and MRL2) and is more comparable to the smoother abandoned farmland and playa surfaces. The rangeland sites, including site MRLl, had similar surface terrain, being generally rougher than the playa or abandoned farmland. Consequently, a drag coefficient of 5.0 x is used for site MRLl rather than the lower value obtained on the adjacent surface.
Near-surface atmospheric wind speeds ranged from approximately 1 .O to 5.5 m s-' and corresponding near-surface shear velocities ranged from 0.05 to 0.27 m s-l . Only the abandoned farmland (site AF) and the bursage-dominated rangeland (site MRLl) received winds above the threshold of erosion during the study. Variability was observed in the five simultaneous measurements of near-surface wind speeds. Coeffi- cients of variation increased with increasing vegetation cover and decreased with increasing wind speeds. For wind speeds 6 5 m s-l at 10 m, coefficients of variation were < 0.10 at the smooth sites (AF and PL), 20.16 at the rangeland sites (RLl and RL2) and 60.22 at the mixed rangeland sites (MRL1 and MRL2).
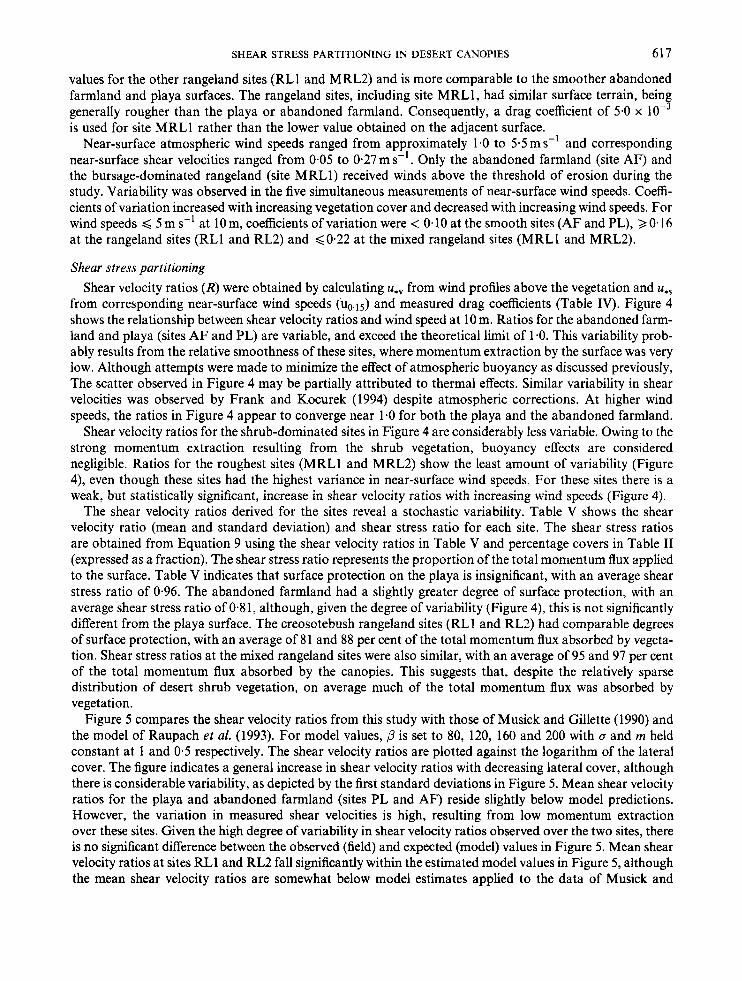
Shear stress partitioning Shear velocity ratios ( R ) were obtained by calculating u , ~ from wind profiles above the vegetation and u , ~
from corresponding near-surface wind speeds ( ~ ~ . 1 ~ ) and measured drag coefficients (Table IV). Figure 4 shows the relationship between shear velocity ratios and wind speed at 10 m. Ratios for the abandoned farm- land and playa (sites AF and PL) are variable, and exceed the theoretical limit of 1.0. This variability prob- ably results from the relative smoothness of these sites, where momentum extraction by the surface was very low. Although attempts were made to minimize the effect of atmospheric buoyancy as discussed previously, The scatter observed in Figure 4 may be partially attributed to thermal effects. Similar variability in shear velocities was observed by Frank and Kocurek (1994) despite atmospheric corrections. At higher wind speeds, the ratios in Figure 4 appear to converge near 1.0 for both the playa and the abandoned farmland.
Shear velocity ratios for the shrub-dominated sites in Figure 4 are considerably less variable. Owing to the strong momentum extraction resulting from the shrub vegetation, buoyancy effects are considered negligible. Ratios for the roughest sites (MRLl and MRL2) show the least amount of variability (Figure 4), even though these sites had the highest variance in near-surface wind speeds. For these sites there is a weak, but statistically significant, increase in shear velocity ratios with increasing wind speeds (Figure 4).
The shear velocity ratios derived for the sites reveal a stochastic variability. Table V shows the shear velocity ratio (mean and standard deviation) and shear stress ratio for each site. The shear stress ratios are obtained from Equation 9 using the shear velocity ratios in Table V and percentage covers in Table I1 (expressed as a fraction). The shear stress ratio represents the proportion of the total momentum flux applied to the surface. Table V indicates that surface protection on the playa is insignificant, with an average shear stress ratio of 0.96. The abandoned farmland had a slightly greater degree of surface protection, with an average shear stress ratio of 0.81, although, given the degree of variability (Figure 4), this is not significantly different from the playa surface. The creosotebush rangeland sites (RLl and RL2) had comparable degrees of surface protection, with an average of 8 1 and 88 per cent of the total momentum flux absorbed by vegeta- tion. Shear stress ratios at the mixed rangeland sites were also similar, with an average of 95 and 97 per cent of the total momentum flux absorbed by the canopies. This suggests that, despite the relatively sparse distribution of desert shrub vegetation, on average much of the total momentum flux was absorbed by vegetation.
Figure 5 compares the shear velocity ratios from this study with those of Musick and Gillette (1990) and the model of Raupach et al. (1993). For model values, ,O is set to 80, 120, 160 and 200 with o and m held constant at 1 and 0.5 respectively. The shear velocity ratios are plotted against the logarithm of the lateral cover. The figure indicates a general increase in shear velocity ratios with decreasing lateral cover, although there is considerable variability, as depicted by the first standard deviations in Figure 5. Mean shear velocity ratios for the playa and abandoned farmland (sites PL and AF) reside slightly below model predictions. However, the variation in measured shear velocities is high, resulting from low momentum extraction over these sites. Given the high degree of variability in shear velocity ratios observed over the two sites, there is no significant difference between the observed (field) and expected (model) values in Figure 5. Mean shear velocity ratios at sites RL1 and RL2 fall significantly within the estimated model values in Figure 5, although the mean shear velocity ratios are somewhat below model estimates applied to the data of Musick and

618 S. A. WOLFE AND W. G. NICKLING
Gillette (1990). Finally, mean shear velocity ratios for the mixed rangeland sites are consistently lower than those predicted by the model and observed by Musick and Gillette (1990).
DISCUSSION
Lower mean shear velocity ratios obtained in the present study compared to the ratios of Musick and Gillette (1990) for comparable values of lateral cover are largely accounted for through differences in experimental procedures, and may be explained in terms of the model of Raupach et al. (1993). As discussed by Raupach et al. (1993), there is a significant difference between the maximum surface stress which initiates particle movement (m = 0*5), and the surface stress averaged over the exposed area (m = 1 .O) . Musick and Gillette (1 990) utilized threshold shear velocities which approximate the maximum surface stresses on the exposed surface ( M = 0.5) (Raupach et al., 1993). The present study utilized spatially averaged near-surface shear velocities, mostly below threshold, which result in surface shear stresses significantly less than the maximum surface stress. Consequently, mean values of m in the present study reside between 0.5 and 1.0. Raupach et al. (1993) have shown that, for low lateral covers, the effect of varying m on shear velocity ratios is negligible, while at higher lateral covers, as observed at all of the rangeland sites, the effect of m on shear velocity ratios is significant. Therefore, the mean shear velocity ratios at the rangeland sites consistently underestimate the threshold shear velocity ratios observed by Musick and Gillette (1990).
To compensate for the differences in procedures, the upper first standard deviations for rangeland sites in the present study (Figure 5 ) may be compared to threshold shear velocity ratios, with m x 0.5. Utilizing this adjustment, observed shear velocity for rangeland sites RL1 and RL2 are well modelled, together with the data of Musick and Gillette (1990), by = 1.0, m = 0-5 and p residing between 80 and 120, in accordance with previous model estimates by Raupach et al. (1993).
Despite these adjustments, shear velocity ratios for the mixed rangeland sites MRLl and MRL2 are still low, and a value for p of approximately 200 appears necessary for these sites. The lower shear velocity ratios may result from increased wake interactions at higher lateral covers or a dependence of the drag coefficient of shrub elements on wind speed. At higher lateral covers, strong wake interactions can prohibit the deveiop- ment of a near-surface boundary layer between elements. Under these conditions Equation 10 would not be applicable near the surface, and Equation 1 1 would be invalidated. If this resulted in an underestimate of the surface shear stress (T~), then shear velocity ratios would be lower than model predictions. The higher near- surface wind speed variance at these sites supports the possibility of increased wake interaction, although the observed variance was not large and decreased with increasing wind speed.
An alternative explanation for lower shear velocity ratios, compared to values at threshold, resides in the dependence of the drag coefficient of shrub elements with wind speed, Shear velocity ratios for MRL1 and MRL2 show a dependence of wind speed (Figure 4), with ratios increasing at higher wind speed. This implies that the surface protection provided by vegetation decreases with increasing wind speed. This dependence may result from a decrease in the drag coefficient on the shrub elements with increasing turbulent intensity. In Figure 4, wind speeds above approximately 10m s-l represent winds above the threshold of erosion at site MRL2. For these higher wind speeds, the shear velocity ratio approaches 0-4. Referring to Figure 5 , a shear velocity value of 0.4 for MRLl is well within model estimates, with a value for /3 of between 100 and 120.
CONCLUSIONS
The utilization of shear velocity ratios as applied in the study overcomes restrictions of threshold tests and extended measurement periods by using a range of wind speeds to derive shear velocity ratios. The technique may be applied to sparse vegetation canopies for a range of lateral covers, although shear velocity ratios are variable. Due to the utilization of spatially averaged near-surface shear velocities below the threshold of erosion, higher shear velocity ratios (R) more closely approximate threshold shear velocity ratios (Rt). After accounting for differences in methodology, results are in general agreement with those of Musick and Gillette (1990) and the model of Raupach et al. (1993). For high lateral covers, shear velocity ratios may
SHEAR STRESS PARTITIONING IN DESERT CANOPIES 619
underestimate threshold shear velocity ratios either because of increased wake interactions or an increase in the drag coefficient on the shrub elements at low wind speeds.
This study demonstrates the need for shear stress partitioning to be performed over a range of wind speeds and shear velocities in order to adequately describe the degree of surface protection provided by sparse vege- tation. Shear velocity ratios are not constant, as suggested by the threshold shear velocity data of Musick and Gillette (1990), but vary with wind speed. In addition, given that threshold conditions vary spatially and temporally, it is important to adequately characterize the degree of surface protection provided by vege- tation over a range of conditions. Therefore, there is a need to determine the shear stress partitioning within vegetated communities across a spectrum of wind speeds rather than for a single set of threshold conditions.
ACKNOWLEDGEMENTS
Research for this study was conducted as part of the senior author’s doctoral dissertation at the University of Guelph. The authors are thankful to Mark Reynen, Tom Roelens and Heather Gilmour for assistance in the field. Financial support provided through an NSERC operating grant to W.G.N. and an NSERC scholarship to S.A.W. is gratefully acknowledged. The authors wish to thank Larry Dyke, Brad Musick and an anonymous reviewer for thorough reviews.
REFERENCES
Campbell, C. E. 1972. ‘Some environmental effects of rural subdividing in an arid area: a case study in Arizona’, Journal of Geography,
Frank, A. and Kocurek, G. 1994. ‘Effects of atmospheric conditions on wind profiles and aeolian sand transport with an example from
Gillette, D. A. and Stockton, P. H. 1989. ‘The effect of non-erodible particles on wind erosion of erodible surfaces’, Journal of Geophy-
Gillette, D. A,, Adams, J., Endo, A. Smith, D. and Kihl, R. 1988. ‘Threshold velocities for input of soil particles into the air by desert
Gillies, J. A. 1994. A Wind Tunnel Study of the Relationship Between Complex Surface Roughness Form, Flow Geometry and Shearing
Glendening, J . W. 1971. Aeolian Transport and Vegetative Capture of Particles, M.S.C. thesis, Department of Atmospheric Science, Col-
Hyers, A. D. and Marcus, M. G. 1981 ‘Land use anddesert dust hazards in central Arizona’, Geological Society of America, Special Paper
Lee, J. A. 1990. The Eflect of Desert Shrubs on Shear Stress From the Wind an Exploratory Study, Ph.D. thesis, Department of Geo- graphy, Arizona State University, 181 pp.
Lyles, L. and Allison, B. E. 1976. ‘Wind erosion: the protective role of simulated standing stubble’, Transaction of the American Society of Agricultural Engineers, 19, 61-64.
Marshall, J. K. 197 1. ‘Drag measurements in roughness arrays of varying density and distribution’, Agricultural Meteorology, 8, 269- 292.
Musick, H. B. and Gillette, D. A. 1990. ‘Field evaluation of relationships between a vegetation structural parameter and sheltering against wind erosion’, Land Degradation and Rehabilitation, 2,81-94.
Nakata, J. K., Wilshire, H. G. and Barnes, G. G. 1981. Origin of Mohave dust stormsphotographedfrom space on January 1,1973, Geo- logical Society of America, Special Paper 186, 223-232.
Nickling, W. G. and Gillies, J. A. 1989, ‘Emission of fine-grained particulates from desert soils’, in Leinen, M.and Sarnthein, M. (Eds), Paleoclimatology and Paleometeorology: Modern and Past Patterns of Global Atmospheric Transport, Kluwer Academic Publishers, Dordrecht, 133-165.
March, 147-154.
White Sand National Monument’, Earth Surface Processes and Landforms, 19,735-745.
sical Research, 94-D10, 12 885-12 893.
soils’, Journal of Geophysical Research, 85, 5621-5630.
Stress. Ph.D. thesis, Department of Geography, University of Guelph, Canada, 231 pp.
orado State University, 136 pp.
186,267-280.
Priestley, C. H. R. 1959. Turbulent Transfer in the Lower Atmosphere, Chicago Press, Chicago, 130 pp. Raupach, M. R. 1992 ‘Drag and drag partitioning on rough surfaces’, Boundary-Layer Meteorology, 60,375-395 Raupach, M. R. Gillette, D. A. and Leys, J. F. 1993. ‘The effect of roughness elements on wind erosion threshold’, Journalof Geophysical
Schlichting, H. 1936. ‘Experimental untersuchungen zum rauhigkeitsproblem (Experimental investigation of the problem of surface
Stockton, P. H. and Gillette, D. A. 1990. ‘Field measurement of the sheltering effect of vegetation on erodible land surfaces’, Land
Wolfe S . A. and Nickling, W. G. 1993. ‘The protective role of sparse vegetation in wind erosion ’, Progress in Physical Geography, 17,
Research, 98-D2,3023-3029.
roughness)’, Zngr. Arch., 7 , 1-34 (English Translation: NACA Technical Memorandum No 823).
Degradation and Rehabilitation, 2, 71-85.
50-68.