shear layer dynamics of a cylindrical cavity for different...
TRANSCRIPT

15th Int Symp on Applications of Laser Techniques to Fluid Mechanics Lisbon, Portugal, 05-08 July, 2010
- 1 -
Shear layer dynamics of a cylindrical cavity for
different acoustic resonance modes
Gareth J. Bennett1, Francisco Rodriguez Verdugo2, David B. Stephens3
1: Department of Mechanical and Manufacturing Engineering, Trinity College, Dublin 2, Ireland, [email protected]
2: Dipartimento di Ingegneria Meccanica Industriale, Universita degli Studi Roma Tre, Italy, [email protected] 3: NASA Glenn Research Centre, USA, [email protected]
Abstract This paper investigates the interaction between the shear layer over a circular cavity and the flow-excited acoustic response of the volume to shear layer instability modes. Within the fluid-resonant category of cavity oscillation, most research has been carried out on rectangular geometries and where cylinders are considered, side branch and Helmholtz oscillators are most common. In these studies, focus is generally restricted to either longitudinal standing waves or to Helmholtz resonance. In practical situations however, where the cavity is subject to a range of flow speeds, many different resonant mode types may be excited. The current work presents a cylindrical cavity design where Helmholtz oscillation, longitudinal resonance and also azimuthal acoustic modes may all be excited upon varying the flow speed. Experiments performed show how lock-on between each of the three fluid-resonances and shear-layer instability modes can been generated. A circumferential array of microphones flush mounted with the internal surface of the cavity wall was used to decompose the acoustic pressure field into acoustic modes and has verified the excitation of higher order azimuthal modes by the shear layer. One of these interior pressure signals was also used to provide a phase signal for averaging flow field measurements of the shear layer acquired using PIV. Observation of the PIV images provides insight into these acoustically coupled oscillations. 1. Introduction Shear layer driven cavity flows can exhibit several types of features generally described as resonance. The review paper of Rockwell and Naudascher (Rockwell and Naudascher 1978) categorized self-sustaining oscillations into three groups: fluid-dynamic; fluid-resonant; and fluid-elastic. Of these, self-sustaining cavity oscillations which are strongly coupled with resonant waves within the cavity may be classified as fluid-resonant oscillations. Oscillations of this class occur at sufficiently high frequencies such that the corresponding acoustic wavelength is of the same order of magnitude, or smaller, than the cavity characteristic length-considered here to be the height of the cylindrical cavity, H. For ideal organ pipe conditions, these oscillations are predicted to have an acoustic wavelength of Ha 2≤λ for a closed cavity end condition. The exact frequency at which these longitudinal modes (standing waves along the height of the cavity) occur for shear layer driven oscillations is complicated by the very presence of the shear layer.
Within the fluid-dynamic category, a highly cited work is for high Mach number (M > 0.5) flow over a shallow cavity known as a Rossiter cavity. In this system, the feedback mechanism is an upstream-travelling acoustic wave generated by turbulent structures hitting the downstream edge of the cavity. These acoustic waves have a wavelength close to the cavity opening dimension, or length, L. Resonance occurs if this acoustic frequency can excite the shear layer oscillation. The fluid-elastic category occurs when one or more wall of the cavity undergoes a displacement that exerts a feedback control on the shear layer perturbation.
For cavities with rigid boundaries, the fluid-resonant category may contribute significantly to unwanted noise: from aircraft landing gear for example; or to undesirable pressure pulsations such as may be experienced in vehicles with open windows. A recent study by Langtry and Spalart (Langtry and Spalart 2008) used computational methods to predict the unsteady pressure inside a

15th Int Symp on Applications of Laser Techniques to Fluid Mechanics Lisbon, Portugal, 05-08 July, 2010
- 2 -
landing gear wheel well on a commercial aircraft geometry. Balasubramanian et al. (Balasubramanian et al. 2009) have recently considered “sunroof buffeting” on a simplified vehicle geometry. Tonon et al. (Tonon et al. 2010) have studied a series of side branch resonators as a model for flow in a corrugated pipe. Height modes were also studied by Yang et al. (Yang et al. 2009) who specifically analyzed the effect of the stream wise dimension of the cavity. A coaxial side branch configuration was studied by Oshkai and Yan (Oshkai and Yan 2008).
Kook and Mongeau (Kook and Mongeau 2002) and Ma et al. (Ma et al. 2009) have both recently studied Helmholtz resonators and accurately predicted the magnitude of the interior cavity pressure, when adequate information about the shear layer is available. Higher order acoustic modes have been explored for an axisymmetric shallow cavity configuration in a work by Awny and Ziada (Awny and Ziada 2008), and the work of Oshkai et al. (Oshkai et al. 2005) illustrates well how PIV can be used to gain further insight into the study of shear layer flows.
To date, within the fluid-resonant category, almost no consideration has been given to higher order acoustic modes which might resonate in cavities. In this paper we are particularly interested in exploring the test case where a number of different types of resonant behavior can be excited depending on flow speed or orifice geometry. In practical cases, such as for aircraft take-off and landing where the flow speed varies, it is important to be able to predict these modes so that mitigation measures can be implemented. 2. Acoustic Pressure Field in a Cylindrical Duct The cavities to be considered as in this experimental work are cylindrical with a small L/H ratio. As the longitudinal dimension of the cavity, H, is large, we can consider the cavity to be a closed ended cylindrical duct. The most common situation to be found in the literature is for a plane travelling acoustic wave which reflects from the end to form a standing wave. In cylindrical ducts, plane waves, only, can propagate below a characteristic frequency which is a function of the duct diameter. In this paper, higher order acoustic modes which are excited above this frequency are considered. These modes, once they “cut-on”, have a much more complicated pressure pattern compared to the plane wave mode. When more than one mode has “cut-on”, these modes are superimposed upon the plane wave mode and can co-exist with each other. The usual approach in the analysis of duct acoustics is to solve the defining differential equations by a separation of variables technique. This leads to an eigenvalue problem, the solution of which gives the duct propagation modes. Each mode represents a different way in which sound may travel down the duct. A complete description of the sound field in the duct consists of knowing the complex amplitude of each mode. 2.1 Description of Mode Propagation in Hard Walled Cylindrical Ducts For acoustic propagation in an infinite hard walled cylindrical duct with superimposed constant mean flow velocity U, the pressure ( )txrpp ,,,θ= , in cylindrical coordinates, as defined by Fig. 1, is found as a solution of the homogeneous convective wave equation,
01112
2
22
2
2
2
2 =∂∂
−⎟⎠⎞
⎜⎝⎛
∂∂
∂∂
−∂∂
−θ
prr
prrrx
pDt
pDc
(1)
where the substantive derivative is defined to be
∇+∂∂
= .UtDt
D

15th Int Symp on Applications of Laser Techniques to Fluid Mechanics Lisbon, Portugal, 05-08 July, 2010
- 3 -
Fig. 1. Polar coordinate system for a cylindrical duct, ( )tr ,,θ
This solution is found as a combination of the characteristic functions of equation (1) each of which satisfies specific boundary conditions. Rigorous treatments of the derivation of the separation-of -variables solution can be found in the literature, see Munjal for example (Munjal 1987). For the following assumptions that;
• The flow is incompressible and isentropic with negligible temperature gradients
• The mean flow speed, U = (Ux, 0, 0) is stationary with time
• The axial mean flow profile as well as the duct cross-sectional area is invariant in the axial direction
• The mean temperature and the density are stationary in space and time
the solution to the wave equation for the complex pressure can be given by a linear superposition of modal terms:
[ ] ϕϕ jmnm
n
xjknm
xjknm
merfeAeArxp nmnm )(),,(ˆ ,
0
)(,
)(,
,,∑∑∞
=
+−−+∞
−∞=
−+
+= (2)
where +nmA , and −
nmA , are the complex amplitudes of the modes, xk nm+
, and xk nm−
, are the axial wave numbers, and m and n are the azimuthal and radial mode indices respectively. The + superscript refers to the direction of flow whereas the − superscript indicates the parameter to be defined counter to the flow direction. For the case of a closed ended cavity, reflections from the end are accommodated through superposition of the modes in both axial directions which form standing waves. In the case of hard-walled acoustic boundary conditions, the modes form an orthogonal eigensystem, with a modal shape factor given by
nm
mnmnm N
RrJrf,
,)/()( σ
= (3)
for a non-annular cylinder. In equation (3), mJ is a Bessel function of the first kind of order m with associated hard-walled cylindrical eigenvalue nm,σ . R is the duct radius and in order to satisfy orthogonality the normalisation factor is calculated to be
))()()(()/(2 1122
0
2mnmmnmmnmmn
R
mmn JJJRdrRrJN σσσπσπ +−−== ∫
The normalisation transforms the orthogonal mode eigensystem into an orthonormal mode eigensystem. A mean flow can be accommodated in the formulation, when required, by

15th Int Symp on Applications of Laser Techniques to Fluid Mechanics Lisbon, Portugal, 05-08 July, 2010
- 4 -
modification of the axial wave numbers which are a function of the mode eigenvalue nm,σ and the free field propagation wave number, k, which are defined as follows
2βαmnx
mnMkk ±−
=± where 2
1 ⎟⎠⎞
⎜⎝⎛−=
kRmn
mnβαα and
21 xM−=β (4)
2.2 Modal Decomposition in Hard Walled Circular Ducts Modal decomposition is an advanced experimental technique which can provide detailed information of the modal content of sound propagating in ducts. When the wave number, ±
nmk , , in equation (4) is real, the mode (m,n) propagates energy along the duct. This occurs when the mode is excited above a cut-on frequency which depends on the mode eigenvalue and the duct radius. Modes excited below their cut-on frequency are evanescent and decay exponentially with distance along the duct. The dimensionless number which expresses the cut-on frequency independently of the radius is the term kR, or the Helmholtz number (He). Examples of some of these numbers are given in Table 1 for a simple duct with no mean flow or shear layer condition.
Table 1. Helmholtz numbers for lower order azimuthal and radial modes [kR or He]. No flow. m,n 0 1
0 0 3.831 1.84 5.332 3.05 6.71
The modal decomposition performed in this paper is based on the approach proposed by Abom (Abom 1989) whose objective is to measure the modal amplitudes of equation (2). This technique was implemented by Bennett (Bennett 2006) for experimental data, and the pressure field decomposed such that:
• Incident and reflected modes can be identified. • A mean flow can be accommodated. • Radial and azimuthal modes can be identified. • Duct-wall flush-mounted microphones only are used for the decomposition. • The decomposition is performed for all frequencies (within the range of interest). • Data is acquired at all locations simultaneously.
Abom's method of modal decomposition is carried out in two steps. Firstly an azimuthal decomposition is carried out with microphones equi-azimuthally spaced around the duct. By repeating this step at different axial locations, these modes can be decomposed into incident and reflected radial modes. A full description of this method may be found in Bennett (Bennett 2006).
From the literature, most research within the fluid-resonant category of cavity oscillation is restricted to longitudinal standing waves. This corresponds to plane waves of mode order (m, n)=(0, 0) propagating down the cavity and reflecting off the termination. However, if acoustic waves above a frequency corresponding to a Helmholtz number of He=1.84 are excited, then it is possible that the modal structure of the sound will be of a higher order. The purpose of performing a modal decomposition on the pressure field in the cavity is to identify the modal content of the standing waves modes at higher frequencies.

15th Int Symp on Applications of Laser Techniques to Fluid Mechanics Lisbon, Portugal, 05-08 July, 2010
- 5 -
3. Experimental Rig Design A cavity resonance experiment that incorporates a number of the above feedback mechanisms has been designed and constructed. As the rig was to be built using a small, low speed wind tunnel, preliminary analysis was required in order to optimally design the cavity given the imposed limitations.
In each of the three fluid-resonant oscillations considered in this paper, viz. Helmholtz Resonance, Longitudinal Resonance and Azimuthal Resonance, the acoustic excitation is assumed to be due to instability in the shear layer of flow over the cavity opening. The shear layer excitation frequency can be estimated using the empirical relationship suggested by Rossiter (Rossiter 1964). Given the low Mach number under consideration in the current paper (M < 0.15), the upstream-propagating acoustic feedback mechanism usually associated with Rossiter is not expected to occur in the present experiment, because the acoustic wavelength corresponding to the cavity opening length would be in the order of 8kHz, far higher than any expected shear layer oscillation frequency. Rossiter's equation for the shear layer excitation frequency, however, has been used by many authors to accurately model other feedback mechanisms(Ma, Slaboch and Morris 2009, Rodriguez et al. 2009). This equation is given as
κ
α1
+
−≈≡
M
nUfLSt (5)
where α describes the phase delay and κ is the convection velocity of the shear layer normalized by the free stream velocity and n = 1, 2, 3, is the order of the shear layer mode. For low subsonic speeds as presented here, 0=α has been used by Ma et al (Ma, Slaboch and Morris 2009), arguing that there is no need to consider a phase delay when the convection speed is much less than the speed of sound. As can be seen in equation (5), decreasing the characteristic length of the cavity opening, L, increases the excitation frequency for a given flow
speed. Similarly, from observation of Table 1, as c
k ω= ,
increasing the cavity diameter will result in lower cut-on frequencies for the higher order modes. Thus for the low tunnel speeds available, a large diameter and small orifice was required to achieve the test objectives allowing excitation of the three different fluid-resonance categories considered. A schematic of the rig can be seen in Fig. 2. The experiment consists of a 125mm square wind-tunnel test section, with an attached cylindrical cavity of 240mm internal diameter and 492mm height. The large diameter of the cylinder was selected in order to accommodate higher-order azimuthal acoustic modes. The first azimuthal mode should cut-on at 837Hz, and the second at 1387Hz for this diameter. Initially, a 40mm square opening with sharp edges connected the cavity to the wind tunnel, however, openings of different length and location relative to the cavity centerline were also tested.
Fig. 2. Schematic of rig illustrating orifice to closed ended cylindrical cavity.
3.1 Numerical Analysis – Wave Expansion Method (WEM). In order to verify the cavity design prior to construction, a series of numerical simulations were performed on a meshed domain of equal dimensions. A highly efficient finite difference method, originally introduced by Caruthers (Caruthers et al. 1996), was used for the analysis. The approach

15th Int Symp on Applications of Laser Techniques to Fluid Mechanics Lisbon, Portugal, 05-08 July, 2010
- 6 -
uses wave functions which are exact solutions of the governing differential equations to interpolate on the grid. This code has been examined by Bennett et al. (Bennett et al. 2009) for its applicability in ducts. In order to simulate an oscillation in the shear layer, a numerical monopole volume source was located at the orifice opening mid-point. The complex pressure is solved in the domain as a function of source frequency and the amplitude can be plotted on the mesh to give an indication of the pressure field in the cavity/windtunnel rig set-up. Some examples of the solution are given in Fig. 3.
(a) (b)
(c) (d)
Fig. 3. Numerical acoustic solution to monopole excitation at orifice opening of cavity and windtunnel test section. Four Helmholtz numbers are shown: a) He=0.78; b) He=1.85; c) He=2.0 and d) He=3.91
For each Helmholtz number, an isometric of the cavity/wind tunnel test section, as well as longitudinal and axial sections are displayed. The orifice or monopole source location is indicated by a circle which in this case is off-set from the cavity axis. The Helmholtz numbers chosen illustrate: the first plane wave “depth/height” or longitudinal mode (H1) in Fig. 3. (a); just above the cut-on frequency of the first azimuthal mode (ref. Table 1) in Fig. 3 (AZ1), (b); a combination azimuthal/longitudinal mode in Fig. 3 (AZ1H1) (c) and a combination radial/longitudinal mode in Fig. 3. (d). An awareness and understanding of these modes is necessary if a comprehensive understanding of the acoustic behavior of cavities is to be reached. Based on the results of this analysis, it was confirmed that this cavity geometry would allow all three fluid-resonant category configurations to be excited by a cavity orifice of approximately 40mm in the flow range of the wind tunnel available for the tests. 3.2 Test-set up A low speed LaVision PIV system was used. The seeding particles of DEHS were generated by
15th Int Symp on Applications of Laser Techniques to Fluid Mechanics Lisbon, Portugal, 05-08 July, 2010
- 7 -
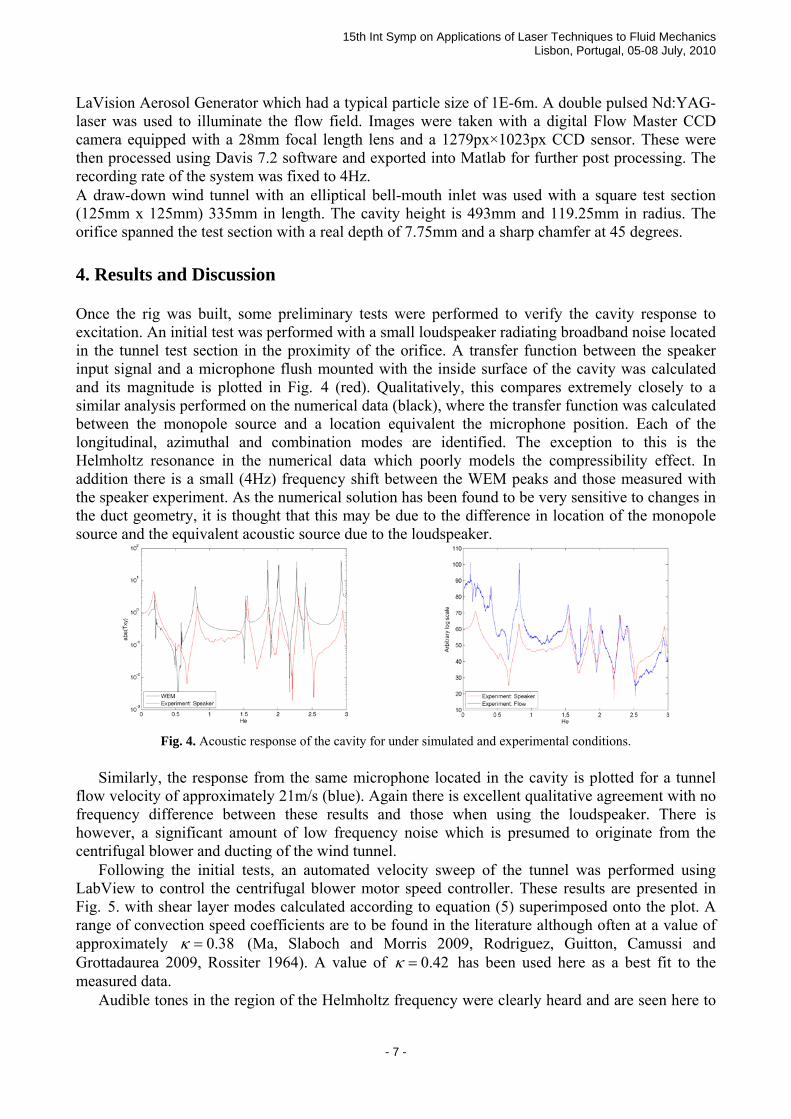
LaVision Aerosol Generator which had a typical particle size of 1E-6m. A double pulsed Nd:YAG-laser was used to illuminate the flow field. Images were taken with a digital Flow Master CCD camera equipped with a 28mm focal length lens and a 1279px×1023px CCD sensor. These were then processed using Davis 7.2 software and exported into Matlab for further post processing. The recording rate of the system was fixed to 4Hz. A draw-down wind tunnel with an elliptical bell-mouth inlet was used with a square test section (125mm x 125mm) 335mm in length. The cavity height is 493mm and 119.25mm in radius. The orifice spanned the test section with a real depth of 7.75mm and a sharp chamfer at 45 degrees. 4. Results and Discussion Once the rig was built, some preliminary tests were performed to verify the cavity response to excitation. An initial test was performed with a small loudspeaker radiating broadband noise located in the tunnel test section in the proximity of the orifice. A transfer function between the speaker input signal and a microphone flush mounted with the inside surface of the cavity was calculated and its magnitude is plotted in Fig. 4 (red). Qualitatively, this compares extremely closely to a similar analysis performed on the numerical data (black), where the transfer function was calculated between the monopole source and a location equivalent the microphone position. Each of the longitudinal, azimuthal and combination modes are identified. The exception to this is the Helmholtz resonance in the numerical data which poorly models the compressibility effect. In addition there is a small (4Hz) frequency shift between the WEM peaks and those measured with the speaker experiment. As the numerical solution has been found to be very sensitive to changes in the duct geometry, it is thought that this may be due to the difference in location of the monopole source and the equivalent acoustic source due to the loudspeaker.
Fig. 4. Acoustic response of the cavity for under simulated and experimental conditions.
Similarly, the response from the same microphone located in the cavity is plotted for a tunnel
flow velocity of approximately 21m/s (blue). Again there is excellent qualitative agreement with no frequency difference between these results and those when using the loudspeaker. There is however, a significant amount of low frequency noise which is presumed to originate from the centrifugal blower and ducting of the wind tunnel.
Following the initial tests, an automated velocity sweep of the tunnel was performed using LabView to control the centrifugal blower motor speed controller. These results are presented in Fig. 5. with shear layer modes calculated according to equation (5) superimposed onto the plot. A range of convection speed coefficients are to be found in the literature although often at a value of approximately 38.0=κ (Ma, Slaboch and Morris 2009, Rodriguez, Guitton, Camussi and Grottadaurea 2009, Rossiter 1964). A value of 42.0=κ has been used here as a best fit to the measured data.
Audible tones in the region of the Helmholtz frequency were clearly heard and are seen here to

15th Int Symp on Applications of Laser Techniques to Fluid Mechanics Lisbon, Portugal, 05-08 July, 2010
- 8 -
be excited at low flow speeds by the first shear layer instability mode (approx. 7m/s). The resonance frequency measured compares extremely well with a theoretical value of 74Hz superimposed on Fig. 5. Given the thin wall forming the neck of the resonator, an “equivalent neck” approach is used to calculate the Helmholtz resonance frequency as developed by Ma et al. (Ma, Slaboch and Morris 2009);
VlScfHR π2
= (6)
where S is the plan-view cross sectional opening of the orifice (40mmX40mm), l is the equivalent neck length (40mm), V is the volume of the cavity and c is the speed of sound.
Fig. 5. Acoustic response inside the cavity as a function of tunnel flow-speed. Superimposed on the plot are the
theoretical shear layer modes (equation 5) and also the three sets of fluid-resonant categories investigated. For higher flow speeds, an intense lock-in with the first cavity longitudinal mode (H1) is
generated, again by the first shear layer instability mode. The amplitude of this tone is so great that a non-linear response is generated which results in the first and second harmonics to be excited and is seen in the plot at higher frequencies. The lock-on subsequently drops out at higher velocities as the shear layer mode increases in frequency above the first longitudinal mode frequency. At higher velocities, the second shear layer mode locks on to the third longitudinal mode and switching between the two frequencies was audible. A time/frequency domain analysis on this data will be performed to further examine this process. The second and third shear layer modes also cause lock on with the H1 mode and amplification of the azimuthal and azimuthal combination modes (AZ1 and AZ1H1) is clearly evident at high velocities.
Also identified in Fig. 5 is the combination longitudinal mode

15th Int Symp on Applications of Laser Techniques to Fluid Mechanics Lisbon, Portugal, 05-08 July, 2010
- 9 -
of wind tunnel width and cavity height. As the shear layer is bounded, transverse to the flow direction, by the wind tunnel wall on one side and by the cavity termination on the other, the
Fig. 6. Photograph of rig showing the cavity, square test-section, wind-tunnel, microphone array and the PIV system.
first shear layer mode excites a standing wave which is formed between these two surfaces and can be seen to lock on at approximately 27m/s.
In order to gain further insight into the modal content of the peaks seen in Fig. 5, a full azimuthal decomposition was performed in the cavity. An array of microphones was mounted in two rings of eight such that they were flush mounted with the inside of the cavity. This configuration allows azimuthal modes of up to order Am=A3 to be resolved in both axial directions. A photograph of the rig is to be seen in Fig. 6. A radial mode analysis was not performed on this set-up as radial modes cut-on above the frequency range of interest.
A modal decomposition of the acoustic field inside the cavity for a flow speed of 21m/s using all sixteen of these microphones is given in Fig. 7. This is a very good result which shows clearly the modal content of the acoustic field in the cavity as a function of frequency, and agrees with the results given by the numerical analysis. Modes Am=A2 and Am=A3 have been included in the decomposition, but as they cut-on at higher frequencies (above He=3) their modal amplitudes are calculated as being insignificant. As expected, although the Am=A1 mode cuts-on at around He=1.84, it does not remain dominant for all frequencies, with the plane wave mode Am=A0 constituting the H3 standing wave resonance.
0 0.5 1 1.5 2 2.5 3x dB
(x + 20) dB
kR
SPL
(dB)
Decomposed Azimuthal Modes (Am)
(-3)(-2)(-1)(0)(+1)(+2)(+3)
HR H3 Az1H2 Az1H3H2 Az1H1
Az1H1
Fig. 7. Modal decomposition of the acoustic field inside the cavity for a flow speed of 21m/s.
A modal decomposition was performed at each velocity point in the range of the tunnel and the
dominant mode for each frequency bin is plotted in Fig. 8. The objective of this exercise was to see if there was a dependence of modal content on such parameters as flow speed, shear layer mode and lock-on. For low velocities, no change in modal content as a function of these parameters is to be observed. At higher velocities, however, this test is inconclusive due to the fact that the electret microphones used saturated above 36m/s due to their relatively high sensitivity and the high amplitude of the lock-on tone at high velocities. This means of presenting the data, via a waterfall plot, is seen to be most informative however, showing more detail than the standard colour plot of Fig. 5.
PIV measurements of the orifice region allow greater insight into the fluid dynamics of the shear layer to be gained. For specific frequencies such as those at lock on, coherent structures can be identified by phase averaging the images using a pressure signal in the cavity. Where the oscillation
15th Int Symp on Applications of Laser Techniques to Fluid Mechanics Lisbon, Portugal, 05-08 July, 2010
- 10 -
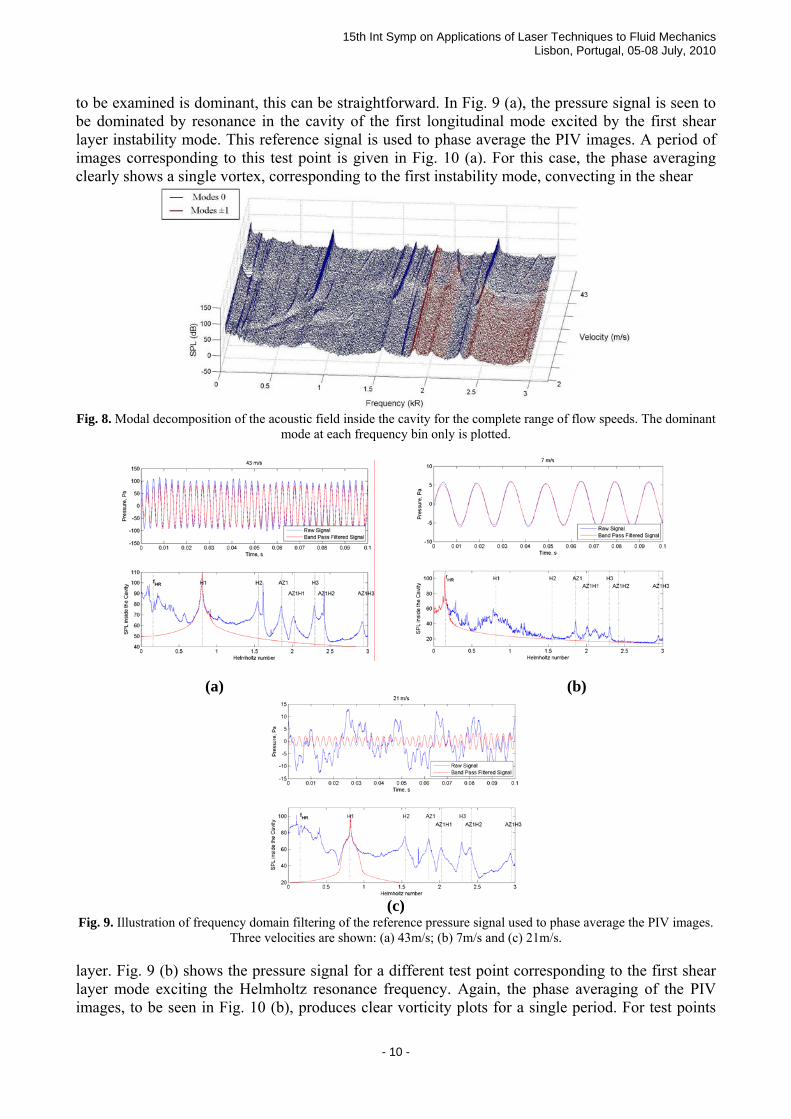
to be examined is dominant, this can be straightforward. In Fig. 9 (a), the pressure signal is seen to be dominated by resonance in the cavity of the first longitudinal mode excited by the first shear layer instability mode. This reference signal is used to phase average the PIV images. A period of images corresponding to this test point is given in Fig. 10 (a). For this case, the phase averaging clearly shows a single vortex, corresponding to the first instability mode, convecting in the shear
Fig. 8. Modal decomposition of the acoustic field inside the cavity for the complete range of flow speeds. The dominant
mode at each frequency bin only is plotted.
(a) (b)
(c)
Fig. 9. Illustration of frequency domain filtering of the reference pressure signal used to phase average the PIV images. Three velocities are shown: (a) 43m/s; (b) 7m/s and (c) 21m/s.
layer. Fig. 9 (b) shows the pressure signal for a different test point corresponding to the first shear layer mode exciting the Helmholtz resonance frequency. Again, the phase averaging of the PIV images, to be seen in Fig. 10 (b), produces clear vorticity plots for a single period. For test points
15th Int Symp on Applications of Laser Techniques to Fluid Mechanics Lisbon, Portugal, 05-08 July, 2010
- 11 -
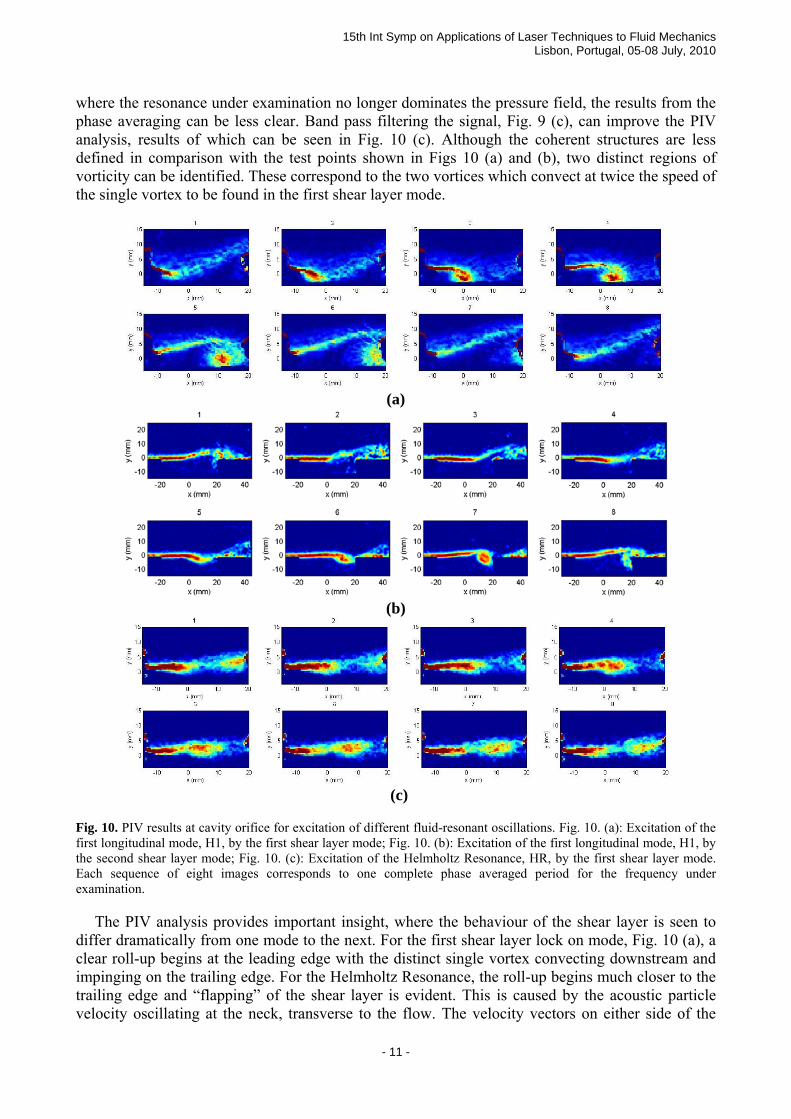
where the resonance under examination no longer dominates the pressure field, the results from the phase averaging can be less clear. Band pass filtering the signal, Fig. 9 (c), can improve the PIV analysis, results of which can be seen in Fig. 10 (c). Although the coherent structures are less defined in comparison with the test points shown in Figs 10 (a) and (b), two distinct regions of vorticity can be identified. These correspond to the two vortices which convect at twice the speed of the single vortex to be found in the first shear layer mode.
(a)
(b)
(c)
Fig. 10. PIV results at cavity orifice for excitation of different fluid-resonant oscillations. Fig. 10. (a): Excitation of the first longitudinal mode, H1, by the first shear layer mode; Fig. 10. (b): Excitation of the first longitudinal mode, H1, by the second shear layer mode; Fig. 10. (c): Excitation of the Helmholtz Resonance, HR, by the first shear layer mode. Each sequence of eight images corresponds to one complete phase averaged period for the frequency under examination.
The PIV analysis provides important insight, where the behaviour of the shear layer is seen to differ dramatically from one mode to the next. For the first shear layer lock on mode, Fig. 10 (a), a clear roll-up begins at the leading edge with the distinct single vortex convecting downstream and impinging on the trailing edge. For the Helmholtz Resonance, the roll-up begins much closer to the trailing edge and “flapping” of the shear layer is evident. This is caused by the acoustic particle velocity oscillating at the neck, transverse to the flow. The velocity vectors on either side of the

15th Int Symp on Applications of Laser Techniques to Fluid Mechanics Lisbon, Portugal, 05-08 July, 2010
- 12 -
shear layer for the test point corresponding to Fig. 10 (c), although not shown here, have been examined. Unlike the other two test cases, where the velocity vectors rotate clockwise in accordance with the phase point, facilitating roll-up, the vectors for the second shear layer mode remain parallel: in the direction of the flow above the shear layer and parallel but counter flow direction below the shear layer. This adverse shear layer behaviour explains the less distinct coherent structures, where the turbulent length scales decrease and are dissipated as the vortex convects downstream towards the trailing edge. In addition, examination of individual frames for this test point occasionally show only single vortices. This manifests as a peak in Fig. 5 at half the frequency, particularly clear at approximately 18m/s. There appears to be switching between the two shear layer modes for this velocity. The presence of the single vortex in some frames, whilst of great interest physically, tends to reduce the clarity of the phase averaged results.
5. Conclusions A cylindrical cavity experiment which allows different modes of resonant behaviour to be excited depending on flow speed and orifice geometry has been design and constructed. Specifically, modes falling into the fluid-resonant category, viz., Helmholtz resonance, Longitudinal resonance and Azimuthal resonance, have all been excited by different shear layer oscillation modes. Lock on between these different resonant modes and shear layer excitation has been clearly measured and observed to occur upon adjusting only the flow speed. An azimuthal acoustic modal decomposition was performed and verified the modal composition of the resonances. Phase averaged PIV allowed the coherent structures present in the shear layer to be examined and the interaction between the cavity resonance and the shear layer oscillation to be observed. Acknowledgements Dr. Stephens was supported as a visiting scholar at Trinity College by the Erasmus Mundus Master of Mechanical Engineering programme. References
Abom M (1989) Modal Decomposition in Ducts Based On Transfer Function Measurements Between Microphone Pairs. Journal of Sound and Vibration 135:95-114
Awny K, Ziada S (2008) Effect of Cavity Depth on Diametral Mode Excitation 9th International Conference on Flow-Induced Vibrations (FIV2008). Prague, Czech Republic,
Balasubramanian G, Crouse B, Freed D (2009) Numerical Simulation of Leakage Effects on Sunroof Buffeting of an Idealized Generic Vehicle 15th AIAA/CEAS Aeroacoustics Conference. Miama, Florida,
Bennett G (2006) Noise Source Identification For Ducted Fans Mechanical and Manufacturing Engineering. University of Dublin, Trinity College Dublin,
Bennett GJ, O'Reilly C, Tapken U, Liu H (2009) Modelling multi-modal sound transmission from point sources in ducts with flow using a wave-based method 16th International Congress on Sound and Vibration (ICSV16). Kraków, Poland,
Caruthers JE, Engels RC, Ravinprakash GK (1996) A wave expansion computational method for discrete frequency acoustics within inhomogeneous flows 2nd AIAA/CEAS Aeroacoustics Conference. State College, Pennsylvania,
Kook H, Mongeau L (2002) Analysis of the periodic pressure fluctuations induced by flow over a cavity. Journal of Sound and Vibration 251:823-846
Langtry RB, Spalart PR (2008) DES Investigation of a Baffle Device for Reducing Landing-Gear Cavity Noise 46th AIAA Aerospace Sciences Meeting and Exhibit. Reno, Nevada,
Ma R, Slaboch PE, Morris SC (2009) Fluid mechanics of the flow-excited Helmholtz resonator.

15th Int Symp on Applications of Laser Techniques to Fluid Mechanics Lisbon, Portugal, 05-08 July, 2010
- 13 -
Journal of Fluid Mechanics 623:1-26 Munjal ML (1987) Acoustics of Ducts and Mufflers. Wiley, Oshkai P, Geveci M, Rockwell D, Pollack M (2005) Imaging of acoustically coupled oscillations
due to flowpast a shallow cavity: effect of cavity length scale. Journal of Fluids and Structures 20:277-308
Oshkai P, Yan T (2008) Experimental investigation of coaxial side branch resonators. Journal of Fluids and Structures 24:589-603
Rockwell D, Naudascher E (1978) Review - Self-Sustaining Oscillations of Flow Past Cavities. J Fluid Eng-T Asme 100:152-165
Rodriguez F, Guitton A, Camussi R, Grottadaurea M (2009) Experimental Investigation of a Cylindrical Cavity 15th AIAA/CEAS Aeroacoustics Conference. Miami, Florida,
Rossiter JE (1964) Wind Tunnel Experiments on the flow over rectangular cavities at subsonic and transonic speeds. Technical Report 64037 RAE
Tonon D, Landry BJT, Belfroid SPC, Willems JFH, Hofmans GCJ, Hirschberg A (2010) Whistling of a pipe system with multiple side branches: Comparison with corrugated pipes. Journal of Sound and Vibration 329:1007-1024 DOI DOI 10.1016/j.jsv.2009.10.020
Yang Y, Rockwell D, Cody KL-F, Pollack M (2009) Generation of tones due to flow past a deep cavity: effect of streamwise length. Journal of Fluids and Structures 25:364-388