shear and bending response of rc captive columns · pdf fileshear and bending response of rc...
TRANSCRIPT

SSRG International Journal of Civil Engineering (SSRG-IJCE) – volume 4 Issue 7 – July 2017
ISSN: 2348 – 8352 www.internationaljournalssrg.org Page 29
Shear and Bending Response of RC Captive
Columns from the Lateral Load Ashwin Kumar
#1, Dr. D.T. Naveen Kumar
*2
#1Post Graduate student, ACSCE, Bangalore
#2 Associate Proffessor, ACSCE , Bangalore
Abstract- For functional or aesthetic reasons a huge
number of Reinforced Concrete (RC) structures are
built with workmanship infill. For architectural
necessities sometimes window or ventilator openings
introduced in the wall. Due to these openings captive-
column effect is formed in RC developments with such
halfway brick work infill prompts genuine quake shear
harms in sections. To reduce the potential for captive-
column damage induced by partial infill and the RC
frames behaviour with partial masonry infill under
lateral loading is studied in present work. The
instance of short sections subjected to seismic tremor
impacts is incorporated. A RC portal frame of span
5m and 3.5m height having opening percentages of
0.1%, 0.33% and 0.55% were introduced. It has been
observed from the results that, there is a linear
variation in the displacement up to 85%. There is an
increase in the Bending moment of Leeward column
curve shows the strut action. Also, there is a
decrement in lateral stiffness ratio curve with respect
to increase in opening area ratio curve which shows
the sudden variation in opening area ratio. There is
an increment in shear force up to 45% of H0/H ratio.
Keywords- Captive column, portal frame, masonry
infill, lateral load
I. INTRODUCTION
A. General
It is a general practice in developing countries to
provide brick masonry infill walls between the
columns and beams of reinforced concrete frame
structures. Such composite structures formed by the
combination of a moment resisting plane frame and
infill walls is termed as "in-filled frames" When
subjected to gravity loads only, the infill walls only
contribute their self-weight to overcome loads.
However, an infill wall will also participate in
resisting load through interaction with adjacent
structural elements under lateral loads. These infill
walls when compressed will carry a part of the load by
providing strut action to the frame. Therefore, the
infill walls contribute a surplus benefit during the
times of earthquakes and their effect needs to be
considered during analysis of in-filled frames.
In majority of hospitals, academic institutions and
commercial complexes, partial in-fills are provided to
attain light within the rooms. Partial in-fills are
provided in some of the cases like high narrow
windows on tall window sills; where openings are
provided at the top level of the panel for lighting and
ventilation generally in institutional class rooms, store
rooms, doctor's consulting rooms (hospitals) and so
on. Such gaps provided for light and ventilation
purposes result in captive column effect as shown in
fig. 1. It can be seen that the captive columns created
damages by breakage of the column on the
unsupported height.
Fig. 1: Failure pattern due to captive column effect
B. Objectives
It can be seen from various past structure, that
captive column could cause a serious damage to the
structure if it is not considered during design of the
structure. In order to avoid the consequences of
captive column, it is required to know the behaviour
of structure with captive column. Keeping this in view
the objectives for the present work are chosen as
follows:
To find the effect of length and size of
captive columns when it is subjected to lateral load
Finding the Shear force and Bending moment
of the column based on various heights, arrangements
and opening of non-structural masonry walls, by using
analysis software called SAP2000
To find the effect of position and percentage
of opening in masonry infill to captive columns.
1) Methodology
In this unit the methods which have been used in this
topic are explained. There is some basic information
about the software (SAP2000) which is used in this
thesis. In this chapter macro model and micro model
are the two types of methods are followed. Macro and

SSRG International Journal of Civil Engineering (SSRG-IJCE) – volume 4 Issue 7 – July 2017
ISSN: 2348 – 8352 www.internationaljournalssrg.org Page 30
micro model procedures are explained here and also
loading details, material properties, section properties
are designed here auto cadd drawings are drawn.
Modelling procedure have done by keeping Wo/W
ratio 0.1 as constant and height Ho/H ratio are varied .
Same procedure is repeated by keeping Wo/W ratio 1
as constant. There will be decrease in the diagonal
strut action when the percentage of opening increases
in the wall.
2) Result and discussion In this chapter the numerical result values are
tabulated and discussed. The result values are
graphically represented, the failure of strut action can
be easily determined. 1) Displacement, 2) Shear force,
3) Stiffness, 4) Lateral stiffness, 5) Shear force of
Leeward columns, 6)Bending moment of Leeward
column, 7)Bending moment of windward column,
8)Bending moment of windward column and Leeward
column, these are the result parameters which have
been used in this chapter
3) Conclusion
It contains the general conclusions they are drawn
from the present investigation using different models
and suggestions for the future work.
II. METHODOLOGY
A. Model description
In the last two decades it became clear that one
single strut element is unable to model the complex
behaviour of the infilled frames. As reported by many
researchers (Reflak and Faijfar 1991; Saneinejad and
Hobbs 1995; Buonopane and White 1999), the
bending moments and shearing forces in the frame
members cannot be replicated using a single diagonal
strut connecting the two loaded corners. More
complex models are called micro mode are too
proposed.
Fig 2: Infill frame with opening
Fig.3: Diagonal strut model showing the influence of
infill wall in a frame
Fig.4: Poor location of windows and door opening
Fig.5: Good location of windows and door opening
The frame members of the RC frame are modelled
with two dimensional elements having three degree of
freedom at each node. A masonry infill panel is
represented by two dimensional four node rectangular
plane stress elements having two degree of freedom at
SSRG International Journal of Civil Engineering (SSRG-IJCE) – volume 4 Issue 7 – July 2017
ISSN: 2348 – 8352 www.internationaljournalssrg.org Page 31
each node. The contact between infill and
corresponding bounding frame is represented by short
and very stiff three dimensional elements known as
link elements. After running the analysis, the axial
forces in the link elements are checked and link
elements that are in tension are identified and removed.
This iteration process is continued till no link elements
are in tension. The final stiffness of the frame is
calculated for the frame with no tension link elements.
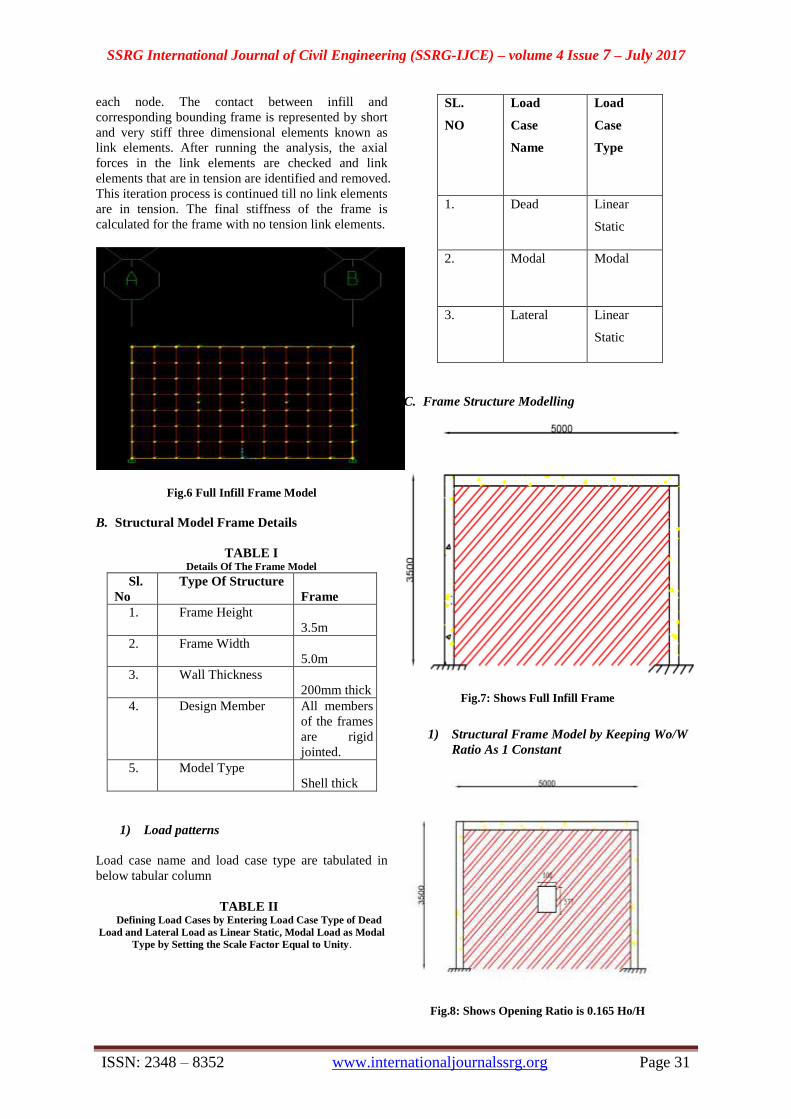
Fig.6 Full Infill Frame Model
B. Structural Model Frame Details
TABLE I Details Of The Frame Model
Sl.
No
Type Of Structure
Frame
1. Frame Height
3.5m
2. Frame Width
5.0m
3. Wall Thickness
200mm thick
4. Design Member All members
of the frames
are rigid
jointed.
5. Model Type
Shell thick
1) Load patterns
Load case name and load case type are tabulated in
below tabular column
TABLE II Defining Load Cases by Entering Load Case Type of Dead
Load and Lateral Load as Linear Static, Modal Load as Modal
Type by Setting the Scale Factor Equal to Unity.
SL.
NO
Load
Case
Name
Load
Case
Type
1. Dead Linear
Static
2. Modal Modal
3. Lateral Linear
Static
C. Frame Structure Modelling
Fig.7: Shows Full Infill Frame
1) Structural Frame Model by Keeping Wo/W
Ratio As 1 Constant
Fig.8: Shows Opening Ratio is 0.165 Ho/H

SSRG International Journal of Civil Engineering (SSRG-IJCE) – volume 4 Issue 7 – July 2017
ISSN: 2348 – 8352 www.internationaljournalssrg.org Page 32
Fig.9: Shows Opening Ratio is 0.33 Of Ho/H
Fig.10: Shows Opening Ratio is 0.50 Of Ho/H
Fig.11: Shows Opening Ratio is 0.66 of Ho/H
Fig.12: Shows Opening Ratio is 0.66 Of Ho/H
Fig.13: Shows Opening Ratio is 0.825 of Ho/H
2) Structural frame model by keeping Wo/W=1
as constant
Fig.14: Shows Opening Ratio is 0.165 Of Ho/H
Fig.15: Shows Opening Ratio is 0.33 Of Ho/H
Fig.16: Shows Opening Ratio is 0.50 Of Ho/H

SSRG International Journal of Civil Engineering (SSRG-IJCE) – volume 4 Issue 7 – July 2017
ISSN: 2348 – 8352 www.internationaljournalssrg.org Page 33
Fig.17: Shows Opening Ratio Is 0.66 Of Ho/H
Fig.18: Shows Opening Ratio is 0.825 of Ho/H
Fig.19: Shows Opening Ratio Is 0.66 of Ho/H
III. RESULTS AND DISCUSSIONS
A. General
In this unit, a portal frame spanning 5m to a height
of 3.5m is analysed using SAP2000 software by using
linear static method of analysis. Displacement, Lateral
Stiffness, Shear force and Bending Moments are
determined by varying the Ho/H ratio from 0.165 to
1.0.
The position of openings is determined by varying
the Ho/H ratio to corresponding Wo/W as 0.1 and 1.0.
The shear force and bending moment effects on
Leeward column and Windward column by varying
Ho/H between 0.165 and 1.0.
Analysis and results of different parameters are
considered as follows-
Displacement
Shear force
Stiffness
Lateral stiffness ratio
Shear force of Leeward column
Bending moment of Leeward column
Bending moment of Windward column
Bending moment of Leeward and Windward
column
Stress distribution
B. Results
1) Displacement values for Ho/H ratios from
0.165 to 1.0
TABLE III Displacement values for Ho/H ratio from 0.165 to 1.0
This graph represents the variation of displacement
along x-axis and H0/H ratio along y-axis. There is a
linear variation in the displacement from A to B.
There is a slight variation in the displacement from B
to C H0/H ratio. It shows there is a linear variation in
displacement from C to D H0/H ratio and it acts like a
bare frame
2) Shear force values for Ho/H ratios from
0.165 to 1.0
TABLE IV Shear force for Ho/H ratio from 0.165 to 1.
H0/H SHEAR
FORCE
0.165 4.35
0.330 7.35
0.500 7.59
0.660 3.18
H0/H
Displacement
(mm)
0.165
0.31
0.330
0.35
0.550
0.39
0.660
0.40
0.825
0.57
1.000
6.48

SSRG International Journal of Civil Engineering (SSRG-IJCE) – volume 4 Issue 7 – July 2017
ISSN: 2348 – 8352 www.internationaljournalssrg.org Page 34
Fig.20: Shear force for Ho/H ratio from 0.165 to 1.
This graph shows the variation of shear force (kN)
along y-axis and H0/H ratio along x-axis. There is
increment in shear force from points A to B of H0/H
ratio. There is a drastically decrement in the variation
of shear force from points B to C H0/H ratio. It shows
the strut action from point A to B H0/H ratio. From
point C it moves to bare frame action as shown in
above graph
3) Stiffness values for Ho/H ratios from 0.165
to 1.0
TABLE V Stiffness values for Ho/H ratios from 0.165 to 1.0
H0/H STIFFNES
(kN/mm)
0 88.65
0.165 79.28
0.330 70.02
0.500 63.16
0.660 58.00
0.850 43.55
1.000 3.85
Fig.21: Stiffness values for Ho/H ratios from 0.165 to 1.0
This graph shows the variation of stiffness (kN/mm)
along y-axis and HO/H ratio along x-axis. There is a
decrement in stiffness curve with respect to increase in
H0/H ratio. This graph shows sudden variation in H0/H
ratio after the F point of H0/H ratio. It shows the strut
action up to point F and after that it acts as a bare
frame
4) Lateral stiffness ratio values for Ho/H ratios
from 0.165 to 1.0
TABLE VI lateral Stiffness values for Ho/H ratios from 0.165 to 1.0
A0
LATERAL
STIFFNESS RATIO
1.650 89.43
3.300 78.99
5.000 71.24
6.600 68.00
8.500 49.12
10.00 4.34
Fig.22: Stiffness values for Ho/H ratios from 0.165 to
1.0
This graph shows the variation of lateral stiffness
ratio along y-axis and opening area ratio along x-axis.
Here there is a decrement in lateral stiffness ratio with
respect to increase in opening area ratio. This graph
shows the sudden variation in opening area ratio at
point D opening area ratio. It shows the strut action is
up to point D after that there is a bare frame action as
shown in above graph.

SSRG International Journal of Civil Engineering (SSRG-IJCE) – volume 4 Issue 7 – July 2017
ISSN: 2348 – 8352 www.internationaljournalssrg.org Page 35
5) Shear force of Leeward column values for
Ho/H ratios from 0.165 to 1.0
TABLE VII Shear force of Leeward column values for Ho/H ratios from
0.165 to 1.0
H0/H LEE
WARD
COLUMN-SF
(kN)
0.165 1.66
0.330 1.40
0.500 1.20
0.660 1.31
0.825 1.95
1.000 4.97
Fig. 23: Shear force of Leeward column values for
Ho/H ratios from 0.165 to 1.0
This graph shows the variation of shear force in lee
ward column along y-axis and Ho/H along x-axis.
This graph shows there is a decrement in the shear
force of leeward column up to point C. It shows the
strut action from points A to D of H0/H ratio. After the
strut action there is a huge difference varying curve
occurs which shows the bare frame action.
6) Bending moment of Leeward column values
for Ho/H ratios from 0.165 to 1.0
TABLE VIII Bending moment of Leeward column for Ho/H ratios from
0.165 to 1.0
H0/H LEEWARD
COLUMN –
BM (KN-M)
0.165 0.350
0.33 0.500
0.50 0.600
0.66 0.520
0.825 0.630
1.00 8.540
Fig.24: - Bending moment values for Ho/H ratios from
0.165 to 1.0
This graph shows the variation of Bending moment of
Leeward column along y-axis and Ho/H ratio along
x-axis. There is increment in bending moment of
Leeward column from points A to C of H0/H. There is
a drastically decrement in the variation of Bending
moment of Leeward column from points C to D of
H0/H ratio shows the bare frame action. It shows the
strut action from points B to D of BM of Leeward
column and sudden decrement shows the bare frame
action
7) Bending moment of Windward column
values for Ho/H ratios from 0.165 to 1.0
TABLE IX Bending moment of Leeward column values for Ho/H ratios
from 0.165 to 1.0
H0/H
WIND WARD
COLUMN -BM
(KNM)
0.165 1.50
0.330 2.70
0.500 3.22
0.660 1.30
0.825 1.50
1.000 9.38

SSRG International Journal of Civil Engineering (SSRG-IJCE) – volume 4 Issue 7 – July 2017
ISSN: 2348 – 8352 www.internationaljournalssrg.org Page 36
Fig.25: Bending moment of Leeward column values
for Ho/H ratios from 0.165 to 1.0
This graph shows the variation of Bending moment of
wind ward column along y-axis and Ho/H ratio along
x-axis. There is increment in Bending moment of wind
ward column from points A to C. It shows the strut
action. There is a sudden decrement after point D of
H0/H shows the bare frame action
8) Bending moment of Windward and Leeward
column values for Ho/H ratios from 0.165 to
1.0
Fig.26: Bending moment of windward and Lee ward
column values for Ho/H ratios from 0.165 to 1.0
This graph indicates the variation of bending moment
in leeward column and wind ward column along y-
axis with Ho/H along x-axis. In this graph it shows the
bending moment of windward column increases from
points A’ to C’ of h0/h and decreases suddenly at
points C’ of h0/h as shown in graph. It indicates the
strut action from points A’ to C’ of h0/h ratio and
sudden decrease shows bare frame action. In this
graph it also shows the variation of leeward column
bending moment. The increase from A to C of h0/h
ratio shows the strut action of leeward column of
bending moment and the sudden variation indicates
bare frame action
9) Shear force of lee ward column for wo/w = 1
TABLE X Shear Force of Lee Ward Column Values for Ho/H Ratio
from 0.165 To 1
Fig.27: Shear Force of Lee Ward Column Values for
Ho/H Ratio from 0.165 To 1
This graph indicates the variation of shear force of Lee
ward column. X-axis in terms of H0/H ratio, Y-axis in
terms of Shear force of Lee ward column. This graph
varies from 0.15– 0.55 of H0/H ratio and 13 – 22 lee
ward column Shear force (kN). In this graph there is
decrement in Lee ward column shear force from 0.15
to 0.35 of H0/H ratio. It shows the strut action from
0.15 to 0.35 of H0/H ratio. There is a sudden increase
occurs at 0.35 of H0/H ratio shows the bare frame
action
10) Bending moment of lee ward column for
wo/w = 1 as constant
H0/H
LEE WARD COLUMN
- SF (kN)
0.165 16.69
0.330 13.66
0.500 20.95
0.660 16.84
0.825 12.27
1.00 12.5
SSRG International Journal of Civil Engineering (SSRG-IJCE) – volume 4 Issue 7 – July 2017
ISSN: 2348 – 8352 www.internationaljournalssrg.org Page 37
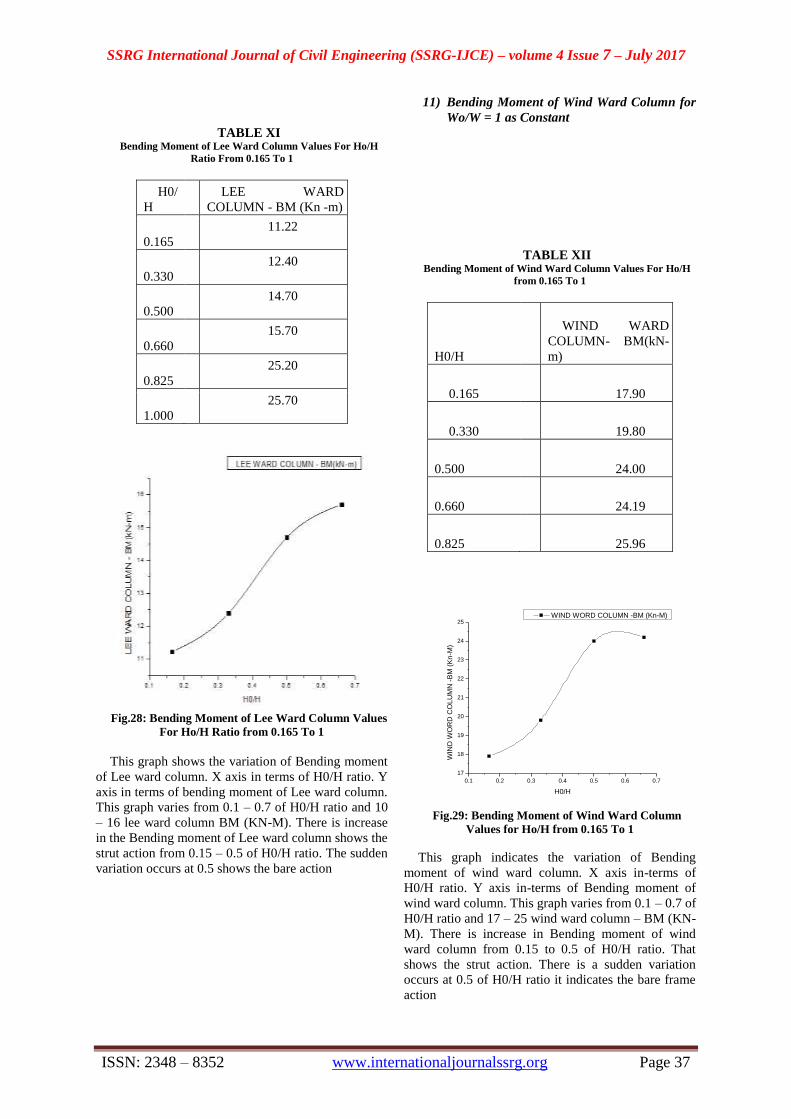
TABLE XI Bending Moment of Lee Ward Column Values For Ho/H
Ratio From 0.165 To 1
H0/
H
LEE WARD
COLUMN - BM (Kn -m)
0.165
11.22
0.330
12.40
0.500
14.70
0.660
15.70
0.825
25.20
1.000
25.70
Fig.28: Bending Moment of Lee Ward Column Values
For Ho/H Ratio from 0.165 To 1
This graph shows the variation of Bending moment
of Lee ward column. X axis in terms of H0/H ratio. Y
axis in terms of bending moment of Lee ward column.
This graph varies from 0.1 – 0.7 of H0/H ratio and 10
– 16 lee ward column BM (KN-M). There is increase
in the Bending moment of Lee ward column shows the
strut action from 0.15 – 0.5 of H0/H ratio. The sudden
variation occurs at 0.5 shows the bare action
11) Bending Moment of Wind Ward Column for
Wo/W = 1 as Constant
TABLE XII Bending Moment of Wind Ward Column Values For Ho/H
from 0.165 To 1
H0/H
WIND WARD
COLUMN- BM(kN-
m)
0.165 17.90
0.330 19.80
0.500 24.00
0.660 24.19
0.825 25.96
0.1 0.2 0.3 0.4 0.5 0.6 0.7
17
18
19
20
21
22
23
24
25
WIN
D W
OR
D C
OL
UM
N -
BM
(K
n-M
)
H0/H
WIND WORD COLUMN -BM (Kn-M)
Fig.29: Bending Moment of Wind Ward Column
Values for Ho/H from 0.165 To 1
This graph indicates the variation of Bending
moment of wind ward column. X axis in-terms of
H0/H ratio. Y axis in-terms of Bending moment of
wind ward column. This graph varies from 0.1 – 0.7 of
H0/H ratio and 17 – 25 wind ward column – BM (KN-
M). There is increase in Bending moment of wind
ward column from 0.15 to 0.5 of H0/H ratio. That
shows the strut action. There is a sudden variation
occurs at 0.5 of H0/H ratio it indicates the bare frame
action
SSRG International Journal of Civil Engineering (SSRG-IJCE) – volume 4 Issue 7 – July 2017
ISSN: 2348 – 8352 www.internationaljournalssrg.org Page 38
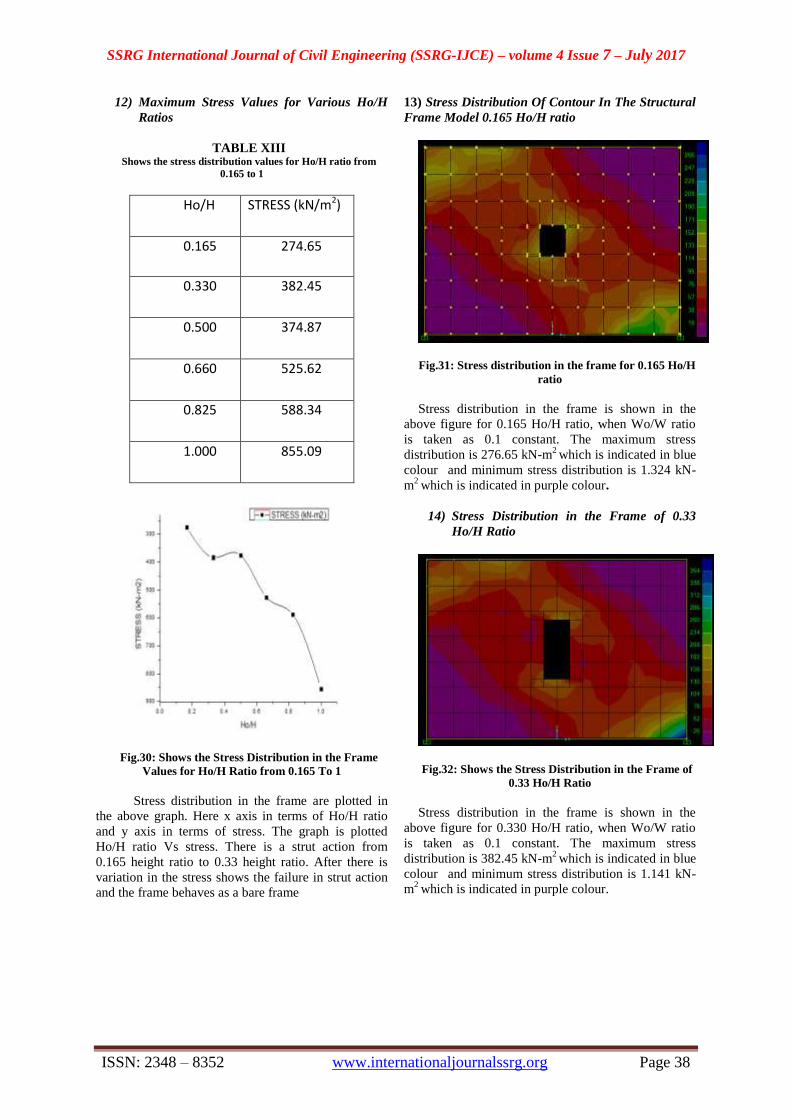
12) Maximum Stress Values for Various Ho/H
Ratios
TABLE XIII Shows the stress distribution values for Ho/H ratio from
0.165 to 1
Ho/H STRESS (kN/m2)
0.165 274.65
0.330 382.45
0.500 374.87
0.660 525.62
0.825 588.34
1.000 855.09
Fig.30: Shows the Stress Distribution in the Frame
Values for Ho/H Ratio from 0.165 To 1
Stress distribution in the frame are plotted in
the above graph. Here x axis in terms of Ho/H ratio
and y axis in terms of stress. The graph is plotted
Ho/H ratio Vs stress. There is a strut action from
0.165 height ratio to 0.33 height ratio. After there is
variation in the stress shows the failure in strut action
and the frame behaves as a bare frame
13) Stress Distribution Of Contour In The Structural
Frame Model 0.165 Ho/H ratio
Fig.31: Stress distribution in the frame for 0.165 Ho/H
ratio
Stress distribution in the frame is shown in the
above figure for 0.165 Ho/H ratio, when Wo/W ratio
is taken as 0.1 constant. The maximum stress
distribution is 276.65 kN-m2 which is indicated in blue
colour and minimum stress distribution is 1.324 kN-
m2
which is indicated in purple colour.
14) Stress Distribution in the Frame of 0.33
Ho/H Ratio
Fig.32: Shows the Stress Distribution in the Frame of
0.33 Ho/H Ratio
Stress distribution in the frame is shown in the
above figure for 0.330 Ho/H ratio, when Wo/W ratio
is taken as 0.1 constant. The maximum stress
distribution is 382.45 kN-m2 which is indicated in blue
colour and minimum stress distribution is 1.141 kN-
m2
which is indicated in purple colour.

SSRG International Journal of Civil Engineering (SSRG-IJCE) – volume 4 Issue 7 – July 2017
ISSN: 2348 – 8352 www.internationaljournalssrg.org Page 39
15) Stress Distribution in the Frame of 0.50
Ho/H Ratio
Fig.33: Shows the Stress Distribution in the frame of
0.50 Ho/H Ratio
Stress distribution in the frame is shown in the
above figure for 0.50 Ho/H ratio, when Wo/W ratio is
taken as 0.1 constant. The maximum stress
distribution is 374.87 kN-m2 which is indicated in blue
colour and minimum stress distribution is 0.385 kN-
m2
which is indicated in purple colour
16) Stress Distribution in the frame of 0.66
Ho/H Ratio
Fig.34: Shows the stress distribution in the frame of
0.66 Ho/H ratio
Stress distribution in the frame is shown in the
above figure for 0.66 Ho/H ratio, when Wo/W ratio is
taken as 0.1 constant. The maximum stress
distribution is 525.62 kN-m2 which is indicated in blue
colour and minimum stress distribution is 1.45 kN-
m2
which is indicated in purple colour
17) Stress Distribution in the frame of 0.825
Ho/H Ratio
Fig.35: Shows the stress distribution in the frame of
0.825 Ho/H ratio
Stress distribution in the frame is shown in the
above figure for 0.825 Ho/H ratio, when Wo/W ratio
is taken as 0.1 constant. The maximum stress
distribution is 588.34 kN-m2 which is indicated in blue
colour and minimum stress distribution is 3.797 kN-m
2
which is indicated in purple colour
18) Stress Distribution in the frame of 1.0 Ho/H
Ratio
Fig.36: Shows the stress distribution in the frame of
1.0 Ho/H
Stress distribution in the frame is shown in the
above figure for 1.0 Ho/H ratio, when Wo/W ratio is
taken as 0.1 constant. The maximum stress
distribution is 855.09 kN-m2 which is indicated in blue
colour and minimum stress distribution is 6.07 kN-m
2
which is indicated in purple colour

SSRG International Journal of Civil Engineering (SSRG-IJCE) – volume 4 Issue 7 – July 2017
ISSN: 2348 – 8352 www.internationaljournalssrg.org Page 40
19) Stress Distribution of Contour in the Structural
Frame Model by Keeping Wo/W Ratio As unity
1) Stress Distribution in the frame of 0.165
Ho/H Ratio
Fig.37: Shows the stress distribution in the frame of
0.165 Ho/H ratio
Stress distribution in the frame is shown in the
above figure for 0.165 Ho/H ratio, when Wo/W ratio
is taken as 1 constant. The maximum stress
distribution is 867.54 kN-m2 which is indicated in blue
colour and minimum stress distribution is 2.567 kN-
m2
which is indicated in purple colour
4.13.2 Stress Distribution in the Frame of 0.33
Ho/H Ratio
Fig.38: Shows the stress distribution in the frame of
0.33 Ho/H ratio
Stress distribution in the frame is shown in the
above figure for 0.33 Ho/H ratio, when Wo/W ratio is
taken as 1 constant. The maximum stress distribution
is 1051.29 kN-m2
which is indicated in blue colour
and minimum stress distribution is 1.898 kN-m2
which
is indicated in purple colour
4.13.3 Stress Distribution in the frame of 0.50
Ho/H Ratio
Fig.39: Shows the stress distribution in the frame of
0.50 Ho/H
Stress distribution in the frame is shown in the
above figure for 0.50 Ho/H ratio, when Wo/W ratio is
taken as 1 constant. The maximum stress distribution
is 1377.46 kN-m2
which is indicated in blue colour
and minimum stress distribution is 10.94 kN-m2
which
is indicated in purple colour
4.13.4 Stress Distribution in the Frame of 0.50
Ho/H Ratio
Fig.40: Stress distribution in the frame of 0.66 Ho/H
ratio
Stress distribution in the frame is shown in the
above figure for 0.66 Ho/H ratio, when Wo/W ratio is
taken as 0.1 constant. The maximum stress
distribution is 1528.08 kN-m2
which is indicated in
blue colour and minimum stress distribution is 4.86
kN-m2
which is indicated in purple colour

SSRG International Journal of Civil Engineering (SSRG-IJCE) – volume 4 Issue 7 – July 2017
ISSN: 2348 – 8352 www.internationaljournalssrg.org Page 41
4.12.5 Stress Distribution in the frame of 0.825
Ho/H Ratio
Fig.41: Stress distribution in the frame of 0.825 Ho/H
ratio
Stress distribution in the frame is shown in the
above figure for 0.165 Ho/H ratio, when Wo/W ratio
is taken as 0.1 constant. The maximum stress
distribution is 1187.66 kN-m2
which is indicated in
blue colour
and minimum stress distribution is zero
which is indicated in purple colour
IV. CONCLUSIONS
1. It is observed that there is not much variation
in lateral displacement up to 85% and thereafter a
sudden increase in displacement with increase in the
value of percentage of opening.
2. Shear force increases with increase in value
of H0/H ratio up to 45% and there after it decreases
with further increase in the value of percentage of
opening.
3. There is a decrement in stiffness values with
increase in H0/H ratio and the sudden variation in
H0/H ratio at 85% of H0/H ratio shows that strut
action up to 85% after that it acts as a bare frame.
4. There is an increment in bending moment of
windward column from 0.15 to 3.25 indicating strut
action. There is a sudden decrement at 0.5 of H0/H
shows the bare frame action
5. The decrement in leeward column shear force
from 0.15 to 0.35 of H0/H ratio. It shows the strut
action from 0.15 to 0.35 of H0/H ratio. The sudden
increase occurs at 0.35 of H0/H ratio shows the bare
frame
6. There is an increase in the Bending moment
of Lee word column curve shows the strut action from
0.15 – 0.5 of H0/H ratio .The sudden variation occurs
at 0.5 shows the bare action
7. There is an increase in Bending moment of
wind ward column from 0.15 to 0.5 of H0/H
ratio .That shows the strut action There is a sudden
variation occurs at 0.5 of H0/H ratio it indicates the
Bare frame action
8. Stress distribution of contour in the frame
shows the maximum stress value 382.45 kN-m2 and
minimum stress value 1.141 kN-m2 for the opening
Ho/H ratio of 0.330 and Wo/W ratio is taken 0.1
constant. when the percentage of opening increases
the strut action decreases
9. Stress distribution of contour in the frame
maximum values are always indicated in blue colour
and minimum value always indicated in purple colour
10. When Wo/W ratio is taken as unity constant,
abnormal stress values are obtained
SCOPE OF FURTHER STUDY
1. The dissertation study has been carried out by
selecting framed structure, in additional it can be
carried with multi storey buildings
2. The dissertation study has been carried out by
selecting framed structure, in additional to it , it can be
carried by considering different loading.
REFERENCES
[1]. Mainstone (1971) and Mainstone and Week (1970)
“Performed monotonic Experiments on full-scale concrete-encased
steel frames in-filled with masonry panels”
[2]. P.M. Pradhan et al. (2012), “ a review on partial in-filled frames under lateral loads”
[3]. Al-Chaar et al. (2002) tested for ½ scale, single story,
masonry in-filled non-ductile frames, under monotonic static loading
[4]. Diptesh Das and C.V.R. Murty., (2004), “Brick masonry
infills in seismic design of RC framed Buildings”, Part-2 Behaviour, Indian Concrete Journal, pp. 31-38.
[5]. C.V.R. Murthy., (2005), IITK BMTPC “Earthquake Tips
Learning Earthquake Design and Construction”, National Information Centre of Earthquake Engineering, IIT Kanpur, India.
[6]. Pankaj Agarwal and Manish Shrikande, (2011),
Earthquake Resistant Design of Structures, Prentice Hall of India Private Limited, New Delhi, India.
[7]. Diana, M. Samoila. (2012) “Analytical Modelling of
Masonry Infills”, Civil Engineering & Architecture, Vol. 55 No. 2 [8]. Yuh-When Liou et al.(2012), “ Experimental and
analytical study of masonry infilled frames”
[9]. S.Saravannan et al.(2014), “Captive column effect in cold formed steel frame with partially infilled cement bonded
particle board under lateral monotonic loading”