shashi shekhar - · agggg g g pregate functions on neighbor relationships balance statistical...
TRANSCRIPT

Shashi Shekhar
Affiliation: Faculty of Computer Sc. and Eng., Univ. of Minnesotawww.cs.umn.edu/~shekhar
Collaboration Profile:• Role : Build novel data analysis tools • To facilitate science engineering or medicineTo facilitate science, engineering or medicine• Near future opportunities
• NSF Cyber-driven Discovery and Innovation, NSF/CISE/IIS, …• Research Focus: Spatial Database, Spatial Data MiningResearch Focus: Spatial Database, Spatial Data Mining
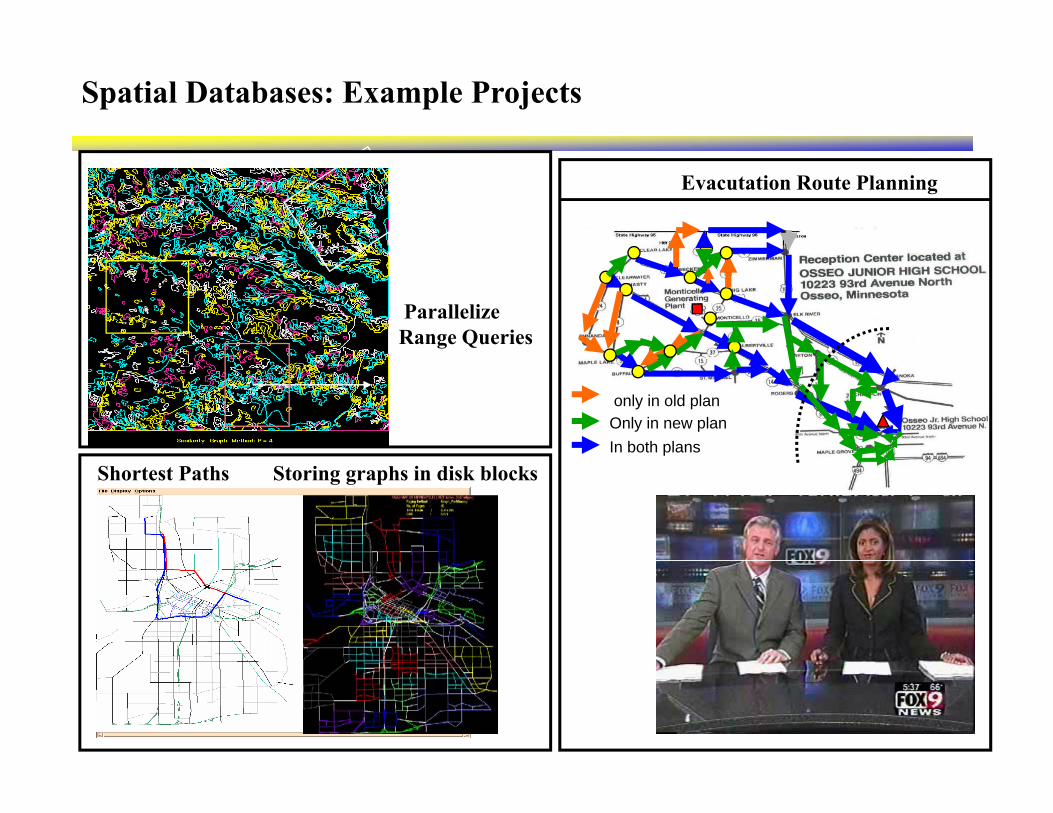
Spatial Databases: Example Projects
Evacutation Route Planning
Parallelize Range Queries
only in old planOnly in new plan In both plans
Storing graphs in disk blocksShortest Paths
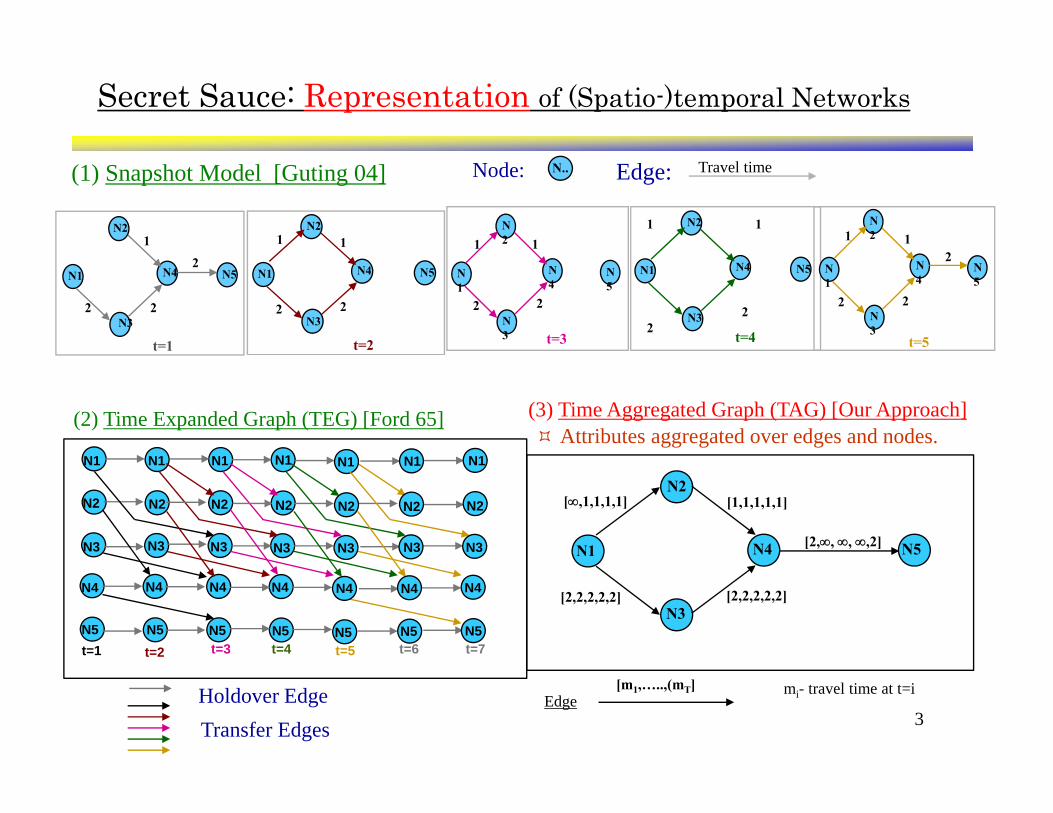
Secret Sauce: Representation of (Spatio-)temporal Networks
N21
N211
N2 11
N2 11 N2 1
21
N..Node: Travel timeEdge:(1) Snapshot Model [Guting 04]
t=1
N1
N3
N4 N5
2
2
2
t=2
N1
N3
N4 N5
22
t=3
N1
N3
N4
N5
22
t=4
N1
N3
N4 N5
22
t=5
N1
N3
N4
N5
2
22
(2) Time Expanded Graph (TEG) [Ford 65]
N1 N1 N1N1 N1 N1 N1Attributes aggregated over edges and nodes.
(3) Time Aggregated Graph (TAG) [Our Approach]
N1
N2
N3
N1
N2
N3
N1
N2
N3
N1
N2
N3
N1
N2
N3
N1
N2
N3
N1
N2
N3 N1
[∞,1,1,1,1] [1,1,1,1,1]
[2,∞, ∞, ∞,2]
N2
N4 N5
t=1
N4
N5t=2
N4
N5t=3
N4
N5t=4
N4
N5
N4
N5t=5
N4
N5t=6
N4
N5t=7
[2,2,2,2,2] [2,2,2,2,2]N3
3Holdover EdgeTransfer Edges
[m1,…..,(mT] mi- travel time at t=iEdge
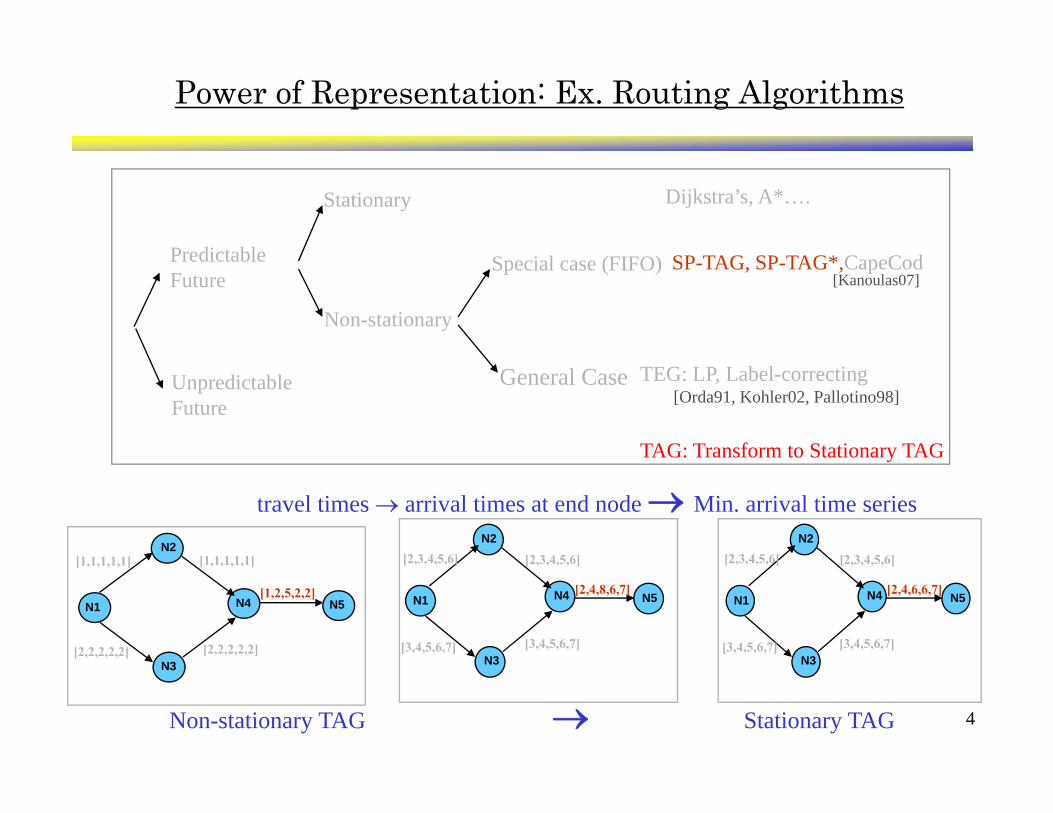
Power of Representation: Ex. Routing Algorithms
Predictable
Stationary Dijkstra’s, A*….
SP-TAG, SP-TAG*,CapeCodPredictable Future
Non-stationary
Special case (FIFO)[Kanoulas07]
Unpredictable Future
General Case TEG: LP, Label-correcting
TAG: Transform to Stationary TAG
[Orda91, Kohler02, Pallotino98]
y
N2[1 1 1 1 1] [1 1 1 1 1]
N2[2 3 4 5 6] [2 3 4 5 6]
N2[2 3 4 5 6] [2 3 4 5 6]
travel times → arrival times at end node → Min. arrival time series
N1
N3
N4 N5
[1,1,1,1,1] [1,1,1,1,1]
[2,2,2,2,2] [2,2,2,2,2]
[1,2,5,2,2] N1
N3
N4 N5
[2,3,4,5,6]
[3,4,5,6,7]
[2,3,4,5,6]
[2,4,6,6,7]
[3,4,5,6,7]
N1
N3
N4 N5
[2,3,4,5,6]
[3,4,5,6,7]
[2,3,4,5,6]
[2,4,8,6,7]
[3,4,5,6,7]
4
N3 N3N3
Non-stationary TAG → Stationary TAG
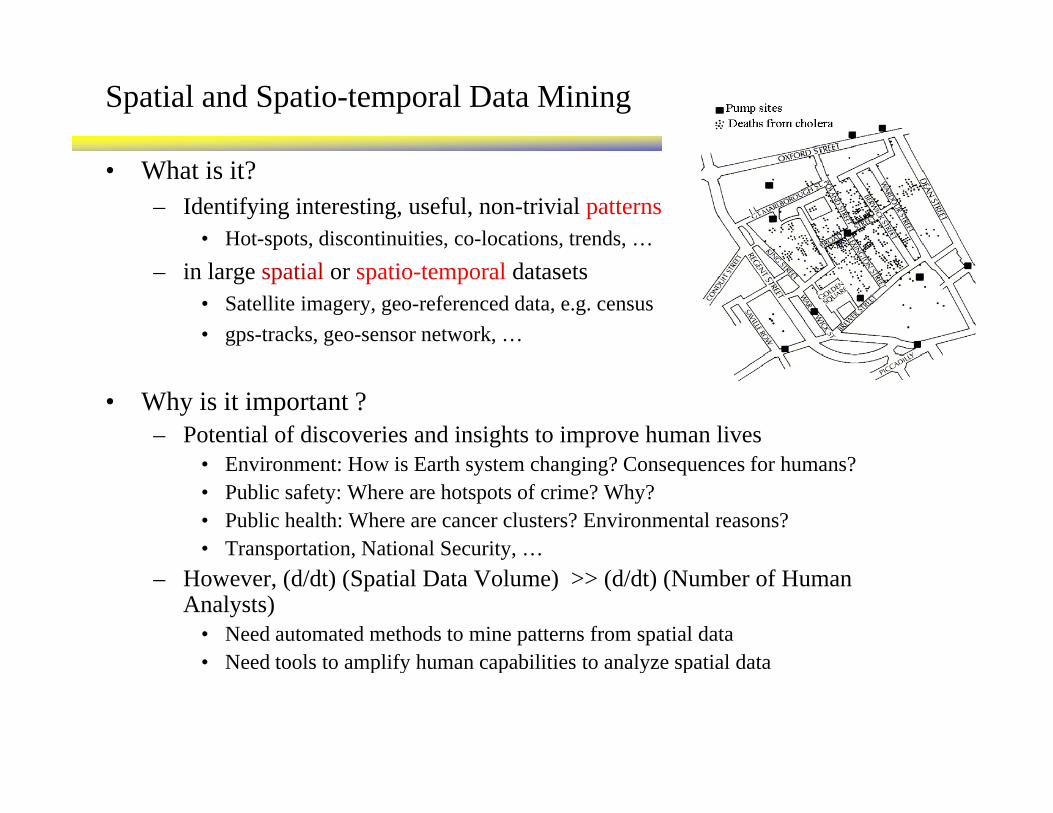
Spatial and Spatio-temporal Data Mining
• What is it?– Identifying interesting, useful, non-trivial patterns
• Hot-spots, discontinuities, co-locations, trends, …– in large spatial or spatio-temporal datasets
• Satellite imagery, geo-referenced data, e.g. census• gps-tracks, geo-sensor network, …
• Why is it important ?– Potential of discoveries and insights to improve human lives
E i H i E h h i ? C f h ?• Environment: How is Earth system changing? Consequences for humans?• Public safety: Where are hotspots of crime? Why?• Public health: Where are cancer clusters? Environmental reasons?• Transportation, National Security, …
– However, (d/dt) (Spatial Data Volume) >> (d/dt) (Number of Human Analysts)
• Need automated methods to mine patterns from spatial data• Need tools to amplify human capabilities to analyze spatial data• Need tools to amplify human capabilities to analyze spatial data
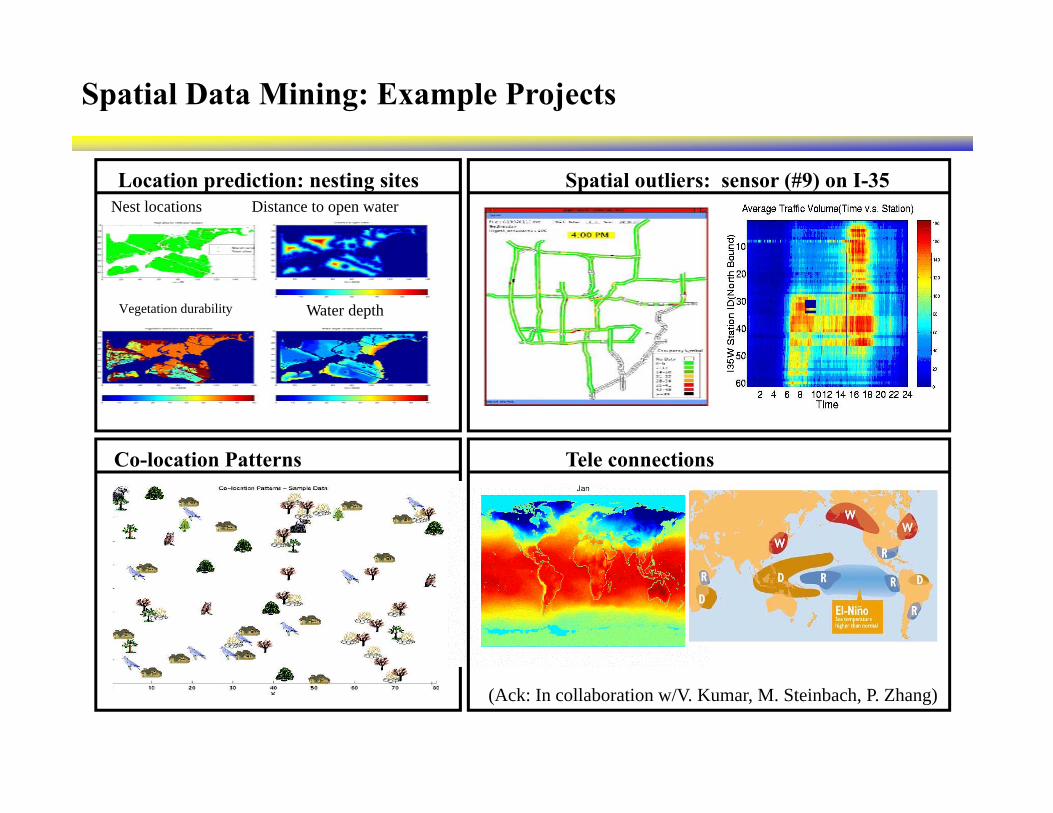
Spatial Data Mining: Example Projects
Nest locations Distance to open waterLocation prediction: nesting sites Spatial outliers: sensor (#9) on I-35
Vegetation durability Water depth
Co location Patterns Tele connectionsCo-location Patterns Tele connections
(Ack: In collaboration w/V. Kumar, M. Steinbach, P. Zhang)
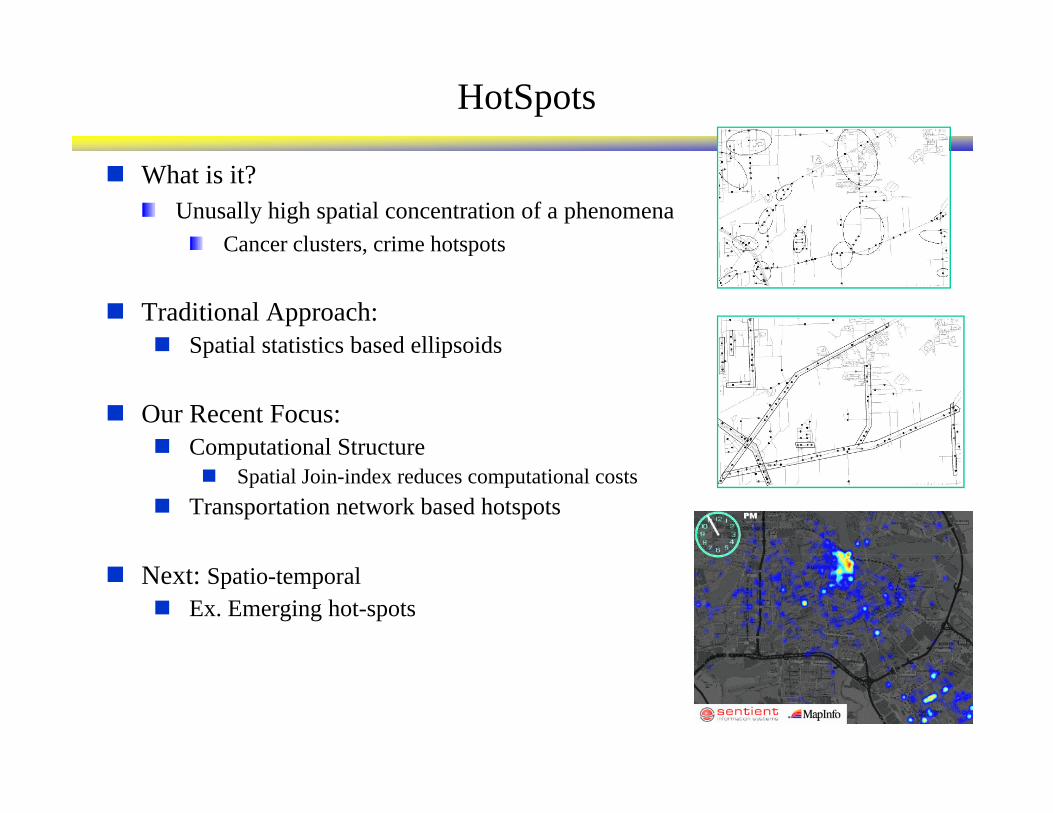
HotSpots
What is it?Unusally high spatial concentration of a phenomena
Cancer clusters, crime hotspots, p
Traditional Approach:Spatial statistics based ellipsoidsp p
Our Recent Focus:Computational Structure p
Spatial Join-index reduces computational costsTransportation network based hotspots
Next: Spatio-temporalEx. Emerging hot-spots
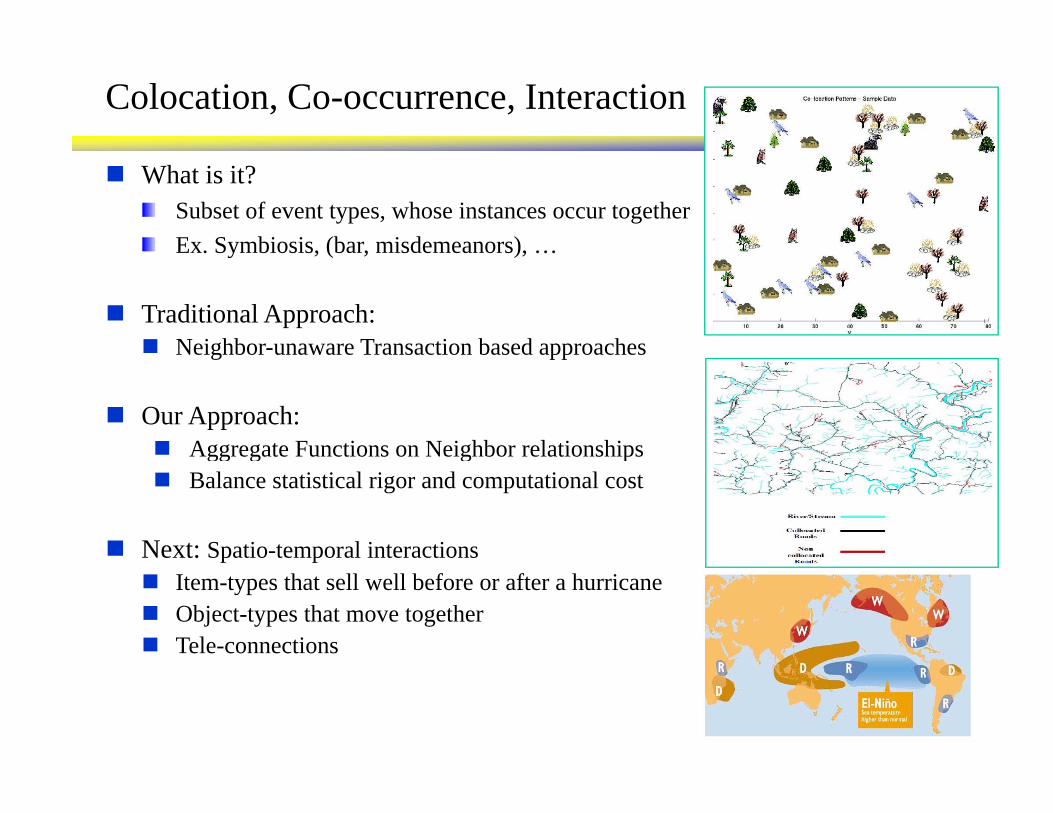
Colocation, Co-occurrence, Interaction
What is it?Subset of event types, whose instances occur togetherEx. Symbiosis, (bar, misdemeanors), …. Sy b os s, (ba , sde ea o s), …
Traditional Approach:Neighbor-unaware Transaction based approachesg pp
Our Approach:Aggregate Functions on Neighbor relationshipsgg g g pBalance statistical rigor and computational cost
Next: Spatio-temporal interactionsp pItem-types that sell well before or after a hurricaneObject-types that move together Tele-connections
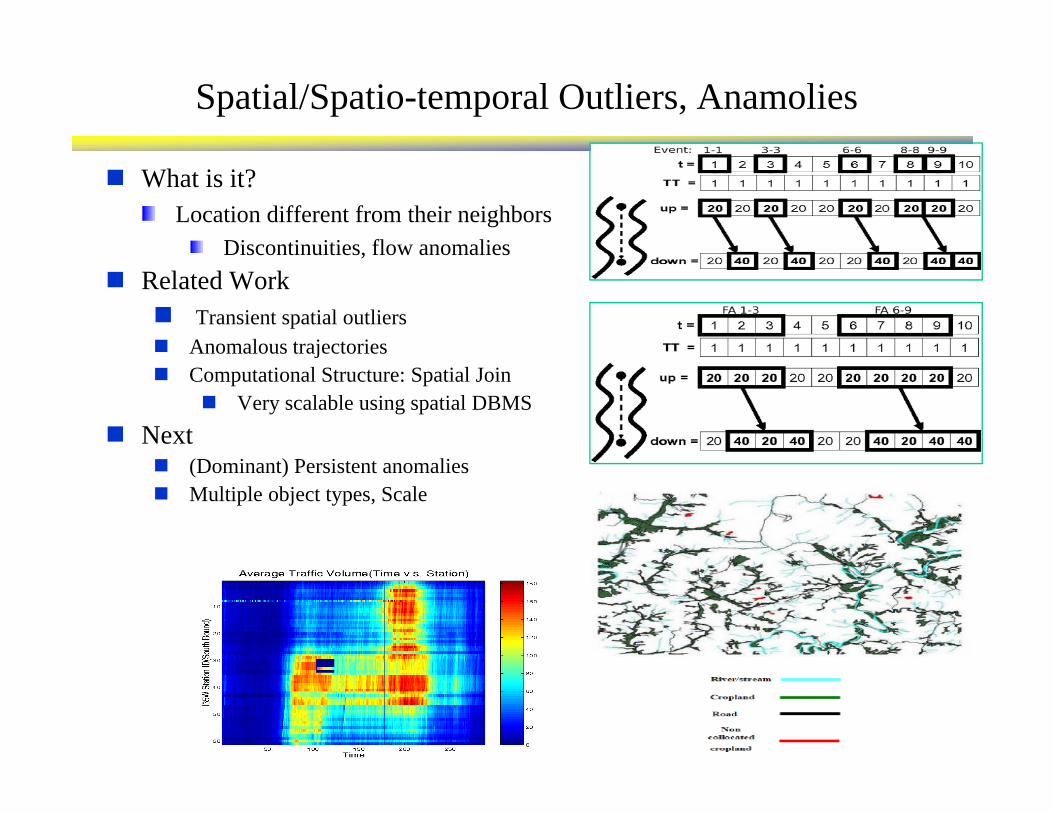
Spatial/Spatio-temporal Outliers, Anamolies
What is it?Location different from their neighbors
Discontinuities, flow anomaliesDiscontinuities, flow anomaliesRelated Work
Transient spatial outliersAnomalous trajectoriesjComputational Structure: Spatial Join
Very scalable using spatial DBMSNext
(Dominant) Persistent anomaliesMultiple object types, Scale
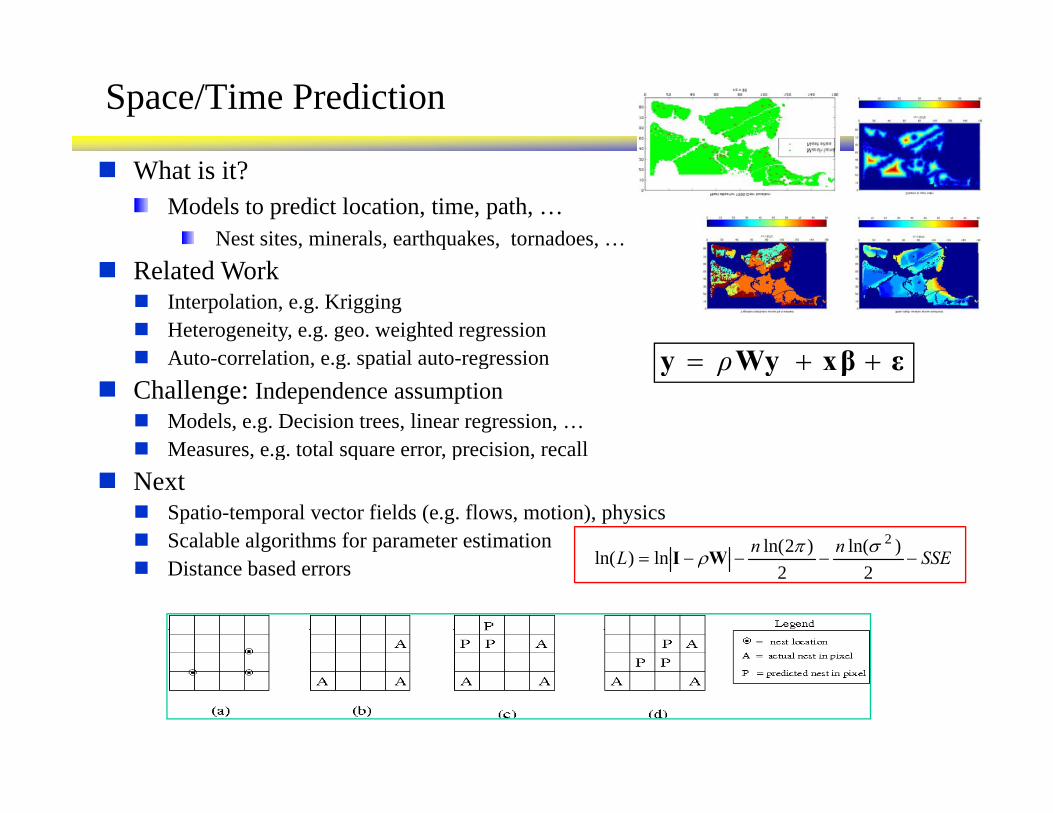
Space/Time Prediction
What is it?Models to predict location, time, path, …
Nest sites, minerals, earthquakes, tornadoes, …Related Work
Interpolation, e.g. KriggingHeterogeneity, e.g. geo. weighted regressionAuto correlation e g spatial auto regression βW ++Auto-correlation, e.g. spatial auto-regression
Challenge: Independence assumption Models, e.g. Decision trees, linear regression, …Measures, e.g. total square error, precision, recall
εxβWyy ++= ρ
, g q , p ,Next
Spatio-temporal vector fields (e.g. flows, motion), physicsScalable algorithms for parameter estimation
SSEnnL −−−−=)ln()2ln(ln)ln(
2σπρWIDistance based errors SSEL =
22ln)ln( ρWI