sharing american style - gap inc. · pdf fileour competitive advantage lies in offering our...
TRANSCRIPT

2011 Annual Report
Sharing american
Style

around the world.

Dear Shareholders,
I’m proud to present my fifth Annual Report for Gap Inc.
Looking back over the past five years, amid many changing market dynamics, what stands out to me is our firm com-mitment to the strategy that we began to seed in 2007 and that has been evolving ever since.
In my first annual report, I wrote that “Our long-term strategy is anchored on maximizing the earnings potential of our brands and taking advantage of the many opportunities through our Outlet, inter-national and online businesses.”
I’m pleased that we made further progress against our strategy last year. While doing so, we had to fine tune the performance of our domestic business, as we managed through some unique macro events.
Although we were disappointed by our overall financial results, including an earnings decline for the first time since 2006, all of us at Gap Inc. remain stead-fast in our commitment to increasing shareholder value.
What you will see in this annual report is the further realization of our vision: Sharing American Style Around the World.
2011 gap inc. annual report
continued

ToTAl numbeR of sToRes
3,263“Our distinctively
American aesthetic has resonated very well, everywhere from Milan to Shanghai to Sydney.”stephen sunnucksPresident, international
Growth

Chile
“We win when we deliver the right balance of occasions, style, design and quality that our customer expects.”Julie RosenSVP, merchandising, Banana republic
2011 gap inc. annual report
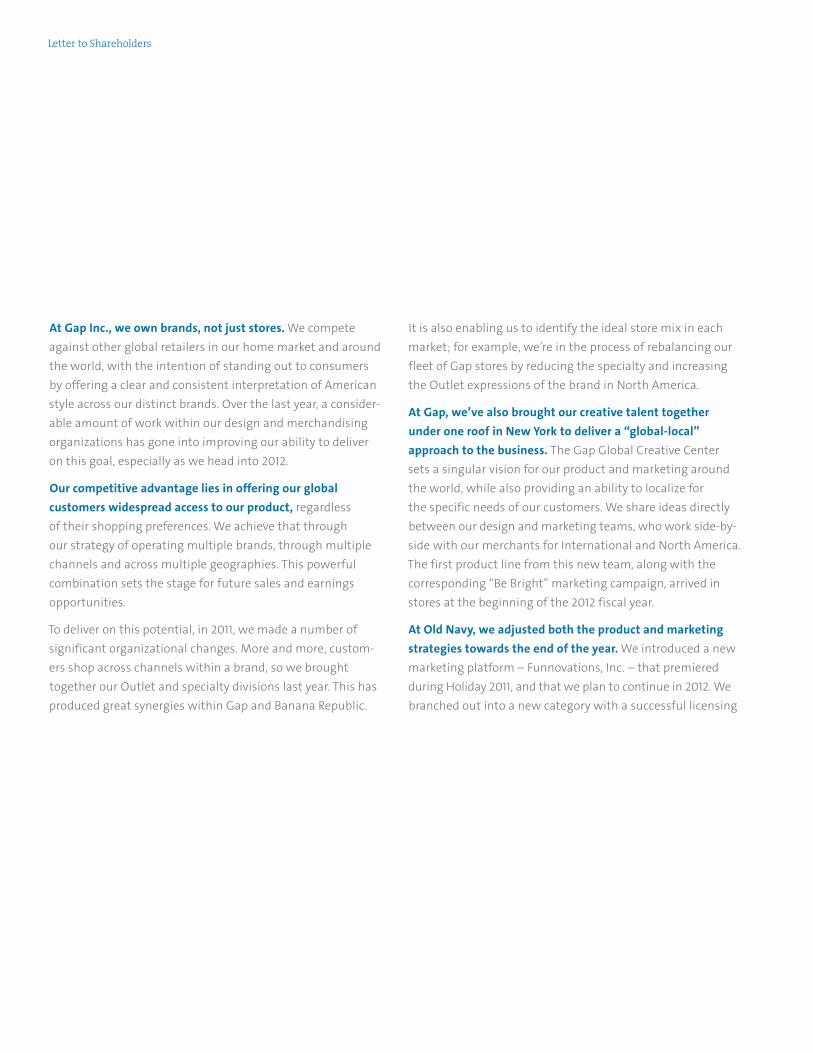
At Gap Inc., we own brands, not just stores. We compete against other global retailers in our home market and around the world, with the intention of standing out to consumers by offering a clear and consistent interpretation of American style across our distinct brands. Over the last year, a consider-able amount of work within our design and merchandising organizations has gone into improving our ability to deliver on this goal, especially as we head into 2012.
Our competitive advantage lies in offering our global customers widespread access to our product, regardless of their shopping preferences. We achieve that through our strategy of operating multiple brands, through multiple channels and across multiple geographies. This powerful combination sets the stage for future sales and earnings opportunities.
To deliver on this potential, in 2011, we made a number of significant organizational changes. More and more, custom-ers shop across channels within a brand, so we brought together our Outlet and specialty divisions last year. This has produced great synergies within Gap and Banana Republic.
It is also enabling us to identify the ideal store mix in each market; for example, we’re in the process of rebalancing our fleet of Gap stores by reducing the specialty and increasing the Outlet expressions of the brand in North America.
At Gap, we’ve also brought our creative talent together under one roof in New York to deliver a “global-local” approach to the business. The Gap Global Creative Center sets a singular vision for our product and marketing around the world, while also providing an ability to localize for the specific needs of our customers. We share ideas directly between our design and marketing teams, who work side-by- side with our merchants for International and North America. The first product line from this new team, along with the corresponding “Be Bright” marketing campaign, arrived in stores at the beginning of the 2012 fiscal year.
At Old Navy, we adjusted both the product and marketing strategies towards the end of the year. We introduced a new marketing platform – Funnovations, Inc. – that premiered during Holiday 2011, and that we plan to continue in 2012. We branched out into a new category with a successful licensing
letter to Shareholders
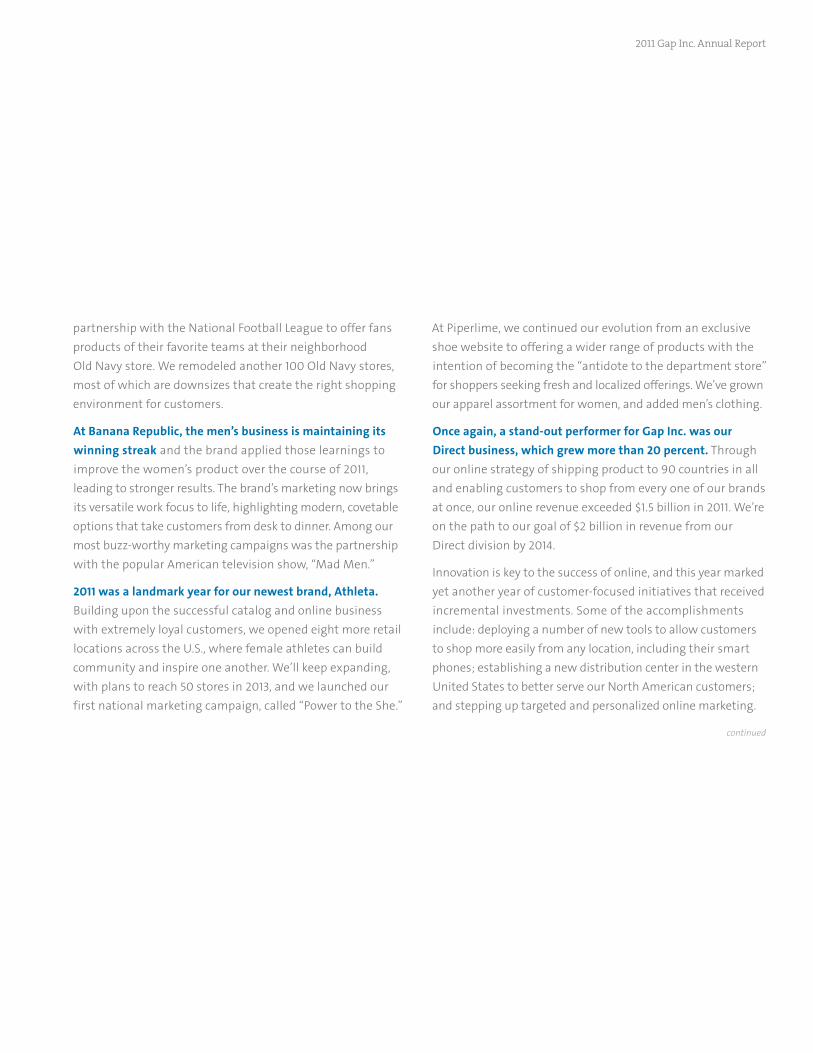
partnership with the National Football League to offer fans products of their favorite teams at their neighborhood Old Navy store. We remodeled another 100 Old Navy stores, most of which are downsizes that create the right shopping environment for customers.
At Banana Republic, the men’s business is maintaining its winning streak and the brand applied those learnings to improve the women’s product over the course of 2011, leading to stronger results. The brand’s marketing now brings its versatile work focus to life, highlighting modern, covetable options that take customers from desk to dinner. Among our most buzz-worthy marketing campaigns was the partnership with the popular American television show, “Mad Men.”
2011 was a landmark year for our newest brand, Athleta. Building upon the successful catalog and online business with extremely loyal customers, we opened eight more retail locations across the U.S., where female athletes can build community and inspire one another. We’ll keep expanding, with plans to reach 50 stores in 2013, and we launched our first national marketing campaign, called “Power to the She.”
At Piperlime, we continued our evolution from an exclusive shoe website to offering a wider range of products with the intention of becoming the “antidote to the department store” for shoppers seeking fresh and localized offerings. We’ve grown our apparel assortment for women, and added men’s clothing.
Once again, a stand-out performer for Gap Inc. was our Direct business, which grew more than 20 percent. Through our online strategy of shipping product to 90 countries in all and enabling customers to shop from every one of our brands at once, our online revenue exceeded $1.5 billion in 2011. We’re on the path to our goal of $2 billion in revenue from our Direct division by 2014.
Innovation is key to the success of online, and this year marked yet another year of customer-focused initiatives that received incremental investments. Some of the accomplishments include: deploying a number of new tools to allow customers to shop more easily from any location, including their smart phones; establishing a new distribution center in the western United States to better serve our North American customers; and stepping up targeted and personalized online marketing.
continued
2011 gap inc. annual report

Customers
“We have a powerful global ecommerce platform and five incredible brands to drive global online growth.”Toby lenkPresident, gap inc. direct
39 counTRies
sToRes in

“To drive a meaningful change in product and marketing, we’ll deliver one global product vision to our customers around the world.”Pam WallackeVP, gap global creative center
2011 gap inc. annual report

Customers can now experience our brands and touch our products in 39 countries, up from just six countries in 2007. To fuel our growth and scale the business further in coming years, we made an organizational shift and established one International division, led out of London. With other head-quarter offices in Tokyo and Shanghai, this new structure strikes a great balance of having experienced Gap Inc. execu-tives from North America working alongside talented regional hires to drive the business forward.
The franchise business continues to grow at a fast rate, with a 45 percent increase in net sales year-over-year. In 2011, we launched in eight new franchise countries, including Chile, our first South American nation. We opened the doors to more than 50 new Gap and Banana Republic franchise stores, for a total of 227 by year end, on our way to our target of 400 by 2014.
China, the world’s second largest apparel market, represents a major component of our global growth strategy, building momentum following our first store openings in 2010. With a total of 14 stores now in China, including our Hong Kong
flagship that opened in November and new locations in HangZhou and Tianjin, we expect to have a fleet of about 45 stores by the end of fiscal year 2012. Since launching an ecommerce site last year, online orders have been logged from over 330 cities in China.
Of our three established core brands, Old Navy is the only one without a store presence beyond North America. After a thoughtful planning process in 2011, that is about to change. Old Navy is on track to expand outside North America with its first company-owned store in Japan in mid-2012.
At the heart of our company, our people and our values set us apart. These values were put to the test by the devastating earthquake and tsunami that occurred in Japan on March 11. In the midst of the emotional shock and physical destruction of this tragedy, we went through the deliberate process of ensuring that our 6,000 employees and their families were safe. Once that was confirmed, we selectively opened stores in communities that needed access to clothing, and donated more than $1 million worth of clothing and five percent of sales in Japan for a period of time to the recovery efforts.
letter to Shareholders

Proceeds were also contributed from a limited edition t-shirt created by our product teams in North America.
We take seriously the responsibility to assist the global communities we serve. In my role as chairman of Gap Foundation’s Board of Trustees, it’s inspiring to see that our employees increased their number of volunteer hours to 433,000.
We were also proud that the Gap Inc. P.A.C.E. (Personal Advancement & Career Enhancement) program to help female garment workers was recognized by the Clinton Global Initiative as an exemplary approach to women’s economic empowerment. It was especially fitting that Bob Fisher received the honor from former President Bill Clinton given his involvement in the development of the program.
All of us at Gap Inc. continue to draw strength from the Fisher Family. A notable highlight of 2011 was the induction of our founders, Doris and Don Fisher, into the California Hall of Fame. Doris accepted the award in recognition of their transformation of retail, and their contributions to our communities, to education, and to the arts.
In fact, the passion and character of our founders set a high bar for our management team, our leaders and our 132,000 employees. A day seldom passes when their ability to win while creating a company with a heart isn’t top of mind.
Looking ahead to 2012, we’re determined to take the lessons from the past and apply them to what lies ahead. The opportunity to grow our brands and our divisions – both in North America and globally – drives round-the-clock efforts to return Gap Inc. to a high level of performance.
I will be excited to report back to you with our progress a year from now.
Glenn Murphy Chairman of the Board and Chief Executive Officer
2011 gap inc. annual report

433 THousAnD HouRs VolunTeeReD
“As a company, we invest in career exploration and job readiness for youth to help them prepare for the workforce.”bobbi siltenSVP, President, gap Foundation
Values

“I’m so proud that our volunteerism continues to rise. We have stores with a heart because of our amazing employees.”Doris Fisherco-founder, gap inc.
$1.2 million in cloTHinG AnD cAsH foR JAPAn DisAsTeR
2011 gap inc. annual report
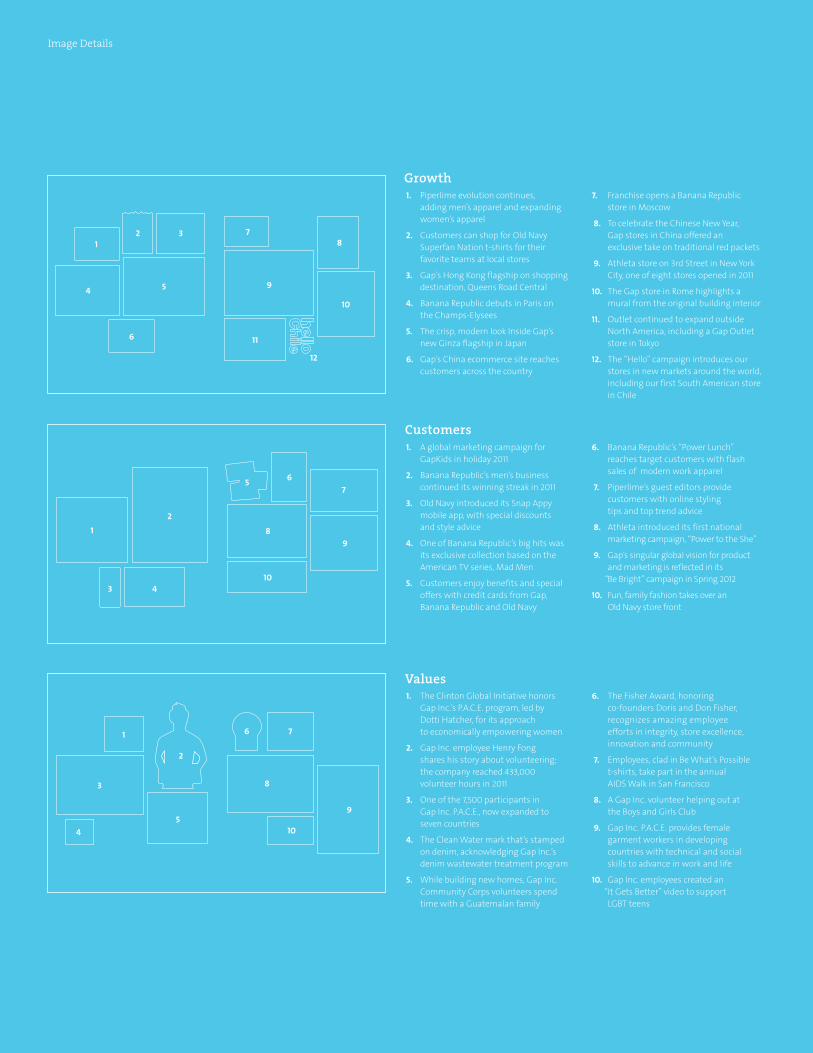
image details
3
Values
410
4
3
1
5
7
2
6
8
10
9
4
1
1
2
2
3 7
5
6
7
9
11
12
8
10
6
89
Growth 1. Piperlime evolution continues, adding men’s apparel and expanding women’s apparel
2. Customers can shop for Old Navy Superfan Nation t-shirts for their favorite teams at local stores
3. Gap’s Hong Kong flagship on shopping destination, Queens Road Central
4. Banana Republic debuts in Paris on the Champs-Elysees
5. The crisp, modern look Inside Gap’s new Ginza flagship in Japan
6. Gap’s China ecommerce site reaches customers across the country
7. Franchise opens a Banana Republic store in Moscow
8. To celebrate the Chinese New Year, Gap stores in China offered an exclusive take on traditional red packets
9. Athleta store on 3rd Street in New York City, one of eight stores opened in 2011
10. The Gap store in Rome highlights a mural from the original building interior
11. Outlet continued to expand outside North America, including a Gap Outlet store in Tokyo
12. The “Hello” campaign introduces our stores in new markets around the world, including our first South American store in Chile
Customers 1. A global marketing campaign for GapKids in holiday 2011
2. Banana Republic’s men’s business continued its winning streak in 2011
3. Old Navy introduced its Snap Appy mobile app, with special discounts and style advice
4. One of Banana Republic’s big hits was its exclusive collection based on the American TV series, Mad Men
5. Customers enjoy benefits and special offers with credit cards from Gap, Banana Republic and Old Navy
6. Banana Republic’s “Power Lunch” reaches target customers with flash sales of modern work apparel
7. Piperlime’s guest editors provide customers with online styling tips and top trend advice
8. Athleta introduced its first national marketing campaign, “Power to the She”
9. Gap’s singular global vision for product and marketing is reflected in its Be Bright” campaign in Spring 2012
10. Fun, family fashion takes over an Old Navy store front
“
1. The Clinton Global Initiative honors Gap Inc.’s P.A.C.E. program, led by Dotti Hatcher, for its approach to economically empowering women
2. Gap Inc. employee Henry Fong shares his story about volunteering; the company reached 433,000 volunteer hours in 2011
3. One of the 7,500 participants in Gap Inc. P.A.C.E., now expanded to seven countries
4. The Clean Water mark that’s stamped on denim, acknowledging Gap Inc.’s denim wastewater treatment program
5. While building new homes, Gap Inc. Community Corps volunteers spend time with a Guatemalan family
6. The Fisher Award, honoring co-founders Doris and Don Fisher, recognizes amazing employee efforts in integrity, store excellence, innovation and community
7. Employees, clad in Be What’s Possible t-shirts, take part in the annual AIDS Walk in San Francisco
8. A Gap Inc. volunteer helping out at the Boys and Girls Club
9. Gap Inc. P.A.C.E. provides female garment workers in developing countries with technical and social skills to advance in work and life
10. Gap Inc. employees created an It Gets Better” video to support LGBT teens
“
5
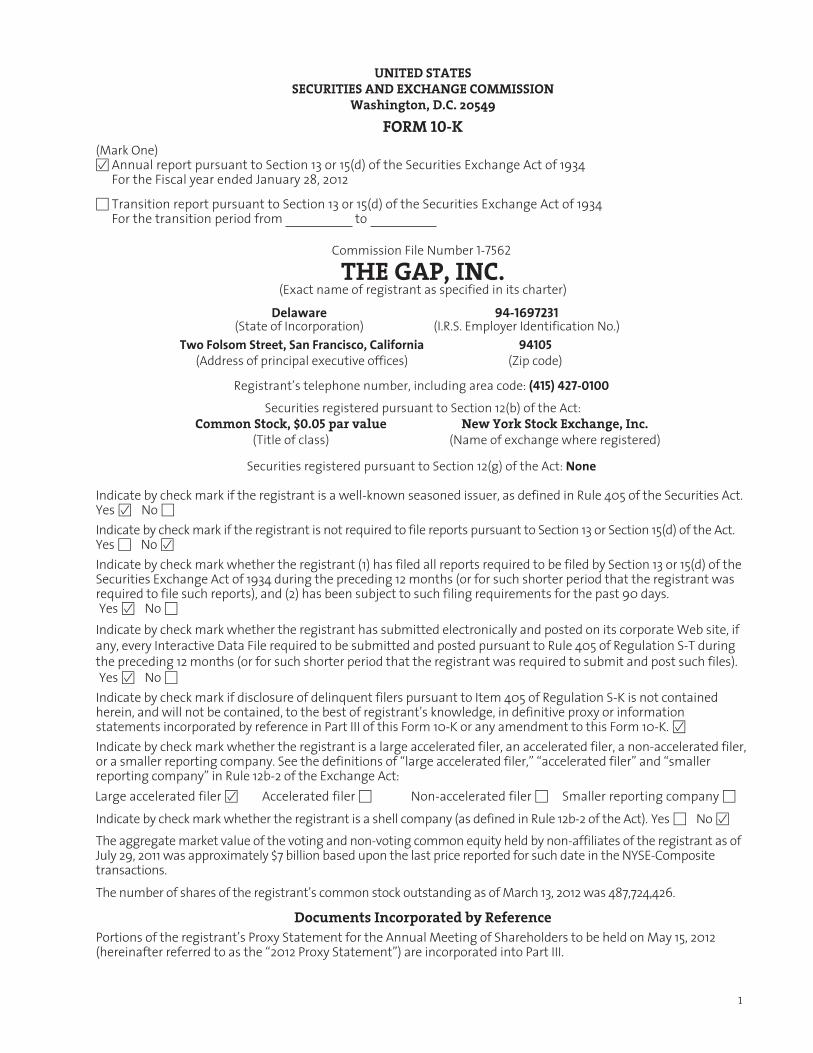
UNITED STATESSECURITIES AND EXCHANGE COMMISSION
Washington, D.C. 20549FORM 10-K
(Mark One)Í Annual report pursuant to Section 13 or 15(d) of the Securities Exchange Act of 1934
For the Fiscal year ended January 28, 2012
‘ Transition report pursuant to Section 13 or 15(d) of the Securities Exchange Act of 1934For the transition period from to
Commission File Number 1-7562
THE GAP, INC.(Exact name of registrant as specified in its charter)
Delaware 94-1697231(State of Incorporation) (I.R.S. Employer Identification No.)
Two Folsom Street, San Francisco, California 94105(Address of principal executive offices) (Zip code)
Registrant’s telephone number, including area code: (415) 427-0100Securities registered pursuant to Section 12(b) of the Act:
Common Stock, $0.05 par value New York Stock Exchange, Inc.(Title of class) (Name of exchange where registered)
Securities registered pursuant to Section 12(g) of the Act: None
Indicate by check mark if the registrant is a well-known seasoned issuer, as defined in Rule 405 of the Securities Act.Yes Í No ‘
Indicate by check mark if the registrant is not required to file reports pursuant to Section 13 or Section 15(d) of the Act.Yes ‘ No Í
Indicate by check mark whether the registrant (1) has filed all reports required to be filed by Section 13 or 15(d) of theSecurities Exchange Act of 1934 during the preceding 12 months (or for such shorter period that the registrant wasrequired to file such reports), and (2) has been subject to such filing requirements for the past 90 days.Yes Í No ‘
Indicate by check mark whether the registrant has submitted electronically and posted on its corporate Web site, ifany, every Interactive Data File required to be submitted and posted pursuant to Rule 405 of Regulation S-T duringthe preceding 12 months (or for such shorter period that the registrant was required to submit and post such files).Yes Í No ‘
Indicate by check mark if disclosure of delinquent filers pursuant to Item 405 of Regulation S-K is not containedherein, and will not be contained, to the best of registrant’s knowledge, in definitive proxy or informationstatements incorporated by reference in Part III of this Form 10-K or any amendment to this Form 10-K. Í
Indicate by check mark whether the registrant is a large accelerated filer, an accelerated filer, a non-accelerated filer,or a smaller reporting company. See the definitions of “large accelerated filer,” “accelerated filer” and “smallerreporting company” in Rule 12b-2 of the Exchange Act:Large accelerated filer Í Accelerated filer ‘ Non-accelerated filer ‘ Smaller reporting company ‘
Indicate by check mark whether the registrant is a shell company (as defined in Rule 12b-2 of the Act). Yes ‘ No Í
The aggregate market value of the voting and non-voting common equity held by non-affiliates of the registrant as ofJuly 29, 2011 was approximately $7 billion based upon the last price reported for such date in the NYSE-Compositetransactions.The number of shares of the registrant’s common stock outstanding as of March 13, 2012 was 487,724,426.
Documents Incorporated by ReferencePortions of the registrant’s Proxy Statement for the Annual Meeting of Shareholders to be held on May 15, 2012(hereinafter referred to as the “2012 Proxy Statement”) are incorporated into Part III.
1
Special Note on Forward-looking StatementsThis Annual Report on Form 10-K contains forward-looking statements within the “safe harbor” provisions of thePrivate Securities Litigation Reform Act of 1995. All statements other than those that are purely historical areforward-looking statements. Words such as “expect,” “anticipate,” “believe,” “estimate,” “intend,” “plan,” “project,”and similar expressions also identify forward-looking statements. Forward-looking statements include, but are notlimited to, statements regarding the following:
• our international expansion plans, including our plans to open Old Navy stores outside of North America, openadditional Gap stores in China, and open additional international outlet stores;
• continued growth of online sales internationally;
• the outcome of proceedings, lawsuits, disputes, and claims;
• improving sales with healthy merchandise margins;
• investing in our business while maintaining discipline;
• returning excess cash to shareholders;
• the number of new store openings and store closings in fiscal 2012;
• net square footage change in fiscal 2012;
• the number of new franchise stores in fiscal 2012;
• the number of future stores, including Gap stores in North America and Athleta stores;
• the effective tax rate in fiscal 2012;
• current cash balances and cash flows being sufficient to support our business operations, including growthinitiatives and planned capital expenditures;
• ability to supplement near-term liquidity, if necessary, with our revolving credit facility;
• capital expenditures in fiscal 2012;
• our plan to increase our dividend in fiscal 2012;
• the estimates and assumptions we use in our accounting policies;
• the assumptions used to value share-based compensation expense;
• the assumptions used to estimate the grant date fair value of stock options issued;
• our intention to utilize undistributed earnings of our foreign subsidiaries;
• total gross unrecognized tax benefits;
• expected payments to IBM;
• the maximum potential amount of future lease payments; and
• the impact of losses due to indemnification obligations.
Because these forward-looking statements involve risks and uncertainties, there are important factors that couldcause our actual results to differ materially from those in the forward-looking statements. These factors include,without limitation, the following:
• the risk that the adoption of new accounting pronouncements will impact future results;
2 Gap Inc. Form 10-K

• the risk that changes in general economic conditions or consumer spending patterns could adversely impact ourresults of operations;
• the highly competitive nature of our business in the United States and internationally;
• the risk that we or our franchisees will be unsuccessful in gauging apparel trends and changing consumerpreferences;
• the risk to our business associated with global sourcing and manufacturing, including sourcing costs, eventscausing disruptions in product shipment, or an inability to secure sufficient manufacturing capacity;
• the risk that our efforts to expand internationally may not be successful;
• the risk that our franchisees will be unable to successfully open, operate, and grow the Company’s franchisedstores or operate their stores in a manner consistent with our requirements regarding our brand identities andcustomer experience standards;
• the risk that we or our franchisees will be unsuccessful in identifying, negotiating, and securing new storelocations and renewing, modifying, or terminating leases for existing store locations effectively;
• the risk that comparable sales and margins will experience fluctuations;
• the risk that changes in our credit profile or deterioration in market conditions may limit our access to the capitalmarkets and adversely impact our financial results and our ability to service our debt while maintaining otherinitiatives;
• the risk that trade matters could increase the cost or reduce the supply of apparel available to us and adverselyaffect our business, financial condition, and results of operations;
• the risk that updates or changes to our information technology (“IT”) systems may disrupt our operations;
• the risk that our IT services agreement with IBM could cause disruptions in our operations and have an adverseeffect on our financial results;
• the risk that actual or anticipated cyber attacks, and other cybersecurity risks, may cause us to incur increasingcosts;
• the risk that natural disasters, public health crises, political crises, or other catastrophic events could adverselyaffect our operations and financial results;
• the risk that acts or omissions by our third-party vendors, including a failure to comply with our code of vendorconduct, could have a negative impact on our reputation or operations;
• the risk that we do not repurchase some or all of the shares we anticipate purchasing pursuant to ourrepurchase program;
• the risk that we will not be successful in defending various proceedings, lawsuits, disputes, claims, and audits; and
• the risk that changes in the regulatory or administrative landscape could adversely affect our financial condition,strategies, and results of operations.
Additional information regarding factors that could cause results to differ can be found in this Annual Report onForm 10-K and our other filings with the U.S. Securities and Exchange Commission (“SEC”).
Future economic and industry trends that could potentially impact net sales and profitability are difficult topredict. These forward-looking statements are based on information as of March 26, 2012, and we assume noobligation to publicly update or revise our forward-looking statements even if experience or future changes makeit clear that any projected results expressed or implied therein will not be realized.
3
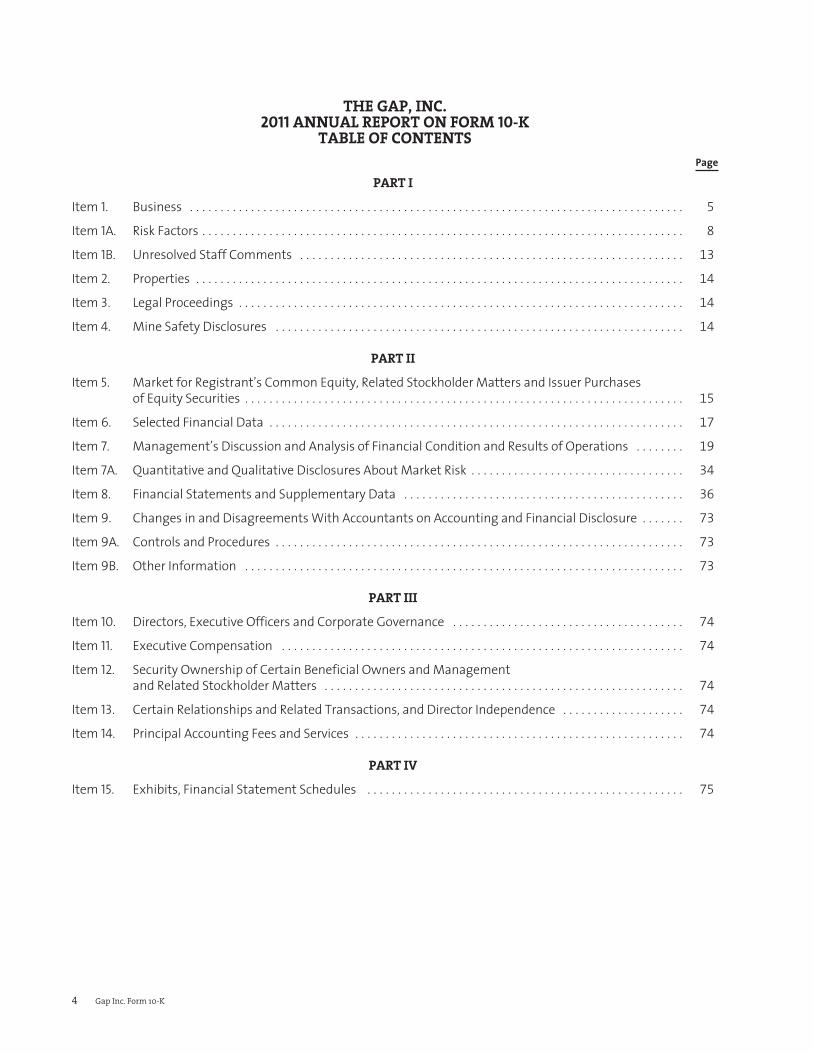
THE GAP, INC.2011 ANNUAL REPORT ON FORM 10-K
TABLE OF CONTENTSPage
PART I
Item 1. Business . . . . . . . . . . . . . . . . . . . . . . . . . . . . . . . . . . . . . . . . . . . . . . . . . . . . . . . . . . . . . . . . . . . . . . . . . . . . . . . . . 5
Item 1A. Risk Factors . . . . . . . . . . . . . . . . . . . . . . . . . . . . . . . . . . . . . . . . . . . . . . . . . . . . . . . . . . . . . . . . . . . . . . . . . . . . . . . 8
Item 1B. Unresolved Staff Comments . . . . . . . . . . . . . . . . . . . . . . . . . . . . . . . . . . . . . . . . . . . . . . . . . . . . . . . . . . . . . . . 13
Item 2. Properties . . . . . . . . . . . . . . . . . . . . . . . . . . . . . . . . . . . . . . . . . . . . . . . . . . . . . . . . . . . . . . . . . . . . . . . . . . . . . . . . 14
Item 3. Legal Proceedings . . . . . . . . . . . . . . . . . . . . . . . . . . . . . . . . . . . . . . . . . . . . . . . . . . . . . . . . . . . . . . . . . . . . . . . . . 14
Item 4. Mine Safety Disclosures . . . . . . . . . . . . . . . . . . . . . . . . . . . . . . . . . . . . . . . . . . . . . . . . . . . . . . . . . . . . . . . . . . . 14
PART II
Item 5. Market for Registrant’s Common Equity, Related Stockholder Matters and Issuer Purchasesof Equity Securities . . . . . . . . . . . . . . . . . . . . . . . . . . . . . . . . . . . . . . . . . . . . . . . . . . . . . . . . . . . . . . . . . . . . . . . . 15
Item 6. Selected Financial Data . . . . . . . . . . . . . . . . . . . . . . . . . . . . . . . . . . . . . . . . . . . . . . . . . . . . . . . . . . . . . . . . . . . . 17
Item 7. Management’s Discussion and Analysis of Financial Condition and Results of Operations . . . . . . . . 19
Item 7A. Quantitative and Qualitative Disclosures About Market Risk . . . . . . . . . . . . . . . . . . . . . . . . . . . . . . . . . . . 34
Item 8. Financial Statements and Supplementary Data . . . . . . . . . . . . . . . . . . . . . . . . . . . . . . . . . . . . . . . . . . . . . . 36
Item 9. Changes in and Disagreements With Accountants on Accounting and Financial Disclosure . . . . . . . 73
Item 9A. Controls and Procedures . . . . . . . . . . . . . . . . . . . . . . . . . . . . . . . . . . . . . . . . . . . . . . . . . . . . . . . . . . . . . . . . . . . 73
Item 9B. Other Information . . . . . . . . . . . . . . . . . . . . . . . . . . . . . . . . . . . . . . . . . . . . . . . . . . . . . . . . . . . . . . . . . . . . . . . . 73
PART III
Item 10. Directors, Executive Officers and Corporate Governance . . . . . . . . . . . . . . . . . . . . . . . . . . . . . . . . . . . . . . 74
Item 11. Executive Compensation . . . . . . . . . . . . . . . . . . . . . . . . . . . . . . . . . . . . . . . . . . . . . . . . . . . . . . . . . . . . . . . . . . 74
Item 12. Security Ownership of Certain Beneficial Owners and Managementand Related Stockholder Matters . . . . . . . . . . . . . . . . . . . . . . . . . . . . . . . . . . . . . . . . . . . . . . . . . . . . . . . . . . . 74
Item 13. Certain Relationships and Related Transactions, and Director Independence . . . . . . . . . . . . . . . . . . . . 74
Item 14. Principal Accounting Fees and Services . . . . . . . . . . . . . . . . . . . . . . . . . . . . . . . . . . . . . . . . . . . . . . . . . . . . . . 74
PART IV
Item 15. Exhibits, Financial Statement Schedules . . . . . . . . . . . . . . . . . . . . . . . . . . . . . . . . . . . . . . . . . . . . . . . . . . . . 75
4 Gap Inc. Form 10-K

Part IItem 1. Business.GeneralThe Gap, Inc. (Gap Inc., the “Company,” “we,” and “our”) was incorporated in the State of California in July 1969 andwas reincorporated under the laws of the State of Delaware in May 1988.
Gap Inc. is a leading global specialty apparel company. We offer apparel, accessories, and personal care productsfor men, women, children, and babies under the Gap, Old Navy, Banana Republic, Piperlime, and Athleta brands.Our global portfolio of distinct brands crosses multiple channels and geographies, which gives us a compellingbusiness proposition and a competitive advantage in the retail marketplace.
Gap Inc. has Company-operated stores in the United States, Canada, the United Kingdom, France, Ireland, Japan,China, and Italy. We also have franchise agreements with unaffiliated franchisees to operate Gap and BananaRepublic stores throughout Asia, Australia, Eastern Europe, Latin America, the Middle East, and Africa. Under theseagreements, third parties operate or will operate stores that sell apparel and related products under our brandnames. We have more than tripled our franchise store base from the end of fiscal 2007 to 227 stores at the end offiscal 2011. Our products are also available to customers online in over 90 countries through company-ownedwebsites and using a U.S.-based third party that provides logistics and fulfillment services. Most of the productssold under our brand names are designed by us and manufactured by independent sources. We also sell productsthat are designed and manufactured by branded third parties.
Gap. Founded in 1969, Gap is our flagship brand and remains one of the most iconic apparel brands in themarketplace today. The brand stands for casual, American style – at accessible price points. Assortments includewell-designed apparel for men and women, including denim, khakis, outerwear, tees, and accessories. In additionto designing its own merchandise, Gap offers limited “capsule” collections in partnership with some of thefashion industry’s best-loved designers and other third-party merchandise from time to time.
Gap entered the children’s apparel market in 1986 with GapKids and in 1989 with babyGap. Maternity apparelwas later added to the collection. In 1998, we launched GapBody, which offers loungewear, sleepwear, intimates,and active apparel for women. Today, Gap products are available globally in our specialty and outlet stores,online, and in franchise stores.
Banana Republic. Banana Republic is a global, multi-channel brand that is a destination for modern, versatilework wear for both men and women.
Acquired in 1983 with two stores, Banana Republic has evolved to offer collections that include apparel,handbags, shoes, jewelry, personal care products, and eyewear for men and women at higher price points thanGap brand. Today, customers can purchase Banana Republic products in our specialty and outlet stores, online,and in franchise stores.
Old Navy. Old Navy opened its first store in 1994, offering customers great product at great prices. The brandtargets young families, with a focus on providing a fun shopping environment and value-priced apparel. Today,Old Navy continues to offer on-trend selections of value-priced apparel, shoes, and accessories for adults,children, and babies, as well as other items, including a maternity line and consumables. Customers canpurchase Old Navy products in stores in the U.S. and Canada and online, which includes online-exclusive itemssuch as a plus-size line.
Piperlime. Launched in 2006, Piperlime is an online fashion boutique. The brand offers customers a fresh andunique mix of private label and leading brands in footwear, apparel, and accessories for women and men, as wellas footwear for kids. Customers will also find exclusive advice, tips, and trends from leading style experts.
5

Athleta. Acquired in September 2008, Athleta is Gap Inc.’s newest brand. Athleta offers performance-drivenwomen’s sports and active apparel and footwear for a variety of activities, including golf, running, skiing,snowboarding, tennis, swimming, and yoga. In addition to Athleta’s high-quality products, customers canpurchase an assortment of products from leading brands in women’s active wear. Customers can purchaseAthleta products online, through a catalog, and beginning in 2010, in our stores.
All sales are tendered for cash, personal checks, debit cards, or credit cards. We also issue and redeem gift cardsthrough our brands. Gap, Banana Republic, and Old Navy each have a private label credit card program and aco-branded credit card program through which frequent customers receive benefits. Private label and co-brandedcredit cards are provided by a third-party financing company.
Our stores offer a shopper-friendly environment with an assortment of apparel and accessories that emphasizestyle, quality, and good value. The range of merchandise displayed in each store varies depending on the sellingseason and the size and location of the store. Stores are generally open seven days per week (where permitted bylaw) and most holidays.
We ended fiscal 2011 with 3,263 Company-operated and franchise store locations. For more information on thenumber of stores by brand and region, see the table in “Management’s Discussion and Analysis of FinancialCondition and Results of Operations” included in Part II, Item 7 of this Form 10-K.
During fiscal 2011, we operated two reportable segments: Stores and Direct.
Certain financial information about our reportable segments and international operations is set forth under theheading “Segment Information” in Note 15 of Notes to Consolidated Financial Statements included in Part II, Item 8of this Form 10-K.
Merchandise VendorsWe purchase private label and non-private label merchandise from over 1,000 vendors. Our vendors have facilitiesin 43 countries. No vendor accounted for more than 4 percent of the dollar amount of our total fiscal 2011purchases. Of our merchandise sold during fiscal 2011, approximately 98 percent of all units were produced outsidethe United States, while the remaining 2 percent of all units were produced domestically. Approximately 26percent of our merchandise units were produced in China. Product cost increases or events causing disruption ofimports from China or other foreign countries, including the imposition of additional import restrictions or vendorspotentially failing due to political, financial, or regulatory issues, could have an adverse effect on our operations.Substantially all of our foreign purchases of merchandise are negotiated and paid for in U.S. dollars. Also see thesections entitled “Risk Factors—Our Products are subject to risks associated with global sourcing andmanufacturing, including increased product costs” and “Risk Factors—Trade matters may disrupt our supplychain” in Item 1A of this Form 10-K.
Seasonal BusinessOur business follows a seasonal pattern, with sales peaking over a total of about eight weeks during theend-of-year holiday period.
Brand BuildingOur ability to develop and evolve our existing brands is key to our success. We believe our distinct brands areamong our most important assets. With the exception of Piperlime, virtually all aspects of brand development,from product design and distribution to marketing, merchandising and shopping environments, are controlled byGap Inc. employees. With respect to Piperlime, we control all aspects of brand development except for productdesign related to third-party products. We continue to invest in our brands and enhance the customer experiencethrough significant investments in marketing, enhancement of our online shopping sites, international expansion,remodeling of existing stores, and continued focus on customer service.
6 Gap Inc. Form 10-K

Trademarks and Service MarksGap, GapKids, babyGap, GapBody, Banana Republic, Old Navy, Piperlime, and Athleta trademarks and servicemarks, and certain other trademarks, have been registered, or are the subject of pending trademark applications,with the United States Patent and Trademark Office and with the registries of many foreign countries and/or areprotected by common law.
FranchisingWe have franchise agreements with unaffiliated franchisees to operate Gap and/or Banana Republic stores in anumber of countries, including Australia, Bahrain, Bulgaria, Chile, Colombia, Croatia, Cyprus, Egypt, Greece, Guam,Indonesia, Israel, Jordan, Kazakhstan, Kuwait, Lebanon, Malaysia, Mexico, Morocco, Oman, Panama, Peru,Philippines, Poland, Qatar, Romania, Russia, Saudi Arabia, Serbia, Singapore, South Korea, Thailand, Turkey, Ukraine,United Arab Emirates, Uruguay, and Vietnam. Under these agreements, third parties operate, or will operate,stores that sell apparel and related products under our brand names. We continue to increase the number ofcountries in which we enter into these types of arrangements as part of our strategy to expand internationally. Foradditional information on risks related to our franchise business, see the sections entitled “Risk Factors—Ourefforts to expand internationally may not be successful” and “Risk Factors—Our franchise business is subject tocertain risks not directly within our control and could impair the value of our brands” in Item 1A of this Form 10-K.
InventoryThe nature of the retail business requires us to carry a significant amount of inventory, especially prior to peakselling seasons when we, along with other retailers, generally build up inventory levels. We maintain a large part ofour inventory in distribution centers. We review our inventory levels in order to identify slow-moving merchandiseand broken assortments (items no longer in stock in a sufficient range of sizes or colors) and use markdowns toclear merchandise. Also see the section entitled “Risk Factors—We must successfully gauge fashion trends andchanging consumer preferences to succeed” in Item 1A of this Form 10-K.
CompetitorsThe global specialty apparel retail industry is highly competitive. We compete with local, national, and global apparelretailers. We are also faced with competition in European, Japanese, Chinese, and Canadian markets from establishedregional and national chains, and our franchisees face significant competition in the markets in which they operate.Also see the section entitled “Risk Factors—Our business is highly competitive” in Item 1A of this Form 10-K.
EmployeesAs of January 28, 2012, we had a work force of approximately 132,000 employees, which includes a combinationof part- and full-time employees. We also hire seasonal employees, primarily during the peak end-of-year holidayperiod.
To remain competitive in the apparel retail industry, we must attract, develop, and retain skilled employees,including executives. Competition for such personnel is intense. Our success is dependent to a significant degreeon the continued contributions of key employees. Also see the section entitled “Risk Factors—We must successfullygauge apparel trends and changing consumer preferences to succeed” in Item 1A of this Form 10-K.
Available InformationWe make available on our website, gapinc.com, under “Investors, Financial Information, SEC Filings,” free of charge,our annual reports on Form 10-K, quarterly reports on Form 10-Q, current reports on Form 8-K, and amendments tothose reports as soon as reasonably practicable after we electronically file or furnish them to the SEC.
Our Board of Directors Committee Charters (Audit and Finance, Compensation and Management Development,and Governance and Nominating Committees) and Corporate Governance Guidelines are also available on ourwebsite under “Investors, Governance.” The Code of Business Conduct can be found at gapinc.com under“Investors, Corporate Compliance, Code of Business Conduct.” Any amendments and waivers to the code will alsobe available on the website.
7

Executive Officers of the RegistrantThe following are our executive officers:
Name, Age, Position, and Principal Occupation:
Michelle Banks, 48, Executive Vice President, General Counsel, Corporate Secretary, and Chief Compliance Officersince March 2011; Senior Vice President, General Counsel, Corporate Secretary, and Chief Compliance Officer fromMarch 2008 to March 2011; Senior Vice President and General Counsel from November 2006 to March 2008; VicePresident from March 2005 to November 2006; Associate General Counsel from February 2003 to March 2005;Senior Corporate Counsel from January 1999 to February 2003.
Colin Funnell, 50, Executive Vice President, Global Supply Chain since September 2011; Senior Vice President,Supply Chain Strategy, Strategic Sourcing, and Global Logistics from June 2010 to August 2011; Senior VicePresident, Corporate Operations and Logistics from 2008 to June 2010; Senior Vice President, Logistics from 2006to 2007; Senior Vice President, Global Production and Old Navy Supply Chain from 2004 to 2005.
John T. (Tom) Keiser, 46, Executive Vice President and Chief Information Officer since January 2010; ExecutiveVice President and Chief Information Officer of The Limited Brands, Inc., an apparel company, from 2006 toOctober 2009; Senior Vice President, INSIGHT Program of The Limited Brands, Inc. from 2004 to 2006.
Glenn Murphy, 50, Chairman and Chief Executive Officer since August 2007; Chief Executive Officer of ShoppersDrug Mart Corporation, a drug store chain, from 2001 to 2007.
Art Peck, 56, President, Gap North America since February 2011; Executive Vice President of Strategy andOperations from May 2005 to February 2011; President, Gap Inc. Outlet from October 2008 to February 2011;Acting President, Gap Inc. Outlet from February 2008 to October 2008; Senior Vice President of The BostonConsulting Group, a business consulting firm, from 1982 to May 2005.
Eva Sage-Gavin, 53, Executive Vice President, Global Human Resources and Corporate Affairs since February 2010;Executive Vice President, Human Resources, Communications and Global Responsibility from April 2008 toFebruary 2010; Executive Vice President, Human Resources and Communications from February 2007 to April2008; Executive Vice President, Human Resources from March 2003 to February 2007.
Sabrina Simmons, 48, Executive Vice President and Chief Financial Officer since January 2008; Executive VicePresident, Corporate Finance from September 2007 to January 2008; Senior Vice President, Corporate Financeand Treasurer from March 2003 to September 2007; Vice President and Treasurer from September 2001 toMarch 2003.
Item 1A. Risk Factors.Our past performance may not be a reliable indicator of future performance because actual future results andtrends may differ materially depending on a variety of factors, including but not limited to the risks anduncertainties discussed below. In addition, historical trends should not be used to anticipate results or trends infuture periods.
Global economic conditions and the impact on consumer spending patterns could adversely impact ourresults of operations.The Company’s performance is subject to global economic conditions and their impact on levels of consumerspending worldwide. Some of the factors influencing consumer spending include higher levels of unemployment,higher consumer debt levels, reductions in net worth based on market declines and uncertainty, home foreclosuresand reductions in home values, fluctuating interest rates and credit availability, government austerity measures,fluctuating fuel and other energy costs, fluctuating commodity prices, and general uncertainty regarding theoverall future economic environment. Consumer purchases of discretionary items, including our merchandise,generally decline during periods when disposable income is adversely affected or there is economic uncertainty.
8 Gap Inc. Form 10-K

Adverse changes in the global economy, or in any of the regions in which we sell our products, could reduceconsumer confidence, and thereby could negatively affect earnings and have a material adverse effect on ourresults of operations. For example, the global financial economic downturn that began in 2008 and continuedthroughout 2011, particularly in Europe, has negatively impacted consumer confidence. In a challenging anduncertain economic environment, we cannot predict whether or when such circumstances may improve orworsen, or what impact, if any, such circumstances could have on our business, results of operations, cash flows,and financial position.
Our business is highly competitive.The global specialty apparel retail industry is highly competitive. We compete with local, national, and globaldepartment stores, specialty and discount store chains, independent retail stores, and online businesses thatmarket similar lines of merchandise. We face a variety of competitive challenges including:
• anticipating and quickly responding to changing fashion trends and consumer demands;
• attracting consumer traffic;
• competitively pricing our products and achieving customer perception of value;
• maintaining favorable brand recognition and effectively marketing our products to consumers in several diversemarket segments;
• developing innovative, high-quality products in sizes, colors, and styles that appeal to consumers of varying agegroups and tastes;
• sourcing merchandise efficiently; and
• providing strong and effective marketing support.
In addition, our franchisees face significant competition in the markets in which they operate. If we or ourfranchisees are not able to compete successfully in the United States or internationally, our results of operationscould be adversely affected.
We must successfully gauge apparel trends and changing consumer preferences to succeed.Our success is largely dependent upon our ability to gauge the tastes of our customers and to provide merchandisethat satisfies customer demand in a timely manner. However, lead times for many of our purchases are long,which may make it more difficult for us to respond rapidly to new or changing fashion trends or consumeracceptance of our products. The global specialty retail business fluctuates according to changes in consumerpreferences, dictated in part by fashion and season. To the extent we misjudge the market for our merchandise orthe products suitable for local markets or fail to execute trends and deliver product to market as timely as ourcompetitors, our sales will be adversely affected, and the markdowns required to move the resulting excessinventory will adversely affect our operating results. Some of our past product offerings have not been wellreceived by our broad and diverse customer base. Merchandise misjudgments could have a material adverse effecton our operating results.
Our ability to anticipate and effectively respond to changing fashion trends depends in part on our ability to attractand retain key personnel in our design, merchandising, marketing, and other functions. Competition for thispersonnel is intense, and we cannot be sure that we will be able to attract and retain a sufficient number ofqualified personnel in future periods.
Fluctuations in the global specialty retail business especially affect the inventory owned by apparel retailers, asmerchandise usually must be ordered well in advance of the season and frequently before fashion trends areevidenced by customer purchases. In addition, the nature of the global specialty retail business requires us to carrya significant amount of inventory, especially prior to the peak holiday selling season when we build up ourinventory levels. We must enter into contracts for the purchase and manufacture of merchandise well in advance
9

of the applicable selling season. As a result, we are vulnerable to demand and pricing shifts and to suboptimalselection and timing of merchandise purchases. In the past, we have not always predicted our customers’preferences and acceptance levels of our fashion items with accuracy. If sales do not meet expectations, too muchinventory may cause excessive markdowns, and therefore, lower than planned margins.
Our business, including our costs and supply chain, is subject to risks associated with global sourcingand manufacturing.Independent third parties manufacture nearly all of our products for us. As a result, we are directly impacted byincreases in the cost of those products. For example, cotton prices rose substantially during fiscal 2011, which putsignificant pressure on our average unit costs and gross margins.
If we experience significant increases in demand or need to replace an existing vendor, there can be no assurancethat additional manufacturing capacity will be available when required on terms that are acceptable to us or thatany vendor would allocate sufficient capacity to us in order to meet our requirements. In addition, for any newmanufacturing source, we may encounter delays in production and added costs as a result of the time it takes totrain our vendors in our methods, products, quality control standards, and environmental, labor, health, and safetystandards. Moreover, in the event of a significant disruption in the supply of the fabrics or raw materials used byour vendors in the manufacture of our products, our vendors might not be able to locate alternative suppliers ofmaterials of comparable quality at an acceptable price. Any delays, interruption, or increased costs in themanufacture of our products could result in lower sales and net income.
Because independent vendors manufacture nearly all of our products outside of our principal sales markets, thirdparties must transport our products over large geographic distances. Delays in the shipment or delivery of ourproducts due to the availability of transportation, work stoppages, port strikes, infrastructure congestion, or otherfactors, and costs and delays associated with transitioning between vendors, could adversely impact our financialperformance. Manufacturing delays or unexpected demand for our products may require us to use faster, butmore expensive, transportation methods such as aircraft, which could adversely affect our gross margins. Inaddition, the cost of fuel is a significant component in transportation costs, so increases in the price of petroleumproducts can adversely affect our gross margins.
Our efforts to expand internationally may not be successful.Our current strategies include international expansion in a number of countries around the world through anumber of channels and brands, including franchise. For example, we currently plan to open Old Navy storesoutside of North America, open additional Gap stores in China, open additional international outlet stores, andcontinue to grow online sales internationally. We have limited experience operating in some of these locations. Inmany of these locations, we face major, established competitors. In addition, in many of these locations, the realestate, employment and labor, transportation and logistics, regulatory, and other operating requirements differdramatically from those in the places where we have experience. Moreover, consumer tastes and trends may differin many of these locations, and as a result, the sales of our products may not be successful or result in the marginswe anticipate. If our international expansion plans are unsuccessful or do not deliver an appropriate return on ourinvestments, our operations and financial results could be materially, adversely affected.
Our franchise business is subject to certain risks not directly within our control and could impair thevalue of our brands.We also have entered into franchise agreements with unaffiliated franchisees to operate stores in many countriesaround the world. Under these agreements, third parties operate, or will operate, stores that sell apparel andrelated products under our brand names. The effect of these arrangements on our business and results ofoperations is uncertain and will depend upon various factors, including the demand for our products in newmarkets internationally and our ability to successfully identify appropriate third parties to act as franchisees,distributors, or in a similar capacity. In addition, certain aspects of these arrangements are not directly within ourcontrol, such as the ability of these third parties to meet their projections regarding store locations, store openings,and sales. Other risks that may affect these third parties include general economic conditions in specific countriesor markets, foreign exchange, changes in diplomatic and trade relationships, and political instability. Moreover,
10 Gap Inc. Form 10-K

while the agreements we have entered into and plan to enter into in the future provide us with certaintermination rights, the value of our brands could be impaired to the extent that these third parties do not operatetheir stores in a manner consistent with our requirements regarding our brand identities and customer experiencestandards. Failure to protect the value of our brands, or any other harmful acts or omissions by a franchisee, couldhave an adverse effect on our results of operations and our reputation.
The market for prime real estate is competitive.Our ability to effectively obtain real estate to open new stores nationally and internationally depends on theavailability of real estate that meets our criteria for traffic, square footage, co-tenancies, lease economics,demographics, and other factors. We also must be able to effectively renew our existing store leases. In addition, inrecent years, we have been seeking to downsize, consolidate, reposition, or close some of our real estate locations,which in most cases requires a modification of an existing store lease. Failure to secure adequate new locations orsuccessfully modify existing locations, or failure to effectively manage the profitability of our existing fleet ofstores, could have a material adverse effect on our results of operations.
Additionally, the economic environment may at times make it difficult to determine the fair market rent of retailreal estate properties within the United States and internationally. This could impact the quality of our decisions toexercise lease options at previously negotiated rents and the quality of our decisions to renew expiring leases atnegotiated rents. Any adverse effect on the quality of these decisions could impact our ability to retain real estatelocations adequate to meet our targets or efficiently manage the profitability of our existing fleet of stores andcould have a material adverse effect on our results of operations.
We experience fluctuations in our comparable sales and margins.Our success depends in part on our ability to improve sales, in particular at our largest brands. A variety of factorsaffect comparable sales, including fashion trends, competition, current economic conditions, the timing of newmerchandise releases and promotional events, changes in our merchandise mix, the success of marketingprograms, and weather conditions. These factors may cause our comparable sales results to differ materially fromprior periods and from expectations. Our comparable sales, including the associated comparable online sales, havefluctuated significantly in the past on an annual, quarterly, and monthly basis. Over the past 24 months, ourreported monthly comparable sales have ranged from an increase of 11 percent in March 2010 to a decrease of 10percent in March 2011. Over the past five years, our reported gross margins have ranged from a high of 40.3 percentin fiscal 2009 to a low of 36.1 percent in fiscal 2007. In addition, over the past five years, our reported operatingmargins have ranged from a high of 13.4 percent in fiscal 2010 to a low of 8.3 percent in fiscal 2007.
Our ability to deliver strong comparable sales results and margins depends in large part on accurately forecastingdemand and fashion trends, selecting effective marketing techniques, providing an appropriate mix ofmerchandise for our broad and diverse customer base, managing inventory effectively, using effective pricingstrategies, and optimizing store performance. Failure to meet the expectations of investors, securities analysts, orcredit rating agencies in one or more future periods could reduce the market price of our common stock and causeour credit ratings to decline.
Changes in our credit profile or deterioration in market conditions may limit our access to the capitalmarkets and adversely impact our financial results and our ability to service our debt.In the first quarter of fiscal 2011, given favorable market conditions and our history of generating consistent andstrong operating cash flow, we made the strategic decision to issue debt. In April 2011, we issued $1.25 billionaggregate principal amount of 5.95 percent notes due April 12, 2021. We also entered into a $400 million five-yearterm loan due April 2016, which was funded in May 2011. As a result, we have additional costs that include interestpayable semiannually on the notes and at least quarterly on the term loan. We also have repayments due annuallyfor the term loan.
Our cash flows from operations are the primary source of funds for these debt service payments. In this regard, wehave generated annual cash flow from operations in excess of $1 billion per year for the past decade and endedfiscal 2011 with $1.9 billion of cash and cash equivalents on our balance sheet. We are also able to supplement near-term liquidity, if necessary, with our $500 million revolving credit facility. We continue to target a cash balance of
11

$1.2 billion which provides not only for our working capital needs, but also a reserve for unexpected businessdownturns. However, if our cash flows from operations decline significantly, we may be unable to service orrefinance our current debt while maintaining our other business initiatives. In addition, the interest rate on ourterm loan is subject to adjustment from time to time with the London Interbank Offered Rate plus a margin basedon our long-term senior unsecured credit ratings from Moody’s Investors Service and Standard & Poor’s RatingService. Any future reduction in these ratings would increase our interest costs related to our term loan and couldresult in reduced access to the credit and capital markets and higher interest costs on future financings.
We remain committed to maintaining a strong financial profile with ample liquidity. Proceeds from the debtissuance were used for general corporate purposes including share repurchases.
For further information on our debt and credit facilities, see Item 8, Financial Statements and Supplementary Data,Notes 4 and 5 of Notes to Consolidated Financial Statements of this Form 10-K.
Trade matters may disrupt our supply chain.Trade restrictions, including increased tariffs or quotas, embargoes, safeguards, and customs restrictions againstapparel items, as well as U.S. or foreign labor strikes, work stoppages, or boycotts, could increase the cost or reducethe supply of apparel available to us and adversely affect our business, financial condition, and results of operations.We cannot predict whether any of the countries in which our merchandise currently is manufactured or may bemanufactured in the future will be subject to additional trade restrictions imposed by the U.S. and other foreigngovernments, including the likelihood, type, or effect of any such restrictions. In addition, we face the possibility ofanti-dumping or countervailing duties lawsuits from U.S. domestic producers. We are unable to determine the impactof the changes to the quota system or the impact that potential tariff lawsuits could have on our global sourcingoperations. Our sourcing operations may be adversely affected by trade limits or political and financial instability,resulting in the disruption of trade from exporting countries, significant fluctuation in the value of the U.S. dollaragainst foreign currencies, restrictions on the transfer of funds, and/or other trade disruptions.
Updates or changes to our IT systems may disrupt operations.We continue to evaluate and implement upgrades and changes to our IT systems, some of which are significant.Upgrades involve replacing existing systems with successor systems, making changes to existing systems, or cost-effectively acquiring new systems with new functionality. We are aware of inherent risks associated with replacingthese systems, including accurately capturing data and system disruptions, and believe we are taking appropriateaction to mitigate the risks through testing, training, and staging implementation, as well as ensuring appropriatecommercial contracts are in place with third-party vendors supplying or supporting our IT initiatives. However, therecan be no assurances that we will successfully launch these systems as planned or that they will occur withoutdisruptions to our operations. IT system disruptions, if not anticipated and appropriately mitigated, or failure tosuccessfully implement new or upgraded systems, could have a material adverse effect on our results of operations.
Our IT services agreement with IBM could cause disruptions in our operations and have an adverse effecton our financial results.We have entered into the seventh year of a ten-year non-exclusive services agreement with International BusinessMachines Corporation (“IBM”) under which IBM operates certain significant aspects of our IT infrastructure. Underthe original agreement, this included supporting our mainframe, server, network and data center, and storeoperations, as well as help desk, end user support, and some disaster recovery. Since the original agreement inJanuary 2006, we have amended the agreement to take back certain services originally performed by IBM. Thesereturned services include services related to management of our server and data center environment, along withdisaster recovery, circuit expense billing, database administration services, and help desk services for storesworldwide. All other services remain with IBM per the original agreement. Our ability to realize the expectedbenefits of this arrangement is subject to various risks, some of which are not within our complete control. Theserisks include, but are not limited to, disruption in services and the failure to protect the security and integrity of theCompany’s data under the terms of the agreement. We are unable to provide assurances that some or all of theserisks will not occur. Failure to effectively mitigate these risks, if they occur, could have a material adverse effect onour operations and financial results.
12 Gap Inc. Form 10-K

We are subject to cybersecurity risks and may incur increasing costs in an effort to minimize those risks.Our business employs systems and websites that allow for the secure storage and transmission of proprietary orconfidential information regarding our customers, employees, job applicants, and others, including credit cardinformation and personal identification information. Security breaches could expose us to a risk of loss or misuseof this information, litigation, and potential liability. We may not have the resources or technical sophistication toanticipate or prevent rapidly-evolving types of cyber attacks. Attacks may be targeted at us, our customers, orothers who have entrusted us with information. Actual or anticipated attacks may cause us to incur increasingcosts, including costs to deploy additional personnel and protection technologies, train employees, and engagethird-party experts and consultants. Advances in computer capabilities, new technological discoveries, or otherdevelopments may result in the technology used by us to protect transaction or other data being breached orcompromised. In addition, data and security breaches can also occur as a result of non-technical issues, includingbreach by us or by persons with whom we have commercial relationships that result in the unauthorized release ofpersonal or confidential information. Any compromise or breach of our security could result in a violation ofapplicable privacy and other laws, significant legal and financial exposure, and a loss of confidence in our securitymeasures, which could have an adverse effect on our results of operations and our reputation.
Our results could be adversely affected by natural disasters, public health crises, political crises, or othercatastrophic events.Natural disasters, such as hurricanes, tornadoes, floods, earthquakes, and other adverse weather and climateconditions; unforeseen public health crises, such as pandemics and epidemics; political crises, such as terroristattacks, war, and other political instability; or other catastrophic events, whether occurring in the United States orinternationally, could disrupt our operations, the operations of our franchisees, or the operations of one or more ofour vendors. In particular, these types of events could impact our product supply chain from or to the impactedregion and could impact our ability or the ability of our franchisees or other third parties to operate our stores orwebsites. In addition, these types of events could negatively impact consumer spending in the impacted regions ordepending upon the severity, globally. For example, our fiscal 2011 operations and financial results were adverselyaffected by the March 2011 earthquake and related tsunami and nuclear disaster in Japan, which caused damage toour stores and reduced consumer spending in Japan. To the extent any of these events occur, our operations andfinancial results could be materially, adversely affected.
Failure of our vendors to adhere to our code of vendor conduct could harm our business.We purchase nearly all merchandise from third-party vendors outside of the United States and require thosevendors to adhere to a code of vendor conduct and other environmental, labor, health, and safety standards for thebenefit of workers. From time to time, contractors may not be in compliance with these standards or applicablelocal laws. Significant or continuing noncompliance with such standards and laws by one or more contractorscould have a negative impact on our reputation and an adverse effect on our results of operations.
Changes in the regulatory or administrative landscape could adversely affect our financial condition andresults of operations.Laws and regulations at the local, state, federal, and international levels frequently change, and the ultimate costof compliance cannot be precisely estimated. In addition, we cannot predict the impact that may result fromchanges in the regulatory or administrative landscape. Any changes in regulations, the imposition of additionalregulations, or the enactment of any new or more stringent legislation that impacts employment and labor, trade,product safety, transportation and logistics, health care, tax, privacy, operations, or environmental issues, amongothers, could have an adverse impact on our financial condition and results of operations.
Item 1B. Unresolved Staff Comments.None.
13
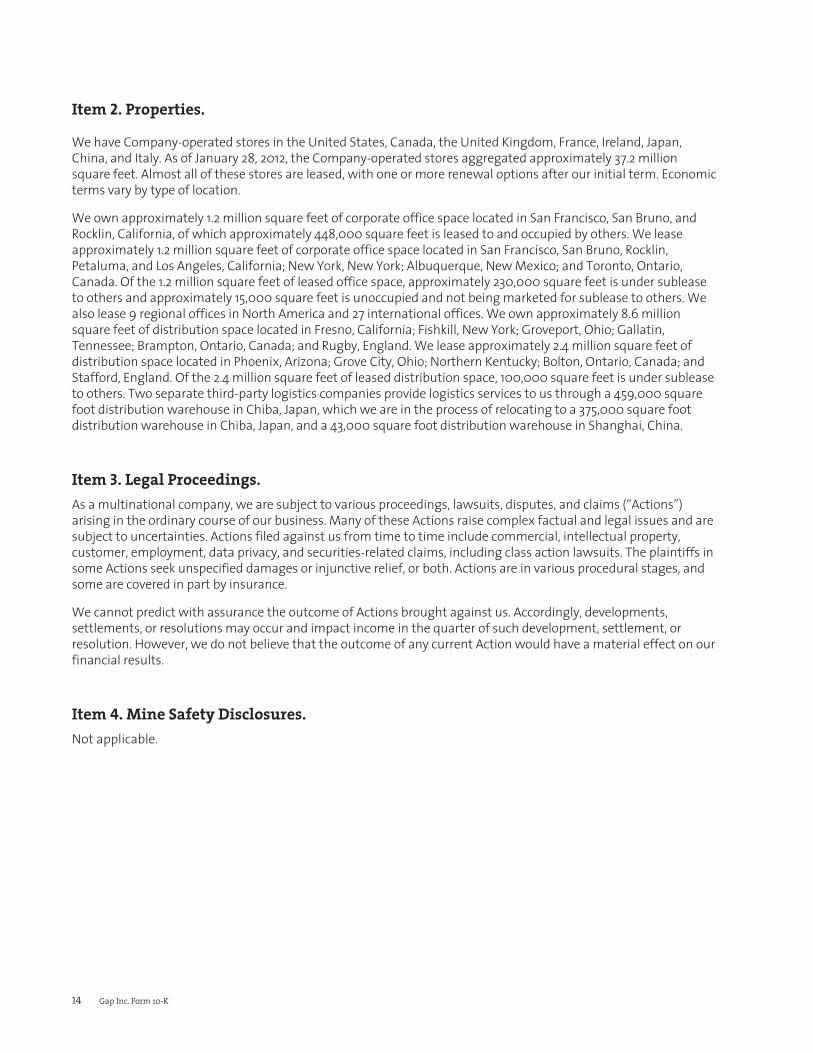
Item 2. Properties.
We have Company-operated stores in the United States, Canada, the United Kingdom, France, Ireland, Japan,China, and Italy. As of January 28, 2012, the Company-operated stores aggregated approximately 37.2 millionsquare feet. Almost all of these stores are leased, with one or more renewal options after our initial term. Economicterms vary by type of location.
We own approximately 1.2 million square feet of corporate office space located in San Francisco, San Bruno, andRocklin, California, of which approximately 448,000 square feet is leased to and occupied by others. We leaseapproximately 1.2 million square feet of corporate office space located in San Francisco, San Bruno, Rocklin,Petaluma, and Los Angeles, California; New York, New York; Albuquerque, New Mexico; and Toronto, Ontario,Canada. Of the 1.2 million square feet of leased office space, approximately 230,000 square feet is under subleaseto others and approximately 15,000 square feet is unoccupied and not being marketed for sublease to others. Wealso lease 9 regional offices in North America and 27 international offices. We own approximately 8.6 millionsquare feet of distribution space located in Fresno, California; Fishkill, New York; Groveport, Ohio; Gallatin,Tennessee; Brampton, Ontario, Canada; and Rugby, England. We lease approximately 2.4 million square feet ofdistribution space located in Phoenix, Arizona; Grove City, Ohio; Northern Kentucky; Bolton, Ontario, Canada; andStafford, England. Of the 2.4 million square feet of leased distribution space, 100,000 square feet is under subleaseto others. Two separate third-party logistics companies provide logistics services to us through a 459,000 squarefoot distribution warehouse in Chiba, Japan, which we are in the process of relocating to a 375,000 square footdistribution warehouse in Chiba, Japan, and a 43,000 square foot distribution warehouse in Shanghai, China.
Item 3. Legal Proceedings.As a multinational company, we are subject to various proceedings, lawsuits, disputes, and claims (“Actions”)arising in the ordinary course of our business. Many of these Actions raise complex factual and legal issues and aresubject to uncertainties. Actions filed against us from time to time include commercial, intellectual property,customer, employment, data privacy, and securities-related claims, including class action lawsuits. The plaintiffs insome Actions seek unspecified damages or injunctive relief, or both. Actions are in various procedural stages, andsome are covered in part by insurance.
We cannot predict with assurance the outcome of Actions brought against us. Accordingly, developments,settlements, or resolutions may occur and impact income in the quarter of such development, settlement, orresolution. However, we do not believe that the outcome of any current Action would have a material effect on ourfinancial results.
Item 4. Mine Safety Disclosures.Not applicable.
14 Gap Inc. Form 10-K

Part IIItem 5. Market for Registrant’s Common Equity, Related Stockholder Matters and IssuerPurchases of Equity Securities.The principal market on which our stock is traded is the New York Stock Exchange. The number of holders of recordof our stock as of March 13, 2012 was 8,396. The table below sets forth the market prices and dividends declaredand paid for each of the fiscal quarters in fiscal 2011 and 2010.
Market PricesDividends Declared
and PaidFiscal 2011 Fiscal 2010 Fiscal Year
High Low High Low 2011 2010
1st Quarter . . . . . . . . . . . . . . . . . . . . . . . . . . . . . . . . . . . . . . . . . $23.35 $18.94 $26.34 $19.02 $0.1125 $0.1000
2nd Quarter . . . . . . . . . . . . . . . . . . . . . . . . . . . . . . . . . . . . . . . . $23.73 $17.41 $26.04 $17.45 0.1125 0.1000
3rd Quarter . . . . . . . . . . . . . . . . . . . . . . . . . . . . . . . . . . . . . . . . $19.68 $15.08 $20.09 $16.62 0.1125 0.1000
4th Quarter . . . . . . . . . . . . . . . . . . . . . . . . . . . . . . . . . . . . . . . . $20.41 $17.62 $22.51 $18.89 0.1125 0.1000
$ 0.45 $ 0.40
Stock Performance GraphThe graph below compares the percentage changes in our cumulative total stockholder return on our commonstock for the five-year period ended January 28, 2012, with (i) the cumulative total return of the Dow JonesU.S. Retail Apparel Index and (ii) the S&P 500 Index. The total stockholder return for our common stock assumesquarterly reinvestment of dividends.
TOTAL RETURN TO STOCKHOLDERS(Assumes $100 investment on 2/3/2007)
2/3/2007 2/2/2008 1/31/2009 1/30/2010 1/29/2011 1/28/2012$0
$20
$40
$60
$80
$100
$120
$140
The Gap, Inc. S&P 500 Dow Jones US Apparel Retailers
15

Total Return Analysis2/3/2007 2/2/2008 1/31/2009 1/30/2010 1/29/2011 1/28/2012
The Gap, Inc. . . . . . . . . . . . . . . . . . . . . . . . . . . . . . . . . . . . $100.00 $101.02 $60.22 $103.86 $106.55 $107.56
S&P 500 . . . . . . . . . . . . . . . . . . . . . . . . . . . . . . . . . . . . . . $100.00 $ 97.69 $59.95 $ 79.82 $ 97.53 $101.64
Dow Jones U.S. Apparel Retailers . . . . . . . . . . . . . . . . . $100.00 $ 78.95 $42.27 $ 80.06 $ 99.31 $118.22
Source: Research Data Group, Inc. (415) 643-6000 (www.researchdatagroup.com)
Purchases of Equity Securities by the Issuer and Affiliated PurchasersThe following table presents information with respect to purchases of common stock of the Company madeduring the thirteen weeks ended January 28, 2012 by The Gap, Inc. or any affiliated purchaser, as defined inExchange Act Rule 10b-18(a)(3):
Total Numberof Shares
Purchased
AveragePrice PaidPer ShareIncluding
Commissions
Total Numberof Shares
Purchased asPart of Publicly
AnnouncedPlans or
Programs
Maximum Number(or approximate
dollar amount) ofShares that MayYet be Purchased
Under the Plans orPrograms (1)
Month #1 (October 30 - November 26) . . . . . . . . . . . . . . . 499,885 $18.00 499,885 $ 517 millionMonth #2 (November 27 - December 31) . . . . . . . . . . . . . . 2,016,523 $18.42 2,016,523 $ 480 millionMonth #3 (January 1 - January 28) . . . . . . . . . . . . . . . . . . . . 2,005,571 $18.32 2,005,571 $ 443 millionTotal . . . . . . . . . . . . . . . . . . . . . . . . . . . . . . . . . . . . . . . . . . . . . . 4,521,979 $18.33 4,521,979
(1) On February 24, 2011, we announced that our Board of Directors approved $2 billion for share repurchases. This authorization was fullyutilized by the end of December 2011. On November 17, 2011, we announced that our Board of Directors approved an additional $500million for share repurchases. On February 23, 2012, we announced that the Board of Directors approved a new $1 billion sharerepurchase authorization that replaced the November 2011 authorization and cancelled the $441 million remaining under the November2011 authorization as of that day. This authorization has no expiration date.
16 Gap Inc. Form 10-K

\
Item 6. Selected Financial Data.
The following selected financial data are derived from the Consolidated Financial Statements of the Company.We have also included certain non-financial data to enhance your understanding of our business. In fiscal 2007,we closed our Forth & Towne stores, and accordingly, loss per share from the operations of Forth & Towne hasbeen presented as a discontinued operation in the table below. The data set forth below should be read inconjunction with “Management’s Discussion and Analysis of Financial Condition and Results of Operations” inItem 7 and the Company’s Consolidated Financial Statements and related notes in Item 8.
Fiscal Year (number of weeks)2011 (52) 2010 (52) 2009 (52) 2008 (52) 2007 (52)
Operating Results ($ in millions)Net sales . . . . . . . . . . . . . . . . . . . . . . . . . . . . . . . . . . . . . . . . . . . $ 14,549 $ 14,664 $ 14,197 $ 14,526 $ 15,763
Gross margin . . . . . . . . . . . . . . . . . . . . . . . . . . . . . . . . . . . . . . . 36.2% 40.2% 40.3% 37.5% 36.1%
Operating margin . . . . . . . . . . . . . . . . . . . . . . . . . . . . . . . . . . . 9.9% 13.4% 12.8% 10.7% 8.3%
Income from continuing operations, net of incometaxes . . . . . . . . . . . . . . . . . . . . . . . . . . . . . . . . . . . . . . . . . . . . . $ 833 $ 1,204 $ 1,102 $ 967 $ 867
Net income . . . . . . . . . . . . . . . . . . . . . . . . . . . . . . . . . . . . . . . . . $ 833 $ 1,204 $ 1,102 $ 967 $ 833
Cash dividends paid . . . . . . . . . . . . . . . . . . . . . . . . . . . . . . . . . $ 236 $ 252 $ 234 $ 243 $ 252
Per Share Data (number of shares in millions)Basic earnings (loss) per share:
Income from continuing operations . . . . . . . . . . . . . . . $ 1.57 $ 1.89 $ 1.59 $ 1.35 $ 1.10
Loss from discontinued operation . . . . . . . . . . . . . . . . . $ — $ — $ — $ — $ (0.05)
Earnings per share . . . . . . . . . . . . . . . . . . . . . . . . . . . . . . $ 1.57 $ 1.89 $ 1.59 $ 1.35 $ 1.05
Diluted earnings (loss) per share:Income from continuing operations . . . . . . . . . . . . . . . $ 1.56 $ 1.88 $ 1.58 $ 1.34 $ 1.09
Loss from discontinued operation . . . . . . . . . . . . . . . . . $ — $ — $ — $ — $ (0.04)
Earnings per share . . . . . . . . . . . . . . . . . . . . . . . . . . . . . . $ 1.56 $ 1.88 $ 1.58 $ 1.34 $ 1.05
Weighted-average number of shares—basic . . . . . . . . . . . 529 636 694 716 791
Weighted-average number of shares—diluted . . . . . . . . . 533 641 699 719 794
Cash dividends declared and paid per share . . . . . . . . . . . . $ 0.45 $ 0.40 $ 0.34 $ 0.34 $ 0.32
Balance Sheet Information ($ in millions)Merchandise inventory . . . . . . . . . . . . . . . . . . . . . . . . . . . . . . $ 1,615 $ 1,620 $ 1,477 $ 1,506 $ 1,575
Total assets . . . . . . . . . . . . . . . . . . . . . . . . . . . . . . . . . . . . . . . . . $ 7,422 $ 7,065 $ 7,985 $ 7,564 $ 7,838
Working capital . . . . . . . . . . . . . . . . . . . . . . . . . . . . . . . . . . . . . $ 2,181 $ 1,831 $ 2,533 $ 1,847 $ 1,653
Total long-term debt, less current maturities . . . . . . . . . . . $ 1,606 $ — $ — $ — $ 50
Stockholders’ equity . . . . . . . . . . . . . . . . . . . . . . . . . . . . . . . . . $ 2,755 $ 4,080 $ 4,891 $ 4,387 $ 4,274
Other Data ($ and square footage in millions)Purchases of property and equipment . . . . . . . . . . . . . . . . . $ 548 $ 557 $ 334 $ 431 $ 682
Acquisition of business, net of cash acquired (1) . . . . . . . . . $ — $ — $ — $ 142 $ —
Number of Company-operated store locations open atyear-end . . . . . . . . . . . . . . . . . . . . . . . . . . . . . . . . . . . . . . . . . 3,036 3,068 3,095 3,149 3,167
Number of franchise store locations open at year-end . . . 227 178 136 114 64
Number of store locations open at year-end (2) . . . . . . . . . 3,263 3,246 3,231 3,263 3,231
Percentage increase (decrease) in comparable sales (3) . . (4)% 2% (3)% (12)% (4)%
Square footage of Company-operated store space atyear-end . . . . . . . . . . . . . . . . . . . . . . . . . . . . . . . . . . . . . . . . . 37.2 38.2 38.8 39.5 39.6
Percentage increase (decrease) in square footage ofCompany-operated store space at year-end . . . . . . . . . . (2.6)% (1.5)% (1.8)% (0.3)% 2.3%
Number of employees at year-end . . . . . . . . . . . . . . . . . . . . 132,000 134,000 135,000 134,000 141,000
17

(1) In September 2008, we acquired all of the outstanding capital stock of Athleta, Inc., a women’s sports and active apparel company, foran aggregate purchase price of $148 million.
(2) Includes Company-operated and franchise store locations.
(3) Beginning in fiscal 2011, we report comparable sales including the associated comparable online sales. Comparable sales for fiscal 2010have been recalculated to include the associated comparable online sales. Comparable sales for fiscal 2009, 2008, and 2007 exclude theassociated comparable online sales.
18 Gap Inc. Form 10-K

Item 7. Management’s Discussion and Analysis of Financial Condition andResults of Operations.
OverviewWe are a global specialty retailer offering apparel, accessories, and personal care products for men, women,children, and babies under the Gap, Old Navy, Banana Republic, Piperlime, and Athleta brands. We have Company-operated stores in the United States, Canada, the United Kingdom, France, Ireland, Japan, and beginning inNovember 2010, China and Italy. We also have franchise agreements with unaffiliated franchisees to operate Gapand Banana Republic stores in many other countries around the world. Under these agreements, third partiesoperate or will operate stores that sell apparel and related products under our brand names. In addition, ourproducts are available to customers online in over 90 countries. Most of the products sold under our brand namesare designed by us and manufactured by independent sources. We also sell products that are designed andmanufactured by branded third parties.
We identify our operating segments based on the way we manage and evaluate our business activities. We havetwo reportable segments: Stores and Direct.
Fiscal 2011 was a challenging year. Unemployment remained high in our core North America markets and theapparel retail environment was quite promotional. The debt crisis in Europe increased stock market volatilityglobally, and the earthquake and tsunami in Japan had a negative impact on our business in Asia. Our largestexpense, cost of goods sold, escalated sharply in fiscal 2011 primarily as a result of global cotton price inflation,putting significant pressure on our margins, especially in the second half of fiscal 2011. Finally, we had productchallenges throughout fiscal 2011 in our domestic and international businesses. As a result, earnings for fiscal 2011were below last year. Despite these challenges, we are pleased with the progress we made against our long-termstrategic plan, including growing our online business and expanding internationally. We also continued to reduceour square footage in North America through closures and consolidations at Gap and downsizes at Old Navy. Wemanaged our operating expenses carefully. We delivered higher average selling price per unit throughout the year,enabled by our disciplined inventory management. We generated $815 million of free cash flow and distributed$2.3 billion to shareholders through dividends and share repurchases. Free cash flow is defined as net cash providedby operating activities less purchases of property and equipment. For a reconciliation of free cash flow, a non-GAAPfinancial measure, from a GAAP financial measure, see the Liquidity and Capital Resources section.
Financial results for fiscal 2011 are as follows:
• Net sales for fiscal 2011 decreased 1 percent to $14.5 billion compared with $14.7 billion for fiscal 2010. Comparablesales, which include the associated comparable online sales, for fiscal 2011 decreased 4 percent compared with a2 percent increase last year.
• Direct net sales for fiscal 2011 increased 20 percent to $1.6 billion compared with $1.3 billion for fiscal 2010. OurDirect reportable segment includes sales for each of our online brands.
• Net sales generated outside of the U.S. and Canada, including online, for fiscal 2011 were $3.7 billion, and as apercentage of total net sales, increased 4 percent to 26 percent compared with 22 percent for fiscal 2010.
• Gross profit for fiscal 2011 was $5.3 billion compared with $5.9 billion for fiscal 2010. Gross margin for fiscal 2011was 36.2 percent compared with 40.2 percent for fiscal 2010.
• Operating expenses for fiscal 2011 decreased 2 percent to $3.8 billion compared with fiscal 2010 and decreased0.3 percent as a percentage of net sales.
• Operating margin for fiscal 2011 was 9.9 percent compared with 13.4 percent for fiscal 2010. Operating margin isdefined as operating income as a percentage of net sales.
• Net income for fiscal 2011 was $833 million compared with $1.2 billion for fiscal 2010. Diluted earnings per sharedecreased 17 percent to $1.56 for fiscal 2011 compared with $1.88 for fiscal 2010.
19

• In fiscal 2011, we generated free cash flow of $815 million compared with free cash flow of $1.2 billion for fiscal2010. Free cash flow is defined as net cash provided by operating activities less purchases of property andequipment. For a reconciliation of free cash flow, a non-GAAP financial measure, from a GAAP financial measure,see the Liquidity and Capital Resources section.
• During fiscal 2011, we repurchased about 111 million shares for $2.1 billion.
Our business and financial priorities for fiscal 2012 are as follows:
• improve sales with healthy merchandise margins;
• invest in our business while maintaining discipline; and
• return excess cash to shareholders.
As we focus on stabilizing comparable store sales in fiscal 2012, we also plan to grow revenues through the following:
• opening additional stores, many of which will be outlets, in Asia, Canada, and Europe;
• continuing to open franchise stores worldwide; and
• opening additional Athleta stores.
Results of Operations
Net SalesNet sales primarily consist of retail sales, online sales, and wholesale and franchise revenues.
See Item 8, Financial Statements and Supplementary Data, Note 15 of Notes to Consolidated Financial Statementsfor net sales by brand, region, and reportable segment.
Comparable SalesBeginning in fiscal 2011, the Company reports comparable (“Comp”) sales including the associated comparableonline sales. Accordingly, Comp sales for fiscal 2010 have been recalculated to conform to fiscal 2011 presentation.
The percentage change in Comp sales by brand and region and for total Company, including the associatedcomparable online sales, as compared with the preceding year, is as follows:
Fiscal Year2011 2010
Gap North America . . . . . . . . . . . . . . . . . . . . . . . . . . . . . . . . . . . . . . . . . . . . . . . . . . . . . . . . . . . . . . . . . . . . . . . . . . . (4)% — %
Old Navy North America . . . . . . . . . . . . . . . . . . . . . . . . . . . . . . . . . . . . . . . . . . . . . . . . . . . . . . . . . . . . . . . . . . . . . . . (3)% 3%
Banana Republic North America . . . . . . . . . . . . . . . . . . . . . . . . . . . . . . . . . . . . . . . . . . . . . . . . . . . . . . . . . . . . . . . . (1)% 3%
International . . . . . . . . . . . . . . . . . . . . . . . . . . . . . . . . . . . . . . . . . . . . . . . . . . . . . . . . . . . . . . . . . . . . . . . . . . . . . . . . . (7)% 2%
The Gap, Inc. . . . . . . . . . . . . . . . . . . . . . . . . . . . . . . . . . . . . . . . . . . . . . . . . . . . . . . . . . . . . . . . . . . . . . . . . . . . . . . . . . (4)% 2%
The percentage change in Comp store sales by brand and region and for total Company, excluding the associatedcomparable online sales, as compared with the preceding year, is as follows:
Fiscal Year2011 2010
Gap North America . . . . . . . . . . . . . . . . . . . . . . . . . . . . . . . . . . . . . . . . . . . . . . . . . . . . . . . . . . . . . . . . . . . . . . . . . . . . (6)% (1)%
Old Navy North America . . . . . . . . . . . . . . . . . . . . . . . . . . . . . . . . . . . . . . . . . . . . . . . . . . . . . . . . . . . . . . . . . . . . . . . . (6)% 2%
Banana Republic North America . . . . . . . . . . . . . . . . . . . . . . . . . . . . . . . . . . . . . . . . . . . . . . . . . . . . . . . . . . . . . . . . . (2)% 3%
International . . . . . . . . . . . . . . . . . . . . . . . . . . . . . . . . . . . . . . . . . . . . . . . . . . . . . . . . . . . . . . . . . . . . . . . . . . . . . . . . . . (9)% 1%
The Gap, Inc. . . . . . . . . . . . . . . . . . . . . . . . . . . . . . . . . . . . . . . . . . . . . . . . . . . . . . . . . . . . . . . . . . . . . . . . . . . . . . . . . . . (6)% 1%
20 Gap Inc. Form 10-K

Only Company-operated stores are included in the calculations of Comp sales. Gap and Banana Republic outletComp sales are reflected within the respective results of each brand. The results for Athleta are excluded from thecalculations of total Company Comp sales due to its number of Comp stores compared to our other brands. Theresults for Piperlime are excluded from the calculations of total Company Comp sales, as Piperlime is an online-only brand.
A store is included in the Comp sales calculations when it has been open for at least one calendar year and theselling square footage has not changed by 15 percent or more within the past year. A store is included in the Compsales calculations on the first day it has comparable prior year sales. Stores in which the selling square footage haschanged by 15 percent or more as a result of a remodel, expansion, or reduction are excluded from the Comp salescalculations until the first day they have comparable prior year sales.
A store is considered non-comparable (“Non-comp”) when it has been open for less than one calendar year or haschanged its selling square footage by 15 percent or more within the past year.
A store is considered “Closed” if it is temporarily closed for three or more full consecutive days or is permanentlyclosed. When a temporarily closed store reopens, the store will be placed in the Comp/Non-comp status it was inprior to its closure. If a store was in Closed status for three or more days in the prior year, the store will be inNon-comp status for the same days the following year.
Online Comp sales are defined as sales through online channels in countries where we have existing Comp storesales.
Current year foreign exchange rates are applied to both current year and prior year Comp sales to achieve aconsistent basis for comparison.
Store Count and Square Footage InformationNet sales per average square foot is as follows:
Fiscal Year2011 2010 2009
Net sales per average square foot (1) . . . . . . . . . . . . . . . . . . . . . . . . . . . . . . . . . . . . . . . . . . . . . . . . . . . $337 $342 $329
(1) Excludes net sales associated with our online, catalog, wholesale, and franchise businesses.
21
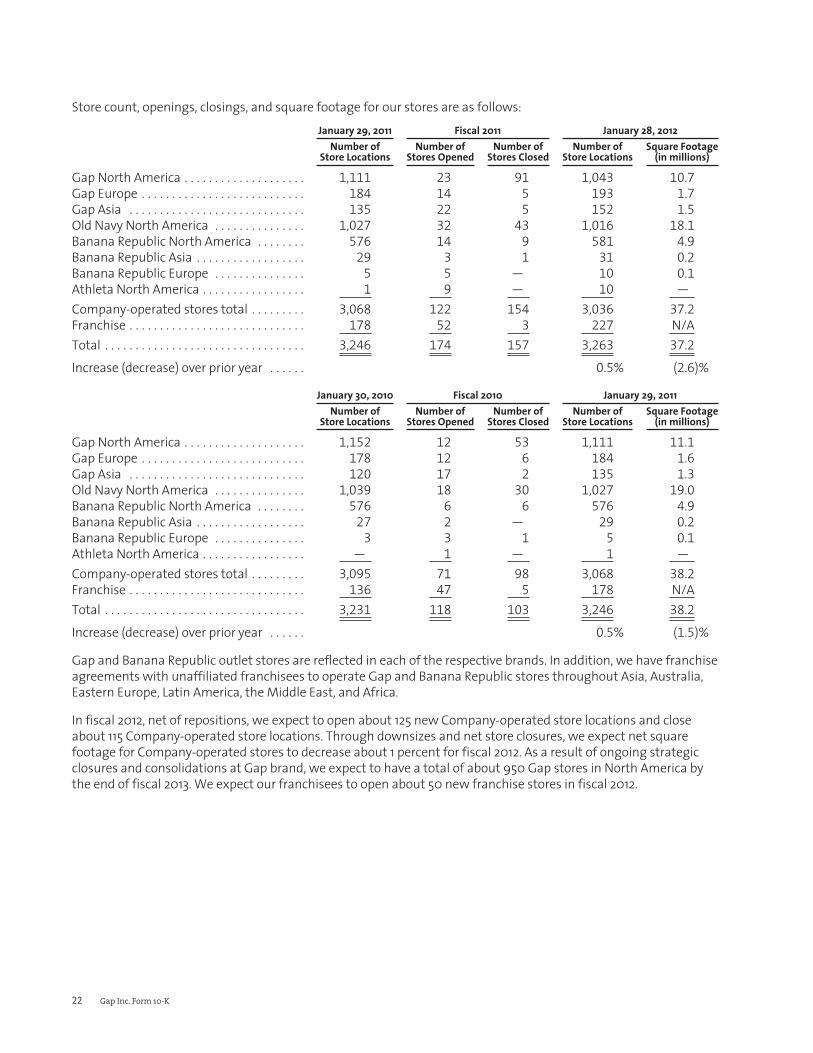
Store count, openings, closings, and square footage for our stores are as follows:January 29, 2011 Fiscal 2011 January 28, 2012
Number ofStore Locations
Number ofStores Opened
Number ofStores Closed
Number ofStore Locations
Square Footage(in millions)
Gap North America . . . . . . . . . . . . . . . . . . . . 1,111 23 91 1,043 10.7
Gap Europe . . . . . . . . . . . . . . . . . . . . . . . . . . . 184 14 5 193 1.7
Gap Asia . . . . . . . . . . . . . . . . . . . . . . . . . . . . . 135 22 5 152 1.5
Old Navy North America . . . . . . . . . . . . . . . 1,027 32 43 1,016 18.1
Banana Republic North America . . . . . . . . 576 14 9 581 4.9
Banana Republic Asia . . . . . . . . . . . . . . . . . . 29 3 1 31 0.2
Banana Republic Europe . . . . . . . . . . . . . . . 5 5 — 10 0.1
Athleta North America . . . . . . . . . . . . . . . . . 1 9 — 10 —
Company-operated stores total . . . . . . . . . 3,068 122 154 3,036 37.2
Franchise . . . . . . . . . . . . . . . . . . . . . . . . . . . . . 178 52 3 227 N/ATotal . . . . . . . . . . . . . . . . . . . . . . . . . . . . . . . . . 3,246 174 157 3,263 37.2
Increase (decrease) over prior year . . . . . . 0.5% (2.6)%
January 30, 2010 Fiscal 2010 January 29, 2011Number of
Store LocationsNumber of
Stores OpenedNumber of
Stores ClosedNumber of
Store LocationsSquare Footage
(in millions)
Gap North America . . . . . . . . . . . . . . . . . . . . 1,152 12 53 1,111 11.1
Gap Europe . . . . . . . . . . . . . . . . . . . . . . . . . . . 178 12 6 184 1.6
Gap Asia . . . . . . . . . . . . . . . . . . . . . . . . . . . . . 120 17 2 135 1.3
Old Navy North America . . . . . . . . . . . . . . . 1,039 18 30 1,027 19.0
Banana Republic North America . . . . . . . . 576 6 6 576 4.9
Banana Republic Asia . . . . . . . . . . . . . . . . . . 27 2 — 29 0.2
Banana Republic Europe . . . . . . . . . . . . . . . 3 3 1 5 0.1
Athleta North America . . . . . . . . . . . . . . . . . — 1 — 1 —
Company-operated stores total . . . . . . . . . 3,095 71 98 3,068 38.2
Franchise . . . . . . . . . . . . . . . . . . . . . . . . . . . . . 136 47 5 178 N/ATotal . . . . . . . . . . . . . . . . . . . . . . . . . . . . . . . . . 3,231 118 103 3,246 38.2
Increase (decrease) over prior year . . . . . . 0.5% (1.5)%
Gap and Banana Republic outlet stores are reflected in each of the respective brands. In addition, we have franchiseagreements with unaffiliated franchisees to operate Gap and Banana Republic stores throughout Asia, Australia,Eastern Europe, Latin America, the Middle East, and Africa.
In fiscal 2012, net of repositions, we expect to open about 125 new Company-operated store locations and closeabout 115 Company-operated store locations. Through downsizes and net store closures, we expect net squarefootage for Company-operated stores to decrease about 1 percent for fiscal 2012. As a result of ongoing strategicclosures and consolidations at Gap brand, we expect to have a total of about 950 Gap stores in North America bythe end of fiscal 2013. We expect our franchisees to open about 50 new franchise stores in fiscal 2012.
22 Gap Inc. Form 10-K

Net Sales DiscussionOur net sales for fiscal 2011 decreased $115 million, or 1 percent, compared with fiscal 2010 due to a decrease in netsales of $376 million related to our Stores reportable segment, partially offset by an increase in net sales of $261million related to our Direct reportable segment.
• For the Stores reportable segment, our net sales for fiscal 2011 decreased $376 million, or 3 percent, comparedwith fiscal 2010. The decrease was primarily due to a decrease in Comp store sales, excluding the associatedcomparable online sales, of 6 percent for fiscal 2011 compared with fiscal 2010, partially offset by the favorableimpact of foreign exchange of $156 million and an increase in franchise sales. The foreign exchange impact is thetranslation impact if net sales for fiscal 2010 were translated at fiscal 2011 exchange rates.
• For the Direct reportable segment, our net sales for fiscal 2011 increased $261 million, or 20 percent, comparedwith fiscal 2010. The increase was due to the growth in our online business across all brands and the incrementalsales related to the introduction of international online sales in fiscal 2010.
In fiscal 2011, our net sales, including Direct, for the U.S. and Canada were $12.4 billion, a decrease of $353 million or3 percent compared with $12.7 billion for fiscal 2010. In fiscal 2011, our net sales, including Direct, outside of the U.S.and Canada were $2.2 billion, an increase of $238 million or 12 percent compared with $1.9 billion for fiscal 2010.
Our net sales for fiscal 2010 increased $467 million, or 3 percent, compared with fiscal 2009 due to an increase innet sales of $286 million related to our Stores reportable segment and an increase in net sales of $181 millionrelated to our Direct reportable segment.
• For the Stores reportable segment, our net sales for fiscal 2010 increased $286 million, or 2 percent, comparedwith fiscal 2009. The increase was primarily due to an increase in net sales at our new international stores, anincrease in Comp store sales, excluding the associated comparable online sales, of 1 percent, and the favorableimpact of foreign exchange of $116 million. The foreign exchange impact is the translation impact if net sales forfiscal 2009 were translated at fiscal 2010 exchange rates.
• For the Direct reportable segment, our net sales for fiscal 2010 increased $181 million, or 16 percent, comparedwith fiscal 2009. The increase was due to the growth in our online business across all brands, primarily Old Navy,Piperlime, and Athleta, and the incremental sales related to the introduction of international online sales in fiscal2010.
In fiscal 2010, our net sales, including Direct, for the U.S. and Canada were $12.7 billion, an increase of $259 million or 2percent compared with $12.5 billion for fiscal 2009. In fiscal 2010, our net sales, including Direct, outside of the U.S.and Canada were $1.9 billion, an increase of $208 million or 12 percent compared with $1.7 billion for fiscal 2009.
Cost of Goods Sold and Occupancy Expenses
($ in millions)
Fiscal Year2011 2010 2009
Cost of goods sold and occupancy expenses . . . . . . . . . . . . . . . . . . . . . . . . . . . . . . . . . . . . . . . $9,275 $8,775 $8,473
Gross profit . . . . . . . . . . . . . . . . . . . . . . . . . . . . . . . . . . . . . . . . . . . . . . . . . . . . . . . . . . . . . . . . . . . . $5,274 $5,889 $5,724
Cost of goods sold and occupancy expenses as a percentage of net sales . . . . . . . . . . . . . 63.8% 59.8% 59.7%
Gross margin . . . . . . . . . . . . . . . . . . . . . . . . . . . . . . . . . . . . . . . . . . . . . . . . . . . . . . . . . . . . . . . . . . . 36.2% 40.2% 40.3%
Cost of goods sold and occupancy expenses as a percentage of net sales increased 4.0 percent in fiscal 2011compared with fiscal 2010.
• Cost of goods sold increased 3.7 percent as a percentage of net sales in fiscal 2011 compared with fiscal 2010. Theincrease in cost of goods sold as a percentage of net sales was primarily driven by increased cost of merchandiseprimarily due to higher cotton prices.
23
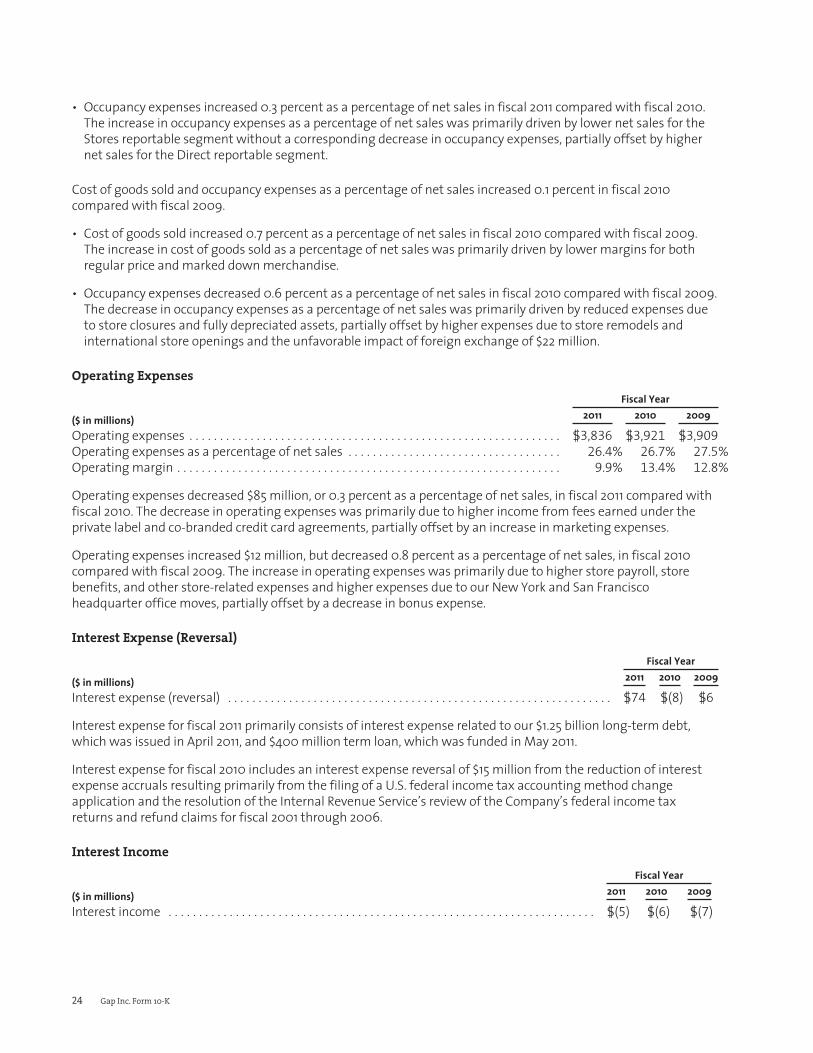
• Occupancy expenses increased 0.3 percent as a percentage of net sales in fiscal 2011 compared with fiscal 2010.The increase in occupancy expenses as a percentage of net sales was primarily driven by lower net sales for theStores reportable segment without a corresponding decrease in occupancy expenses, partially offset by highernet sales for the Direct reportable segment.
Cost of goods sold and occupancy expenses as a percentage of net sales increased 0.1 percent in fiscal 2010compared with fiscal 2009.
• Cost of goods sold increased 0.7 percent as a percentage of net sales in fiscal 2010 compared with fiscal 2009.The increase in cost of goods sold as a percentage of net sales was primarily driven by lower margins for bothregular price and marked down merchandise.
• Occupancy expenses decreased 0.6 percent as a percentage of net sales in fiscal 2010 compared with fiscal 2009.The decrease in occupancy expenses as a percentage of net sales was primarily driven by reduced expenses dueto store closures and fully depreciated assets, partially offset by higher expenses due to store remodels andinternational store openings and the unfavorable impact of foreign exchange of $22 million.
Operating Expenses
($ in millions)Operating expenses . . . . . . . . . . . . . . . . . . . . . . . . . . . . . . . . . . . . . . . . . . . . . . . . . . . . . . . . . . . . .
Fiscal Year2011 2010 2009
$3,836 $3,921 $3,909
Operating expenses as a percentage of net sales . . . . . . . . . . . . . . . . . . . . . . . . . . . . . . . . . . . 26.4% 26.7% 27.5%
Operating margin . . . . . . . . . . . . . . . . . . . . . . . . . . . . . . . . . . . . . . . . . . . . . . . . . . . . . . . . . . . . . . . 9.9% 13.4% 12.8%
Operating expenses decreased $85 million, or 0.3 percent as a percentage of net sales, in fiscal 2011 compared withfiscal 2010. The decrease in operating expenses was primarily due to higher income from fees earned under theprivate label and co-branded credit card agreements, partially offset by an increase in marketing expenses.
Operating expenses increased $12 million, but decreased 0.8 percent as a percentage of net sales, in fiscal 2010compared with fiscal 2009. The increase in operating expenses was primarily due to higher store payroll, storebenefits, and other store-related expenses and higher expenses due to our New York and San Franciscoheadquarter office moves, partially offset by a decrease in bonus expense.
Interest Expense (Reversal)
($ in millions)
Fiscal Year2011 2010 2009
Interest expense (reversal) . . . . . . . . . . . . . . . . . . . . . . . . . . . . . . . . . . . . . . . . . . . . . . . . . . . . . . . . . . . . . . . $74 $(8) $6
Interest expense for fiscal 2011 primarily consists of interest expense related to our $1.25 billion long-term debt,which was issued in April 2011, and $400 million term loan, which was funded in May 2011.
Interest expense for fiscal 2010 includes an interest expense reversal of $15 million from the reduction of interestexpense accruals resulting primarily from the filing of a U.S. federal income tax accounting method changeapplication and the resolution of the Internal Revenue Service’s review of the Company’s federal income taxreturns and refund claims for fiscal 2001 through 2006.
Interest Income
($ in millions)
Fiscal Year2011 2010 2009
Interest income . . . . . . . . . . . . . . . . . . . . . . . . . . . . . . . . . . . . . . . . . . . . . . . . . . . . . . . . . . . . . . . . . . . . . . $(5) $(6) $(7)
24 Gap Inc. Form 10-K

Interest income is earned on our cash and cash equivalents and investments. The decrease in interest income forfiscal 2011 compared with fiscal 2010 was primarily due to a lower monthly average cash and cash equivalents andinvestments balance during fiscal 2011.
The decrease in interest income for fiscal 2010 compared with fiscal 2009 was primarily due to a lower monthlyaverage cash and cash equivalents and investments balance during fiscal 2010.
Income Taxes
($ in millions)
Fiscal Year2011 2010 2009
Income taxes . . . . . . . . . . . . . . . . . . . . . . . . . . . . . . . . . . . . . . . . . . . . . . . . . . . . . . . . . . . . . . . . . . . . . . $ 536 $ 778 $ 714
Effective tax rate . . . . . . . . . . . . . . . . . . . . . . . . . . . . . . . . . . . . . . . . . . . . . . . . . . . . . . . . . . . . . . . . . . . 39.2% 39.3% 39.3%
While the effective tax rate for fiscal 2011 decreased slightly compared with fiscal 2010, there were changes inindividual components of the effective tax rate. State and other income taxes decreased primarily due to changesin state tax laws and increases in state and federal tax credits. The decreases in these components were offset bythe tax impact of foreign operations, which increased primarily due to operating losses in China and Hong Kong forfiscal 2011 (for which no tax benefit has been provided), and their greater impact due to lower Gap Inc. pre-taxincome for fiscal 2011, as well as the unfavorable impact of a change in the mix of income between domestic andforeign operations.
Although the effective tax rate for fiscal 2010 remained unchanged from fiscal 2009, there were changes inindividual components of the effective tax rate. The tax impact of foreign operations increased primarily due to therecording of valuation allowances related to losses incurred by our China subsidiaries and incremental tax expenserelated to the repatriation of earnings from our Canadian subsidiaries. The increase was primarily offset by therelease of unrecognized tax benefits for closed years.
We currently expect the fiscal 2012 effective tax rate to be about 39.5 percent. The actual rate will ultimatelydepend on several variables, including the mix of income between domestic and international operations, theoverall level of income, the potential resolution of outstanding tax contingencies, and changes in tax laws andrates.
Liquidity and Capital ResourcesOur largest source of operating cash flows is cash collections from the sale of our merchandise. Our primary usesof cash include merchandise inventory purchases, occupancy costs, personnel-related expenses, purchases ofproperty and equipment, payment of taxes, and share repurchases. In addition to share repurchases, we alsocontinue to return cash to our shareholders in the form of dividends.
In the first quarter of fiscal 2011, we made the strategic decision to issue debt in the aggregate amount of $1.65billion. Given favorable market conditions and our history of generating consistent and strong operating cash flow,we took this step to provide a more optimal capital structure. The Company has generated annual cash flow fromoperations in excess of $1 billion per year for the past decade and ended fiscal 2011 with $1.9 billion of cash and cashequivalents. We remain committed to maintaining a strong financial profile with ample liquidity.
We consider the following to be measures of our liquidity and capital resources:
($ in millions)January 28,
2012January 29,
2011January 30,
2010
Cash and cash equivalents and short-term investments . . . . . . . . . . . . . . . . . . . . . . $ 1,885 $ 1,661 $ 2,573
Debt . . . . . . . . . . . . . . . . . . . . . . . . . . . . . . . . . . . . . . . . . . . . . . . . . . . . . . . . . . . . . . . . . . . . $ 1,665 $ 3 $ —
Working capital . . . . . . . . . . . . . . . . . . . . . . . . . . . . . . . . . . . . . . . . . . . . . . . . . . . . . . . . . . $ 2,181 $ 1,831 $ 2,533
Current ratio . . . . . . . . . . . . . . . . . . . . . . . . . . . . . . . . . . . . . . . . . . . . . . . . . . . . . . . . . . . . . 2.02:1 1.87:1 2.19:1
As of January 28, 2012, the majority of our cash and cash equivalents was held in the U.S. and is generally accessiblewithout any limitations.
25
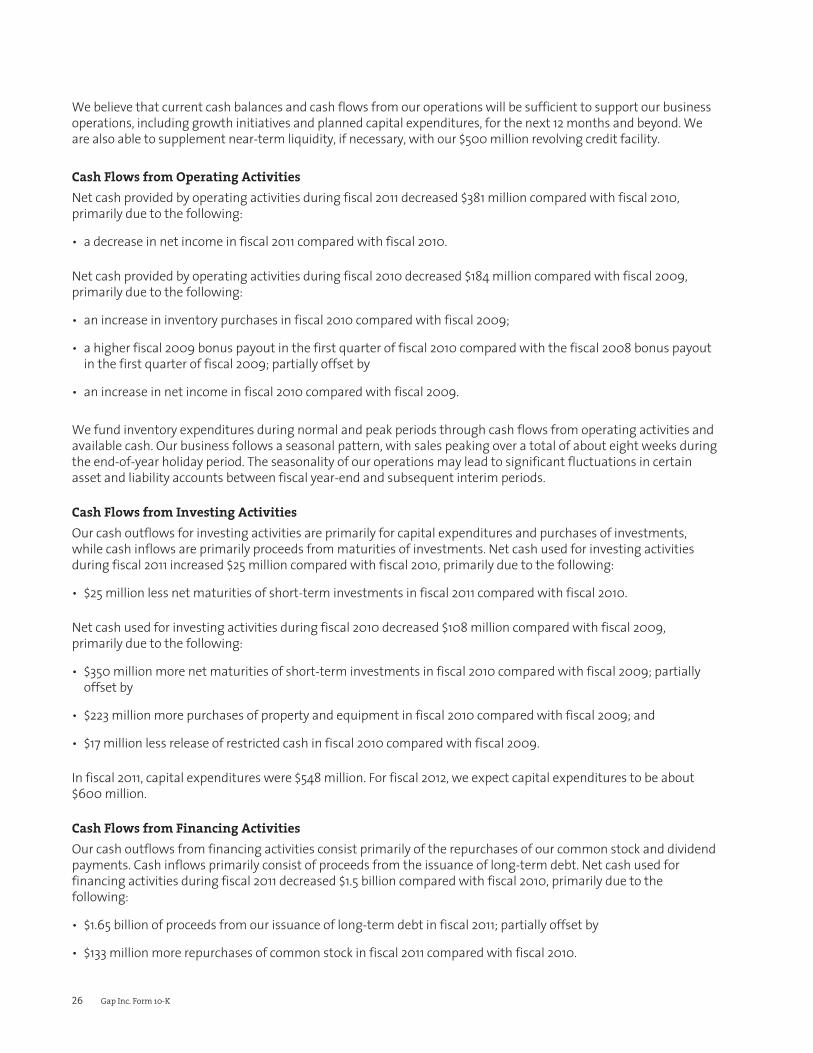
We believe that current cash balances and cash flows from our operations will be sufficient to support our businessoperations, including growth initiatives and planned capital expenditures, for the next 12 months and beyond. Weare also able to supplement near-term liquidity, if necessary, with our $500 million revolving credit facility.
Cash Flows from Operating ActivitiesNet cash provided by operating activities during fiscal 2011 decreased $381 million compared with fiscal 2010,primarily due to the following:
• a decrease in net income in fiscal 2011 compared with fiscal 2010.
Net cash provided by operating activities during fiscal 2010 decreased $184 million compared with fiscal 2009,primarily due to the following:
• an increase in inventory purchases in fiscal 2010 compared with fiscal 2009;
• a higher fiscal 2009 bonus payout in the first quarter of fiscal 2010 compared with the fiscal 2008 bonus payoutin the first quarter of fiscal 2009; partially offset by
• an increase in net income in fiscal 2010 compared with fiscal 2009.
We fund inventory expenditures during normal and peak periods through cash flows from operating activities andavailable cash. Our business follows a seasonal pattern, with sales peaking over a total of about eight weeks duringthe end-of-year holiday period. The seasonality of our operations may lead to significant fluctuations in certainasset and liability accounts between fiscal year-end and subsequent interim periods.
Cash Flows from Investing ActivitiesOur cash outflows for investing activities are primarily for capital expenditures and purchases of investments,while cash inflows are primarily proceeds from maturities of investments. Net cash used for investing activitiesduring fiscal 2011 increased $25 million compared with fiscal 2010, primarily due to the following:
• $25 million less net maturities of short-term investments in fiscal 2011 compared with fiscal 2010.
Net cash used for investing activities during fiscal 2010 decreased $108 million compared with fiscal 2009,primarily due to the following:
• $350 million more net maturities of short-term investments in fiscal 2010 compared with fiscal 2009; partiallyoffset by
• $223 million more purchases of property and equipment in fiscal 2010 compared with fiscal 2009; and
• $17 million less release of restricted cash in fiscal 2010 compared with fiscal 2009.
In fiscal 2011, capital expenditures were $548 million. For fiscal 2012, we expect capital expenditures to be about$600 million.
Cash Flows from Financing ActivitiesOur cash outflows from financing activities consist primarily of the repurchases of our common stock and dividendpayments. Cash inflows primarily consist of proceeds from the issuance of long-term debt. Net cash used forfinancing activities during fiscal 2011 decreased $1.5 billion compared with fiscal 2010, primarily due to thefollowing:
• $1.65 billion of proceeds from our issuance of long-term debt in fiscal 2011; partially offset by
• $133 million more repurchases of common stock in fiscal 2011 compared with fiscal 2010.
26 Gap Inc. Form 10-K
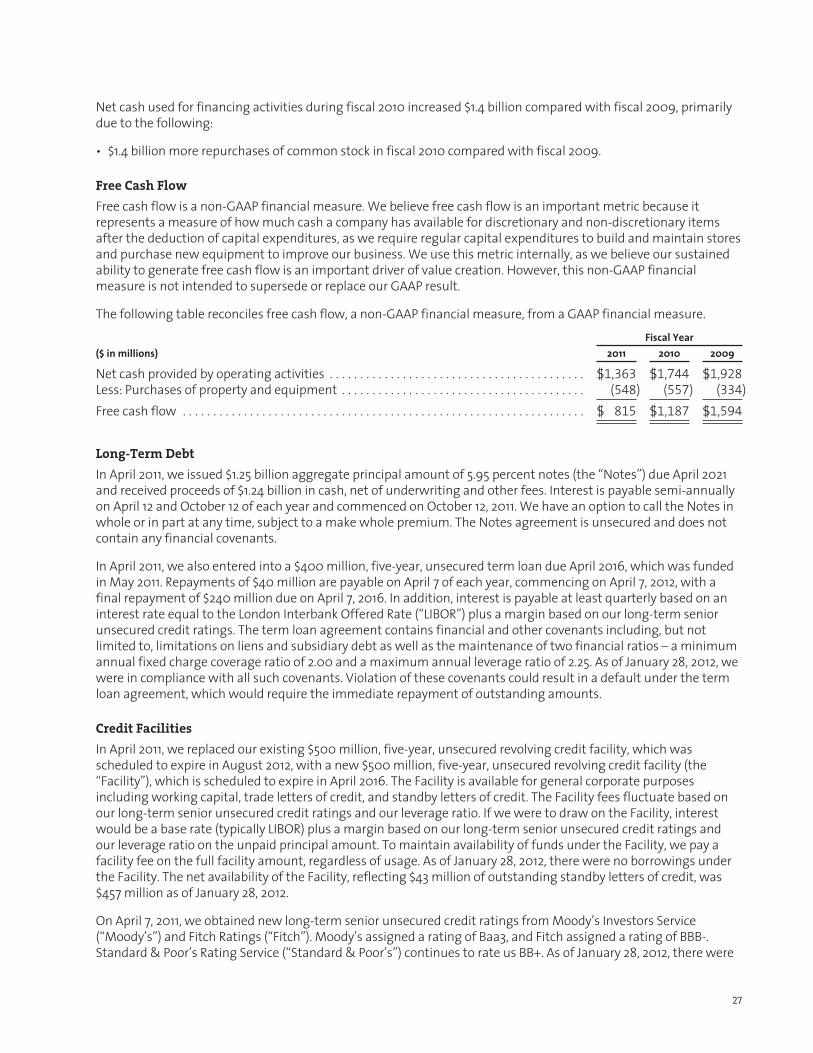
Net cash used for financing activities during fiscal 2010 increased $1.4 billion compared with fiscal 2009, primarilydue to the following:
• $1.4 billion more repurchases of common stock in fiscal 2010 compared with fiscal 2009.
Free Cash FlowFree cash flow is a non-GAAP financial measure. We believe free cash flow is an important metric because itrepresents a measure of how much cash a company has available for discretionary and non-discretionary itemsafter the deduction of capital expenditures, as we require regular capital expenditures to build and maintain storesand purchase new equipment to improve our business. We use this metric internally, as we believe our sustainedability to generate free cash flow is an important driver of value creation. However, this non-GAAP financialmeasure is not intended to supersede or replace our GAAP result.
The following table reconciles free cash flow, a non-GAAP financial measure, from a GAAP financial measure.Fiscal Year
($ in millions) 2011 2010 2009
Net cash provided by operating activities . . . . . . . . . . . . . . . . . . . . . . . . . . . . . . . . . . . . . . . . . . $1,363 $1,744 $1,928
Less: Purchases of property and equipment . . . . . . . . . . . . . . . . . . . . . . . . . . . . . . . . . . . . . . . . (548) (557) (334)
Free cash flow . . . . . . . . . . . . . . . . . . . . . . . . . . . . . . . . . . . . . . . . . . . . . . . . . . . . . . . . . . . . . . . . . . $ 815 $1,187 $1,594
Long-Term DebtIn April 2011, we issued $1.25 billion aggregate principal amount of 5.95 percent notes (the “Notes”) due April 2021and received proceeds of $1.24 billion in cash, net of underwriting and other fees. Interest is payable semi-annuallyon April 12 and October 12 of each year and commenced on October 12, 2011. We have an option to call the Notes inwhole or in part at any time, subject to a make whole premium. The Notes agreement is unsecured and does notcontain any financial covenants.
In April 2011, we also entered into a $400 million, five-year, unsecured term loan due April 2016, which was fundedin May 2011. Repayments of $40 million are payable on April 7 of each year, commencing on April 7, 2012, with afinal repayment of $240 million due on April 7, 2016. In addition, interest is payable at least quarterly based on aninterest rate equal to the London Interbank Offered Rate (“LIBOR”) plus a margin based on our long-term seniorunsecured credit ratings. The term loan agreement contains financial and other covenants including, but notlimited to, limitations on liens and subsidiary debt as well as the maintenance of two financial ratios – a minimumannual fixed charge coverage ratio of 2.00 and a maximum annual leverage ratio of 2.25. As of January 28, 2012, wewere in compliance with all such covenants. Violation of these covenants could result in a default under the termloan agreement, which would require the immediate repayment of outstanding amounts.
Credit FacilitiesIn April 2011, we replaced our existing $500 million, five-year, unsecured revolving credit facility, which wasscheduled to expire in August 2012, with a new $500 million, five-year, unsecured revolving credit facility (the“Facility”), which is scheduled to expire in April 2016. The Facility is available for general corporate purposesincluding working capital, trade letters of credit, and standby letters of credit. The Facility fees fluctuate based onour long-term senior unsecured credit ratings and our leverage ratio. If we were to draw on the Facility, interestwould be a base rate (typically LIBOR) plus a margin based on our long-term senior unsecured credit ratings andour leverage ratio on the unpaid principal amount. To maintain availability of funds under the Facility, we pay afacility fee on the full facility amount, regardless of usage. As of January 28, 2012, there were no borrowings underthe Facility. The net availability of the Facility, reflecting $43 million of outstanding standby letters of credit, was$457 million as of January 28, 2012.
On April 7, 2011, we obtained new long-term senior unsecured credit ratings from Moody’s Investors Service(“Moody’s”) and Fitch Ratings (“Fitch”). Moody’s assigned a rating of Baa3, and Fitch assigned a rating of BBB-.Standard & Poor’s Rating Service (“Standard & Poor’s”) continues to rate us BB+. As of January 28, 2012, there were
27
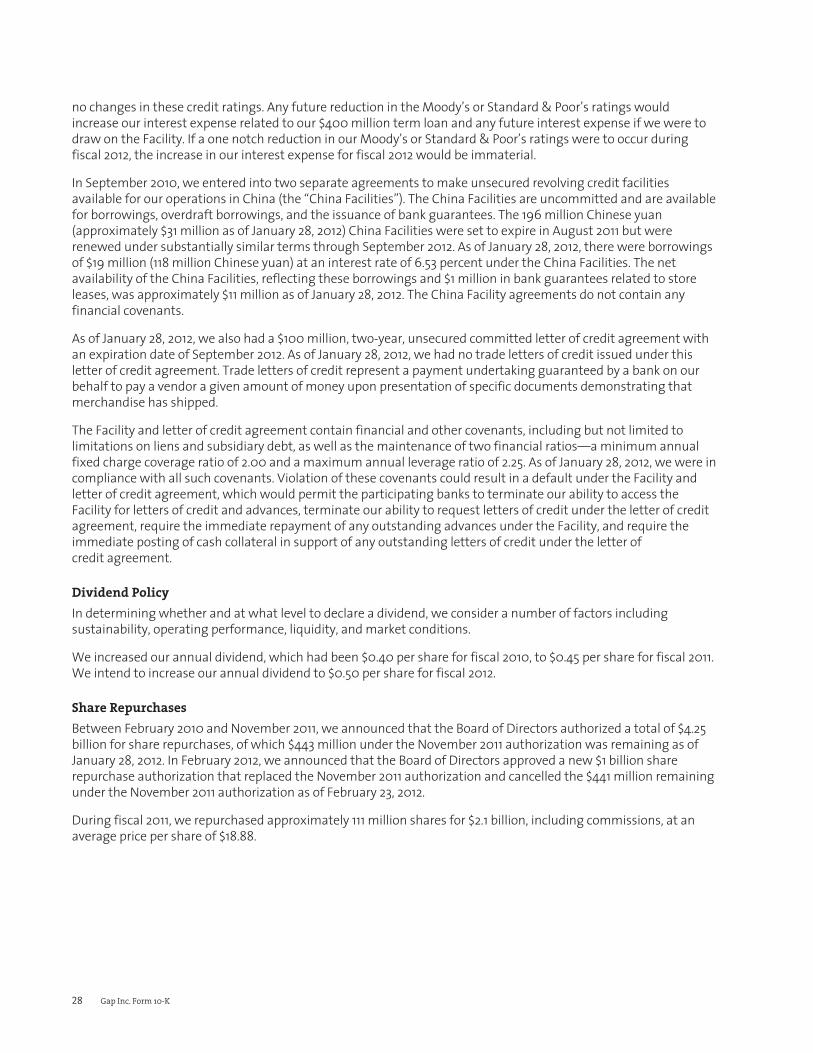
no changes in these credit ratings. Any future reduction in the Moody’s or Standard & Poor’s ratings wouldincrease our interest expense related to our $400 million term loan and any future interest expense if we were todraw on the Facility. If a one notch reduction in our Moody’s or Standard & Poor’s ratings were to occur duringfiscal 2012, the increase in our interest expense for fiscal 2012 would be immaterial.
In September 2010, we entered into two separate agreements to make unsecured revolving credit facilitiesavailable for our operations in China (the “China Facilities”). The China Facilities are uncommitted and are availablefor borrowings, overdraft borrowings, and the issuance of bank guarantees. The 196 million Chinese yuan(approximately $31 million as of January 28, 2012) China Facilities were set to expire in August 2011 but wererenewed under substantially similar terms through September 2012. As of January 28, 2012, there were borrowingsof $19 million (118 million Chinese yuan) at an interest rate of 6.53 percent under the China Facilities. The netavailability of the China Facilities, reflecting these borrowings and $1 million in bank guarantees related to storeleases, was approximately $11 million as of January 28, 2012. The China Facility agreements do not contain anyfinancial covenants.
As of January 28, 2012, we also had a $100 million, two-year, unsecured committed letter of credit agreement withan expiration date of September 2012. As of January 28, 2012, we had no trade letters of credit issued under thisletter of credit agreement. Trade letters of credit represent a payment undertaking guaranteed by a bank on ourbehalf to pay a vendor a given amount of money upon presentation of specific documents demonstrating thatmerchandise has shipped.
The Facility and letter of credit agreement contain financial and other covenants, including but not limited tolimitations on liens and subsidiary debt, as well as the maintenance of two financial ratios—a minimum annualfixed charge coverage ratio of 2.00 and a maximum annual leverage ratio of 2.25. As of January 28, 2012, we were incompliance with all such covenants. Violation of these covenants could result in a default under the Facility andletter of credit agreement, which would permit the participating banks to terminate our ability to access theFacility for letters of credit and advances, terminate our ability to request letters of credit under the letter of creditagreement, require the immediate repayment of any outstanding advances under the Facility, and require theimmediate posting of cash collateral in support of any outstanding letters of credit under the letter ofcredit agreement.
Dividend PolicyIn determining whether and at what level to declare a dividend, we consider a number of factors includingsustainability, operating performance, liquidity, and market conditions.
We increased our annual dividend, which had been $0.40 per share for fiscal 2010, to $0.45 per share for fiscal 2011.We intend to increase our annual dividend to $0.50 per share for fiscal 2012.
Share RepurchasesBetween February 2010 and November 2011, we announced that the Board of Directors authorized a total of $4.25billion for share repurchases, of which $443 million under the November 2011 authorization was remaining as ofJanuary 28, 2012. In February 2012, we announced that the Board of Directors approved a new $1 billion sharerepurchase authorization that replaced the November 2011 authorization and cancelled the $441 million remainingunder the November 2011 authorization as of February 23, 2012.
During fiscal 2011, we repurchased approximately 111 million shares for $2.1 billion, including commissions, at anaverage price per share of $18.88.
28 Gap Inc. Form 10-K

Contractual Cash ObligationsWe are party to many contractual obligations involving commitments to make payments to third parties. Thefollowing table provides summary information concerning our future contractual obligations as of January 28,2012. These obligations impact our short-term and long-term liquidity and capital resource needs. Certain ofthese contractual obligations are reflected in the Consolidated Balance Sheet, while others are disclosed asfuture obligations.
Payments Due by Period
($ in millions)Less than 1
Year 1-3 Years 3-5 YearsMore Than 5
Years Total
Long-term debt (1) . . . . . . . . . . . . . . . . . . . . . . . . . . . . . . . . . . . $ 40 $ 80 $ 280 $1,250 $ 1,650
Interest payable . . . . . . . . . . . . . . . . . . . . . . . . . . . . . . . . . . . . . 76 148 148 312 684
Liabilities for unrecognized tax benefits (2) . . . . . . . . . . . . . 1 — — — 1
Operating leases (3) . . . . . . . . . . . . . . . . . . . . . . . . . . . . . . . . . . 1,025 1,718 1,207 1,609 5,559
Purchase obligations and commitments (4) . . . . . . . . . . . . 2,712 229 126 8 3,075
Total contractual cash obligations . . . . . . . . . . . . . . . . . . . . . . . . . $3,854 $2,175 $1,761 $3,179 $10,969
(1) Represents principal maturities, excluding interest. See Note 4 of Notes to Consolidated Financial Statements.
(2) Excludes $101 million of long-term liabilities related to uncertain tax positions, as we are not able to reasonably estimate when cashpayments will occur. Amount is recorded in lease incentives and other long-term liabilities in the Consolidated Balance Sheet as ofJanuary 28, 2012.
(3) Excludes maintenance, insurance, taxes, and contingent rent obligations. See Note 10 of Notes to Consolidated Financial Statements fordiscussion of our operating leases.
(4) Represents estimated open purchase orders to purchase inventory as well as commitments for products and services used in the normalcourse of business.
Commercial CommitmentsWe have commercial commitments, not reflected in the table above, that were incurred in the normal course ofbusiness to support our operations, including standby letters of credit of $45 million (of which $43 million wasissued under the revolving credit facility lines), surety bonds of $38 million, and bank guarantees of $6 millionoutstanding as of January 28, 2012.
Other Cash Obligations Not Reflected in the Consolidated Balance Sheet (Off-Balance Sheet Arrangements)The majority of our contractual obligations relate to operating leases for our stores. Future minimum leasepayments represent commitments under non-cancelable operating leases and are disclosed in Item 8, FinancialStatements and Supplementary Data, Note 10 of Notes to Consolidated Financial Statements.
Our other off-balance sheet arrangements are disclosed in Item 8, Financial Statements and Supplementary Data,Note 14 of Notes to Consolidated Financial Statements.
Critical Accounting Policies and EstimatesThe preparation of financial statements in accordance with GAAP requires management to adopt accountingpolicies and make significant judgments and estimates to develop amounts reflected and disclosed in the financialstatements. In many cases, there are alternative policies or estimation techniques that could be used. We maintaina thorough process to review the application of our accounting policies and to evaluate the appropriateness of themany estimates that are required to prepare the financial statements of a large, global corporation. However, evenunder optimal circumstances, estimates routinely require adjustment based on changing circumstances and thereceipt of new or better information.
Our significant accounting policies can be found in Item 8, Financial Statements and Supplementary Data, Note 1of Notes to Consolidated Financial Statements. The policies and estimates discussed below include the financialstatement elements that are either judgmental or involve the selection or application of alternative accounting
29
policies and are material to our financial statements. Management has discussed the development and selectionof these critical accounting policies and estimates with the Audit and Finance Committee of our Board of Directors,which has reviewed our disclosure relating to critical accounting policies and estimates in this annual report onForm 10-K.
Merchandise InventoryWe value inventory at the lower of cost or market (“LCM”), with cost determined using the weighted-average costmethod. We review our inventory levels in order to identify slow-moving merchandise and broken assortments(items no longer in stock in a sufficient range of sizes or colors) and use markdowns to clear merchandise. Werecord an adjustment when future estimated selling price is less than cost. Our LCM adjustment calculationrequires management to make assumptions to estimate the selling price and amount of slow-movingmerchandise and broken assortments subject to markdowns, which is dependent upon factors such as historicaltrends with similar merchandise, inventory aging, forecasted consumer demand, and the promotionalenvironment. In addition, we estimate and accrue shortage for the period between the last physical count and thebalance sheet date. Our shortage estimate can be affected by changes in merchandise mix and changes in actualshortage trends. Historically, actual shortage has not differed materially from our estimates.
We do not believe there is a reasonable likelihood that there will be a material change in the future estimates orassumptions we use to calculate our LCM or inventory shortage adjustments. However, if estimates regardingconsumer demand are inaccurate or actual physical inventory shortage differs significantly from our estimate, ouroperating results could be affected. We have not made any material changes in the accounting methodology usedto calculate our LCM or inventory shortage adjustments in the past three fiscal years.
Impairment of Long-Lived Assets, Goodwill, and Intangible AssetsWe review the carrying amount of long-lived assets for impairment whenever events or changes in circumstancesindicate that the carrying amount of an asset or asset group may not be recoverable. Events that result in animpairment review include the decision to close a store, corporate facility, or distribution center, or a significantdecrease in the operating performance of the long-lived asset. Long-lived assets are considered impaired if theestimated undiscounted future cash flows of the asset or asset group are less than the carrying amount. Forimpaired assets, we recognize a loss equal to the difference between the carrying amount of the asset or assetgroup and its estimated fair value. The estimated fair value of the asset or asset group is based on estimateddiscounted future cash flows of the asset or asset group using a discount rate commensurate with the risk. Theasset group is defined as the lowest level for which identifiable cash flows are available, which for retail stores is atthe store level. Our estimate of future cash flows requires management to make assumptions and to applyjudgment, including forecasting future sales and expenses and estimating useful lives of the assets. Theseestimates can be affected by factors such as future store results, real estate demand, and economic conditions thatcan be difficult to predict. We have not made any material changes in the methodology to assess and calculateimpairment of long-lived assets in the past three fiscal years. We recorded a charge for the impairment of long-lived assets of $16 million, $8 million, and $14 million for fiscal 2011, 2010, and 2009, respectively.
We also review the carrying amount of goodwill and other indefinite-lived intangible assets for impairmentannually and whenever events or changes in circumstances indicate that it is more likely than not that the carryingamount may not be recoverable. Events that result in an impairment review include significant changes in thebusiness climate, declines in our operating results, or an expectation that the carrying amount may not berecoverable. Goodwill and other indefinite-lived intangible assets are allocated to the Direct reportable segment.
In connection with the acquisition of Athleta in September 2008, we allocated $99 million of the purchase price togoodwill. The carrying amount of goodwill was $99 million as of January 28, 2012 and January 29, 2011. EffectiveOctober 30, 2011, we adopted an accounting standards update to simplify the testing of goodwill for impairment.As such, we review goodwill for impairment by first assessing qualitative factors to determine whether it is morelikely than not that the fair value of the reporting unit is less than its carrying amount, including goodwill, as abasis for determining whether it is necessary to perform the two-step goodwill impairment test. If it is determinedthat it is not more likely than not that the fair value of the reporting unit is less than its carrying amount, it is
30 Gap Inc. Form 10-K

unnecessary to perform the two-step goodwill impairment test. If it is determined that it is more likely than notthat the fair value of the reporting unit is less than its carrying amount, the first step of the two-step goodwillimpairment test is required to compare the fair value of the reporting unit to its carrying amount, includinggoodwill. If the carrying amount of the reporting unit exceeds its fair value, the second step of the two-stepgoodwill impairment test is required to measure the goodwill impairment loss. The second step includeshypothetically valuing all the tangible and intangible assets of the reporting unit as if the reporting unit had beenacquired in a business combination. Then, the implied fair value of the reporting unit’s goodwill is compared to thecarrying amount of that goodwill. If the carrying amount of the reporting unit’s goodwill exceeds the implied fairvalue of the goodwill, we recognize an impairment loss in an amount equal to the excess, not to exceed thecarrying amount.
A reporting unit is an operating segment or a business unit one level below that operating segment, for whichdiscrete financial information is prepared and regularly reviewed by segment management. We have deemedAthleta to be a component of our Direct operating segment, as it is the level at which segment managementregularly reviews operating results and makes resource allocation decisions. However, as Athleta is aggregatedwith other components of the Direct operating segment due to the components having similar economiccharacteristics, we have deemed our Direct operating segment to be the single reporting unit at which goodwill istested for impairment. During the fourth quarter of fiscal 2011, we completed our annual impairment testing ofgoodwill and did not recognize any impairment charges. We determined that as of the date of our annualimpairment review, the fair value of goodwill significantly exceeded its carrying amount, and it is not more likelythan not that the fair value of the Direct reporting unit is less than its carrying amount.
In connection with the acquisition of Athleta in September 2008, we allocated $54 million of the purchase price tothe trade name. The carrying amount of the trade name was $54 million as of January 28, 2012 and January 29, 2011.The trade name is considered impaired if the estimated fair value of the trade name is less than the carryingamount. If the trade name is considered impaired, we recognize a loss equal to the difference between the carryingamount and the estimated fair value of the trade name. The fair value of the trade name is determined using therelief from royalty method. During the fourth quarter of fiscal 2011, we completed our annual impairment review ofthe trade name. The fair value of the trade name significantly exceeded its carrying value as of the date of ourannual impairment review, and we did not recognize any impairment charges.
These analyses require management to make assumptions and to apply judgment, including forecasting futuresales, expenses, discount rates, and royalty rates, which can be affected by economic conditions and other factorsthat can be difficult to predict.
We do not believe there is a reasonable likelihood that there will be a material change in the estimates orassumptions we use to calculate impairment losses of long-lived assets, goodwill, and intangible assets. However,if actual results are not consistent with our estimates and assumptions used in the calculations, we may beexposed to losses that could be material.
Insurance and Self-InsuranceWe use a combination of insurance and self-insurance for a number of risk management activities, includingworkers’ compensation, general liability, and employee related health care benefits, a portion of which is paid byour employees. Liabilities associated with these risks are estimated based primarily on actuarially-determinedamounts and accrued in part by considering historical claims experience, demographic factors, severity factors, andother actuarial assumptions. Any actuarial projection of losses is subject to a high degree of variability. Among thecauses of this variability are unpredictable external factors affecting future inflation rates, litigation trends, legalinterpretations, benefit level changes, health care costs, and claim settlement patterns. Historically, actual resultsfor estimated losses have not differed materially from our estimates.
We do not believe there is a reasonable likelihood that there will be a material change in the estimates orassumptions we use to calculate our insurance liabilities. However, if actual results are not consistent with ourestimates or assumptions, we may be exposed to losses or gains that could be material.
31

Revenue RecognitionWhile revenue recognition for the Company does not involve significant judgment, it represents an importantaccounting policy. We recognize revenue and the related cost of goods sold at the time the products are receivedby the customers. For store sales, revenue is recognized when the customer receives and pays for the merchandiseat the register, primarily with either cash, debit card, or credit card. For sales from our online and catalog business,revenue is recognized at the time we estimate the customer receives the merchandise. We record an allowance forestimated returns based on our historical return patterns and various other assumptions that managementbelieves to be reasonable.
We sell merchandise to franchisees under multi-year franchise agreements. We recognize revenue from sales tofranchisees at the time merchandise ownership is transferred to the franchisee, which generally occurs when themerchandise reaches the franchisee’s pre-designated turnover point. We also receive royalties from franchiseesbased on a percentage of the total merchandise purchased by the franchisee, net of any refunds or credits duethem. Royalty revenue is recognized when merchandise ownership is transferred to the franchisee.
We do not believe there is a reasonable likelihood that there will be a material change in the future estimates orassumptions we use to calculate our sales return reserve. However, if the actual rate of sales returns increasessignificantly, our operating results could be adversely affected. We have not made any material changes in theaccounting methodology used to estimate future sales returns in the past three fiscal years.
Unredeemed Gift Cards, Gift Certificates, and Credit VouchersUpon issuance of a gift card, gift certificate, or credit voucher, a liability is established for its cash value. The liabilityis relieved and net sales are recorded upon redemption by the customer. Over time, some portion of theseinstruments is not redeemed (“breakage”). We determine breakage income for gift cards, gift certificates, andcredit vouchers based on historical redemption patterns. Breakage income is recorded in other income, which is acomponent of operating expenses in the Consolidated Statements of Income, when we can determine the portionof the liability where redemption is remote, which is three years after the gift certificate or credit voucher is issued.When breakage is recorded, a liability is recognized for any legal obligation to remit the unredeemed portion torelevant jurisdictions. Our gift cards, gift certificates, and credit vouchers do not have expiration dates.
During the third quarter of fiscal 2009, we completed an analysis of historical redemption patterns for our giftcertificates and credit vouchers. Based on this analysis, additional data led us to conclude that three years after thegift certificate or credit voucher is issued, we can determine the portion of the liability where redemption isremote. As such, beginning in the third quarter of fiscal 2009, we changed our estimate of the elapsed time forrecording breakage income associated with unredeemed gift certificates and credit vouchers to three years fromour prior estimate of five years. This change in estimate did not have a material impact on the ConsolidatedStatement of Income for fiscal 2009. For gift cards, we also recognize breakage income after three years.
We do not believe there is a reasonable likelihood that there will be a material change in the future estimates orassumptions we use to calculate our breakage income. However, if the actual rate of redemption for gift cards, giftcertificates, and credit vouchers increases significantly, our operating results could be adversely affected. We havenot made any material changes in the accounting methodology used to estimate breakage income in the pastthree fiscal years other than noted above.
Income TaxesWe record a valuation allowance against our deferred tax assets arising from certain net operating losses when itis more likely than not that some portion or all of such net operating losses will not be realized. In determining theneed for a valuation allowance, management is required to make assumptions and to apply judgment, includingforecasting future income, taxable income, and the mix of income or losses in the jurisdictions in which weoperate. Our effective tax rate in a given financial statement period may also be materially impacted by changes inthe mix and level of income or losses, changes in the expected outcome of audits, or changes in the deferred taxvaluation allowance.
32 Gap Inc. Form 10-K

At any point in time, many tax years are subject to or in the process of being audited by various taxing authorities.To the extent our estimates of settlements change or the final tax outcome of these matters is different from theamounts recorded, such differences will impact the income tax provision in the period in which suchdeterminations are made. Our income tax expense includes changes in our estimated liability for exposuresassociated with our various tax filing positions. Determining the income tax expense for these potentialassessments requires management to make assumptions that are subject to factors such as proposedassessments by tax authorities, changes in facts and circumstances, issuance of new regulations, and resolution oftax audits.
We believe the judgments and estimates discussed above are reasonable. However, if actual results are notconsistent with our estimates or assumptions, we may be exposed to losses or gains that could be material.
Recent Accounting PronouncementsSee Item 8, Financial Statements and Supplementary Data, Note 1 of Notes to Consolidated Financial Statementsfor recent accounting pronouncements, including the expected dates of adoption and estimated effects on ourfinancial position, results of operations, and cash flows.
33

Item 7A. Quantitative and Qualitative Disclosures About Market Risk.Derivative Financial InstrumentsWe operate in foreign countries, which exposes us to market risk associated with foreign currency exchange ratefluctuations. Our risk management policy is to hedge a significant portion of forecasted merchandise purchasesdenominated primarily in U.S. dollars made by our international subsidiaries whose functional currencies are their localcurrencies, forecasted intercompany royalty payments, and intercompany obligations that bear foreign exchange riskusing foreign exchange forward contracts. We also use foreign exchange forward contracts to hedge the net assets ofinternational subsidiaries to offset the foreign currency translation and economic exposures related to our investmentin the subsidiaries. These contracts are entered into with large, reputable financial institutions that are monitored forcounterparty risk. The principal currencies hedged against changes in the U.S. dollar are Euro, British pounds, Japaneseyen, and Canadian dollars. Our use of derivative financial instruments represents risk management; we do not enterinto derivative financial contracts for trading purposes. Additional information is presented in Item 8, FinancialStatements and Supplementary Data, Note 7 of Notes to Consolidated Financial Statements. Our derivative financialinstruments are recorded in the Consolidated Balance Sheets at fair value as of the balance sheet dates. As ofJanuary 28, 2012, we had foreign exchange forward contracts outstanding to buy the notional amount of $873 million,31 million British pounds, 16 million Euro, and 2.6 billion Japanese yen related to our forecasted merchandise purchasesfor foreign operations, forecasted intercompany royalty payments, and intercompany obligations that bear foreignexchange risk. As of January 28, 2012, we did not have any foreign exchange forward contracts outstanding to hedgethe net assets of our subsidiaries.
We have performed a sensitivity analysis as of January 28, 2012 based on a model that measures the impact of ahypothetical 10 percent adverse change in the level of foreign currency exchange rates to U.S. dollars (with all othervariables held constant) on our underlying exposure, net of derivative financial instruments. The foreign currencyexchange rates used in the model were based on the spot rates in effect as of January 28, 2012. The sensitivityanalysis indicated that a hypothetical 10 percent adverse movement in foreign currency exchange rates wouldhave an unfavorable impact on the underlying cash flow exposure, net of our foreign exchange derivative financialinstruments, of $39 million as of January 28, 2012.
Short-Term BorrowingsIn September 2010, we entered into two separate agreements to make unsecured revolving credit facilitiesavailable for our operations in China (the “China Facilities”). The China Facilities are set to expire in September 2012.As of January 28, 2012, there were borrowings of $19 million (118 million Chinese yuan) at an interest rate of 6.53percent under the China Facilities. We do not expect the interest rate of the borrowings under the China Facilitiesfor fiscal 2012 to differ materially from the rate of 6.53 percent as of January 28, 2012.
Long-Term DebtIn April 2011, we issued $1.25 billion aggregate principal amount of 5.95 percent Notes due April 2021 and receivedproceeds of $1.24 billion in cash, net of underwriting and other fees. Interest is payable semi-annually on April 12and October 12 of each year and commenced on October 12, 2011. The Notes are not subject to market risk, as theyhave a fixed interest rate.
In April 2011, we also entered into a $400 million, five-year, unsecured term loan due April 2016, which was fundedin May 2011. Repayments of $40 million are payable on April 7 of each year, commencing on April 7, 2012, with afinal repayment of $240 million due on April 7, 2016. In addition, interest is payable at least quarterly based on aninterest rate equal to LIBOR plus a margin based on our long-term senior unsecured credit ratings. The averageinterest rate during fiscal 2011 was 2 percent.
34 Gap Inc. Form 10-K
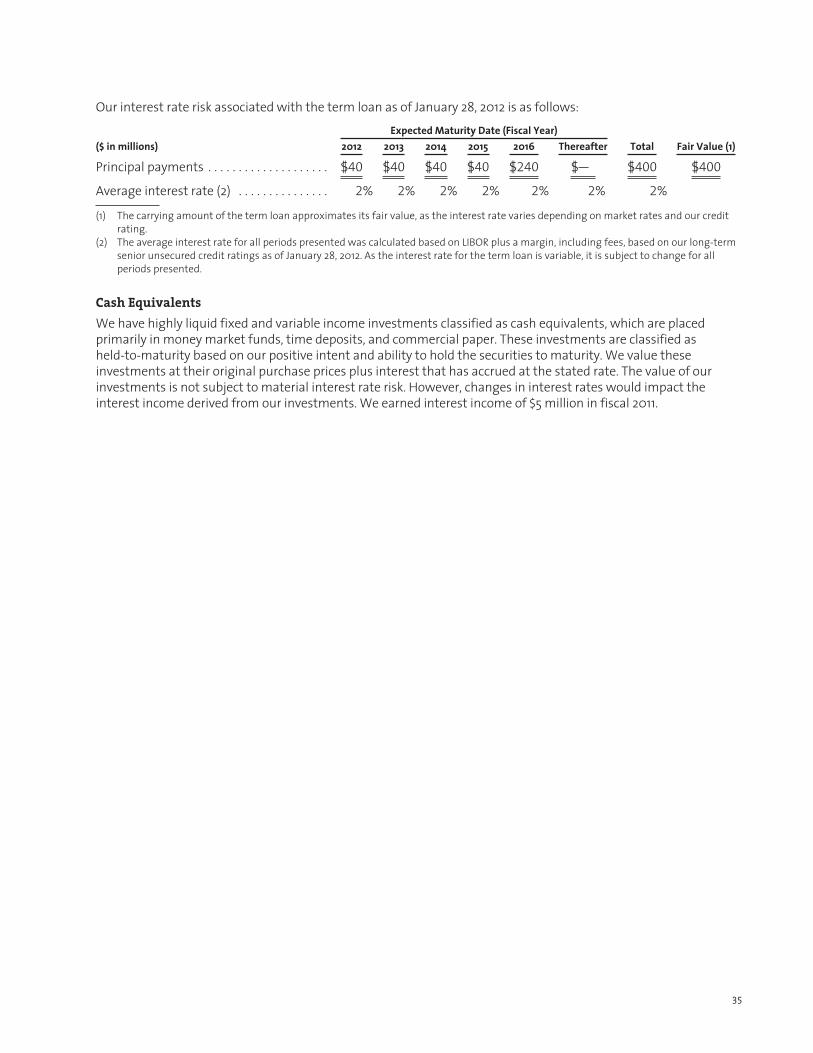
Our interest rate risk associated with the term loan as of January 28, 2012 is as follows:Expected Maturity Date (Fiscal Year)
($ in millions) 2012 2013 2014 2015 2016 Thereafter Total Fair Value (1)
Principal payments . . . . . . . . . . . . . . . . . . . . $40 $40 $40 $40 $240 $— $400 $400
Average interest rate (2) . . . . . . . . . . . . . . . 2% 2% 2% 2% 2% 2% 2%
(1) The carrying amount of the term loan approximates its fair value, as the interest rate varies depending on market rates and our creditrating.
(2) The average interest rate for all periods presented was calculated based on LIBOR plus a margin, including fees, based on our long-termsenior unsecured credit ratings as of January 28, 2012. As the interest rate for the term loan is variable, it is subject to change for allperiods presented.
Cash EquivalentsWe have highly liquid fixed and variable income investments classified as cash equivalents, which are placedprimarily in money market funds, time deposits, and commercial paper. These investments are classified asheld-to-maturity based on our positive intent and ability to hold the securities to maturity. We value theseinvestments at their original purchase prices plus interest that has accrued at the stated rate. The value of ourinvestments is not subject to material interest rate risk. However, changes in interest rates would impact theinterest income derived from our investments. We earned interest income of $5 million in fiscal 2011.
35

Item 8. Financial Statements and Supplementary Data.
THE GAP, INC.INDEX TO CONSOLIDATED FINANCIAL STATEMENTS
Page
Report of Independent Registered Public Accounting Firm . . . . . . . . . . . . . . . . . . . . . . . . . . . . . . . . . . . . . . . . . . . . . . 37
Consolidated Balance Sheets as of January 28, 2012 and January 29, 2011 . . . . . . . . . . . . . . . . . . . . . . . . . . . . . . . . . 38
Consolidated Statements of Income for the fiscal years ended January 28, 2012, January 29, 2011, andJanuary 30, 2010 . . . . . . . . . . . . . . . . . . . . . . . . . . . . . . . . . . . . . . . . . . . . . . . . . . . . . . . . . . . . . . . . . . . . . . . . . . . . . . . . . . . . 39
Consolidated Statements of Stockholders' Equity for the fiscal years ended January 28, 2012, January 29, 2011,and January 30, 2010 . . . . . . . . . . . . . . . . . . . . . . . . . . . . . . . . . . . . . . . . . . . . . . . . . . . . . . . . . . . . . . . . . . . . . . . . . . . . . . . . 40
Consolidated Statements of Cash Flows for the fiscal years ended January 28, 2012, January 29, 2011, andJanuary 30, 2010 . . . . . . . . . . . . . . . . . . . . . . . . . . . . . . . . . . . . . . . . . . . . . . . . . . . . . . . . . . . . . . . . . . . . . . . . . . . . . . . . . . . . 41
Notes to Consolidated Financial Statements . . . . . . . . . . . . . . . . . . . . . . . . . . . . . . . . . . . . . . . . . . . . . . . . . . . . . . . . . . 42
36 Gap Inc. Form 10-K

Report of Independent Registered Public Accounting FirmTo the Board of Directors and Stockholders of The Gap, Inc.:
We have audited the accompanying consolidated balance sheets of The Gap, Inc. and subsidiaries (the “Company”)as of January 28, 2012 and January 29, 2011, and the related consolidated statements of income, stockholders’equity, and cash flows for each of the three years in the period ended January 28, 2012. We also have audited theCompany’s internal control over financial reporting as of January 28, 2012, based on criteria established in InternalControl—Integrated Framework issued by the Committee of Sponsoring Organizations of the TreadwayCommission. The Company’s management is responsible for these financial statements, for maintaining effectiveinternal control over financial reporting, and for its assessment of the effectiveness of internal control overfinancial reporting, included in the accompanying Management’s Report on Internal Control over FinancialReporting. Our responsibility is to express an opinion on these financial statements and an opinion on theCompany’s internal control over financial reporting based on our audits.
We conducted our audits in accordance with the standards of the Public Company Accounting Oversight Board(United States). Those standards require that we plan and perform the audit to obtain reasonable assurance aboutwhether the financial statements are free of material misstatement and whether effective internal control overfinancial reporting was maintained in all material respects. Our audits of the financial statements includedexamining, on a test basis, evidence supporting the amounts and disclosures in the financial statements, assessingthe accounting principles used and significant estimates made by management, and evaluating the overallfinancial statement presentation. Our audit of internal control over financial reporting included obtaining anunderstanding of internal control over financial reporting, assessing the risk that a material weakness exists, andtesting and evaluating the design and operating effectiveness of internal control based on the assessed risk.Our audits also included performing such other procedures as we considered necessary in the circumstances.We believe that our audits provide a reasonable basis for our opinions.
A company’s internal control over financial reporting is a process designed by, or under the supervision of, thecompany’s principal executive and principal financial officers, or persons performing similar functions, andeffected by the company’s board of directors, management, and other personnel to provide reasonable assuranceregarding the reliability of financial reporting and the preparation of financial statements for external purposes inaccordance with generally accepted accounting principles. A company’s internal control over financial reportingincludes those policies and procedures that (1) pertain to the maintenance of records that, in reasonable detail,accurately and fairly reflect the transactions and dispositions of the assets of the company; (2) provide reasonableassurance that transactions are recorded as necessary to permit preparation of financial statements in accordancewith generally accepted accounting principles, and that receipts and expenditures of the company are being madeonly in accordance with authorizations of management and directors of the company; and (3) provide reasonableassurance regarding prevention or timely detection of unauthorized acquisition, use, or disposition of thecompany’s assets that could have a material effect on the financial statements.
Because of the inherent limitations of internal control over financial reporting, including the possibility of collusionor improper management override of controls, material misstatements due to error or fraud may not be preventedor detected on a timely basis. Also, projections of any evaluation of the effectiveness of the internal control overfinancial reporting to future periods are subject to the risk that the controls may become inadequate because ofchanges in conditions, or that the degree of compliance with the policies or procedures may deteriorate.
In our opinion, the consolidated financial statements referred to above present fairly, in all material respects, thefinancial position of The Gap, Inc. and subsidiaries as of January 28, 2012 and January 29, 2011, and the results oftheir operations and their cash flows for each of the three years in the period ended January 28, 2012, in conformitywith accounting principles generally accepted in the United States of America. Also, in our opinion, the Companymaintained, in all material respects, effective internal control over financial reporting as of January 28, 2012, basedon the criteria established in Internal Control—Integrated Framework issued by the Committee of SponsoringOrganizations of the Treadway Commission.
/s/ Deloitte & Touche LLP
San Francisco, CaliforniaMarch 26, 2012
37
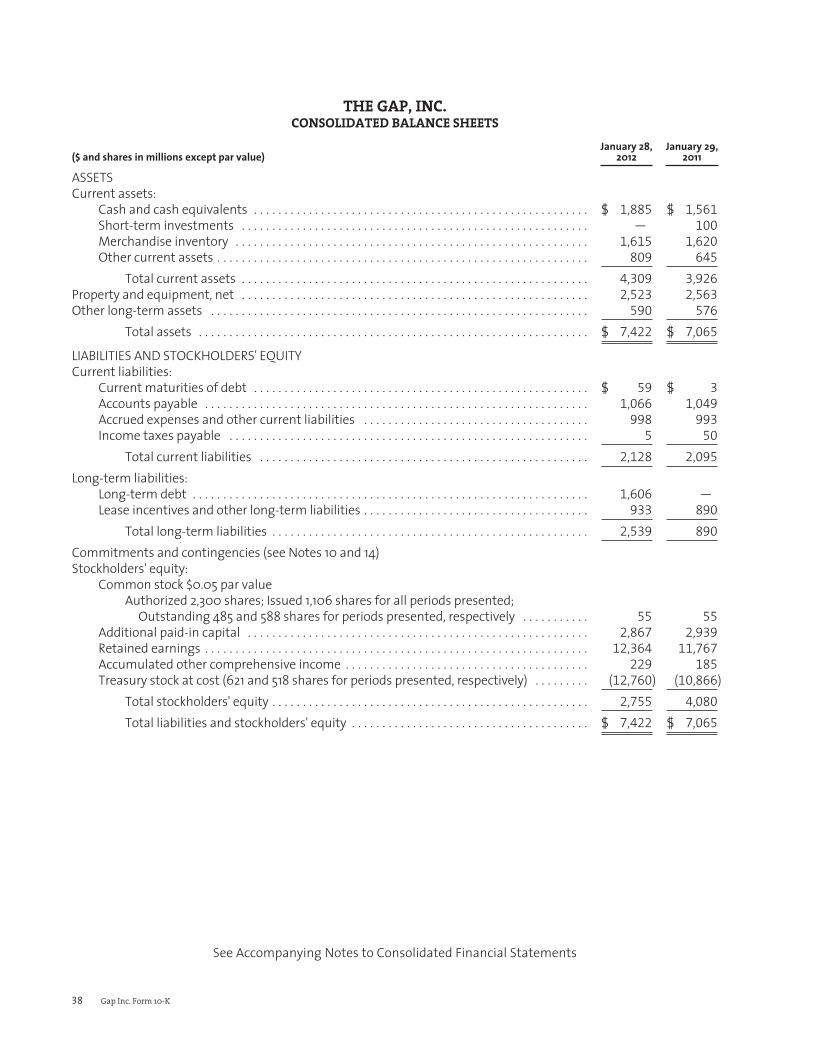
THE GAP, INC.CONSOLIDATED BALANCE SHEETS
($ and shares in millions except par value)January 28,
2012January 29,
2011
ASSETSCurrent assets:
Cash and cash equivalents . . . . . . . . . . . . . . . . . . . . . . . . . . . . . . . . . . . . . . . . . . . . . . . . . . . . . . . $ 1,885 $ 1,561
Short-term investments . . . . . . . . . . . . . . . . . . . . . . . . . . . . . . . . . . . . . . . . . . . . . . . . . . . . . . . . . — 100
Merchandise inventory . . . . . . . . . . . . . . . . . . . . . . . . . . . . . . . . . . . . . . . . . . . . . . . . . . . . . . . . . . 1,615 1,620
Other current assets . . . . . . . . . . . . . . . . . . . . . . . . . . . . . . . . . . . . . . . . . . . . . . . . . . . . . . . . . . . . . 809 645
Total current assets . . . . . . . . . . . . . . . . . . . . . . . . . . . . . . . . . . . . . . . . . . . . . . . . . . . . . . . . . 4,309 3,926
Property and equipment, net . . . . . . . . . . . . . . . . . . . . . . . . . . . . . . . . . . . . . . . . . . . . . . . . . . . . . . . . . 2,523 2,563
Other long-term assets . . . . . . . . . . . . . . . . . . . . . . . . . . . . . . . . . . . . . . . . . . . . . . . . . . . . . . . . . . . . . . 590 576
Total assets . . . . . . . . . . . . . . . . . . . . . . . . . . . . . . . . . . . . . . . . . . . . . . . . . . . . . . . . . . . . . . . . $ 7,422 $ 7,065
LIABILITIES AND STOCKHOLDERS' EQUITYCurrent liabilities:
Current maturities of debt . . . . . . . . . . . . . . . . . . . . . . . . . . . . . . . . . . . . . . . . . . . . . . . . . . . . . . . $ 59 $ 3
Accounts payable . . . . . . . . . . . . . . . . . . . . . . . . . . . . . . . . . . . . . . . . . . . . . . . . . . . . . . . . . . . . . . . 1,066 1,049
Accrued expenses and other current liabilities . . . . . . . . . . . . . . . . . . . . . . . . . . . . . . . . . . . . . 998 993
Income taxes payable . . . . . . . . . . . . . . . . . . . . . . . . . . . . . . . . . . . . . . . . . . . . . . . . . . . . . . . . . . . 5 50
Total current liabilities . . . . . . . . . . . . . . . . . . . . . . . . . . . . . . . . . . . . . . . . . . . . . . . . . . . . . . 2,128 2,095
Long-term liabilities:Long-term debt . . . . . . . . . . . . . . . . . . . . . . . . . . . . . . . . . . . . . . . . . . . . . . . . . . . . . . . . . . . . . . . . . 1,606 —
Lease incentives and other long-term liabilities . . . . . . . . . . . . . . . . . . . . . . . . . . . . . . . . . . . . . 933 890
Total long-term liabilities . . . . . . . . . . . . . . . . . . . . . . . . . . . . . . . . . . . . . . . . . . . . . . . . . . . . 2,539 890
Commitments and contingencies (see Notes 10 and 14)Stockholders' equity:
Common stock $0.05 par valueAuthorized 2,300 shares; Issued 1,106 shares for all periods presented;
Outstanding 485 and 588 shares for periods presented, respectively . . . . . . . . . . . 55 55
Additional paid-in capital . . . . . . . . . . . . . . . . . . . . . . . . . . . . . . . . . . . . . . . . . . . . . . . . . . . . . . . . 2,867 2,939
Retained earnings . . . . . . . . . . . . . . . . . . . . . . . . . . . . . . . . . . . . . . . . . . . . . . . . . . . . . . . . . . . . . . . 12,364 11,767
Accumulated other comprehensive income . . . . . . . . . . . . . . . . . . . . . . . . . . . . . . . . . . . . . . . . 229 185
Treasury stock at cost (621 and 518 shares for periods presented, respectively) . . . . . . . . . (12,760) (10,866)
Total stockholders' equity . . . . . . . . . . . . . . . . . . . . . . . . . . . . . . . . . . . . . . . . . . . . . . . . . . . . 2,755 4,080
Total liabilities and stockholders' equity . . . . . . . . . . . . . . . . . . . . . . . . . . . . . . . . . . . . . . . $ 7,422 $ 7,065
See Accompanying Notes to Consolidated Financial Statements
38 Gap Inc. Form 10-K
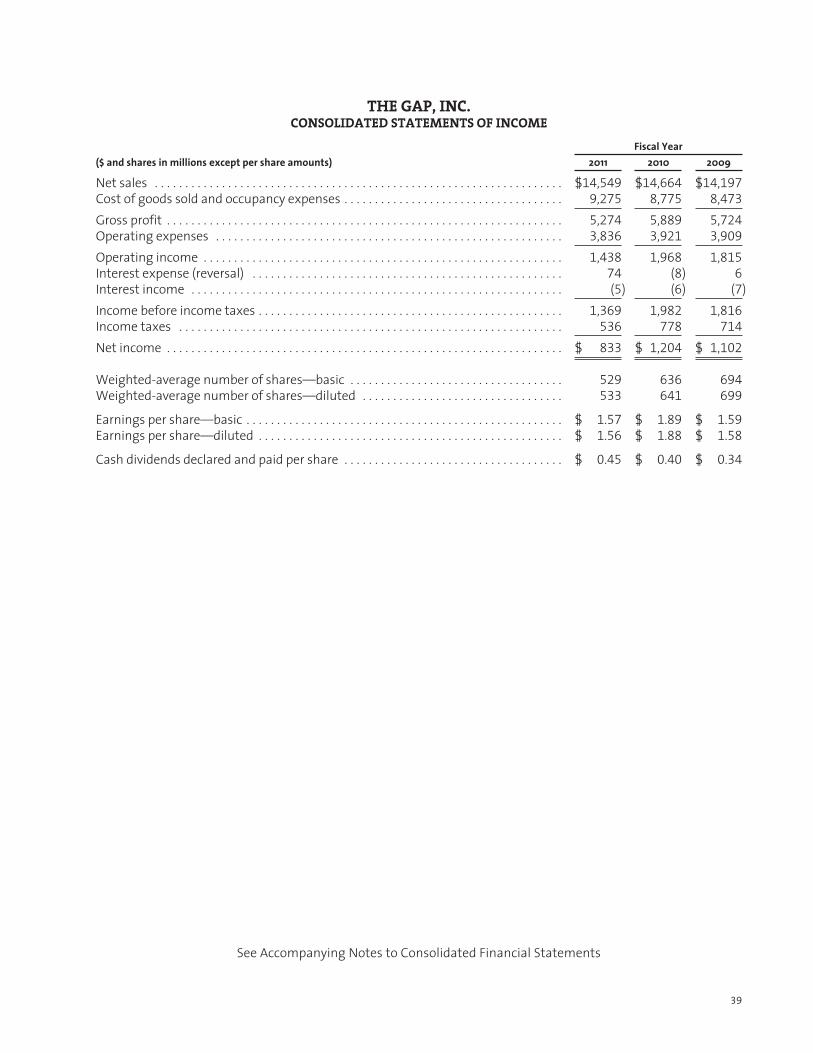
THE GAP, INC.CONSOLIDATED STATEMENTS OF INCOME
Fiscal Year($ and shares in millions except per share amounts) 2011 2010 2009
Net sales . . . . . . . . . . . . . . . . . . . . . . . . . . . . . . . . . . . . . . . . . . . . . . . . . . . . . . . . . . . . . . . . . . . $14,549 $14,664 $14,197
Cost of goods sold and occupancy expenses . . . . . . . . . . . . . . . . . . . . . . . . . . . . . . . . . . . . 9,275 8,775 8,473
Gross profit . . . . . . . . . . . . . . . . . . . . . . . . . . . . . . . . . . . . . . . . . . . . . . . . . . . . . . . . . . . . . . . . . 5,274 5,889 5,724
Operating expenses . . . . . . . . . . . . . . . . . . . . . . . . . . . . . . . . . . . . . . . . . . . . . . . . . . . . . . . . . 3,836 3,921 3,909
Operating income . . . . . . . . . . . . . . . . . . . . . . . . . . . . . . . . . . . . . . . . . . . . . . . . . . . . . . . . . . . 1,438 1,968 1,815
Interest expense (reversal) . . . . . . . . . . . . . . . . . . . . . . . . . . . . . . . . . . . . . . . . . . . . . . . . . . . 74 (8) 6
Interest income . . . . . . . . . . . . . . . . . . . . . . . . . . . . . . . . . . . . . . . . . . . . . . . . . . . . . . . . . . . . . (5) (6) (7)
Income before income taxes . . . . . . . . . . . . . . . . . . . . . . . . . . . . . . . . . . . . . . . . . . . . . . . . . . 1,369 1,982 1,816
Income taxes . . . . . . . . . . . . . . . . . . . . . . . . . . . . . . . . . . . . . . . . . . . . . . . . . . . . . . . . . . . . . . . 536 778 714
Net income . . . . . . . . . . . . . . . . . . . . . . . . . . . . . . . . . . . . . . . . . . . . . . . . . . . . . . . . . . . . . . . . . $ 833 $ 1,204 $ 1,102
Weighted-average number of shares—basic . . . . . . . . . . . . . . . . . . . . . . . . . . . . . . . . . . . 529 636 694
Weighted-average number of shares—diluted . . . . . . . . . . . . . . . . . . . . . . . . . . . . . . . . . 533 641 699
Earnings per share—basic . . . . . . . . . . . . . . . . . . . . . . . . . . . . . . . . . . . . . . . . . . . . . . . . . . . . $ 1.57 $ 1.89 $ 1.59
Earnings per share—diluted . . . . . . . . . . . . . . . . . . . . . . . . . . . . . . . . . . . . . . . . . . . . . . . . . . $ 1.56 $ 1.88 $ 1.58
Cash dividends declared and paid per share . . . . . . . . . . . . . . . . . . . . . . . . . . . . . . . . . . . . $ 0.45 $ 0.40 $ 0.34
See Accompanying Notes to Consolidated Financial Statements
39
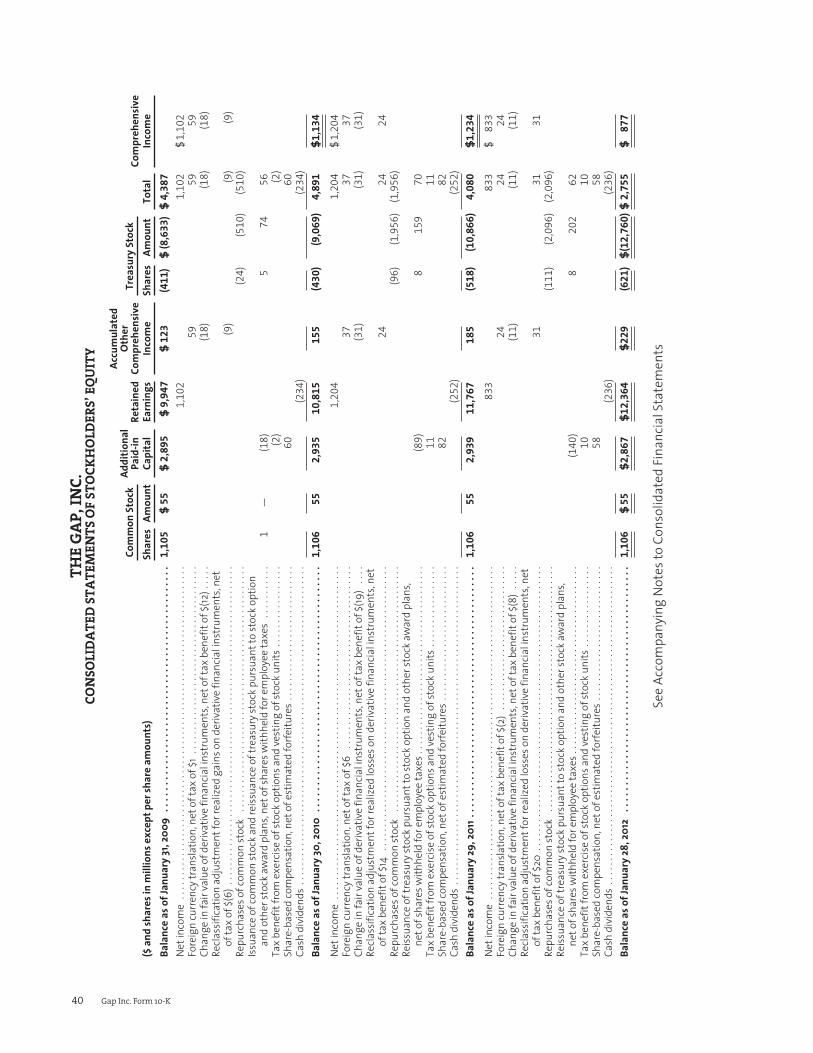
THE
GAP,
INC.
CON
SOLI
DA
TED
STA
TEM
ENTS
OF
STO
CKH
OLD
ERS’
EQU
ITY
Com
mon
Stoc
kAd
ditio
nal
Paid
-inCa
pita
lRe
tain
edEa
rnin
gs
Accu
mul
ated
Oth
erCo
mpr
ehen
sive
Inco
me
Trea
sury
Stoc
kCo
mpr
ehen
sive
Inco
me
($an
dsh
ares
inm
illio
nsex
cept
pers
hare
amou
nts)
Shar
esAm
ount
Shar
esAm
ount
Tota
lBa
lanc
eas
ofJa
nuar
y31
,200
9..
....
....
....
....
....
....
....
....
....
....
....
1,1
05
$5
5$
2,8
95
$9
,9
47
$1
23
(4
11
)$
(8
,6
33
)$
4,3
87
Net
inco
me
....
....
....
....
....
....
....
....
....
....
....
....
....
....
....
....
....
.1
,10
21
,10
2$
1,1
02
Fore
ign
curr
ency
tran
slatio
n,ne
toft
axof
$1..
....
....
....
....
....
....
....
....
....
.5
95
95
9
Chan
gein
fair
valu
eof
deriv
ativ
efin
ancia
lins
trum
ents
,net
ofta
xbe
nefit
of$(
12).
....
(1
8)
(1
8)
(1
8)
Recla
ssifi
catio
nad
just
men
tfor
real
ized
gain
son
deriv
ativ
efin
ancia
lins
trum
ents
,net
ofta
xof
$(6)
....
....
....
....
....
....
....
....
....
....
....
....
....
....
....
....
..(9
)(9
)(9
)
Repu
rcha
seso
fcom
mon
stoc
k..
....
....
....
....
....
....
....
....
....
....
....
....
.(2
4)
(5
10
)(5
10
)
Issua
nce
ofco
mm
onst
ocka
ndre
issua
nce
oftr
easu
ryst
ockp
ursu
antt
ost
ocko
ptio
nan
dot
hers
tock
awar
dpl
ans,
neto
fsha
resw
ithhe
ldfo
rem
ploy
eeta
xes
....
....
...
1—
(1
8)
57
45
6
Tax
bene
fitfro
mex
ercis
eof
stoc
kopt
ions
and
vest
ing
ofst
ocku
nits
....
....
....
....
.(2
)(2
)
Shar
e-ba
sed
com
pens
atio
n,ne
tofe
stim
ated
forfe
iture
s..
....
....
....
....
....
....
..6
06
0
Cash
divi
dend
s..
....
....
....
....
....
....
....
....
....
....
....
....
....
....
....
....
(2
34
)(2
34
)
Bala
nce
asof
Janu
ary
30,2
010
....
....
....
....
....
....
....
....
....
....
....
..1
,1
06
55
2,9
35
10
,8
15
15
5(4
30
)(9
,0
69
)4
,8
91
$1
,1
34
Net
inco
me
....
....
....
....
....
....
....
....
....
....
....
....
....
....
....
....
....
.1
,20
41
,20
4$
1,2
04
Fore
ign
curr
ency
tran
slatio
n,ne
toft
axof
$6..
....
....
....
....
....
....
....
....
....
37
37
37
Chan
gein
fair
valu
eof
deriv
ativ
efin
ancia
lins
trum
ents
,net
ofta
xbe
nefit
of$(
19)
....
(3
1)
(3
1)
(3
1)
Recla
ssifi
catio
nad
just
men
tfor
real
ized
loss
eson
deriv
ativ
efin
ancia
lins
trum
ents
,net
ofta
xbe
nefit
of$1
4..
....
....
....
....
....
....
....
....
....
....
....
....
....
....
.2
42
42
4
Repu
rcha
seso
fcom
mon
stoc
k..
....
....
....
....
....
....
....
....
....
....
....
....
.(9
6)
(1
,95
6)
(1
,95
6)
Reiss
uanc
eof
trea
sury
stoc
kpur
suan
tto
stoc
kopt
ion
and
othe
rsto
ckaw
ard
plan
s,ne
tofs
hare
swith
held
fore
mpl
oyee
taxe
s...
....
....
....
....
....
....
....
....
....
(8
9)
81
59
70
Tax
bene
fitfro
mex
ercis
eof
stoc
kopt
ions
and
vest
ing
ofst
ocku
nits
....
....
....
....
.1
11
1
Shar
e-ba
sed
com
pens
atio
n,ne
tofe
stim
ated
forfe
iture
s..
....
....
....
....
....
....
..8
28
2
Cash
divi
dend
s..
....
....
....
....
....
....
....
....
....
....
....
....
....
....
....
....
(2
52
)(2
52
)
Bala
nce
asof
Janu
ary
29,2
011.
....
....
....
....
....
....
....
....
....
....
....
..1
,1
06
55
2,9
39
11
,7
67
18
5(5
18
)(1
0,8
66
)4
,0
80
$1
,2
34
Net
inco
me
....
....
....
....
....
....
....
....
....
....
....
....
....
....
....
....
....
.8
33
83
3$
83
3
Fore
ign
curr
ency
tran
slatio
n,ne
toft
axbe
nefit
of$(
2)..
....
....
....
....
....
....
....
24
24
24
Chan
gein
fair
valu
eof
deriv
ativ
efin
ancia
lins
trum
ents
,net
ofta
xbe
nefit
of$(
8)..
...
(1
1)
(1
1)
(1
1)
Recla
ssifi
catio
nad
just
men
tfor
real
ized
loss
eson
deriv
ativ
efin
ancia
lins
trum
ents
,net
ofta
xbe
nefit
of$2
0..
....
....
....
....
....
....
....
....
....
....
....
....
....
....
.3
13
13
1
Repu
rcha
seso
fcom
mon
stoc
k..
....
....
....
....
....
....
....
....
....
....
....
....
.(1
11
)(2
,09
6)
(2
,09
6)
Reiss
uanc
eof
trea
sury
stoc
kpur
suan
tto
stoc
kopt
ion
and
othe
rsto
ckaw
ard
plan
s,ne
tofs
hare
swith
held
fore
mpl
oyee
taxe
s...
....
....
....
....
....
....
....
....
....
(1
40
)8
20
26
2
Tax
bene
fitfro
mex
ercis
eof
stoc
kopt
ions
and
vest
ing
ofst
ocku
nits
....
....
....
....
.1
01
0
Shar
e-ba
sed
com
pens
atio
n,ne
tofe
stim
ated
forfe
iture
s..
....
....
....
....
....
....
..5
85
8
Cash
divi
dend
s..
....
....
....
....
....
....
....
....
....
....
....
....
....
....
....
....
(2
36
)(2
36
)
Bala
nce
asof
Janu
ary
28,2
012
....
....
....
....
....
....
....
....
....
....
....
..1
,1
06
$5
5$
2,8
67
$1
2,3
64
$2
29
(6
21
)$
(1
2,7
60
)$
2,7
55
$8
77
See
Acco
mpa
nyin
gN
otes
toCo
nsol
idat
edFi
nanc
ialS
tate
men
ts
40 Gap Inc. Form 10-K
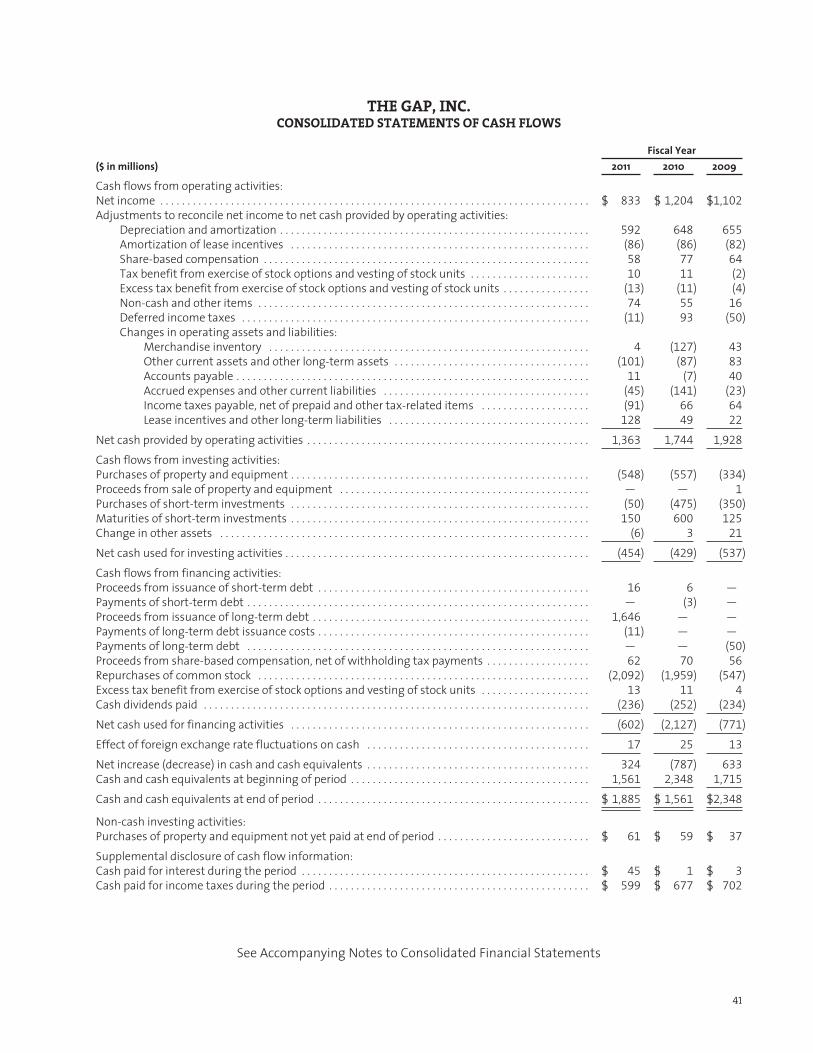
THE GAP, INC.CONSOLIDATED STATEMENTS OF CASH FLOWS
Fiscal Year($ in millions) 2011 2010 2009
Cash flows from operating activities:Net income . . . . . . . . . . . . . . . . . . . . . . . . . . . . . . . . . . . . . . . . . . . . . . . . . . . . . . . . . . . . . . . . . . . . . . . . . . . . . . . $ 833 $ 1,204 $1,102
Adjustments to reconcile net income to net cash provided by operating activities:Depreciation and amortization . . . . . . . . . . . . . . . . . . . . . . . . . . . . . . . . . . . . . . . . . . . . . . . . . . . . . . . . . 592 648 655
Amortization of lease incentives . . . . . . . . . . . . . . . . . . . . . . . . . . . . . . . . . . . . . . . . . . . . . . . . . . . . . . . (86) (86) (82)
Share-based compensation . . . . . . . . . . . . . . . . . . . . . . . . . . . . . . . . . . . . . . . . . . . . . . . . . . . . . . . . . . . . 58 77 64
Tax benefit from exercise of stock options and vesting of stock units . . . . . . . . . . . . . . . . . . . . . . 10 11 (2)
Excess tax benefit from exercise of stock options and vesting of stock units . . . . . . . . . . . . . . . . (13) (11) (4)
Non-cash and other items . . . . . . . . . . . . . . . . . . . . . . . . . . . . . . . . . . . . . . . . . . . . . . . . . . . . . . . . . . . . . 74 55 16
Deferred income taxes . . . . . . . . . . . . . . . . . . . . . . . . . . . . . . . . . . . . . . . . . . . . . . . . . . . . . . . . . . . . . . . . (11) 93 (50)
Changes in operating assets and liabilities:Merchandise inventory . . . . . . . . . . . . . . . . . . . . . . . . . . . . . . . . . . . . . . . . . . . . . . . . . . . . . . . . . . . 4 (127) 43
Other current assets and other long-term assets . . . . . . . . . . . . . . . . . . . . . . . . . . . . . . . . . . . . (101) (87) 83
Accounts payable . . . . . . . . . . . . . . . . . . . . . . . . . . . . . . . . . . . . . . . . . . . . . . . . . . . . . . . . . . . . . . . . . 11 (7) 40
Accrued expenses and other current liabilities . . . . . . . . . . . . . . . . . . . . . . . . . . . . . . . . . . . . . . (45) (141) (23)
Income taxes payable, net of prepaid and other tax-related items . . . . . . . . . . . . . . . . . . . . (91) 66 64
Lease incentives and other long-term liabilities . . . . . . . . . . . . . . . . . . . . . . . . . . . . . . . . . . . . . 128 49 22
Net cash provided by operating activities . . . . . . . . . . . . . . . . . . . . . . . . . . . . . . . . . . . . . . . . . . . . . . . . . . . . 1,363 1,744 1,928
Cash flows from investing activities:Purchases of property and equipment . . . . . . . . . . . . . . . . . . . . . . . . . . . . . . . . . . . . . . . . . . . . . . . . . . . . . . . (548) (557) (334)
Proceeds from sale of property and equipment . . . . . . . . . . . . . . . . . . . . . . . . . . . . . . . . . . . . . . . . . . . . . . — — 1
Purchases of short-term investments . . . . . . . . . . . . . . . . . . . . . . . . . . . . . . . . . . . . . . . . . . . . . . . . . . . . . . . (50) (475) (350)
Maturities of short-term investments . . . . . . . . . . . . . . . . . . . . . . . . . . . . . . . . . . . . . . . . . . . . . . . . . . . . . . . 150 600 125
Change in other assets . . . . . . . . . . . . . . . . . . . . . . . . . . . . . . . . . . . . . . . . . . . . . . . . . . . . . . . . . . . . . . . . . . . . (6) 3 21
Net cash used for investing activities . . . . . . . . . . . . . . . . . . . . . . . . . . . . . . . . . . . . . . . . . . . . . . . . . . . . . . . . (454) (429) (537)
Cash flows from financing activities:Proceeds from issuance of short-term debt . . . . . . . . . . . . . . . . . . . . . . . . . . . . . . . . . . . . . . . . . . . . . . . . . . 16 6 —
Payments of short-term debt . . . . . . . . . . . . . . . . . . . . . . . . . . . . . . . . . . . . . . . . . . . . . . . . . . . . . . . . . . . . . . . — (3) —
Proceeds from issuance of long-term debt . . . . . . . . . . . . . . . . . . . . . . . . . . . . . . . . . . . . . . . . . . . . . . . . . . . 1,646 — —
Payments of long-term debt issuance costs . . . . . . . . . . . . . . . . . . . . . . . . . . . . . . . . . . . . . . . . . . . . . . . . . . (11) — —
Payments of long-term debt . . . . . . . . . . . . . . . . . . . . . . . . . . . . . . . . . . . . . . . . . . . . . . . . . . . . . . . . . . . . . . . — — (50)
Proceeds from share-based compensation, net of withholding tax payments . . . . . . . . . . . . . . . . . . . 62 70 56
Repurchases of common stock . . . . . . . . . . . . . . . . . . . . . . . . . . . . . . . . . . . . . . . . . . . . . . . . . . . . . . . . . . . . . (2,092) (1,959) (547)
Excess tax benefit from exercise of stock options and vesting of stock units . . . . . . . . . . . . . . . . . . . . 13 11 4
Cash dividends paid . . . . . . . . . . . . . . . . . . . . . . . . . . . . . . . . . . . . . . . . . . . . . . . . . . . . . . . . . . . . . . . . . . . . . . . (236) (252) (234)
Net cash used for financing activities . . . . . . . . . . . . . . . . . . . . . . . . . . . . . . . . . . . . . . . . . . . . . . . . . . . . . . . (602) (2,127) (771)
Effect of foreign exchange rate fluctuations on cash . . . . . . . . . . . . . . . . . . . . . . . . . . . . . . . . . . . . . . . . . 17 25 13
Net increase (decrease) in cash and cash equivalents . . . . . . . . . . . . . . . . . . . . . . . . . . . . . . . . . . . . . . . . . 324 (787) 633
Cash and cash equivalents at beginning of period . . . . . . . . . . . . . . . . . . . . . . . . . . . . . . . . . . . . . . . . . . . . 1,561 2,348 1,715
Cash and cash equivalents at end of period . . . . . . . . . . . . . . . . . . . . . . . . . . . . . . . . . . . . . . . . . . . . . . . . . . $ 1,885 $ 1,561 $2,348
Non-cash investing activities:Purchases of property and equipment not yet paid at end of period . . . . . . . . . . . . . . . . . . . . . . . . . . . . $ 61 $ 59 $ 37
Supplemental disclosure of cash flow information:Cash paid for interest during the period . . . . . . . . . . . . . . . . . . . . . . . . . . . . . . . . . . . . . . . . . . . . . . . . . . . . . $ 45 $ 1 $ 3
Cash paid for income taxes during the period . . . . . . . . . . . . . . . . . . . . . . . . . . . . . . . . . . . . . . . . . . . . . . . . $ 599 $ 677 $ 702
See Accompanying Notes to Consolidated Financial Statements
41

Notes to Consolidated Financial Statements
For the Fiscal Years Ended January 28, 2012, January 29, 2011, and January 30, 2010
Note 1. Organization and Summary of Significant Accounting Policies
OrganizationThe Gap, Inc., a Delaware Corporation, is a global specialty retailer offering apparel, accessories, and personal careproducts for men, women, children, and babies under the Gap, Old Navy, Banana Republic, Piperlime, and Athletabrands. We have Company-operated stores in the United States, Canada, the United Kingdom, France, Ireland, andJapan, and beginning in November 2010, China and Italy. We also have franchise agreements with unaffiliatedfranchisees to operate Gap and Banana Republic stores in Asia, Australia, Eastern Europe, Latin America, the MiddleEast, and Africa. In addition, our products are available to customers online in over 90 countries.
We identify our operating segments based on the way we manage and evaluate our business activities. We havetwo reportable segments: Stores and Direct.
Principles of ConsolidationThe Consolidated Financial Statements include the accounts of The Gap, Inc. and its subsidiaries (the “Company,”“we,” and “our”). All intercompany transactions and balances have been eliminated.
Fiscal Year and PresentationOur fiscal year is a 52- or 53-week period ending on the Saturday closest to January 31. Fiscal years ended January 28,2012 (fiscal 2011), January 29, 2011 (fiscal 2010), and January 30, 2010 (fiscal 2009) consisted of 52 weeks. The fiscalyear ending February 2, 2013 (fiscal 2012) will consist of 53 weeks.
Issuance of common stock and reissuance of treasury stock pursuant to stock option and other stock award plans,net of shares withheld for employee taxes, have been combined for fiscal 2009 in the Consolidated Statements ofStockholders’ Equity to conform to fiscal 2011 and 2010 presentation.
Use of EstimatesThe preparation of financial statements in conformity with accounting principles generally accepted in the UnitedStates of America (“GAAP”) requires management to make estimates and assumptions that affect the reportedamounts of assets and liabilities and disclosure of contingent assets and liabilities at the date of the financialstatements and the reported amounts of revenue and expenses during the reporting period. Actual results coulddiffer from those estimates.
Cash and Cash Equivalents and Short-Term InvestmentsAmounts in transit from banks for customer credit card and debit card transactions that process in less than sevendays are classified as cash. The banks process the majority of these amounts within one to two business days.
All highly liquid investments with original maturities of 91 days or less are classified as cash equivalents. Highlyliquid investments with original maturities of greater than 91 days that will mature less than one year from thebalance sheet date are classified as short-term investments. Our cash equivalents and short-term investments areplaced primarily in money market funds, time deposits, and commercial paper and are classified asheld-to-maturity based on our positive intent and ability to hold the securities to maturity. We value theseinvestments at their original purchase prices plus interest that has accrued at the stated rate. Income related tothese securities is recorded in interest income in the Consolidated Statements of Income.
Restricted CashRestricted cash consists primarily of cash that serves as collateral for our insurance obligations. Any cash that islegally restricted from use is classified as restricted cash. If the purpose of restricted cash relates to acquiring a
42 Gap Inc. Form 10-K
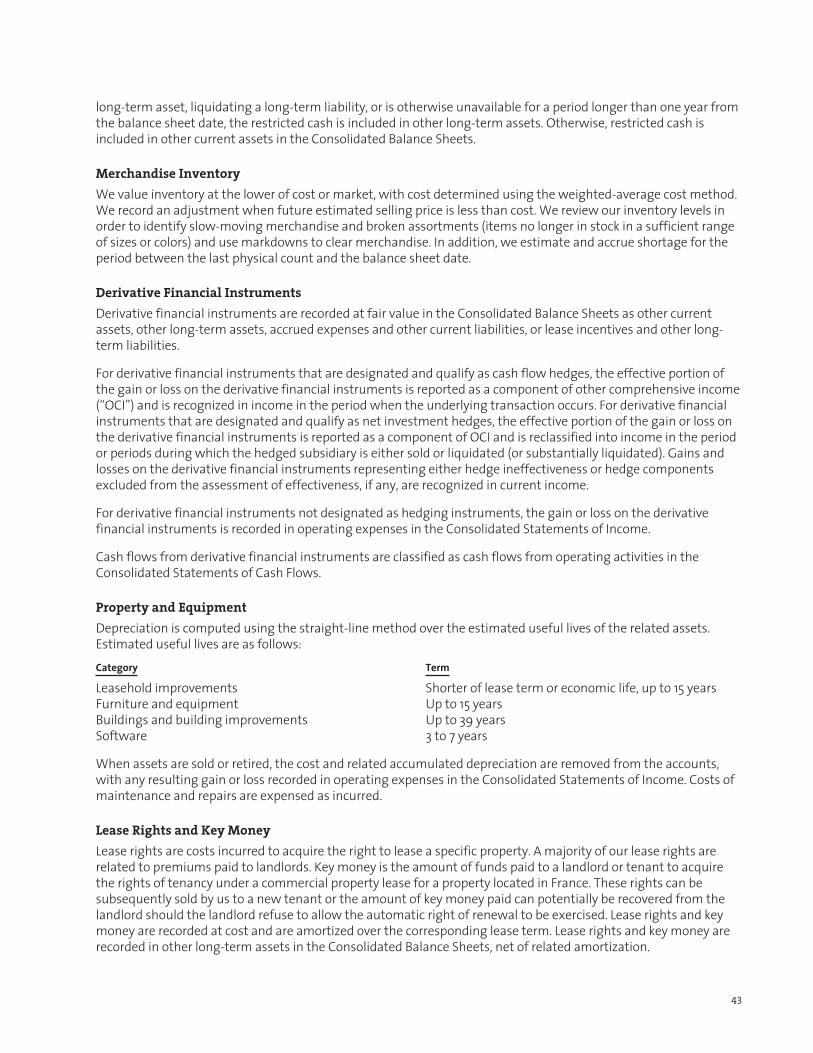
long-term asset, liquidating a long-term liability, or is otherwise unavailable for a period longer than one year fromthe balance sheet date, the restricted cash is included in other long-term assets. Otherwise, restricted cash isincluded in other current assets in the Consolidated Balance Sheets.
Merchandise InventoryWe value inventory at the lower of cost or market, with cost determined using the weighted-average cost method.We record an adjustment when future estimated selling price is less than cost. We review our inventory levels inorder to identify slow-moving merchandise and broken assortments (items no longer in stock in a sufficient rangeof sizes or colors) and use markdowns to clear merchandise. In addition, we estimate and accrue shortage for theperiod between the last physical count and the balance sheet date.
Derivative Financial InstrumentsDerivative financial instruments are recorded at fair value in the Consolidated Balance Sheets as other currentassets, other long-term assets, accrued expenses and other current liabilities, or lease incentives and other long-term liabilities.
For derivative financial instruments that are designated and qualify as cash flow hedges, the effective portion ofthe gain or loss on the derivative financial instruments is reported as a component of other comprehensive income(“OCI”) and is recognized in income in the period when the underlying transaction occurs. For derivative financialinstruments that are designated and qualify as net investment hedges, the effective portion of the gain or loss onthe derivative financial instruments is reported as a component of OCI and is reclassified into income in the periodor periods during which the hedged subsidiary is either sold or liquidated (or substantially liquidated). Gains andlosses on the derivative financial instruments representing either hedge ineffectiveness or hedge componentsexcluded from the assessment of effectiveness, if any, are recognized in current income.
For derivative financial instruments not designated as hedging instruments, the gain or loss on the derivativefinancial instruments is recorded in operating expenses in the Consolidated Statements of Income.
Cash flows from derivative financial instruments are classified as cash flows from operating activities in theConsolidated Statements of Cash Flows.
Property and EquipmentDepreciation is computed using the straight-line method over the estimated useful lives of the related assets.Estimated useful lives are as follows:Category Term
Leasehold improvements Shorter of lease term or economic life, up to 15 yearsFurniture and equipment Up to 15 yearsBuildings and building improvements Up to 39 yearsSoftware 3 to 7 years
When assets are sold or retired, the cost and related accumulated depreciation are removed from the accounts,with any resulting gain or loss recorded in operating expenses in the Consolidated Statements of Income. Costs ofmaintenance and repairs are expensed as incurred.
Lease Rights and Key MoneyLease rights are costs incurred to acquire the right to lease a specific property. A majority of our lease rights arerelated to premiums paid to landlords. Key money is the amount of funds paid to a landlord or tenant to acquirethe rights of tenancy under a commercial property lease for a property located in France. These rights can besubsequently sold by us to a new tenant or the amount of key money paid can potentially be recovered from thelandlord should the landlord refuse to allow the automatic right of renewal to be exercised. Lease rights and keymoney are recorded at cost and are amortized over the corresponding lease term. Lease rights and key money arerecorded in other long-term assets in the Consolidated Balance Sheets, net of related amortization.
43

Insurance and Self-InsuranceWe use a combination of insurance and self-insurance for a number of risk management activities includingworkers’ compensation, general liability, and employee-related health care benefits, a portion of which is paid byour employees. Undiscounted liabilities associated with these risks are estimated based primarily on actuarially-determined amounts and are accrued in part by considering historical claims experience, demographic factors,severity factors, and other actuarial assumptions.
Asset Retirement ObligationsAn asset retirement obligation represents a legal obligation associated with the retirement of a tangible long-livedasset that is incurred upon the acquisition, construction, development, or normal operation of that long-livedasset. The Company’s asset retirement obligations are primarily associated with leasehold improvements that weare contractually obligated to remove at the end of a lease to comply with the lease agreement. We recognizeasset retirement obligations at the inception of a lease with such conditions if a reasonable estimate of fair valuecan be made. The asset retirement obligation is recorded in accrued expenses and other current liabilities andlease incentives and other long-term liabilities in the Consolidated Balance Sheets and is subsequently adjusted forchanges in estimated asset retirement obligations. The associated estimated asset retirement costs are capitalizedas part of the carrying amount of the long-lived asset and depreciated over its useful life.
Treasury StockWe account for treasury stock under the cost method, using the first-in, first-out flow assumption, and includetreasury stock as a component of stockholders’ equity.
Revenue RecognitionWe recognize revenue and the related cost of goods sold at the time the products are received by the customers.Revenue is recognized for store sales when the customer receives and pays for the merchandise at the register. Forsales through online and catalog orders, we estimate and defer revenue and the related product costs forshipments that are in-transit to the customer. Revenue is recognized at the time we estimate the customerreceives the product, which is typically within a few days of shipment. Amounts related to shipping and handlingthat are billed to customers are recorded in net sales, and the related costs are recorded in cost of goods sold andoccupancy expenses in the Consolidated Statements of Income. Revenues are presented net of estimated returnsand any taxes collected from customers and remitted to governmental authorities. Allowances for estimatedreturns are recorded based on estimated margin using our historical return patterns.
We sell merchandise to franchisees under multi-year franchise agreements. We recognize revenue from sales tofranchisees at the time merchandise ownership is transferred to the franchisee, which generally occurs when themerchandise reaches the franchisee’s pre-designated turnover point. These sales are recorded in net sales, and therelated cost of goods sold is recorded in cost of goods sold and occupancy expenses in the ConsolidatedStatements of Income. We also receive royalties from franchisees based on a percentage of the total merchandisepurchased by the franchisee, net of any refunds or credits due them. Royalty revenue is recognized whenmerchandise ownership is transferred to the franchisee and is recorded in net sales in the ConsolidatedStatements of Income.
Classification of ExpensesCost of goods sold and occupancy expenses include the following:
• the cost of merchandise;
• inventory shortage and valuation adjustments;
• freight charges;
• shipping and handling costs;
44 Gap Inc. Form 10-K
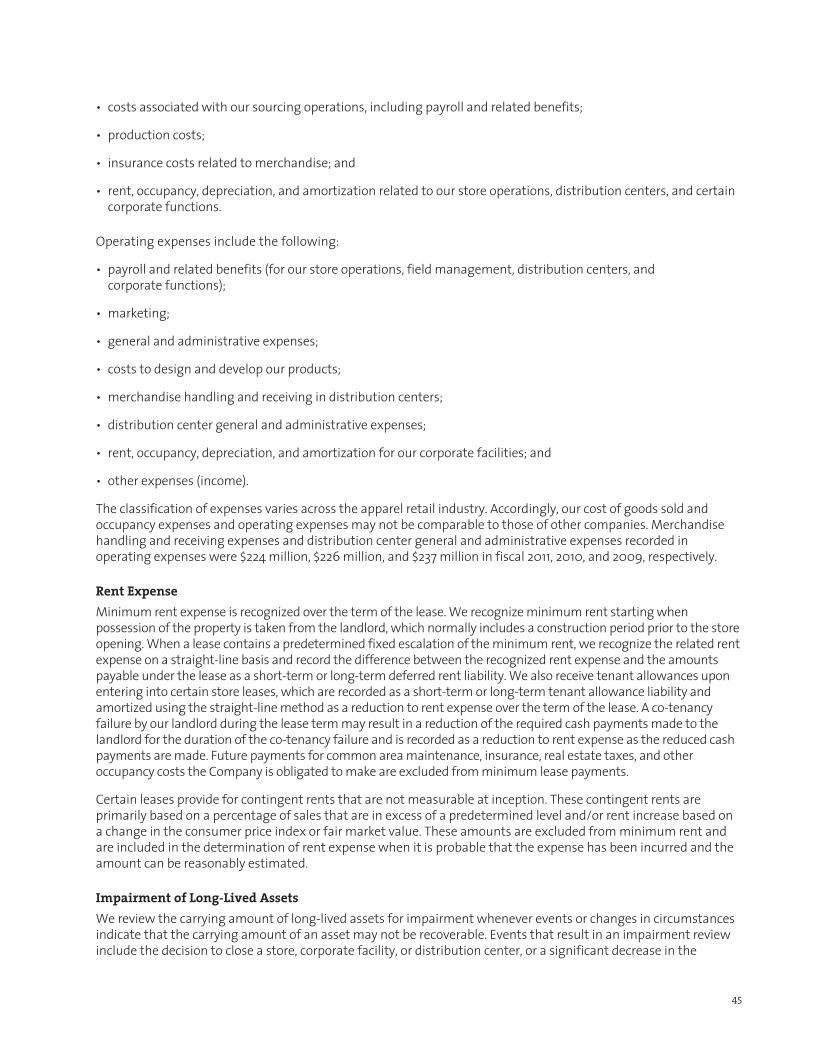
• costs associated with our sourcing operations, including payroll and related benefits;
• production costs;
• insurance costs related to merchandise; and
• rent, occupancy, depreciation, and amortization related to our store operations, distribution centers, and certaincorporate functions.
Operating expenses include the following:
• payroll and related benefits (for our store operations, field management, distribution centers, andcorporate functions);
• marketing;
• general and administrative expenses;
• costs to design and develop our products;
• merchandise handling and receiving in distribution centers;
• distribution center general and administrative expenses;
• rent, occupancy, depreciation, and amortization for our corporate facilities; and
• other expenses (income).
The classification of expenses varies across the apparel retail industry. Accordingly, our cost of goods sold andoccupancy expenses and operating expenses may not be comparable to those of other companies. Merchandisehandling and receiving expenses and distribution center general and administrative expenses recorded inoperating expenses were $224 million, $226 million, and $237 million in fiscal 2011, 2010, and 2009, respectively.
Rent ExpenseMinimum rent expense is recognized over the term of the lease. We recognize minimum rent starting whenpossession of the property is taken from the landlord, which normally includes a construction period prior to the storeopening. When a lease contains a predetermined fixed escalation of the minimum rent, we recognize the related rentexpense on a straight-line basis and record the difference between the recognized rent expense and the amountspayable under the lease as a short-term or long-term deferred rent liability. We also receive tenant allowances uponentering into certain store leases, which are recorded as a short-term or long-term tenant allowance liability andamortized using the straight-line method as a reduction to rent expense over the term of the lease. A co-tenancyfailure by our landlord during the lease term may result in a reduction of the required cash payments made to thelandlord for the duration of the co-tenancy failure and is recorded as a reduction to rent expense as the reduced cashpayments are made. Future payments for common area maintenance, insurance, real estate taxes, and otheroccupancy costs the Company is obligated to make are excluded from minimum lease payments.
Certain leases provide for contingent rents that are not measurable at inception. These contingent rents areprimarily based on a percentage of sales that are in excess of a predetermined level and/or rent increase based ona change in the consumer price index or fair market value. These amounts are excluded from minimum rent andare included in the determination of rent expense when it is probable that the expense has been incurred and theamount can be reasonably estimated.
Impairment of Long-Lived AssetsWe review the carrying amount of long-lived assets for impairment whenever events or changes in circumstancesindicate that the carrying amount of an asset may not be recoverable. Events that result in an impairment reviewinclude the decision to close a store, corporate facility, or distribution center, or a significant decrease in the
45
operating performance of the long-lived asset. Long-lived assets are considered impaired if the estimatedundiscounted future cash flows of the asset or asset group are less than the carrying amount. For impaired assets,we recognize a loss equal to the difference between the carrying amount of the asset or asset group and itsestimated fair value, which is recorded in operating expenses in the Consolidated Statements of Income. Theestimated fair value of the asset or asset group is based on discounted future cash flows of the asset or asset groupusing a discount rate commensurate with the risk. The asset group is defined as the lowest level for whichidentifiable cash flows are available, which for retail stores is at the store level. Our estimate of future cash flowsrequires assumptions and judgment, including forecasting future sales and expenses and estimating useful livesof the assets.
Goodwill and Intangible AssetsWe review the carrying amount of goodwill and other indefinite-lived intangible assets for impairment annuallyand whenever events or changes in circumstances indicate that the carrying amount may not be recoverable.Events that result in an impairment review include significant changes in the business climate, declines in ouroperating results, or an expectation that the carrying amount may not be recoverable. We assess potentialimpairment by considering present economic conditions as well as future expectations.
Effective October 30, 2011, we adopted an accounting standards update to simplify the testing of goodwill forimpairment. As such, we review goodwill for impairment by first assessing qualitative factors to determinewhether it is more likely than not that the fair value of the reporting unit is less than its carrying amount, includinggoodwill, as a basis for determining whether it is necessary to perform the two-step goodwill impairment test. If itis determined that it is not more likely than not that the fair value of the reporting unit is less than its carryingamount, it is unnecessary to perform the two-step goodwill impairment test. If it is determined that it is morelikely than not that the fair value of the reporting unit is less than its carrying amount, the first step of thetwo-step goodwill impairment test is required to compare the fair value of the reporting unit to its carryingamount, including goodwill. If the carrying amount of the reporting unit exceeds its fair value, the second step ofthe two-step goodwill impairment test is required to measure the goodwill impairment loss. The second stepincludes hypothetically valuing all the tangible and intangible assets of the reporting unit as if the reporting unithad been acquired in a business combination. Then, the implied fair value of the reporting unit’s goodwill iscompared to the carrying amount of that goodwill. If the carrying amount of the reporting unit’s goodwill exceedsthe implied fair value of the goodwill, we recognize an impairment loss in an amount equal to the excess, not toexceed the carrying amount.
A reporting unit is an operating segment or a business unit one level below that operating segment, for whichdiscrete financial information is prepared and regularly reviewed by segment management. In connection with ouracquisition of Athleta in September 2008, we have deemed Athleta to be a component of our Direct operatingsegment, as it is the level at which segment management regularly reviews operating results and makes resourceallocation decisions. However, as Athleta is aggregated with other components of the Direct operating segmentdue to the components having similar economic characteristics, we have deemed our Direct operating segment tobe the single reporting unit at which goodwill is tested for impairment.
The trade name is considered impaired if the estimated fair value of the trade name is less than the carryingamount. If the trade name is considered impaired, we recognize a loss equal to the difference between the carryingamount and the estimated fair value of the trade name. The fair value of the trade name is determined using therelief from royalty method, which requires management to make assumptions and to apply judgment, includingforecasting future sales, expenses, discount rates, and royalty rates.
Goodwill and other indefinite-lived intangible assets, including the trade name, are recorded in other long-termassets in the Consolidated Balance Sheets.
Lease LossesThe decision to close a store, corporate facility, or distribution center can result in accelerated depreciation andamortization over the revised remaining useful lives of the associated long-lived assets. In addition, upon exiting
46 Gap Inc. Form 10-K
leased premises, we record a charge and corresponding lease loss reserve equal to the incremental amount of thepresent value of the net future obligation greater than the remaining rent-related deferred balances. The netfuture obligation is determined as the remaining contractual rent obligations less the amount for which we areable to or expect to be able to sublease the properties. We estimate the amount for which we expect to be able tosublease the properties based on the status of our efforts to sublease vacant office space and stores, a review ofreal estate market conditions, our projections for sublease income, and our assumptions regarding subleasecommencement. Lease losses are recorded in operating expenses in the Consolidated Statements of Income.
Pre-Opening CostsPre-opening and start-up activity costs, which include rent and occupancy, supplies, advertising, and payrollexpenses incurred prior to the opening of a new store or other facility, are expensed in the period in which theyoccur.
AdvertisingCosts associated with the production of advertising, such as writing, copy, printing, and other costs, are expensedas incurred. Costs associated with communicating advertising that has been produced, such as television andmagazine costs, are expensed when the advertising event takes place. Advertising expense was $548 million,$516 million, and $513 million in fiscal 2011, 2010, and 2009, respectively, and is recorded in operating expenses inthe Consolidated Statements of Income.
Prepaid catalog expense consists of the cost to prepare, print, and distribute catalogs. Such costs are amortizedover their expected period of future benefit, which is approximately one to five months.
Share-Based CompensationShare-based compensation expense for stock options and other stock awards is determined based on the grant-date fair value. We use the Black-Scholes-Merton option-pricing model to determine the fair value of stock options,which requires the input of subjective assumptions regarding the expected term, expected volatility, dividendyield, and risk-free interest rate. For units granted whereby one share of common stock is issued for each unit asthe unit vests (“Stock Units”), the fair value is determined based on the Company’s stock price on the date of grantless future expected dividends during the vesting period. For stock options and Stock Units, we recognize share-based compensation cost net of estimated forfeitures and revise the estimates in subsequent periods if actualforfeitures differ from the estimates. We estimate the forfeiture rate based on historical experience as well asexpected future behavior. Share-based compensation expense is recorded primarily in operating expenses in theConsolidated Statements of Income over the period during which the employee is required to provide service inexchange for stock options and Stock Units.
Unredeemed Gift Cards, Gift Certificates, and Credit VouchersUpon issuance of a gift card, gift certificate, or credit voucher, a liability is established for its cash value. The liabilityis relieved and net sales are recorded upon redemption by the customer. Over time, some portion of theseinstruments is not redeemed (“breakage”). We determine breakage income for gift cards, gift certificates, andcredit vouchers based on historical redemption patterns. Breakage income is recorded in other income, which is acomponent of operating expenses in the Consolidated Statements of Income, when we can determine the portionof the liability where redemption is remote. Based on our historical information, three years after the gift card, giftcertificate, or credit voucher is issued, we can determine the portion of the liability where redemption is remote.When breakage is recorded, a liability is recognized for any legal obligation to remit the unredeemed portion of giftcertificates and credit vouchers to relevant jurisdictions. Our gift cards, gift certificates, and credit vouchers do nothave expiration dates. Beginning in the third quarter of fiscal 2009, we changed our estimate of the elapsed timefor recording breakage income associated with unredeemed gift certificates and credit vouchers to three yearsfrom our prior estimate of five years. This change in estimate did not have a material impact on the ConsolidatedStatement of Income for fiscal 2009.
47
Credit CardsWe have credit card agreements (the “Agreements”) with third parties to provide our customers with private labelcredit cards and/or co-branded credit cards (collectively, the “Credit Cards”). Each private label credit card bears thelogo of Gap, Old Navy, or Banana Republic and can be used at any of our U.S. or Canadian store locations andonline. The co-branded credit card is a VISA credit card bearing the logo of Gap, Old Navy, or Banana Republic andcan be used everywhere VISA credit cards are accepted. A third-party financing company is the sole owner of theaccounts issued under the Credit Card programs, and this third party absorbs the losses associated withnon-payment by the cardholder and a portion of any fraudulent usage of the accounts. We receive cash from thethird-party financing company in accordance with the Agreements and based on usage of the Credit Cards. Wealso receive payment from Visa U.S.A. Inc. in accordance with the Agreements and based on specified transactionalfees. We recognize income for such cash receipts when the amounts are fixed or determinable and collectibility isreasonably assured, which is generally the time at which the actual usage of the Credit Cards or specifiedtransaction occurs. The income is recorded in other income, which is a component of operating expenses in ourConsolidated Statements of Income.
The Credit Card programs offer incentives to cardholders in the form of reward certificates upon the cumulativepurchase of an established amount. The cost associated with reward points and certificates is accrued as therewards are earned by the cardholder and is recorded in cost of goods sold and occupancy expenses in theConsolidated Statements of Income. Other administrative costs related to the Credit Card programs, includingpayroll, marketing expenses, and other direct costs, are recorded in operating expenses in the ConsolidatedStatements of Income.
Earnings per ShareBasic earnings per share are computed as net income divided by the weighted-average number of common sharesoutstanding for the period. Diluted earnings per share are computed as net income divided by the weighted-average number of common shares outstanding for the period including common stock equivalents. Commonstock equivalents consist of shares subject to share-based awards with exercise prices less than the averagemarket price of our common stock for the period, to the extent their inclusion would be dilutive. Stock options andother stock awards that contain performance conditions are not included in the calculation of common stockequivalents until performance conditions have been achieved.
Foreign CurrencyOur international subsidiaries primarily use local currencies as the functional currency and translate their assetsand liabilities at the current rate of exchange in effect at the balance sheet date. Revenue and expenses from theiroperations are translated using the monthly average exchange rates in effect during the period in which thetransactions occur. The resulting gains and losses from translation are recorded in accumulated OCI in theConsolidated Statements of Stockholders’ Equity. Transaction gains and losses that arise from exchange ratefluctuations on transactions denominated in a currency other than the local functional currency are included in theConsolidated Statements of Income. The aggregate transaction losses included in the Consolidated Statements ofIncome were as follows:
Fiscal Year($ in millions) 2011 2010 2009
Foreign currency transaction loss . . . . . . . . . . . . . . . . . . . . . . . . . . . . . . . . . . . . . . . . . . . . . . . . . . . . . . . . . . $(7) $(1) $(2)
Comprehensive IncomeComprehensive income is comprised of net income and other gains and losses affecting equity that are excludedfrom net income. The components of OCI consist of foreign currency translation gains and losses, net of tax,changes in the fair value of derivative financial instruments, net of tax, and reclassification adjustments forrealized gains and losses on derivative financial instruments, net of tax.
48 Gap Inc. Form 10-K

Income TaxesDeferred income taxes are recorded for temporary differences between the tax basis of assets and liabilities and theirreported amounts in the Consolidated Financial Statements. A valuation allowance is established against deferredtax assets when it is more likely than not that some portion or all of the deferred tax assets will not be realized.
Our income tax expense includes changes in our estimated liability for exposures associated with our various taxfiling positions. At any point in time, many tax years are subject to or in the process of being audited by varioustaxing authorities. To the extent our estimates of settlements change or the final tax outcome of these matters isdifferent from the amounts recorded, such differences will impact the income tax provision in the period in whichsuch determinations are made.
The Company recognizes interest related to unrecognized tax benefits in interest expense and penalties related tounrecognized tax benefits in operating expenses in the Consolidated Statements of Income.
Recent Accounting PronouncementsIn May 2011, the FASB issued an accounting standards update to expand disclosure requirements for fair valuemeasurements. This guidance requires entities to disclose the categorization by level of the fair value hierarchy foritems that are not measured at fair value in the statement of financial position but for which the fair value isrequired to be disclosed. This accounting standards update is effective for fiscal years, and interim periods withinthose years, beginning after December 15, 2011. We will adopt the provisions of this accounting standards update inthe first quarter of fiscal 2012.
In June 2011, the FASB issued an accounting standards update to revise the manner in which entities presentcomprehensive income in their financial statements. This guidance requires entities to present each component ofnet income along with total net income, each component of OCI along with a total for OCI, and a total amount forcomprehensive income, either in a single continuous statement of comprehensive income or in two separate butconsecutive statements. This accounting standards update is effective for fiscal years, and interim periods withinthose years, beginning after December 15, 2011. We will adopt the provisions of this accounting standards update inthe first quarter of fiscal 2012.
Note 2. Additional Financial Statement Information
Cash and Cash Equivalents and Short-Term InvestmentsCash and cash equivalents and short-term investments consist of the following:
($ in millions)January 28,
2012January 29,
2011
Cash (1) . . . . . . . . . . . . . . . . . . . . . . . . . . . . . . . . . . . . . . . . . . . . . . . . . . . . . . . . . . . . . . . . . . . . . . . . . . . . . $ 876 $ 619
Bank certificates of deposit and time deposits . . . . . . . . . . . . . . . . . . . . . . . . . . . . . . . . . . . . . . . . . . 685 529
Money market funds . . . . . . . . . . . . . . . . . . . . . . . . . . . . . . . . . . . . . . . . . . . . . . . . . . . . . . . . . . . . . . . . 224 338
Domestic commercial paper . . . . . . . . . . . . . . . . . . . . . . . . . . . . . . . . . . . . . . . . . . . . . . . . . . . . . . . . . . 100 75
Cash equivalents . . . . . . . . . . . . . . . . . . . . . . . . . . . . . . . . . . . . . . . . . . . . . . . . . . . . . . . . . . . . . . . . . . . . 1,009 942
Cash and cash equivalents . . . . . . . . . . . . . . . . . . . . . . . . . . . . . . . . . . . . . . . . . . . . . . . . . . . . . . . . . . . $1,885 $1,561
Bank certificates of deposit and time deposits . . . . . . . . . . . . . . . . . . . . . . . . . . . . . . . . . . . . . . . . . . $ — $ 100
Short-term investments . . . . . . . . . . . . . . . . . . . . . . . . . . . . . . . . . . . . . . . . . . . . . . . . . . . . . . . . . . . . . . $ — $ 100
(1) Cash includes $59 million and $61 million of amounts in transit from banks for customer credit card and debit card transactions as ofJanuary 28, 2012 and January 29, 2011, respectively.
49
Money market funds of $338 million as of January 29, 2011 in the table above have been reclassified from cash tocash equivalents. This correction had no impact on the Consolidated Balance Sheet as of January 29, 2011, theConsolidated Statement of Income for fiscal 2010, or the Consolidated Statement of Cash Flows for fiscal 2010.
We did not record any impairment charges on our cash equivalents or short-term investments in fiscal 2011, 2010,or 2009.
Other Current AssetsOther current assets consist of the following:
($ in millions)January 28,
2012January 29,
2011
Accounts receivable . . . . . . . . . . . . . . . . . . . . . . . . . . . . . . . . . . . . . . . . . . . . . . . . . . . . . . . . . . . . . . . . . $297 $205
Current portion of deferred tax assets . . . . . . . . . . . . . . . . . . . . . . . . . . . . . . . . . . . . . . . . . . . . . . . . . 205 190
Prepaid minimum rent and occupancy expenses . . . . . . . . . . . . . . . . . . . . . . . . . . . . . . . . . . . . . . . 144 142
Prepaid income taxes . . . . . . . . . . . . . . . . . . . . . . . . . . . . . . . . . . . . . . . . . . . . . . . . . . . . . . . . . . . . . . . . 101 59
Derivative financial instruments . . . . . . . . . . . . . . . . . . . . . . . . . . . . . . . . . . . . . . . . . . . . . . . . . . . . . . 12 2
Restricted cash . . . . . . . . . . . . . . . . . . . . . . . . . . . . . . . . . . . . . . . . . . . . . . . . . . . . . . . . . . . . . . . . . . . . . . 6 7
Prepaid catalog expenses . . . . . . . . . . . . . . . . . . . . . . . . . . . . . . . . . . . . . . . . . . . . . . . . . . . . . . . . . . . . 2 3
Other . . . . . . . . . . . . . . . . . . . . . . . . . . . . . . . . . . . . . . . . . . . . . . . . . . . . . . . . . . . . . . . . . . . . . . . . . . . . . . 42 37
Other current assets . . . . . . . . . . . . . . . . . . . . . . . . . . . . . . . . . . . . . . . . . . . . . . . . . . . . . . . . . . . . . . . . . $809 $645
Property and EquipmentProperty and equipment are stated at cost less accumulated depreciation and consist of the following:
($ in millions)January 28,
2012January 29,
2011
Leasehold improvements . . . . . . . . . . . . . . . . . . . . . . . . . . . . . . . . . . . . . . . . . . . . . . . . . . . . . . . . . . . . . $ 3,168 $ 3,066
Furniture and equipment . . . . . . . . . . . . . . . . . . . . . . . . . . . . . . . . . . . . . . . . . . . . . . . . . . . . . . . . . . . . 2,463 2,431
Land, buildings, and building improvements . . . . . . . . . . . . . . . . . . . . . . . . . . . . . . . . . . . . . . . . . . . 1,096 1,093
Software . . . . . . . . . . . . . . . . . . . . . . . . . . . . . . . . . . . . . . . . . . . . . . . . . . . . . . . . . . . . . . . . . . . . . . . . . . . 960 909
Construction-in-progress . . . . . . . . . . . . . . . . . . . . . . . . . . . . . . . . . . . . . . . . . . . . . . . . . . . . . . . . . . . . . 96 74
Property and equipment, at cost . . . . . . . . . . . . . . . . . . . . . . . . . . . . . . . . . . . . . . . . . . . . . . . . . . . . . . 7,783 7,573
Less: Accumulated depreciation . . . . . . . . . . . . . . . . . . . . . . . . . . . . . . . . . . . . . . . . . . . . . . . . . . . . . . . (5,260) (5,010)
Property and equipment, net of accumulated depreciation . . . . . . . . . . . . . . . . . . . . . . . . . . . . . . $ 2,523 $ 2,563
Depreciation expense for property and equipment was $586 million, $639 million, and $643 million for fiscal 2011,2010, and 2009, respectively.
Interest of $4 million related to assets under construction was capitalized in fiscal 2011. No interest related to assetsunder construction was capitalized in fiscal 2010 and 2009.
We recorded a charge for the impairment of long-lived assets related to our Stores reportable segment of $16million, $8 million, and $14 million for fiscal 2011, 2010, and 2009, respectively, which is recorded in operatingexpenses in the Consolidated Statements of Income.
50 Gap Inc. Form 10-K

Other Long-Term AssetsOther long-term assets consist of the following:
($ in millions)January 28,
2012January 29,
2011
Long-term tax-related assets . . . . . . . . . . . . . . . . . . . . . . . . . . . . . . . . . . . . . . . . . . . . . . . . . . . . . . . . . $258 $259
Goodwill . . . . . . . . . . . . . . . . . . . . . . . . . . . . . . . . . . . . . . . . . . . . . . . . . . . . . . . . . . . . . . . . . . . . . . . . . . . 99 99
Trade name . . . . . . . . . . . . . . . . . . . . . . . . . . . . . . . . . . . . . . . . . . . . . . . . . . . . . . . . . . . . . . . . . . . . . . . . . 54 54
Deferred compensation plan assets . . . . . . . . . . . . . . . . . . . . . . . . . . . . . . . . . . . . . . . . . . . . . . . . . . . 22 27
Lease rights and key money, net of accumulated amortization of $140 for both periodspresented . . . . . . . . . . . . . . . . . . . . . . . . . . . . . . . . . . . . . . . . . . . . . . . . . . . . . . . . . . . . . . . . . . . . . . . . 22 20
Restricted cash . . . . . . . . . . . . . . . . . . . . . . . . . . . . . . . . . . . . . . . . . . . . . . . . . . . . . . . . . . . . . . . . . . . . . . 11 11
Intangible assets subject to amortization, net of accumulated amortization of $14 and$12 . . . . . . . . . . . . . . . . . . . . . . . . . . . . . . . . . . . . . . . . . . . . . . . . . . . . . . . . . . . . . . . . . . . . . . . . . . . . . . . 1 3
Derivative financial instruments . . . . . . . . . . . . . . . . . . . . . . . . . . . . . . . . . . . . . . . . . . . . . . . . . . . . . . 1 2
Other . . . . . . . . . . . . . . . . . . . . . . . . . . . . . . . . . . . . . . . . . . . . . . . . . . . . . . . . . . . . . . . . . . . . . . . . . . . . . . 122 101
Other long-term assets . . . . . . . . . . . . . . . . . . . . . . . . . . . . . . . . . . . . . . . . . . . . . . . . . . . . . . . . . . . . . . $590 $576
Both the cost and accumulated amortization of lease rights and key money are impacted by fluctuations in foreigncurrency rates. Amortization expense associated with lease rights and key money was $4 million, $5 million, and $6million in fiscal 2011, 2010, and 2009, respectively.
Accrued Expenses and Other Current LiabilitiesAccrued expenses and other current liabilities consist of the following:
($ in millions)January 28,
2012January 29,
2011
Accrued compensation and benefits . . . . . . . . . . . . . . . . . . . . . . . . . . . . . . . . . . . . . . . . . . . . . . . . . . . $292 $280
Unredeemed gift cards, gift certificates, and credit vouchers, net of breakage . . . . . . . . . . . . . . 228 233
Short-term deferred rent and tenant allowances . . . . . . . . . . . . . . . . . . . . . . . . . . . . . . . . . . . . . . . 104 99
Workers' compensation liability . . . . . . . . . . . . . . . . . . . . . . . . . . . . . . . . . . . . . . . . . . . . . . . . . . . . . . . 47 50
Accrued advertising . . . . . . . . . . . . . . . . . . . . . . . . . . . . . . . . . . . . . . . . . . . . . . . . . . . . . . . . . . . . . . . . . . 26 25
General insurance liability . . . . . . . . . . . . . . . . . . . . . . . . . . . . . . . . . . . . . . . . . . . . . . . . . . . . . . . . . . . . 23 22
Sales return allowance . . . . . . . . . . . . . . . . . . . . . . . . . . . . . . . . . . . . . . . . . . . . . . . . . . . . . . . . . . . . . . . 21 22
Derivative financial instruments . . . . . . . . . . . . . . . . . . . . . . . . . . . . . . . . . . . . . . . . . . . . . . . . . . . . . . 14 35
Credit card reward points and certificates liability . . . . . . . . . . . . . . . . . . . . . . . . . . . . . . . . . . . . . . . 14 17
Short-term lease loss reserve . . . . . . . . . . . . . . . . . . . . . . . . . . . . . . . . . . . . . . . . . . . . . . . . . . . . . . . . . 5 6
Other . . . . . . . . . . . . . . . . . . . . . . . . . . . . . . . . . . . . . . . . . . . . . . . . . . . . . . . . . . . . . . . . . . . . . . . . . . . . . . 224 204
Accrued expenses and other current liabilities . . . . . . . . . . . . . . . . . . . . . . . . . . . . . . . . . . . . . . . . . . $998 $993
No other individual items accounted for greater than five percent of total current liabilities as of January 28, 2012 orJanuary 29, 2011.
Beginning in fiscal 2011, we included short-term debt in current maturities of debt in the Consolidated BalanceSheets. Accordingly, short-term debt of $3 million that was included in accrued expenses and other currentliabilities as of January 29, 2011 has been included in current maturities of debt to conform to the current periodpresentation.
51

Lease Incentives and Other Long-Term LiabilitiesLease incentives and other long-term liabilities consist of the following:
($ in millions)January 28,
2012January 29,
2011
Long-term deferred rent and tenant allowances . . . . . . . . . . . . . . . . . . . . . . . . . . . . . . . . . . . . . . . . $705 $717
Long-term income tax-related liabilities . . . . . . . . . . . . . . . . . . . . . . . . . . . . . . . . . . . . . . . . . . . . . . . 129 90
Asset retirement obligations . . . . . . . . . . . . . . . . . . . . . . . . . . . . . . . . . . . . . . . . . . . . . . . . . . . . . . . . . . 47 37
Deferred compensation plan liabilities . . . . . . . . . . . . . . . . . . . . . . . . . . . . . . . . . . . . . . . . . . . . . . . . . 22 27
Long-term lease loss reserve . . . . . . . . . . . . . . . . . . . . . . . . . . . . . . . . . . . . . . . . . . . . . . . . . . . . . . . . . . 4 4
Derivative financial instruments . . . . . . . . . . . . . . . . . . . . . . . . . . . . . . . . . . . . . . . . . . . . . . . . . . . . . . — 2
Other . . . . . . . . . . . . . . . . . . . . . . . . . . . . . . . . . . . . . . . . . . . . . . . . . . . . . . . . . . . . . . . . . . . . . . . . . . . . . . 26 13
Lease incentives and other long-term liabilities . . . . . . . . . . . . . . . . . . . . . . . . . . . . . . . . . . . . . . . . . $933 $890
The activity related to asset retirement obligations includes adjustments to the asset retirement obligationbalance and fluctuations in foreign currency rates. The activity was not material for fiscal 2011 or 2010.
Accumulated Other Comprehensive IncomeAccumulated OCI consists of the following:
($ in millions)January 28,
2012January 29,
2011
Foreign currency translation, net of tax . . . . . . . . . . . . . . . . . . . . . . . . . . . . . . . . . . . . . . . . . . . . . . . . $229 $205
Accumulated changes in fair value of derivative financial instruments, net of tax . . . . . . . . . . — (20)
Accumulated other comprehensive income . . . . . . . . . . . . . . . . . . . . . . . . . . . . . . . . . . . . . . . . . . . . $229 $185
Sales Return AllowanceA summary of activity in the sales return allowance account is as follows:
($ in millions)January 28,
2012January 29,
2011January 30,
2010
Balance at beginning of fiscal year . . . . . . . . . . . . . . . . . . . . . . . . . . . . . . . . . . . . . . . . . . $ 22 $ 22 $ 21
Additions . . . . . . . . . . . . . . . . . . . . . . . . . . . . . . . . . . . . . . . . . . . . . . . . . . . . . . . . . . . . . . . . 634 712 698
Returns . . . . . . . . . . . . . . . . . . . . . . . . . . . . . . . . . . . . . . . . . . . . . . . . . . . . . . . . . . . . . . . . . . (635) (712) (697)
Balance at end of fiscal year . . . . . . . . . . . . . . . . . . . . . . . . . . . . . . . . . . . . . . . . . . . . . . . . $ 21 $ 22 $ 22
Note 3. Goodwill and Intangible AssetsGoodwill and intangible assets consist of the following and are included in other long-term assets in theConsolidated Balance Sheets:
($ in millions)January 28,
2012January 29,
2011
Goodwill . . . . . . . . . . . . . . . . . . . . . . . . . . . . . . . . . . . . . . . . . . . . . . . . . . . . . . . . . . . . . . . . . . . . . . . . . . . $ 99 $ 99
Trade name . . . . . . . . . . . . . . . . . . . . . . . . . . . . . . . . . . . . . . . . . . . . . . . . . . . . . . . . . . . . . . . . . . . . . . . . . $ 54 $ 54
Intangible assets subject to amortization . . . . . . . . . . . . . . . . . . . . . . . . . . . . . . . . . . . . . . . . . . . . . . $ 15 $ 15
Less: Accumulated amortization . . . . . . . . . . . . . . . . . . . . . . . . . . . . . . . . . . . . . . . . . . . . . . . . . . . . . . (14) (12)
Intangible assets subject to amortization, net . . . . . . . . . . . . . . . . . . . . . . . . . . . . . . . . . . . . . . . . . . $ 1 $ 3
52 Gap Inc. Form 10-K
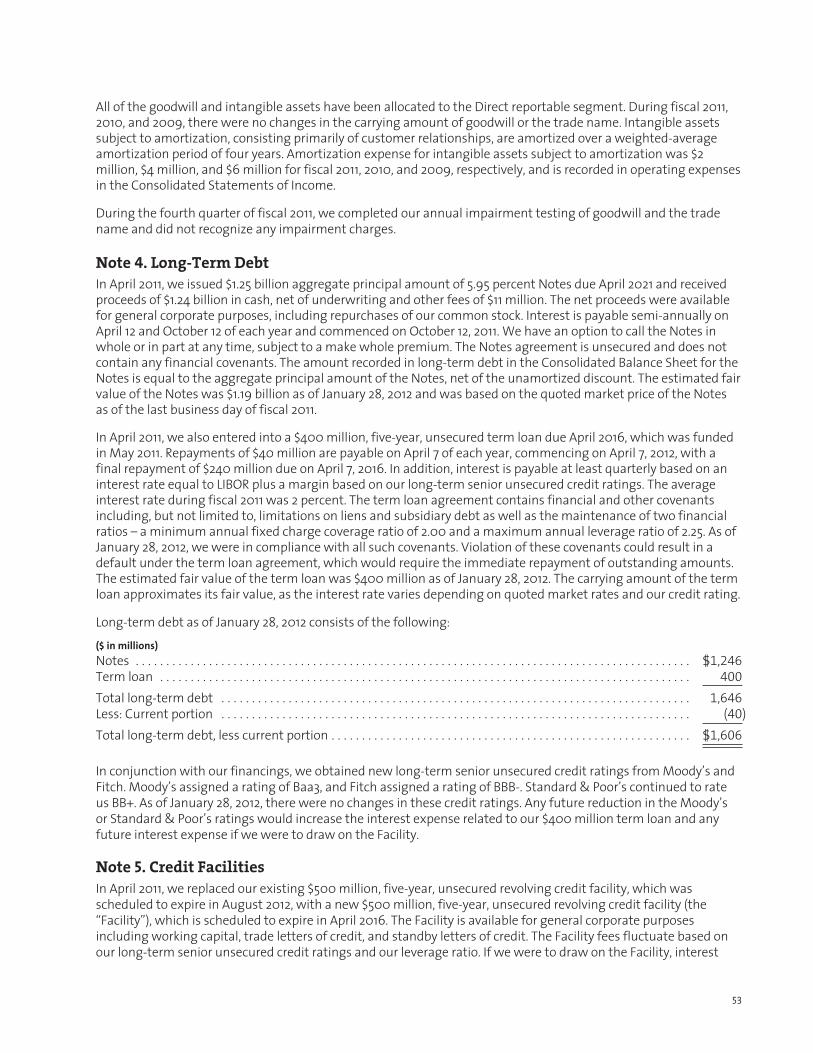
All of the goodwill and intangible assets have been allocated to the Direct reportable segment. During fiscal 2011,2010, and 2009, there were no changes in the carrying amount of goodwill or the trade name. Intangible assetssubject to amortization, consisting primarily of customer relationships, are amortized over a weighted-averageamortization period of four years. Amortization expense for intangible assets subject to amortization was $2million, $4 million, and $6 million for fiscal 2011, 2010, and 2009, respectively, and is recorded in operating expensesin the Consolidated Statements of Income.
During the fourth quarter of fiscal 2011, we completed our annual impairment testing of goodwill and the tradename and did not recognize any impairment charges.
Note 4. Long-Term DebtIn April 2011, we issued $1.25 billion aggregate principal amount of 5.95 percent Notes due April 2021 and receivedproceeds of $1.24 billion in cash, net of underwriting and other fees of $11 million. The net proceeds were availablefor general corporate purposes, including repurchases of our common stock. Interest is payable semi-annually onApril 12 and October 12 of each year and commenced on October 12, 2011. We have an option to call the Notes inwhole or in part at any time, subject to a make whole premium. The Notes agreement is unsecured and does notcontain any financial covenants. The amount recorded in long-term debt in the Consolidated Balance Sheet for theNotes is equal to the aggregate principal amount of the Notes, net of the unamortized discount. The estimated fairvalue of the Notes was $1.19 billion as of January 28, 2012 and was based on the quoted market price of the Notesas of the last business day of fiscal 2011.
In April 2011, we also entered into a $400 million, five-year, unsecured term loan due April 2016, which was fundedin May 2011. Repayments of $40 million are payable on April 7 of each year, commencing on April 7, 2012, with afinal repayment of $240 million due on April 7, 2016. In addition, interest is payable at least quarterly based on aninterest rate equal to LIBOR plus a margin based on our long-term senior unsecured credit ratings. The averageinterest rate during fiscal 2011 was 2 percent. The term loan agreement contains financial and other covenantsincluding, but not limited to, limitations on liens and subsidiary debt as well as the maintenance of two financialratios – a minimum annual fixed charge coverage ratio of 2.00 and a maximum annual leverage ratio of 2.25. As ofJanuary 28, 2012, we were in compliance with all such covenants. Violation of these covenants could result in adefault under the term loan agreement, which would require the immediate repayment of outstanding amounts.The estimated fair value of the term loan was $400 million as of January 28, 2012. The carrying amount of the termloan approximates its fair value, as the interest rate varies depending on quoted market rates and our credit rating.
Long-term debt as of January 28, 2012 consists of the following:($ in millions)Notes . . . . . . . . . . . . . . . . . . . . . . . . . . . . . . . . . . . . . . . . . . . . . . . . . . . . . . . . . . . . . . . . . . . . . . . . . . . . . . . . . . . . . . . . . . . $1,246
Term loan . . . . . . . . . . . . . . . . . . . . . . . . . . . . . . . . . . . . . . . . . . . . . . . . . . . . . . . . . . . . . . . . . . . . . . . . . . . . . . . . . . . . . . . 400
Total long-term debt . . . . . . . . . . . . . . . . . . . . . . . . . . . . . . . . . . . . . . . . . . . . . . . . . . . . . . . . . . . . . . . . . . . . . . . . . . . . . 1,646
Less: Current portion . . . . . . . . . . . . . . . . . . . . . . . . . . . . . . . . . . . . . . . . . . . . . . . . . . . . . . . . . . . . . . . . . . . . . . . . . . . . . (40)
Total long-term debt, less current portion . . . . . . . . . . . . . . . . . . . . . . . . . . . . . . . . . . . . . . . . . . . . . . . . . . . . . . . . . . . $1,606
In conjunction with our financings, we obtained new long-term senior unsecured credit ratings from Moody’s andFitch. Moody’s assigned a rating of Baa3, and Fitch assigned a rating of BBB-. Standard & Poor’s continued to rateus BB+. As of January 28, 2012, there were no changes in these credit ratings. Any future reduction in the Moody’sor Standard & Poor’s ratings would increase the interest expense related to our $400 million term loan and anyfuture interest expense if we were to draw on the Facility.
Note 5. Credit FacilitiesIn April 2011, we replaced our existing $500 million, five-year, unsecured revolving credit facility, which wasscheduled to expire in August 2012, with a new $500 million, five-year, unsecured revolving credit facility (the“Facility”), which is scheduled to expire in April 2016. The Facility is available for general corporate purposesincluding working capital, trade letters of credit, and standby letters of credit. The Facility fees fluctuate based onour long-term senior unsecured credit ratings and our leverage ratio. If we were to draw on the Facility, interest
53

would be a base rate (typically LIBOR) plus a margin based on our long-term senior unsecured credit ratings andour leverage ratio on the unpaid principal amount. To maintain availability of funds under the Facility, we pay afacility fee on the full facility amount, regardless of usage. As of January 28, 2012, there were no borrowings underthe Facility. The net availability of the Facility, reflecting $43 million of outstanding standby letters of credit, was$457 million as of January 28, 2012.
In September 2010, we entered into two separate agreements to make unsecured revolving credit facilities available forour operations in China (the “China Facilities”). The China Facilities are uncommitted and are available for borrowings,overdraft borrowings, and the issuance of bank guarantees. The 196 million Chinese yuan (approximately $31 million asof January 28, 2012) China Facilities were set to expire in August 2011 but were renewed under substantially similarterms through September 2012. As of January 28, 2012, there were borrowings of $19 million (118 million Chinese yuan)at an interest rate of 6.53 percent under the China Facilities, which are recorded in current maturities of debt in theConsolidated Balance Sheet. The net availability of the China Facilities, reflecting these borrowings and $1 million inbank guarantees related to store leases, was approximately $11 million as of January 28, 2012. The China Facilityagreements do not contain any financial covenants. As of January 29, 2011, there were borrowings of $3 million underthe China Facilities, which are recorded in current maturities of debt in the Consolidated Balance Sheet.
Trade letters of credit represent a payment undertaking guaranteed by a bank on our behalf to pay a vendor agiven amount of money upon presentation of specific documents demonstrating that merchandise has shipped.Vendor payables are recorded in the Consolidated Balance Sheets at the time of merchandise title transfer,although the letters of credit are generally issued prior to this. As of January 28, 2012, we had a $100 million,two-year, unsecured committed letter of credit agreement with an expiration date of September 2012. As ofJanuary 28, 2012, we had no trade letters of credit issued under this letter of credit agreement.
The Facility and letter of credit agreement contain financial and other covenants, including but not limited tolimitations on liens and subsidiary debt, as well as the maintenance of two financial ratios—a minimum annualfixed charge coverage ratio of 2.00 and a maximum annual leverage ratio of 2.25. As of January 28, 2012, we were incompliance with all such covenants. Violation of these covenants could result in a default under the Facility andletter of credit agreement, which would permit the participating banks to terminate our ability to access theFacility for letters of credit and advances, terminate our ability to request letters of credit under the letter of creditagreement, require the immediate repayment of any outstanding advances under the Facility, and require theimmediate posting of cash collateral in support of any outstanding letters of credit under the letter ofcredit agreement.
Note 6. Fair Value MeasurementsEffective January 30, 2011, we adopted enhanced disclosure requirements for fair value measurements. There wereno purchases, sales, issuances, or settlements related to recurring level 3 measurements during fiscal 2011. Therewere no transfers into or out of level 1 and level 2 during fiscal 2011 or 2010.
54 Gap Inc. Form 10-K

Financial Assets and LiabilitiesFinancial assets and liabilities measured at fair value on a recurring basis and cash equivalents and short-terminvestments held at amortized cost are as follows:
Fair Value Measurements at Reporting Date Using
($ in millions) January 28, 2012
Quoted Prices inActive Markets for
Identical Assets(Level 1)
Significant OtherObservable Inputs
(Level 2)
SignificantUnobservable
Inputs(Level 3)
Assets:Cash equivalents . . . . . . . . . . . . . . . . . . . . . . . . . . $1,009 $224 $785 $—
Short-term investments . . . . . . . . . . . . . . . . . . . . — — — —
Derivative financial instruments . . . . . . . . . . . . 13 — 13 —
Deferred compensation plan assets . . . . . . . . . 22 22 — —
Total . . . . . . . . . . . . . . . . . . . . . . . . . . . . . . . . . . . . . $1,044 $246 $798 $—
Liabilities:Derivative financial instruments . . . . . . . . . . . . $ 14 $ — $ 14 $—
Fair Value Measurements at Reporting Date Using
($ in millions) January 29, 2011
Quoted Prices inActive Markets for
Identical Assets(Level 1)
Significant OtherObservable Inputs
(Level 2)
SignificantUnobservable
Inputs(Level 3)
Assets:Cash equivalents . . . . . . . . . . . . . . . . . . . . . . . . . . $ 942 $338 $604 $—
Short-term investments . . . . . . . . . . . . . . . . . . . . 100 — 100 —
Derivative financial instruments . . . . . . . . . . . . 4 — 4 —
Deferred compensation plan assets . . . . . . . . . 27 27 — —
Total . . . . . . . . . . . . . . . . . . . . . . . . . . . . . . . . . . . . . $1,073 $365 $708 $—
Liabilities:Derivative financial instruments . . . . . . . . . . . . $ 37 $ — $ 37 $—
We have highly liquid investments classified as cash equivalents and short-term investments, which are placedprimarily in money market funds, time deposits, and commercial paper. These investments are classified asheld-to-maturity based on our positive intent and ability to hold the securities to maturity. We value theseinvestments at their original purchase prices plus interest that has accrued at the stated rate. As discussed in Note2 of Notes to Consolidated Financial Statements, the table above includes money market funds of $338 million asof January 29, 2011 as level 1.
Derivative financial instruments primarily include foreign exchange forward contracts. The principal currencieshedged against changes in the U.S. dollar are Euro, British pounds, Japanese yen, and Canadian dollars. The fairvalue of the Company’s derivative financial instruments is determined using pricing models based on currentmarket rates. Derivative financial instruments in an asset position are recorded in other current assets or otherlong-term assets in the Consolidated Balance Sheets. Derivative financial instruments in a liability position arerecorded in accrued expenses and other current liabilities or lease incentives and other long-term liabilities in theConsolidated Balance Sheets.
We maintain the Gap Inc. Deferred Compensation Plan (“DCP”), which allows eligible employees to defercompensation up to a maximum amount. Plan investments are recorded at market value and are designated forthe DCP. The fair value of the Company’s DCP assets is determined based on quoted market prices, and the assetsare recorded in other long-term assets in the Consolidated Balance Sheets.
55
Nonfinancial AssetsAs discussed in Note 2 of Notes to Consolidated Financial Statements, we recorded a charge for the impairment oflong-lived assets of $16 million, $8 million, and $14 million for fiscal 2011, 2010, and 2009, respectively. Theimpairment charge reduced the then carrying amount of the applicable long-lived assets of $21 million, $12 million,and $16 million to their fair value of $5 million, $4 million, and $2 million during fiscal 2011, 2010, and 2009,respectively. The fair value of the long-lived assets was determined using level 3 inputs and the valuationtechniques discussed in Note 1 of Notes to Consolidated Financial Statements.
As discussed in Note 3 of Notes to Consolidated Financial Statements, there were no impairment charges recordedfor goodwill or other indefinite-lived intangible assets for fiscal 2011, 2010, or 2009.
Note 7. Derivative Financial Instruments
We operate in foreign countries, which exposes us to market risk associated with foreign currency exchange ratefluctuations. Our risk management policy is to hedge a significant portion of forecasted merchandise purchases forforeign operations, forecasted intercompany royalty payments, and intercompany obligations that bear foreignexchange risk using foreign exchange forward contracts. The principal currencies hedged against changes in theU.S. dollar are Euro, British pounds, Japanese yen, and Canadian dollars. Until March 2009, we also used a cross-currency interest rate swap to swap the interest and principal payable of the $50 million debt of our Japanesesubsidiary, Gap (Japan) KK. In connection with the maturity of the debt, the swap was settled in March 2009.We do not enter into derivative financial contracts for trading purposes.
Cash Flow HedgesWe designate the following foreign exchange forward contracts as cash flow hedges: (1) forward contracts used tohedge forecasted merchandise purchases denominated primarily in U.S. dollars made by our internationalsubsidiaries whose functional currencies are their local currencies; and (2) forward contracts used to hedgeforecasted intercompany royalty payments denominated in Japanese yen and Canadian dollars received by entitieswhose functional currencies are U.S. dollars. We enter into foreign exchange forward contracts to hedgeforecasted merchandise purchases and related costs generally occurring in 12 to 18 months. We makeintercompany royalty payments on a quarterly basis, and we enter into foreign exchange forward contracts tohedge intercompany royalty payments generally occurring in 9 to 15 months.
During fiscal 2011, we entered into and settled treasury rate lock agreements in anticipation of issuing our 5.95percent fixed-rate Notes of $1.25 billion in April 2011. Prior to the issuance of our Notes, we were subject to changesin interest rates, and we therefore locked into fixed-rate coupons to hedge against the interest rate fluctuations.The gain related to the treasury lock agreements is reported as a component of OCI and is recognized in incomeover the life of the Notes.
There were no material amounts recorded in income for fiscal 2011, 2010, or 2009 as a result of hedgeineffectiveness, hedge components excluded from the assessment of effectiveness, or the discontinuance of cashflow hedges because the forecasted transactions were no longer probable.
Net Investment HedgesWe also use foreign exchange forward contracts to hedge the net assets of international subsidiaries to offset theforeign currency translation and economic exposures related to our investment in the subsidiaries.
There were no amounts recorded in income for fiscal 2011, 2010, or 2009 as a result of hedge ineffectiveness, hedgecomponents excluded from the assessment of effectiveness, or the discontinuance of net investment hedges.
Not Designated as Hedging InstrumentsIn addition, we use foreign exchange forward contracts to hedge our market risk exposure associated with foreigncurrency exchange rate fluctuations for certain intercompany balances denominated in currencies other than thefunctional currency of the entity with the intercompany balance. The gain or loss on the derivative financial
56 Gap Inc. Form 10-K

instruments, as well as the remeasurement of the underlying intercompany balances, is recorded in operatingexpenses in the Consolidated Statements of Income in the same period and generally offset.
We generally enter into foreign exchange forward contracts as needed to hedge intercompany balances that bearforeign exchange risk. These foreign exchange forward contracts generally settle in less than 12 months.
Outstanding Notional AmountsAs of January 28, 2012 and January 29, 2011, we had foreign exchange forward contracts outstanding to sell variouscurrencies related to our forecasted merchandise purchases and forecasted intercompany royalty payments and tobuy the following notional amounts:
(notional amounts in millions)January 28,
2012January 29,
2011
U.S. dollars (1) . . . . . . . . . . . . . . . . . . . . . . . . . . . . . . . . . . . . . . . . . . . . . . . . . . . . . . . . . . . . . . . . . . . . . . . $796 $1,025
British pounds . . . . . . . . . . . . . . . . . . . . . . . . . . . . . . . . . . . . . . . . . . . . . . . . . . . . . . . . . . . . . . . . . . . . . . £ 30 £ 54
(1) The principal currencies hedged against changes in the U.S. dollar were British pounds, Japanese yen, and Canadian dollars.
As of January 28, 2012 and January 29, 2011, we had foreign exchange forward contracts outstanding to hedge thenet assets of our Japanese subsidiary in the following notional amounts:
(notional amounts in millions)January 28,
2012January 29,
2011
Japanese yen . . . . . . . . . . . . . . . . . . . . . . . . . . . . . . . . . . . . . . . . . . . . . . . . . . . . . . . . . . . . . . . . . . . . . . . . ¥— ¥3,000
As of January 28, 2012 and January 29, 2011, we had foreign exchange forward contracts outstanding to buy thefollowing currencies related to our intercompany balances that bear foreign exchange risk:
(notional amounts in millions)January 28,
2012January 29,
2011
U.S. dollars . . . . . . . . . . . . . . . . . . . . . . . . . . . . . . . . . . . . . . . . . . . . . . . . . . . . . . . . . . . . . . . . . . . . . . . . . . $ 77 $ 12
British pounds . . . . . . . . . . . . . . . . . . . . . . . . . . . . . . . . . . . . . . . . . . . . . . . . . . . . . . . . . . . . . . . . . . . . . . £ 1 £ —
Japanese yen . . . . . . . . . . . . . . . . . . . . . . . . . . . . . . . . . . . . . . . . . . . . . . . . . . . . . . . . . . . . . . . . . . . . . . . . ¥2,564 ¥3,238
Euro . . . . . . . . . . . . . . . . . . . . . . . . . . . . . . . . . . . . . . . . . . . . . . . . . . . . . . . . . . . . . . . . . . . . . . . . . . . . . . . € 16 € —
Contingent FeaturesWe had no derivative financial instruments with credit-risk-related contingent features underlying the agreementsas of January 28, 2012 or January 29, 2011.
57

Quantitative Disclosures about Derivative Financial InstrumentsThe fair values of asset and liability derivative financial instruments are as follows:
January 28, 2012Asset Derivatives Liability Derivatives
($ in millions) Balance Sheet LocationFair
Value Balance Sheet LocationFair
Value
Derivatives designated as cash flow hedges:
Foreign exchange forward contracts . . Other current assets $ 9
Accrued expenses andother current liabilities $ 10
Foreign exchange forward contracts . . Other long-term assets 1
Lease incentives andother long-termliabilities —
Total derivatives designated as cashflow hedges . . . . . . . . . . . . . . . . . . . . . . 10 10
Derivatives designated as net investmenthedges:
Foreign exchange forward contracts . . Other current assets —
Accrued expenses andother current liabilities —
Foreign exchange forward contracts . . Other long-term assets —
Lease incentives andother long-termliabilities —
Total derivatives designated as netinvestment hedges . . . . . . . . . . . . . . . . — —
Derivatives not designated as hedginginstruments:
Foreign exchange forward contracts . . Other current assets 3
Accrued expenses andother current liabilities 4
Foreign exchange forward contracts . . Other long-term assets —
Lease incentives andother long-termliabilities —
Total derivatives not designated ashedging instruments . . . . . . . . . . . . . . 3 4
Total derivative instruments . . . . . . . . . . . . . . $ 13 $ 14
58 Gap Inc. Form 10-K
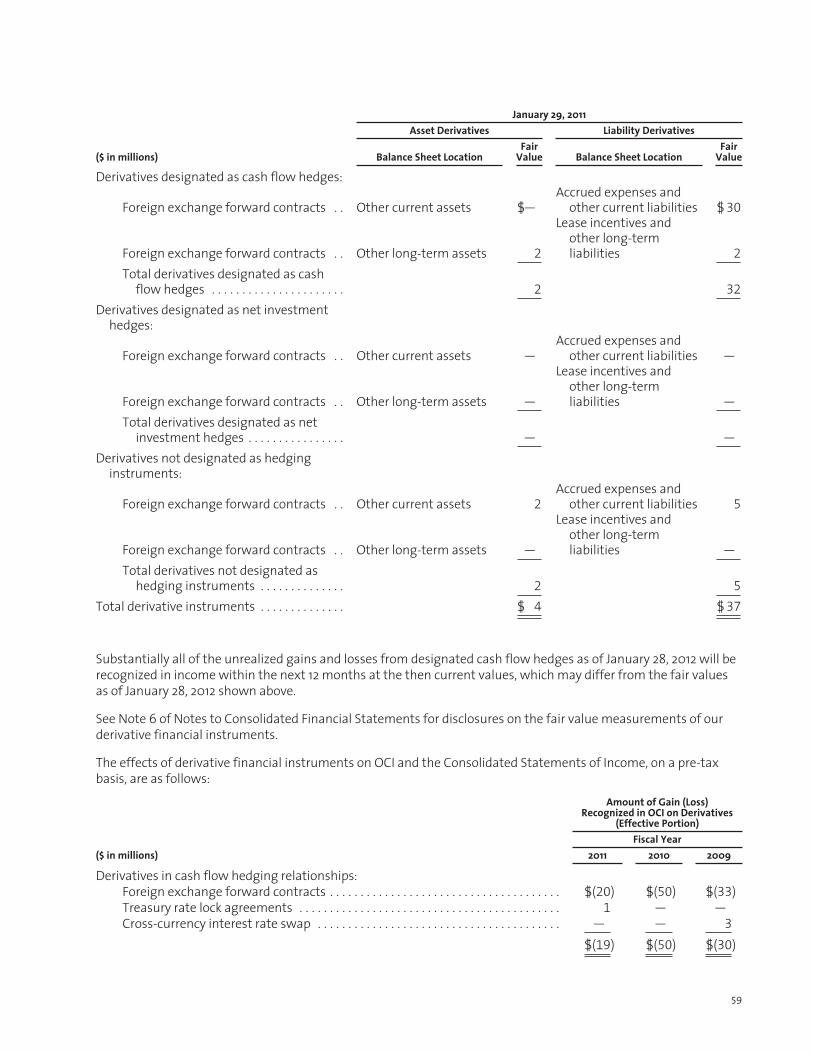
January 29, 2011Asset Derivatives Liability Derivatives
($ in millions) Balance Sheet LocationFair
Value Balance Sheet LocationFair
Value
Derivatives designated as cash flow hedges:
Foreign exchange forward contracts . . Other current assets $—
Accrued expenses andother current liabilities $ 30
Foreign exchange forward contracts . . Other long-term assets 2
Lease incentives andother long-termliabilities 2
Total derivatives designated as cashflow hedges . . . . . . . . . . . . . . . . . . . . . . 2 32
Derivatives designated as net investmenthedges:
Foreign exchange forward contracts . . Other current assets —
Accrued expenses andother current liabilities —
Foreign exchange forward contracts . . Other long-term assets —
Lease incentives andother long-termliabilities —
Total derivatives designated as netinvestment hedges . . . . . . . . . . . . . . . . — —
Derivatives not designated as hedginginstruments:
Foreign exchange forward contracts . . Other current assets 2
Accrued expenses andother current liabilities 5
Foreign exchange forward contracts . . Other long-term assets —
Lease incentives andother long-termliabilities —
Total derivatives not designated ashedging instruments . . . . . . . . . . . . . . 2 5
Total derivative instruments . . . . . . . . . . . . . . $ 4 $ 37
Substantially all of the unrealized gains and losses from designated cash flow hedges as of January 28, 2012 will berecognized in income within the next 12 months at the then current values, which may differ from the fair valuesas of January 28, 2012 shown above.
See Note 6 of Notes to Consolidated Financial Statements for disclosures on the fair value measurements of ourderivative financial instruments.
The effects of derivative financial instruments on OCI and the Consolidated Statements of Income, on a pre-taxbasis, are as follows:
Amount of Gain (Loss)Recognized in OCI on Derivatives
(Effective Portion)Fiscal Year
($ in millions) 2011 2010 2009
Derivatives in cash flow hedging relationships:Foreign exchange forward contracts . . . . . . . . . . . . . . . . . . . . . . . . . . . . . . . . . . . . . . $(20) $(50) $(33)
Treasury rate lock agreements . . . . . . . . . . . . . . . . . . . . . . . . . . . . . . . . . . . . . . . . . . . 1 — —
Cross-currency interest rate swap . . . . . . . . . . . . . . . . . . . . . . . . . . . . . . . . . . . . . . . . — — 3
$(19) $(50) $(30)
59
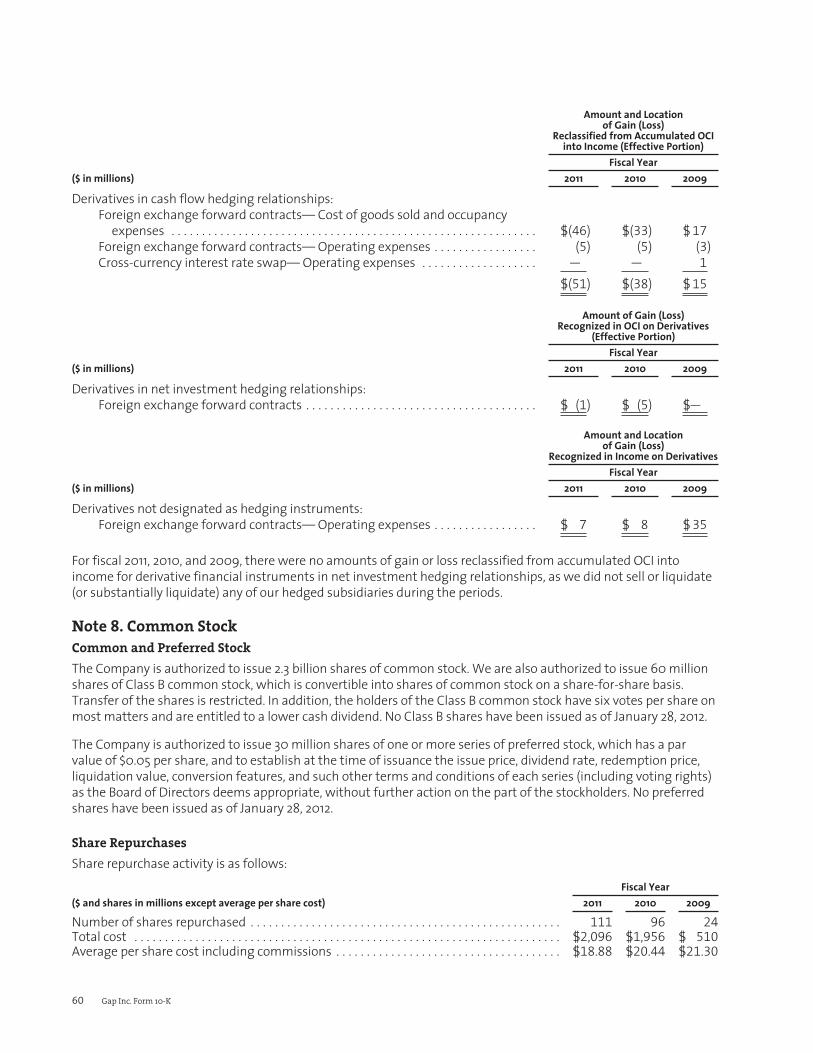
Amount and Locationof Gain (Loss)
Reclassified from Accumulated OCIinto Income (Effective Portion)
Fiscal Year($ in millions) 2011 2010 2009
Derivatives in cash flow hedging relationships:Foreign exchange forward contracts— Cost of goods sold and occupancy
expenses . . . . . . . . . . . . . . . . . . . . . . . . . . . . . . . . . . . . . . . . . . . . . . . . . . . . . . . . . . . . $(46) $(33) $ 17
Foreign exchange forward contracts— Operating expenses . . . . . . . . . . . . . . . . . (5) (5) (3)
Cross-currency interest rate swap— Operating expenses . . . . . . . . . . . . . . . . . . . — — 1
$(51) $(38) $ 15
Amount of Gain (Loss)Recognized in OCI on Derivatives
(Effective Portion)Fiscal Year
($ in millions) 2011 2010 2009
Derivatives in net investment hedging relationships:Foreign exchange forward contracts . . . . . . . . . . . . . . . . . . . . . . . . . . . . . . . . . . . . . . $ (1) $ (5) $—
Amount and Locationof Gain (Loss)
Recognized in Income on DerivativesFiscal Year
($ in millions) 2011 2010 2009
Derivatives not designated as hedging instruments:Foreign exchange forward contracts— Operating expenses . . . . . . . . . . . . . . . . . $ 7 $ 8 $ 35
For fiscal 2011, 2010, and 2009, there were no amounts of gain or loss reclassified from accumulated OCI intoincome for derivative financial instruments in net investment hedging relationships, as we did not sell or liquidate(or substantially liquidate) any of our hedged subsidiaries during the periods.
Note 8. Common StockCommon and Preferred StockThe Company is authorized to issue 2.3 billion shares of common stock. We are also authorized to issue 60 millionshares of Class B common stock, which is convertible into shares of common stock on a share-for-share basis.Transfer of the shares is restricted. In addition, the holders of the Class B common stock have six votes per share onmost matters and are entitled to a lower cash dividend. No Class B shares have been issued as of January 28, 2012.
The Company is authorized to issue 30 million shares of one or more series of preferred stock, which has a parvalue of $0.05 per share, and to establish at the time of issuance the issue price, dividend rate, redemption price,liquidation value, conversion features, and such other terms and conditions of each series (including voting rights)as the Board of Directors deems appropriate, without further action on the part of the stockholders. No preferredshares have been issued as of January 28, 2012.
Share RepurchasesShare repurchase activity is as follows:
Fiscal Year($ and shares in millions except average per share cost) 2011 2010 2009
Number of shares repurchased . . . . . . . . . . . . . . . . . . . . . . . . . . . . . . . . . . . . . . . . . . . . . . . . . . . 111 96 24
Total cost . . . . . . . . . . . . . . . . . . . . . . . . . . . . . . . . . . . . . . . . . . . . . . . . . . . . . . . . . . . . . . . . . . . . . . $2,096 $1,956 $ 510
Average per share cost including commissions . . . . . . . . . . . . . . . . . . . . . . . . . . . . . . . . . . . . . $18.88 $20.44 $21.30
60 Gap Inc. Form 10-K
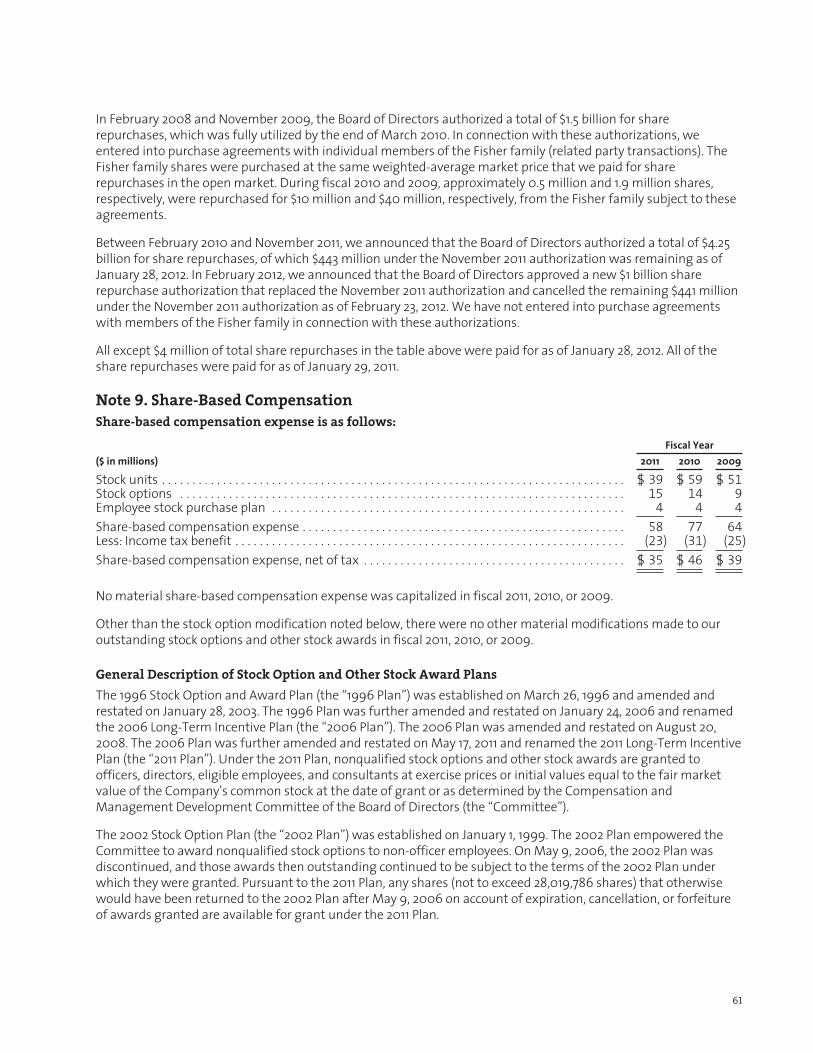
In February 2008 and November 2009, the Board of Directors authorized a total of $1.5 billion for sharerepurchases, which was fully utilized by the end of March 2010. In connection with these authorizations, weentered into purchase agreements with individual members of the Fisher family (related party transactions). TheFisher family shares were purchased at the same weighted-average market price that we paid for sharerepurchases in the open market. During fiscal 2010 and 2009, approximately 0.5 million and 1.9 million shares,respectively, were repurchased for $10 million and $40 million, respectively, from the Fisher family subject to theseagreements.
Between February 2010 and November 2011, we announced that the Board of Directors authorized a total of $4.25billion for share repurchases, of which $443 million under the November 2011 authorization was remaining as ofJanuary 28, 2012. In February 2012, we announced that the Board of Directors approved a new $1 billion sharerepurchase authorization that replaced the November 2011 authorization and cancelled the remaining $441 millionunder the November 2011 authorization as of February 23, 2012. We have not entered into purchase agreementswith members of the Fisher family in connection with these authorizations.
All except $4 million of total share repurchases in the table above were paid for as of January 28, 2012. All of theshare repurchases were paid for as of January 29, 2011.
Note 9. Share-Based CompensationShare-based compensation expense is as follows:
Fiscal Year($ in millions) 2011 2010 2009
Stock units . . . . . . . . . . . . . . . . . . . . . . . . . . . . . . . . . . . . . . . . . . . . . . . . . . . . . . . . . . . . . . . . . . . . . . . . . . . . $ 39 $ 59 $ 51
Stock options . . . . . . . . . . . . . . . . . . . . . . . . . . . . . . . . . . . . . . . . . . . . . . . . . . . . . . . . . . . . . . . . . . . . . . . . . 15 14 9
Employee stock purchase plan . . . . . . . . . . . . . . . . . . . . . . . . . . . . . . . . . . . . . . . . . . . . . . . . . . . . . . . . . . 4 4 4
Share-based compensation expense . . . . . . . . . . . . . . . . . . . . . . . . . . . . . . . . . . . . . . . . . . . . . . . . . . . . . 58 77 64
Less: Income tax benefit . . . . . . . . . . . . . . . . . . . . . . . . . . . . . . . . . . . . . . . . . . . . . . . . . . . . . . . . . . . . . . . . (23) (31) (25)
Share-based compensation expense, net of tax . . . . . . . . . . . . . . . . . . . . . . . . . . . . . . . . . . . . . . . . . . . $ 35 $ 46 $ 39
No material share-based compensation expense was capitalized in fiscal 2011, 2010, or 2009.
Other than the stock option modification noted below, there were no other material modifications made to ouroutstanding stock options and other stock awards in fiscal 2011, 2010, or 2009.
General Description of Stock Option and Other Stock Award PlansThe 1996 Stock Option and Award Plan (the “1996 Plan”) was established on March 26, 1996 and amended andrestated on January 28, 2003. The 1996 Plan was further amended and restated on January 24, 2006 and renamedthe 2006 Long-Term Incentive Plan (the “2006 Plan”). The 2006 Plan was amended and restated on August 20,2008. The 2006 Plan was further amended and restated on May 17, 2011 and renamed the 2011 Long-Term IncentivePlan (the “2011 Plan”). Under the 2011 Plan, nonqualified stock options and other stock awards are granted toofficers, directors, eligible employees, and consultants at exercise prices or initial values equal to the fair marketvalue of the Company’s common stock at the date of grant or as determined by the Compensation andManagement Development Committee of the Board of Directors (the “Committee”).
The 2002 Stock Option Plan (the “2002 Plan”) was established on January 1, 1999. The 2002 Plan empowered theCommittee to award nonqualified stock options to non-officer employees. On May 9, 2006, the 2002 Plan wasdiscontinued, and those awards then outstanding continued to be subject to the terms of the 2002 Plan underwhich they were granted. Pursuant to the 2011 Plan, any shares (not to exceed 28,019,786 shares) that otherwisewould have been returned to the 2002 Plan after May 9, 2006 on account of expiration, cancellation, or forfeitureof awards granted are available for grant under the 2011 Plan.
61
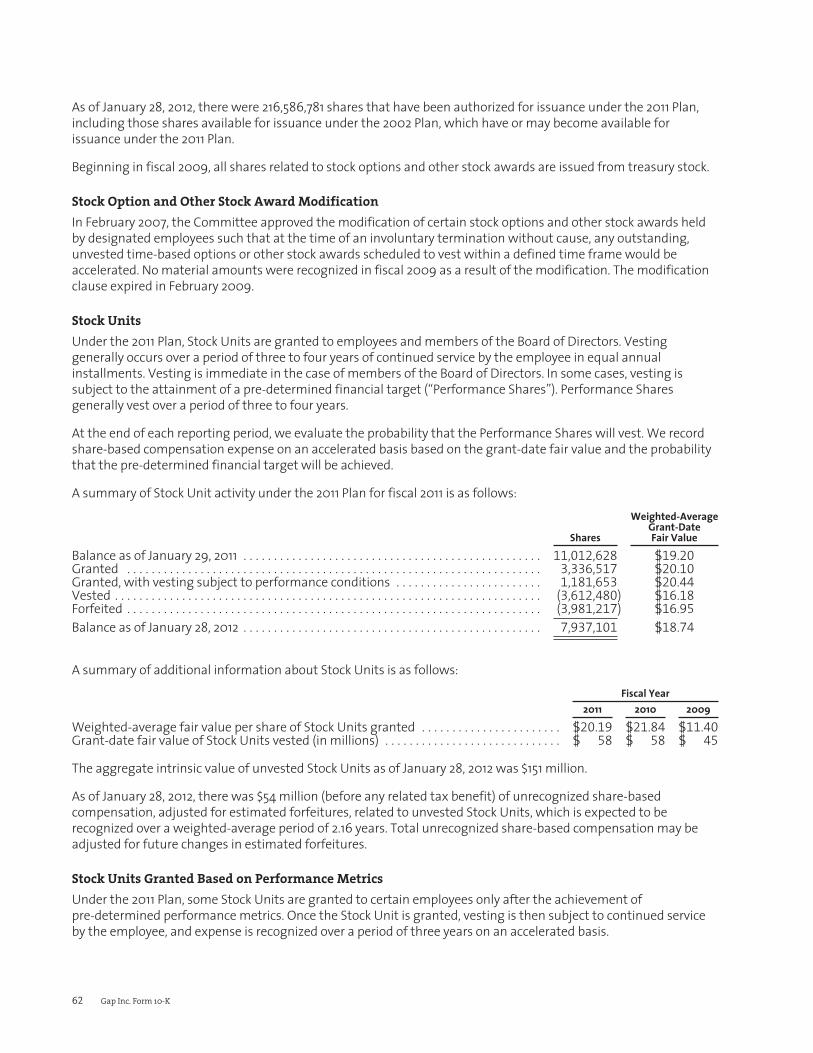
As of January 28, 2012, there were 216,586,781 shares that have been authorized for issuance under the 2011 Plan,including those shares available for issuance under the 2002 Plan, which have or may become available forissuance under the 2011 Plan.
Beginning in fiscal 2009, all shares related to stock options and other stock awards are issued from treasury stock.
Stock Option and Other Stock Award ModificationIn February 2007, the Committee approved the modification of certain stock options and other stock awards heldby designated employees such that at the time of an involuntary termination without cause, any outstanding,unvested time-based options or other stock awards scheduled to vest within a defined time frame would beaccelerated. No material amounts were recognized in fiscal 2009 as a result of the modification. The modificationclause expired in February 2009.
Stock UnitsUnder the 2011 Plan, Stock Units are granted to employees and members of the Board of Directors. Vestinggenerally occurs over a period of three to four years of continued service by the employee in equal annualinstallments. Vesting is immediate in the case of members of the Board of Directors. In some cases, vesting issubject to the attainment of a pre-determined financial target (“Performance Shares”). Performance Sharesgenerally vest over a period of three to four years.
At the end of each reporting period, we evaluate the probability that the Performance Shares will vest. We recordshare-based compensation expense on an accelerated basis based on the grant-date fair value and the probabilitythat the pre-determined financial target will be achieved.
A summary of Stock Unit activity under the 2011 Plan for fiscal 2011 is as follows:
Shares
Weighted-AverageGrant-DateFair Value
Balance as of January 29, 2011 . . . . . . . . . . . . . . . . . . . . . . . . . . . . . . . . . . . . . . . . . . . . . . . . . 11,012,628 $19.20
Granted . . . . . . . . . . . . . . . . . . . . . . . . . . . . . . . . . . . . . . . . . . . . . . . . . . . . . . . . . . . . . . . . . . . . 3,336,517 $20.10
Granted, with vesting subject to performance conditions . . . . . . . . . . . . . . . . . . . . . . . . 1,181,653 $20.44
Vested . . . . . . . . . . . . . . . . . . . . . . . . . . . . . . . . . . . . . . . . . . . . . . . . . . . . . . . . . . . . . . . . . . . . . . (3,612,480) $16.18
Forfeited . . . . . . . . . . . . . . . . . . . . . . . . . . . . . . . . . . . . . . . . . . . . . . . . . . . . . . . . . . . . . . . . . . . . (3,981,217) $16.95
Balance as of January 28, 2012 . . . . . . . . . . . . . . . . . . . . . . . . . . . . . . . . . . . . . . . . . . . . . . . . . 7,937,101 $18.74
A summary of additional information about Stock Units is as follows:Fiscal Year
2011 2010 2009
Weighted-average fair value per share of Stock Units granted . . . . . . . . . . . . . . . . . . . . . . . $20.19 $21.84 $11.40
Grant-date fair value of Stock Units vested (in millions) . . . . . . . . . . . . . . . . . . . . . . . . . . . . . $ 58 $ 58 $ 45
The aggregate intrinsic value of unvested Stock Units as of January 28, 2012 was $151 million.
As of January 28, 2012, there was $54 million (before any related tax benefit) of unrecognized share-basedcompensation, adjusted for estimated forfeitures, related to unvested Stock Units, which is expected to berecognized over a weighted-average period of 2.16 years. Total unrecognized share-based compensation may beadjusted for future changes in estimated forfeitures.
Stock Units Granted Based on Performance MetricsUnder the 2011 Plan, some Stock Units are granted to certain employees only after the achievement ofpre-determined performance metrics. Once the Stock Unit is granted, vesting is then subject to continued serviceby the employee, and expense is recognized over a period of three years on an accelerated basis.
62 Gap Inc. Form 10-K

At the end of each reporting period, we evaluate the probability that Stock Units will be granted. We record share-based compensation expense based on the probability that the performance metrics will be achieved, with anoffsetting increase to current liabilities. We revalue the liability at the end of each reporting period and record anadjustment to share-based compensation expense as required, based on the probability that the performancemetrics will be achieved. Upon achievement of the performance metrics, a Stock Unit is granted. At that time, theassociated liability is reclassified to stockholders’ equity.
Out of 3,336,517, 3,431,422, and 4,992,213 Stock Units granted in fiscal 2011, 2010, and 2009, respectively, 157,125,930,081, and 703,146 Stock Units, respectively, were granted based on satisfaction of performance metrics.
The liability related to potential Stock Units based on performance metrics, which is recorded in accrued expensesand other current liabilities in the Consolidated Balance Sheets, was $1 million as of January 28, 2012 andJanuary 29, 2011.
Stock OptionsWe have stock options outstanding under the 2011 Plan and the 2002 Plan. Stock options generally expire 10 yearsfrom the grant date, three months after employee termination, or one year after the date of an employee’sretirement or death, if earlier. Vesting generally occurs over a period of four years of continued service by theemployee, with 25 percent vesting on each of the four anniversary dates.
The fair value of stock options issued during fiscal 2011, 2010, and 2009 was estimated on the date of grant usingthe following assumptions:
Fiscal Year2011 2010 2009
Expected term (in years) . . . . . . . . . . . . . . . . . . . . . . . . . . . . . . . . . . . . . . . . . . . . . . . . . . . . . . . . . . . . . . 4.9 4.8 5.0
Expected volatility . . . . . . . . . . . . . . . . . . . . . . . . . . . . . . . . . . . . . . . . . . . . . . . . . . . . . . . . . . . . . . . . . . . 30.6% 29.0% 51.3%
Dividend yield . . . . . . . . . . . . . . . . . . . . . . . . . . . . . . . . . . . . . . . . . . . . . . . . . . . . . . . . . . . . . . . . . . . . . . . 2.1% 1.8% 1.9%
Risk-free interest rate . . . . . . . . . . . . . . . . . . . . . . . . . . . . . . . . . . . . . . . . . . . . . . . . . . . . . . . . . . . . . . . . . 2.3% 2.7% 1.9%
A summary of stock option activity under the 2011 Plan and the 2002 Plan for fiscal 2011 is as follows:
Shares
Weighted-Average
Exercise Price
Balance as of January 29, 2011 . . . . . . . . . . . . . . . . . . . . . . . . . . . . . . . . . . . . . . . . . . . . . . . . . . . . . 24,169,323 $18.48
Granted . . . . . . . . . . . . . . . . . . . . . . . . . . . . . . . . . . . . . . . . . . . . . . . . . . . . . . . . . . . . . . . . . . . . . . . . 2,863,538 $21.75
Exercised . . . . . . . . . . . . . . . . . . . . . . . . . . . . . . . . . . . . . . . . . . . . . . . . . . . . . . . . . . . . . . . . . . . . . . . (4,157,545) $16.63
Forfeited/Expired . . . . . . . . . . . . . . . . . . . . . . . . . . . . . . . . . . . . . . . . . . . . . . . . . . . . . . . . . . . . . . . . (2,277,778) $20.41
Balance as of January 28, 2012 . . . . . . . . . . . . . . . . . . . . . . . . . . . . . . . . . . . . . . . . . . . . . . . . . . . . . 20,597,538 $19.10
63

A summary of additional information about stock options is as follows:Fiscal Year
2011 2010 2009
Weighted-average fair value per share of stock options granted . . . . . . . . . . . . . . . . . . . . . . . . . $5.28 $5.57 $4.86
Aggregate intrinsic value of stock options exercised (in millions) . . . . . . . . . . . . . . . . . . . . . . . . $ 19 $ 19 $ 14
Fair value of stock options vested (in millions) . . . . . . . . . . . . . . . . . . . . . . . . . . . . . . . . . . . . . . . . . $ 15 $ 15 $ 14
Information about stock options outstanding, vested or expected to vest, and exercisable as of January 28, 2012 isas follows:
Options Outstanding Options Exercisable
Range of Exercise Prices
Number ofShares as of
January 28, 2012
Weighted-Average
RemainingContractual
Life (in years)
Weighted-Average
Exercise Price
Number ofShares as of
January 28, 2012
Weighted-Average
Exercise Price
$10.50 - $13.93 . . . . . . . . . . . . . . . . . . . . . . . . 2,624,718 4.41 $12.19 1,631,280 $12.45
$14.03 - $16.90 . . . . . . . . . . . . . . . . . . . . . . . . 2,597,961 4.87 $16.27 1,712,961 $16.23
$17.01 - $19.99 . . . . . . . . . . . . . . . . . . . . . . . . 5,956,174 5.03 $18.88 4,453,376 $18.79
$20.01 - $21.88 . . . . . . . . . . . . . . . . . . . . . . . . 6,447,779 4.92 $21.51 3,818,366 $21.34
$22.18 - $28.41 . . . . . . . . . . . . . . . . . . . . . . . . 2,970,906 5.70 $22.89 1,646,868 $22.74
20,597,538 4.99 $19.10 13,262,851 $18.90
Vested or expected to vest as of January28, 2012 . . . . . . . . . . . . . . . . . . . . . . . . . . . . . 19,162,478 4.77 $19.07
The aggregate intrinsic value of options outstanding, options vested or expected to vest, and options exercisable asof January 28, 2012 was $26 million, $24 million, and $17 million, respectively. Stock options exercisable as ofJanuary 28, 2012 had a weighted-average remaining contractual life of 3.73 years.
Employee Stock Purchase PlanUnder our Employee Stock Purchase Plan (“ESPP”), eligible U.S. employees are able to purchase our common stockat 85 percent of the closing price on the New York Stock Exchange on the last day of the three-month purchaseperiods. Accordingly, compensation expense is recognized for an amount equal to the 15 percent discount.Employees pay for their stock purchases through payroll deductions at a rate equal to any whole percentage from1 percent to 15 percent. There were 1,357,769, 1,301,167, and 1,574,464 shares issued under the ESPP in fiscal 2011,2010, and 2009, respectively. As of January 28, 2012, there were 6,025,890 shares reserved for future issuancesunder the ESPP.
Note 10. LeasesWe lease most of our store premises and some of our corporate facilities and distribution centers. These operatingleases expire at various dates through 2031. Most store leases are for a five-year base period and include optionsthat allow us to extend the lease term beyond the initial base period, subject to terms agreed upon at leaseinception. Some leases also include early termination options, which can be exercised under specific conditions.
We also lease certain equipment under operating leases that expire at various dates through 2015.
64 Gap Inc. Form 10-K
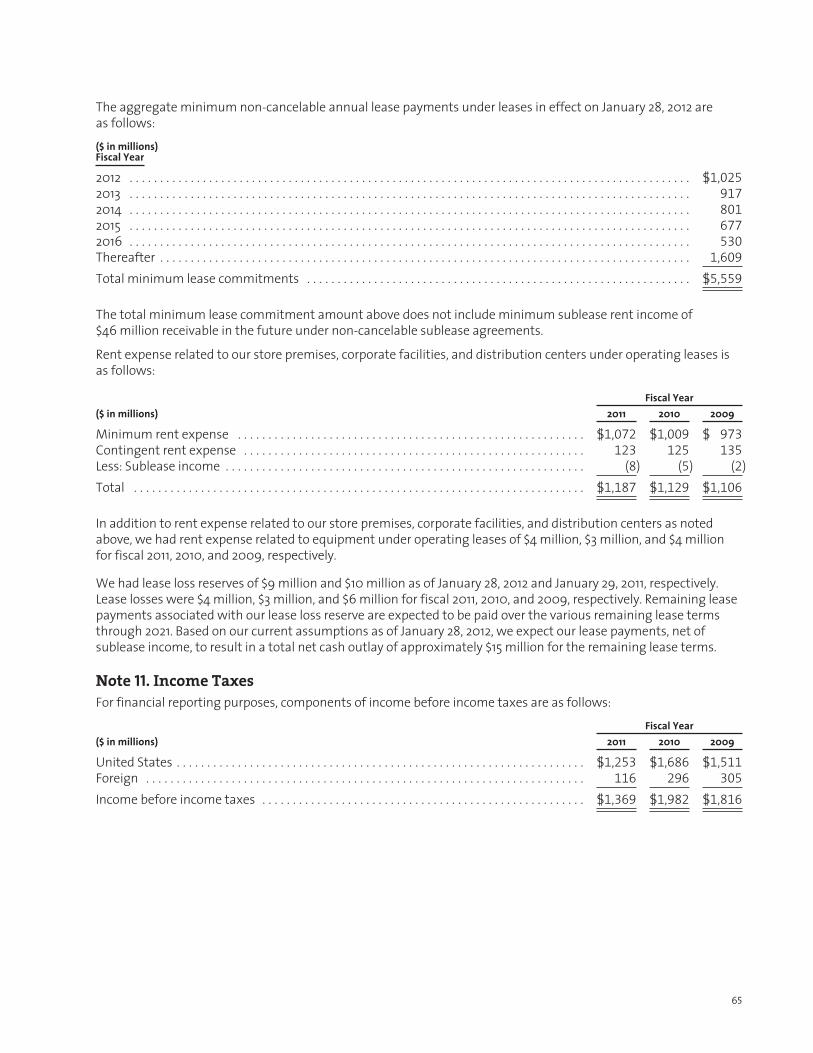
The aggregate minimum non-cancelable annual lease payments under leases in effect on January 28, 2012 areas follows:($ in millions)Fiscal Year
2012 . . . . . . . . . . . . . . . . . . . . . . . . . . . . . . . . . . . . . . . . . . . . . . . . . . . . . . . . . . . . . . . . . . . . . . . . . . . . . . . . . . . . . . . . . . . . $1,025
2013 . . . . . . . . . . . . . . . . . . . . . . . . . . . . . . . . . . . . . . . . . . . . . . . . . . . . . . . . . . . . . . . . . . . . . . . . . . . . . . . . . . . . . . . . . . . . 917
2014 . . . . . . . . . . . . . . . . . . . . . . . . . . . . . . . . . . . . . . . . . . . . . . . . . . . . . . . . . . . . . . . . . . . . . . . . . . . . . . . . . . . . . . . . . . . . 801
2015 . . . . . . . . . . . . . . . . . . . . . . . . . . . . . . . . . . . . . . . . . . . . . . . . . . . . . . . . . . . . . . . . . . . . . . . . . . . . . . . . . . . . . . . . . . . . 677
2016 . . . . . . . . . . . . . . . . . . . . . . . . . . . . . . . . . . . . . . . . . . . . . . . . . . . . . . . . . . . . . . . . . . . . . . . . . . . . . . . . . . . . . . . . . . . . 530
Thereafter . . . . . . . . . . . . . . . . . . . . . . . . . . . . . . . . . . . . . . . . . . . . . . . . . . . . . . . . . . . . . . . . . . . . . . . . . . . . . . . . . . . . . . . 1,609
Total minimum lease commitments . . . . . . . . . . . . . . . . . . . . . . . . . . . . . . . . . . . . . . . . . . . . . . . . . . . . . . . . . . . . . . . $5,559
The total minimum lease commitment amount above does not include minimum sublease rent income of$46 million receivable in the future under non-cancelable sublease agreements.
Rent expense related to our store premises, corporate facilities, and distribution centers under operating leases isas follows:
Fiscal Year($ in millions) 2011 2010 2009
Minimum rent expense . . . . . . . . . . . . . . . . . . . . . . . . . . . . . . . . . . . . . . . . . . . . . . . . . . . . . . . . . $1,072 $1,009 $ 973
Contingent rent expense . . . . . . . . . . . . . . . . . . . . . . . . . . . . . . . . . . . . . . . . . . . . . . . . . . . . . . . . 123 125 135
Less: Sublease income . . . . . . . . . . . . . . . . . . . . . . . . . . . . . . . . . . . . . . . . . . . . . . . . . . . . . . . . . . . (8) (5) (2)
Total . . . . . . . . . . . . . . . . . . . . . . . . . . . . . . . . . . . . . . . . . . . . . . . . . . . . . . . . . . . . . . . . . . . . . . . . . . $1,187 $1,129 $1,106
In addition to rent expense related to our store premises, corporate facilities, and distribution centers as notedabove, we had rent expense related to equipment under operating leases of $4 million, $3 million, and $4 millionfor fiscal 2011, 2010, and 2009, respectively.
We had lease loss reserves of $9 million and $10 million as of January 28, 2012 and January 29, 2011, respectively.Lease losses were $4 million, $3 million, and $6 million for fiscal 2011, 2010, and 2009, respectively. Remaining leasepayments associated with our lease loss reserve are expected to be paid over the various remaining lease termsthrough 2021. Based on our current assumptions as of January 28, 2012, we expect our lease payments, net ofsublease income, to result in a total net cash outlay of approximately $15 million for the remaining lease terms.
Note 11. Income TaxesFor financial reporting purposes, components of income before income taxes are as follows:
Fiscal Year($ in millions) 2011 2010 2009
United States . . . . . . . . . . . . . . . . . . . . . . . . . . . . . . . . . . . . . . . . . . . . . . . . . . . . . . . . . . . . . . . . . . . $1,253 $1,686 $1,511
Foreign . . . . . . . . . . . . . . . . . . . . . . . . . . . . . . . . . . . . . . . . . . . . . . . . . . . . . . . . . . . . . . . . . . . . . . . . 116 296 305
Income before income taxes . . . . . . . . . . . . . . . . . . . . . . . . . . . . . . . . . . . . . . . . . . . . . . . . . . . . . $1,369 $1,982 $1,816
65

The provision for income taxes consists of the following:Fiscal Year
($ in millions) 2011 2010 2009
Current:Federal . . . . . . . . . . . . . . . . . . . . . . . . . . . . . . . . . . . . . . . . . . . . . . . . . . . . . . . . . . . . . . . . . . . . . . . . . $419 $476 $572
State . . . . . . . . . . . . . . . . . . . . . . . . . . . . . . . . . . . . . . . . . . . . . . . . . . . . . . . . . . . . . . . . . . . . . . . . . . . 37 75 78
Foreign . . . . . . . . . . . . . . . . . . . . . . . . . . . . . . . . . . . . . . . . . . . . . . . . . . . . . . . . . . . . . . . . . . . . . . . . . 91 134 114
Total current . . . . . . . . . . . . . . . . . . . . . . . . . . . . . . . . . . . . . . . . . . . . . . . . . . . . . . . . . . . . . . . . . . . . . . . . 547 685 764
Deferred:Federal . . . . . . . . . . . . . . . . . . . . . . . . . . . . . . . . . . . . . . . . . . . . . . . . . . . . . . . . . . . . . . . . . . . . . . . . . 14 94 (43)
State . . . . . . . . . . . . . . . . . . . . . . . . . . . . . . . . . . . . . . . . . . . . . . . . . . . . . . . . . . . . . . . . . . . . . . . . . . . (6) (5) (10)
Foreign . . . . . . . . . . . . . . . . . . . . . . . . . . . . . . . . . . . . . . . . . . . . . . . . . . . . . . . . . . . . . . . . . . . . . . . . . (19) 4 3
Total deferred . . . . . . . . . . . . . . . . . . . . . . . . . . . . . . . . . . . . . . . . . . . . . . . . . . . . . . . . . . . . . . . . . . . . . . . (11) 93 (50)
Total provision . . . . . . . . . . . . . . . . . . . . . . . . . . . . . . . . . . . . . . . . . . . . . . . . . . . . . . . . . . . . . . . . . . . . . . . $536 $778 $714
Except where required by U.S. tax law, no provision has been made for U.S. income taxes on the undistributedearnings of our foreign subsidiaries when we intend to utilize those earnings in foreign operations for an indefiniteperiod of time. Such undistributed earnings and profits, as calculated pursuant to provisions in the U.S. InternalRevenue Code and related Treasury Regulations, of foreign subsidiaries as of January 28, 2012 and January 29, 2011were approximately $1.5 billion and $1.3 billion, respectively. Cash balances in these foreign subsidiaries aresubstantially lower than these earnings and profits. If we had not intended to utilize the undistributed earnings inour foreign operations for an indefinite period of time, the deferred tax liability as of January 28, 2012 andJanuary 29, 2011 would have been approximately $225 million and $194 million, respectively. During fiscal 2011, weassessed the forecasted cash needs and overall financial position of our foreign subsidiaries. As a result, wedetermined that approximately $40 million of current year earnings and profits was in excess of the amount weexpect to utilize in our foreign operations for an indefinite period of time, and accordingly, recorded the related taxexpense of $4 million in fiscal 2011.
The difference between the effective income tax rate and the U.S. federal income tax rate is as follows:Fiscal Year
2011 2010 2009
Federal tax rate . . . . . . . . . . . . . . . . . . . . . . . . . . . . . . . . . . . . . . . . . . . . . . . . . . . . . . . . . . . . . . . . . . . . . 35.0% 35.0% 35.0%
State income taxes, less federal benefit . . . . . . . . . . . . . . . . . . . . . . . . . . . . . . . . . . . . . . . . . . . . . . . 3.2 3.6 3.7
Tax impact of foreign operations . . . . . . . . . . . . . . . . . . . . . . . . . . . . . . . . . . . . . . . . . . . . . . . . . . . . . 2.9 2.0 1.4
Other . . . . . . . . . . . . . . . . . . . . . . . . . . . . . . . . . . . . . . . . . . . . . . . . . . . . . . . . . . . . . . . . . . . . . . . . . . . . . . (1.9) (1.3) (0.8)
Effective tax rate . . . . . . . . . . . . . . . . . . . . . . . . . . . . . . . . . . . . . . . . . . . . . . . . . . . . . . . . . . . . . . . . . . . . 39.2% 39.3% 39.3%
66 Gap Inc. Form 10-K
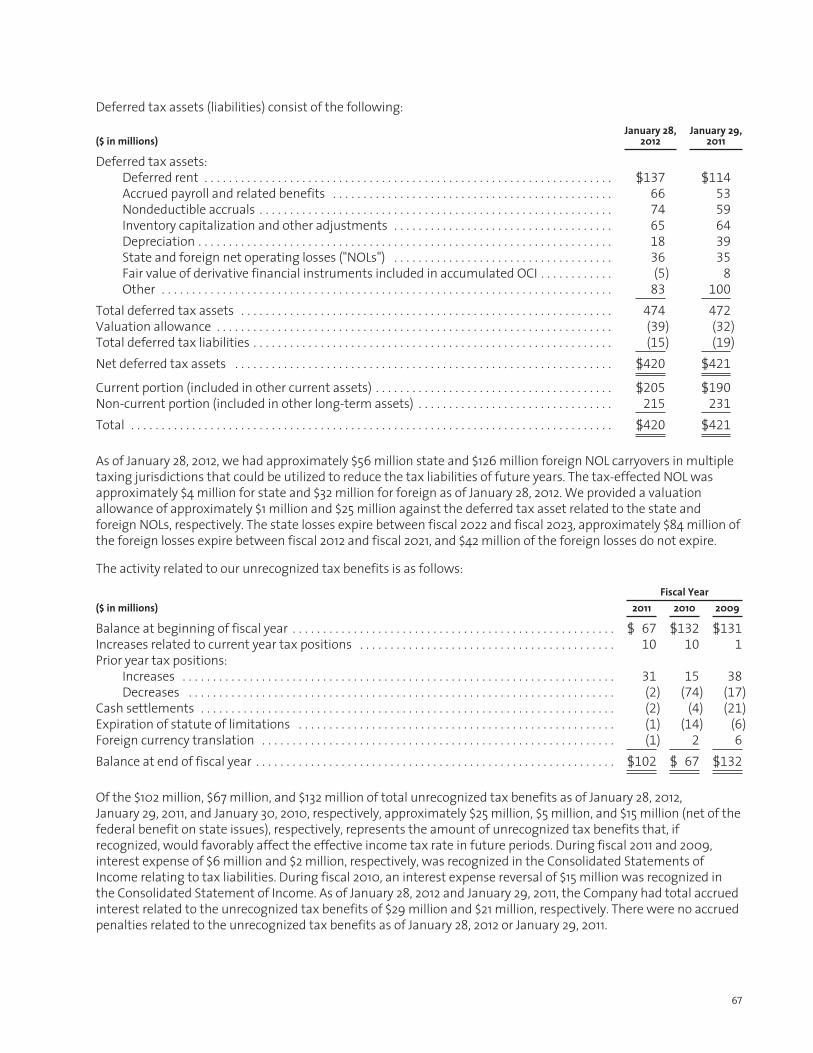
Deferred tax assets (liabilities) consist of the following:
($ in millions)January 28,
2012January 29,
2011
Deferred tax assets:Deferred rent . . . . . . . . . . . . . . . . . . . . . . . . . . . . . . . . . . . . . . . . . . . . . . . . . . . . . . . . . . . . . . . . . . . $137 $114
Accrued payroll and related benefits . . . . . . . . . . . . . . . . . . . . . . . . . . . . . . . . . . . . . . . . . . . . . . 66 53
Nondeductible accruals . . . . . . . . . . . . . . . . . . . . . . . . . . . . . . . . . . . . . . . . . . . . . . . . . . . . . . . . . . 74 59
Inventory capitalization and other adjustments . . . . . . . . . . . . . . . . . . . . . . . . . . . . . . . . . . . . 65 64
Depreciation . . . . . . . . . . . . . . . . . . . . . . . . . . . . . . . . . . . . . . . . . . . . . . . . . . . . . . . . . . . . . . . . . . . . 18 39
State and foreign net operating losses ("NOLs") . . . . . . . . . . . . . . . . . . . . . . . . . . . . . . . . . . . . 36 35
Fair value of derivative financial instruments included in accumulated OCI . . . . . . . . . . . . (5) 8
Other . . . . . . . . . . . . . . . . . . . . . . . . . . . . . . . . . . . . . . . . . . . . . . . . . . . . . . . . . . . . . . . . . . . . . . . . . . 83 100
Total deferred tax assets . . . . . . . . . . . . . . . . . . . . . . . . . . . . . . . . . . . . . . . . . . . . . . . . . . . . . . . . . . . . . 474 472
Valuation allowance . . . . . . . . . . . . . . . . . . . . . . . . . . . . . . . . . . . . . . . . . . . . . . . . . . . . . . . . . . . . . . . . . (39) (32)
Total deferred tax liabilities . . . . . . . . . . . . . . . . . . . . . . . . . . . . . . . . . . . . . . . . . . . . . . . . . . . . . . . . . . . (15) (19)
Net deferred tax assets . . . . . . . . . . . . . . . . . . . . . . . . . . . . . . . . . . . . . . . . . . . . . . . . . . . . . . . . . . . . . . $420 $421
Current portion (included in other current assets) . . . . . . . . . . . . . . . . . . . . . . . . . . . . . . . . . . . . . . . $205 $190
Non-current portion (included in other long-term assets) . . . . . . . . . . . . . . . . . . . . . . . . . . . . . . . . 215 231
Total . . . . . . . . . . . . . . . . . . . . . . . . . . . . . . . . . . . . . . . . . . . . . . . . . . . . . . . . . . . . . . . . . . . . . . . . . . . . . . . $420 $421
As of January 28, 2012, we had approximately $56 million state and $126 million foreign NOL carryovers in multipletaxing jurisdictions that could be utilized to reduce the tax liabilities of future years. The tax-effected NOL wasapproximately $4 million for state and $32 million for foreign as of January 28, 2012. We provided a valuationallowance of approximately $1 million and $25 million against the deferred tax asset related to the state andforeign NOLs, respectively. The state losses expire between fiscal 2022 and fiscal 2023, approximately $84 million ofthe foreign losses expire between fiscal 2012 and fiscal 2021, and $42 million of the foreign losses do not expire.
The activity related to our unrecognized tax benefits is as follows:Fiscal Year
($ in millions) 2011 2010 2009
Balance at beginning of fiscal year . . . . . . . . . . . . . . . . . . . . . . . . . . . . . . . . . . . . . . . . . . . . . . . . . . . . . $ 67 $132 $131
Increases related to current year tax positions . . . . . . . . . . . . . . . . . . . . . . . . . . . . . . . . . . . . . . . . . . 10 10 1
Prior year tax positions:Increases . . . . . . . . . . . . . . . . . . . . . . . . . . . . . . . . . . . . . . . . . . . . . . . . . . . . . . . . . . . . . . . . . . . . . . . 31 15 38
Decreases . . . . . . . . . . . . . . . . . . . . . . . . . . . . . . . . . . . . . . . . . . . . . . . . . . . . . . . . . . . . . . . . . . . . . . (2) (74) (17)
Cash settlements . . . . . . . . . . . . . . . . . . . . . . . . . . . . . . . . . . . . . . . . . . . . . . . . . . . . . . . . . . . . . . . . . . . . (2) (4) (21)
Expiration of statute of limitations . . . . . . . . . . . . . . . . . . . . . . . . . . . . . . . . . . . . . . . . . . . . . . . . . . . . (1) (14) (6)
Foreign currency translation . . . . . . . . . . . . . . . . . . . . . . . . . . . . . . . . . . . . . . . . . . . . . . . . . . . . . . . . . . (1) 2 6
Balance at end of fiscal year . . . . . . . . . . . . . . . . . . . . . . . . . . . . . . . . . . . . . . . . . . . . . . . . . . . . . . . . . . . $102 $ 67 $132
Of the $102 million, $67 million, and $132 million of total unrecognized tax benefits as of January 28, 2012,January 29, 2011, and January 30, 2010, respectively, approximately $25 million, $5 million, and $15 million (net of thefederal benefit on state issues), respectively, represents the amount of unrecognized tax benefits that, ifrecognized, would favorably affect the effective income tax rate in future periods. During fiscal 2011 and 2009,interest expense of $6 million and $2 million, respectively, was recognized in the Consolidated Statements ofIncome relating to tax liabilities. During fiscal 2010, an interest expense reversal of $15 million was recognized inthe Consolidated Statement of Income. As of January 28, 2012 and January 29, 2011, the Company had total accruedinterest related to the unrecognized tax benefits of $29 million and $21 million, respectively. There were no accruedpenalties related to the unrecognized tax benefits as of January 28, 2012 or January 29, 2011.
67

The Company conducts business globally, and as a result, files income tax returns in the U.S. federal jurisdictionand various state and foreign jurisdictions. In the normal course of business, we are subject to examination bytaxing authorities throughout the world, including such major jurisdictions as the United States, Canada, France,Hong Kong, Japan, and the United Kingdom. We are no longer subject to U.S. federal income tax examinations forfiscal years before 2008, and with few exceptions, we are also no longer subject to U.S. state, local, or non-U.S.income tax examinations for fiscal years before 2003.
The Company engages in continual discussions with taxing authorities regarding tax matters in the various U.S.and foreign jurisdictions. As of January 28, 2012, we do not anticipate any significant changes in total grossunrecognized tax benefits within the next 12 months.
Note 12. Employee Benefit Plans
We have two qualified defined contribution retirement plans, the GapShare 401(k) Plan and the GapShare PuertoRico Plan (the “Plans”), which are available to employees who meet the eligibility requirements. The Plans permiteligible employees to make contributions up to the maximum limits allowable under the Internal Revenue Code.Under the Plans, we match, in cash, all or a portion of employees’ contributions under a predetermined formula.Our contributions vest immediately. Our matching contributions to the Plans were $36 million, $36 million, and $35million in fiscal 2011, 2010, and 2009, respectively.
We maintain the Gap Inc. Deferred Compensation Plan (“DCP”), which allows eligible employees to defer compensationup to a maximum amount. Plan investments are recorded at market value and are designated for the DCP. The fair valueof the Company’s DCP assets is determined based on quoted market prices. As of January 28, 2012 and January 29, 2011,the assets related to the DCP were $22 million and $27 million, respectively, and were recorded in other long-term assetsin the Consolidated Balance Sheets. As of January 28, 2012 and January 29, 2011, the corresponding liabilities related tothe DCP were $22 million and $27 million, respectively, and were recorded in lease incentives and other long-termliabilities in the Consolidated Balance Sheets. We match all or a portion of employees’ contributions under apredetermined formula. Plan investments are elected by the participants, and investment returns are not guaranteed bythe Company. Our matching contributions to the DCP in fiscal 2011, 2010, and 2009 were not material.
Note 13. Earnings per Share
Weighted-average number of shares used for earnings per share is as follows:Fiscal Year
(shares in millions) 2011 2010 2009
Weighted-average number of shares—basic . . . . . . . . . . . . . . . . . . . . . . . . . . . . . . . . . . . . . . . . . . . . . . . 529 636 694
Common stock equivalents . . . . . . . . . . . . . . . . . . . . . . . . . . . . . . . . . . . . . . . . . . . . . . . . . . . . . . . . . . . . . . 4 5 5
Weighted-average number of shares—diluted . . . . . . . . . . . . . . . . . . . . . . . . . . . . . . . . . . . . . . . . . . . . . 533 641 699
The above computations of weighted-average number of shares—diluted exclude 12 million, 11 million, and25 million shares related to stock options and other stock awards for fiscal 2011, 2010, and 2009, respectively, astheir inclusion would have an antidilutive effect on earnings per share.
Note 14. Commitments and Contingencies
Our future purchase obligations and commitments as of January 28, 2012 are as follows:Payments Due by Period
($ in millions)Less than 1
Year 1-3 Years 3-5 YearsMore Than 5
Years Total
Purchase obligations and commitments (1) . . . . . . . . . . . . . . . . . . $2,712 $229 $126 $8 $3,075
(1) Represents estimated open purchase orders to purchase inventory as well as commitments for products and services used in the normalcourse of business.
68 Gap Inc. Form 10-K
In January 2006, we entered into a non-exclusive services agreement with IBM under which IBM operates certainsignificant aspects of our IT infrastructure. The services agreement expires in March 2016, and we have the right torenew it for up to three additional years. We have various options to terminate the agreement, and we pay IBM acombination of fixed and variable charges, with the variable charges fluctuating based on our actual consumptionof services. IBM also has certain termination rights in the event of our material breach of the agreement andfailure to cure. We paid $107 million, $118 million, and $120 million to IBM for fixed charges in fiscal 2011, 2010, and2009, respectively. Based on the current projection of service needs, we expect to pay approximately $388 millionto IBM over the remaining term of the contract.
We have assigned certain store and corporate facility leases to third parties as of January 28, 2012. Under thesearrangements, we are secondarily liable and have guaranteed the lease payments of the new lessees for theremaining portion of our original lease obligations at various dates through 2017. The maximum potential amountof future lease payments we could be required to make under these guarantees is approximately $5 million as ofJanuary 28, 2012. We recognize a liability for such guarantees when events or changes in circumstances indicatethat the loss is probable and the amount of such loss can be reasonably estimated. There was no liability recordedfor the guarantees as of January 28, 2012 or January 29, 2011.
We are a party to a variety of contractual agreements under which we may be obligated to indemnify the otherparty for certain matters. These contracts primarily relate to our commercial contracts, operating leases,trademarks, intellectual property, financial agreements, and various other agreements. Under these contracts, wemay provide certain routine indemnifications relating to representations and warranties (e.g., ownership of assets,environmental or tax indemnifications), or personal injury matters. The terms of these indemnifications range induration and may not be explicitly defined. Generally, the maximum obligation under such indemnifications is notexplicitly stated, and as a result, the overall amount of these obligations cannot be reasonably estimated.Historically, we have not made significant payments for these indemnifications. We believe that if we were toincur a loss in any of these matters, the loss would not have a material effect on our financial position, results ofoperations, or cash flows taken as a whole.
In January 2012, we were released from our reinsurance pool for workers’ compensation, general liability, andautomobile liability and no longer have any obligations as of January 28, 2012.
As a multinational company, we are subject to various proceedings, lawsuits, disputes, and claims (“Actions”)arising in the ordinary course of our business. Many of these Actions raise complex factual and legal issues and aresubject to uncertainties. As of January 28, 2012, actions filed against us included commercial, intellectual property,customer, employment, and data privacy claims, including class action lawsuits. The plaintiffs in some Actions seekunspecified damages or injunctive relief, or both. Actions are in various procedural stages, and some are covered inpart by insurance. As of January 28, 2012 and January 29, 2011, we recorded a liability for the estimated loss if theoutcome of an Action is expected to result in a loss that is considered probable and reasonably estimable. Theamount of liability as of January 28, 2012 and January 29, 2011 was not material for any individual Action or intotal. Subsequent to January 28, 2012 and through our filing date of March 26, 2012, no information has becomeavailable that indicates a material change to our estimate is required.
We cannot predict with assurance the outcome of Actions brought against us. Accordingly, developments,settlements, or resolutions may occur and impact income in the quarter of such development, settlement, orresolution. However, we do not believe that the outcome of any current Action would have a material effect on ourfinancial position, results of operations, or cash flows taken as a whole.
Note 15. Segment InformationWe identify our operating segments according to how our business activities are managed and evaluated. All ofour operating segments sell a group of similar products – apparel, accessories, and personal care products. Wehave two reportable segments:
• Stores – The Stores reportable segment includes the results of the retail stores for Gap, Old Navy, andBanana Republic. We have aggregated the results of all Stores operating segments into one reportable segmentbecause the operating segments have similar economic characteristics.
69
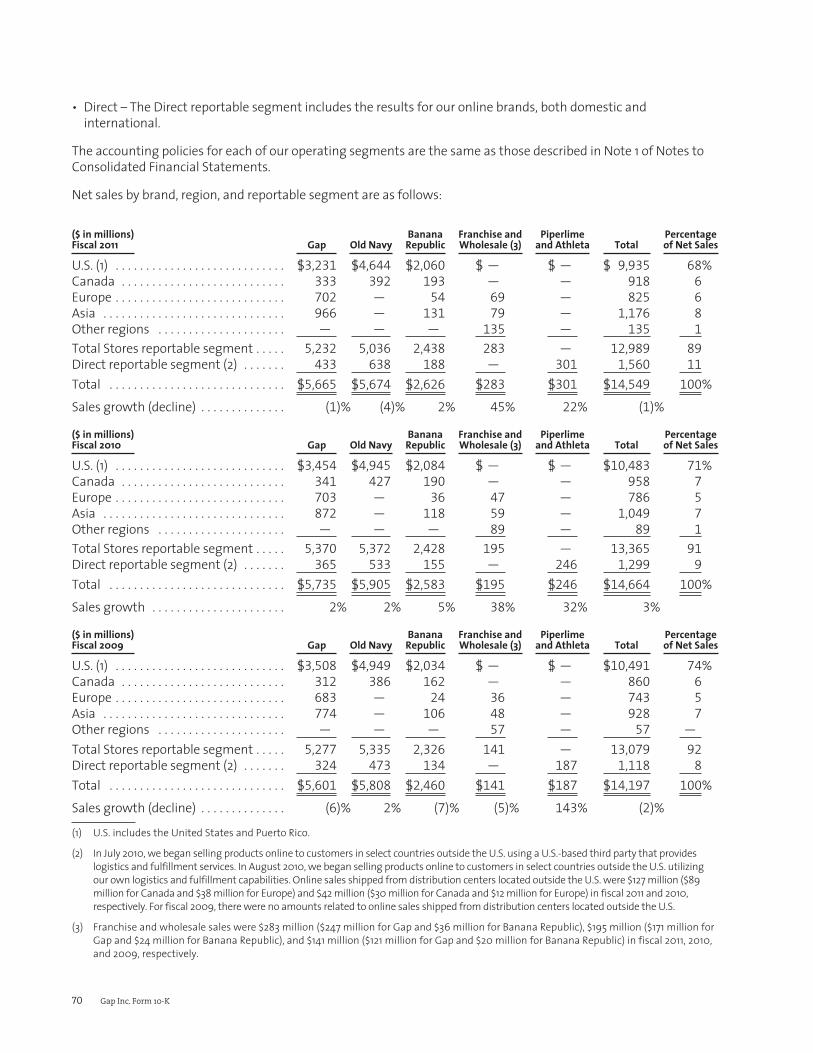
• Direct – The Direct reportable segment includes the results for our online brands, both domestic andinternational.
The accounting policies for each of our operating segments are the same as those described in Note 1 of Notes toConsolidated Financial Statements.
Net sales by brand, region, and reportable segment are as follows:
($ in millions)Fiscal 2011 Gap Old Navy
BananaRepublic
Franchise andWholesale (3)
Piperlimeand Athleta Total
Percentageof Net Sales
U.S. (1) . . . . . . . . . . . . . . . . . . . . . . . . . . . . $3,231 $4,644 $2,060 $ — $ — $ 9,935 68%
Canada . . . . . . . . . . . . . . . . . . . . . . . . . . . 333 392 193 — — 918 6
Europe . . . . . . . . . . . . . . . . . . . . . . . . . . . . 702 — 54 69 — 825 6
Asia . . . . . . . . . . . . . . . . . . . . . . . . . . . . . . 966 — 131 79 — 1,176 8
Other regions . . . . . . . . . . . . . . . . . . . . . — — — 135 — 135 1
Total Stores reportable segment . . . . . 5,232 5,036 2,438 283 — 12,989 89
Direct reportable segment (2) . . . . . . . 433 638 188 — 301 1,560 11
Total . . . . . . . . . . . . . . . . . . . . . . . . . . . . . $5,665 $5,674 $2,626 $283 $301 $14,549 100%
Sales growth (decline) . . . . . . . . . . . . . . (1)% (4)% 2% 45% 22% (1)%
($ in millions)Fiscal 2010 Gap Old Navy
BananaRepublic
Franchise andWholesale (3)
Piperlimeand Athleta Total
Percentageof Net Sales
U.S. (1) . . . . . . . . . . . . . . . . . . . . . . . . . . . . $3,454 $4,945 $2,084 $ — $ — $10,483 71%
Canada . . . . . . . . . . . . . . . . . . . . . . . . . . . 341 427 190 — — 958 7
Europe . . . . . . . . . . . . . . . . . . . . . . . . . . . . 703 — 36 47 — 786 5
Asia . . . . . . . . . . . . . . . . . . . . . . . . . . . . . . 872 — 118 59 — 1,049 7
Other regions . . . . . . . . . . . . . . . . . . . . . — — — 89 — 89 1
Total Stores reportable segment . . . . . 5,370 5,372 2,428 195 — 13,365 91
Direct reportable segment (2) . . . . . . . 365 533 155 — 246 1,299 9
Total . . . . . . . . . . . . . . . . . . . . . . . . . . . . . $5,735 $5,905 $2,583 $195 $246 $14,664 100%
Sales growth . . . . . . . . . . . . . . . . . . . . . . 2% 2% 5% 38% 32% 3%
($ in millions)Fiscal 2009 Gap Old Navy
BananaRepublic
Franchise andWholesale (3)
Piperlimeand Athleta Total
Percentageof Net Sales
U.S. (1) . . . . . . . . . . . . . . . . . . . . . . . . . . . . $3,508 $4,949 $2,034 $ — $ — $10,491 74%
Canada . . . . . . . . . . . . . . . . . . . . . . . . . . . 312 386 162 — — 860 6
Europe . . . . . . . . . . . . . . . . . . . . . . . . . . . . 683 — 24 36 — 743 5
Asia . . . . . . . . . . . . . . . . . . . . . . . . . . . . . . 774 — 106 48 — 928 7
Other regions . . . . . . . . . . . . . . . . . . . . . — — — 57 — 57 —
Total Stores reportable segment . . . . . 5,277 5,335 2,326 141 — 13,079 92
Direct reportable segment (2) . . . . . . . 324 473 134 — 187 1,118 8
Total . . . . . . . . . . . . . . . . . . . . . . . . . . . . . $5,601 $5,808 $2,460 $141 $187 $14,197 100%
Sales growth (decline) . . . . . . . . . . . . . . (6)% 2% (7)% (5)% 143% (2)%
(1) U.S. includes the United States and Puerto Rico.
(2) In July 2010, we began selling products online to customers in select countries outside the U.S. using a U.S.-based third party that provideslogistics and fulfillment services. In August 2010, we began selling products online to customers in select countries outside the U.S. utilizingour own logistics and fulfillment capabilities. Online sales shipped from distribution centers located outside the U.S. were $127 million ($89million for Canada and $38 million for Europe) and $42 million ($30 million for Canada and $12 million for Europe) in fiscal 2011 and 2010,respectively. For fiscal 2009, there were no amounts related to online sales shipped from distribution centers located outside the U.S.
(3) Franchise and wholesale sales were $283 million ($247 million for Gap and $36 million for Banana Republic), $195 million ($171 million forGap and $24 million for Banana Republic), and $141 million ($121 million for Gap and $20 million for Banana Republic) in fiscal 2011, 2010,and 2009, respectively.
70 Gap Inc. Form 10-K
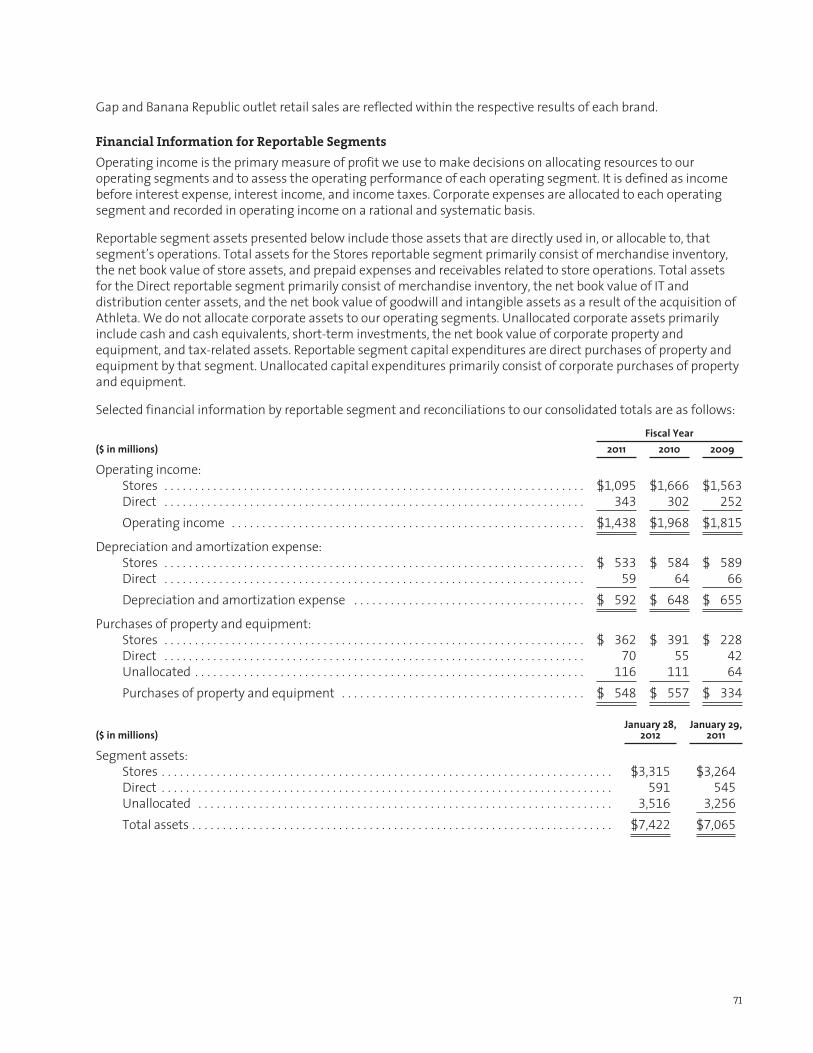
Gap and Banana Republic outlet retail sales are reflected within the respective results of each brand.
Financial Information for Reportable SegmentsOperating income is the primary measure of profit we use to make decisions on allocating resources to ouroperating segments and to assess the operating performance of each operating segment. It is defined as incomebefore interest expense, interest income, and income taxes. Corporate expenses are allocated to each operatingsegment and recorded in operating income on a rational and systematic basis.
Reportable segment assets presented below include those assets that are directly used in, or allocable to, thatsegment’s operations. Total assets for the Stores reportable segment primarily consist of merchandise inventory,the net book value of store assets, and prepaid expenses and receivables related to store operations. Total assetsfor the Direct reportable segment primarily consist of merchandise inventory, the net book value of IT anddistribution center assets, and the net book value of goodwill and intangible assets as a result of the acquisition ofAthleta. We do not allocate corporate assets to our operating segments. Unallocated corporate assets primarilyinclude cash and cash equivalents, short-term investments, the net book value of corporate property andequipment, and tax-related assets. Reportable segment capital expenditures are direct purchases of property andequipment by that segment. Unallocated capital expenditures primarily consist of corporate purchases of propertyand equipment.
Selected financial information by reportable segment and reconciliations to our consolidated totals are as follows:Fiscal Year
($ in millions) 2011 2010 2009
Operating income:Stores . . . . . . . . . . . . . . . . . . . . . . . . . . . . . . . . . . . . . . . . . . . . . . . . . . . . . . . . . . . . . . . . . . . . . $1,095 $1,666 $1,563
Direct . . . . . . . . . . . . . . . . . . . . . . . . . . . . . . . . . . . . . . . . . . . . . . . . . . . . . . . . . . . . . . . . . . . . . 343 302 252
Operating income . . . . . . . . . . . . . . . . . . . . . . . . . . . . . . . . . . . . . . . . . . . . . . . . . . . . . . . . . . $1,438 $1,968 $1,815
Depreciation and amortization expense:Stores . . . . . . . . . . . . . . . . . . . . . . . . . . . . . . . . . . . . . . . . . . . . . . . . . . . . . . . . . . . . . . . . . . . . . $ 533 $ 584 $ 589
Direct . . . . . . . . . . . . . . . . . . . . . . . . . . . . . . . . . . . . . . . . . . . . . . . . . . . . . . . . . . . . . . . . . . . . . 59 64 66
Depreciation and amortization expense . . . . . . . . . . . . . . . . . . . . . . . . . . . . . . . . . . . . . . $ 592 $ 648 $ 655
Purchases of property and equipment:Stores . . . . . . . . . . . . . . . . . . . . . . . . . . . . . . . . . . . . . . . . . . . . . . . . . . . . . . . . . . . . . . . . . . . . . $ 362 $ 391 $ 228
Direct . . . . . . . . . . . . . . . . . . . . . . . . . . . . . . . . . . . . . . . . . . . . . . . . . . . . . . . . . . . . . . . . . . . . . 70 55 42
Unallocated . . . . . . . . . . . . . . . . . . . . . . . . . . . . . . . . . . . . . . . . . . . . . . . . . . . . . . . . . . . . . . . . 116 111 64
Purchases of property and equipment . . . . . . . . . . . . . . . . . . . . . . . . . . . . . . . . . . . . . . . . $ 548 $ 557 $ 334
($ in millions)January 28,
2012January 29,
2011
Segment assets:Stores . . . . . . . . . . . . . . . . . . . . . . . . . . . . . . . . . . . . . . . . . . . . . . . . . . . . . . . . . . . . . . . . . . . . . . . . . . $3,315 $3,264
Direct . . . . . . . . . . . . . . . . . . . . . . . . . . . . . . . . . . . . . . . . . . . . . . . . . . . . . . . . . . . . . . . . . . . . . . . . . . 591 545
Unallocated . . . . . . . . . . . . . . . . . . . . . . . . . . . . . . . . . . . . . . . . . . . . . . . . . . . . . . . . . . . . . . . . . . . . 3,516 3,256
Total assets . . . . . . . . . . . . . . . . . . . . . . . . . . . . . . . . . . . . . . . . . . . . . . . . . . . . . . . . . . . . . . . . . . . . . $7,422 $7,065
71

Long-lived assets by geographic location are as follows:
($ in millions)January 28,
2012January 29,
2011
U.S. (1) . . . . . . . . . . . . . . . . . . . . . . . . . . . . . . . . . . . . . . . . . . . . . . . . . . . . . . . . . . . . . . . . . . . . . . . . . . . . . . $2,245 $2,312
Canada . . . . . . . . . . . . . . . . . . . . . . . . . . . . . . . . . . . . . . . . . . . . . . . . . . . . . . . . . . . . . . . . . . . . . . . . . . . . . 191 178
Total North America . . . . . . . . . . . . . . . . . . . . . . . . . . . . . . . . . . . . . . . . . . . . . . . . . . . . . . . . . . . . . . . . . 2,436 2,490
Other foreign . . . . . . . . . . . . . . . . . . . . . . . . . . . . . . . . . . . . . . . . . . . . . . . . . . . . . . . . . . . . . . . . . . . . . . . 462 418
Total long-lived assets . . . . . . . . . . . . . . . . . . . . . . . . . . . . . . . . . . . . . . . . . . . . . . . . . . . . . . . . . . . . . . . $2,898 $2,908
(1) U.S. includes the United States and Puerto Rico.
Net sales by region are allocated based on the location in which the sale was originated. Store sales are allocatedbased on the location of the store, and online sales are allocated based on the location of the distribution centerfrom which the products were shipped. Net sales by geographic location are as follows:
Fiscal Year($ in millions) 2011 2010 2009
U.S. (1) . . . . . . . . . . . . . . . . . . . . . . . . . . . . . . . . . . . . . . . . . . . . . . . . . . . . . . . . . . . . . . . . . . . . . . $11,368 $11,740 $11,609
Canada . . . . . . . . . . . . . . . . . . . . . . . . . . . . . . . . . . . . . . . . . . . . . . . . . . . . . . . . . . . . . . . . . . . . . 1,007 988 860
Total North America . . . . . . . . . . . . . . . . . . . . . . . . . . . . . . . . . . . . . . . . . . . . . . . . . . . . . . . . . 12,375 12,728 12,469
Other foreign . . . . . . . . . . . . . . . . . . . . . . . . . . . . . . . . . . . . . . . . . . . . . . . . . . . . . . . . . . . . . . . 2,174 1,936 1,728
Total net sales . . . . . . . . . . . . . . . . . . . . . . . . . . . . . . . . . . . . . . . . . . . . . . . . . . . . . . . . . . . . . . $14,549 $14,664 $14,197
(1) U.S. includes the United States and Puerto Rico.
Note 16. Quarterly Information (Unaudited)
Selected quarterly and annual operating results are as follows:13 Weeks Ended 52 Weeks Ended
($ in millions except per share amounts)April 30,
2011July 30,
2011October 29,
2011January 28,
2012January 28, 2012
(fiscal 2011)
Net sales . . . . . . . . . . . . . . . . . . . . . . . . . . . . . . . . . . . . . . . . . . . $3,295 $3,386 $3,585 $4,283 $14,549
Gross profit . . . . . . . . . . . . . . . . . . . . . . . . . . . . . . . . . . . . . . . . . $1,304 $1,251 $1,314 $1,405 $ 5,274
Net income . . . . . . . . . . . . . . . . . . . . . . . . . . . . . . . . . . . . . . . . . $ 233 $ 189 $ 193 $ 218 $ 833
Earnings per share—basic (1) . . . . . . . . . . . . . . . . . . . . . . . . . $ 0.40 $ 0.35 $ 0.38 $ 0.45 $ 1.57
Earnings per share—diluted (1) . . . . . . . . . . . . . . . . . . . . . . . . $ 0.40 $ 0.35 $ 0.38 $ 0.44 $ 1.56
13 Weeks Ended 52 Weeks Ended
($ in millions except per share amounts)May 1,2010
July 31,2010
October 30,2010
January 29,2011
January 29, 2011(fiscal 2010)
Net sales . . . . . . . . . . . . . . . . . . . . . . . . . . . . . . . . . . . . . . . . . . . $3,329 $3,317 $3,654 $4,364 $14,664
Gross profit . . . . . . . . . . . . . . . . . . . . . . . . . . . . . . . . . . . . . . . . . $1,401 $1,314 $1,505 $1,669 $ 5,889
Net income . . . . . . . . . . . . . . . . . . . . . . . . . . . . . . . . . . . . . . . . . $ 302 $ 234 $ 303 $ 365 $ 1,204
Earnings per share—basic (1) . . . . . . . . . . . . . . . . . . . . . . . . . $ 0.45 $ 0.36 $ 0.49 $ 0.60 $ 1.89
Earnings per share—diluted (1) . . . . . . . . . . . . . . . . . . . . . . . . $ 0.45 $ 0.36 $ 0.48 $ 0.60 $ 1.88
(1) Earnings per share were computed individually for each of the periods presented; therefore, the sum of the earnings per share amountsfor the quarters may not equal the total for the year.
72 Gap Inc. Form 10-K
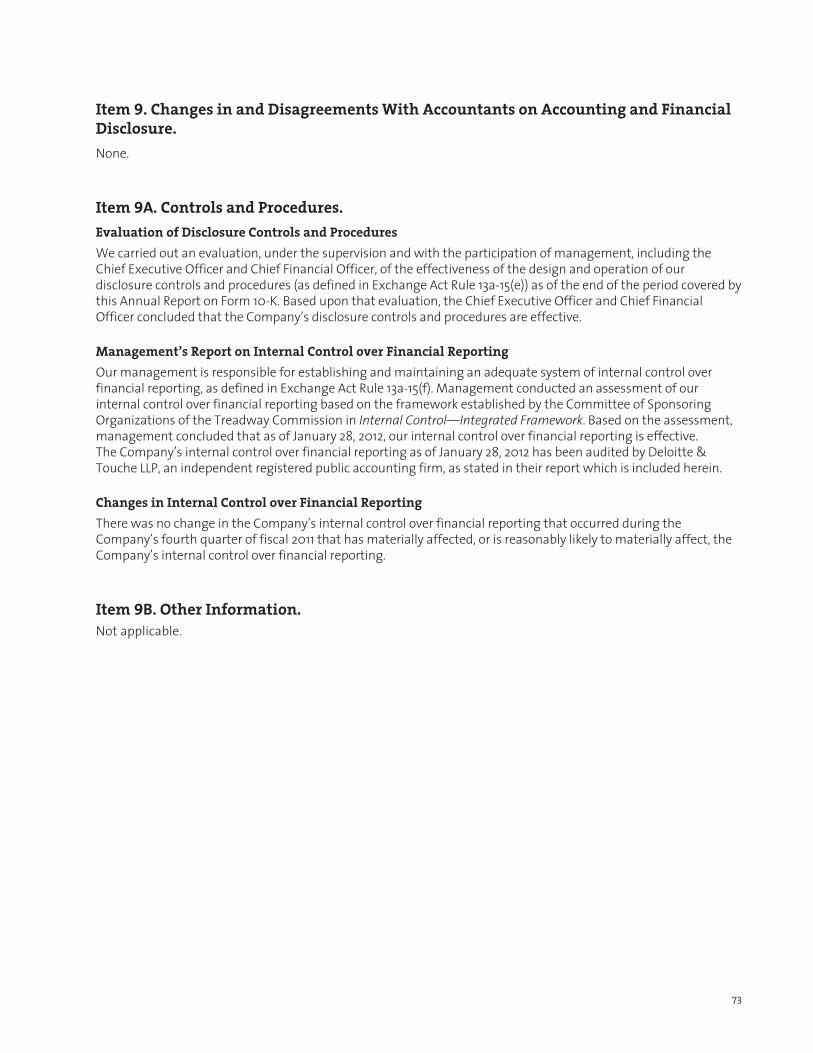
Item 9. Changes in and Disagreements With Accountants on Accounting and FinancialDisclosure.None.
Item 9A. Controls and Procedures.Evaluation of Disclosure Controls and ProceduresWe carried out an evaluation, under the supervision and with the participation of management, including theChief Executive Officer and Chief Financial Officer, of the effectiveness of the design and operation of ourdisclosure controls and procedures (as defined in Exchange Act Rule 13a-15(e)) as of the end of the period covered bythis Annual Report on Form 10-K. Based upon that evaluation, the Chief Executive Officer and Chief FinancialOfficer concluded that the Company’s disclosure controls and procedures are effective.
Management’s Report on Internal Control over Financial ReportingOur management is responsible for establishing and maintaining an adequate system of internal control overfinancial reporting, as defined in Exchange Act Rule 13a-15(f). Management conducted an assessment of ourinternal control over financial reporting based on the framework established by the Committee of SponsoringOrganizations of the Treadway Commission in Internal Control—Integrated Framework. Based on the assessment,management concluded that as of January 28, 2012, our internal control over financial reporting is effective.The Company’s internal control over financial reporting as of January 28, 2012 has been audited by Deloitte &Touche LLP, an independent registered public accounting firm, as stated in their report which is included herein.
Changes in Internal Control over Financial ReportingThere was no change in the Company’s internal control over financial reporting that occurred during theCompany’s fourth quarter of fiscal 2011 that has materially affected, or is reasonably likely to materially affect, theCompany’s internal control over financial reporting.
Item 9B. Other Information.Not applicable.
73
Part IIIItem 10. Directors, Executive Officers and Corporate Governance.The information required by this item is incorporated herein by reference to the sections entitled “Nominees forElection as Directors,” “Corporate Governance—Audit and Finance Committee,” and “Section 16(a) BeneficialOwnership Reporting Compliance” in the 2012 Proxy Statement. See also Part I, Item 1 in the section entitled“Executive Officers of the Registrant.”
The Company has adopted a code of ethics, our Code of Business Conduct, which applies to all employees includingour principal executive officer, principal financial officer, controller, and persons performing similar functions. OurCode of Business Conduct is available on our website, gapinc.com, under “Investors, Corporate Compliance, Code ofBusiness Conduct.” Any amendments and waivers to the code will also be available on the website.
Item 11. Executive Compensation.The information required by this item is incorporated herein by reference to the sections entitled “Compensationof Directors,” “Corporate Governance—Compensation and Management Development Committee,” and“Executive Compensation and Related Information” in the 2012 Proxy Statement.
Item 12. Security Ownership of Certain Beneficial Owners and Management and RelatedStockholder Matters.The information required by this item is incorporated herein by reference to the sections entitled “ExecutiveCompensation and Related Information—Equity Compensation Plan Information” and “Beneficial Ownership ofShares” in the 2012 Proxy Statement.
Item 13. Certain Relationships and Related Transactions, and Director Independence.The information required by this item is incorporated herein by reference to the sections entitled “OtherInformation” and “Corporate Governance—Director Independence” in the 2012 Proxy Statement.
Item 14. Principal Accounting Fees and Services.The information required by this item is incorporated herein by reference to the section entitled “PrincipalAccounting Firm Fees” in the 2012 Proxy Statement.
74 Gap Inc. Form 10-K

Part IVItem 15. Exhibits, Financial Statement Schedules.1. Financial Statements: See “Index to Consolidated Financial Statements” in Part II, Item 8 of this Form 10-K.
2. Financial Statement Schedules: Schedules are included in the Consolidated Financial Statements or notes ofthis Form 10-K or are not required.
3. Exhibits: The exhibits listed in the accompanying index to exhibits are filed or incorporated by reference aspart of this Form 10-K.
75
SIGNATURES
Pursuant to the requirements of Section 13 or 15(d) of the Securities Exchange Act of 1934, the registrant has dulycaused this report to be signed on its behalf by the undersigned, thereunto duly authorized.
THE GAP, INC.
Date: March 26, 2012 By /s/ GLENN K. MURPHYGlenn K. Murphy
Chairman and Chief Executive Officer(Principal Executive Officer)
Date: March 26, 2012 By /s/ SABRINA L. SIMMONSSabrina L. Simmons
Executive Vice President and Chief Financial Officer(Principal Financial and Accounting Officer)
Pursuant to the requirements of the Securities Exchange Act of 1934, this report has been signed below by thefollowing persons on behalf of the registrant and in the capacities and on the dates indicated.
Date: March 26, 2012 By /s/ ADRIAN D. P. BELLAMYAdrian D. P. Bellamy, Director
Date: March 26, 2012 By /s/ DOMENICO DE SOLEDomenico De Sole, Director
Date: March 26, 2012 By /s/ ROBERT J. FISHERRobert J. Fisher, Director
Date: March 26, 2012 By /s/ WILLIAM S. FISHERWilliam S. Fisher, Director
Date: March 26, 2012 By /s/ ISABELLA D. GORENIsabella D. Goren, Director
Date: March 26, 2012 By /s/ BOB L. MARTINBob L. Martin, Director
Date: March 26, 2012 By /s/ JORGE P. MONTOYAJorge P. Montoya, Director
Date: March 26, 2012 By /s/ GLENN K. MURPHYGlenn K. Murphy, Director
Date: March 26, 2012 By /s/ MAYO A. SHATTUCK IIIMayo A. Shattuck III, Director
Date: March 26, 2012 By /s/ KATHERINE TSANGKatherine Tsang, Director
Date: March 26, 2012 By /s/ KNEELAND C. YOUNGBLOODKneeland C. Youngblood, Director
76 Gap Inc. Form 10-K

Exhibit Index1.1 Underwriting Agreement, dated April 7, 2011 in connection with the offering of $1,250,000,000 aggregate
principal amount of Registrant’s 5.95% Notes due 2021, filed as Exhibit 1.1 to Registrant’s Form 8-K onApril 12, 2011, Commission File No. 1-7562.
3.1 Registrant’s Amended and Restated Certificate of Incorporation, filed as Exhibit 3.1 to Registrant’s AnnualReport on Form 10-K for the year ended January 30, 1993, Commission File No. 1-7562.
3.2 Certificate of Amendment of Amended and Restated Certificate of Incorporation, filed as Exhibit 3.2 toRegistrant’s Annual Report on Form 10-K for year ended January 29, 2000, Commission File No. 1-7562.
3.3 Amended and Restated Bylaws of the Company (effective February 17, 2011), filed as Exhibit 3(ii) toRegistrant’s Form 8-K on February 18, 2011, Commission File No. 1-7562.
4.1 Indenture, dated September 1, 1997, between Registrant and Harris Trust Company of California, filed asExhibit 4 to Registrant’s Form 10-Q for the quarter ended November 1, 1997, Commission File No. 1-7562.
4.2 Indenture, dated November 21, 2001, between Registrant and The Bank of New York, filed as Exhibit 4.2 toRegistrant’s Annual Report on Form 10-K for the year ended February 2, 2002, Commission File No. 1-7562.
4.3 Indenture, dated as of April 12, 2011, by and between Registrant and Wells Fargo Bank, NationalAssociation, as Trustee, filed as Exhibit 4.1 to Registrant’s Form 8-K on April 12, 2011, Commission File No. 1-7562.
4.4 First Supplemental Indenture, dated as of April 12, 2011, relating to the issuance of $1,250,000,000aggregate principal amount of Registrant’s 5.95% Notes due 2021, filed as Exhibit 4.2 to Registrant’s Form8-K on April 12, 2011, Commission File No. 1-7562.
4.5 Form of Registrant’s 5.95% Notes due 2021, included as Exhibit A to First Supplemental Indenture, filed asExhibit 4.2 to Registrant’s Form 8-K on April 12, 2011, Commission File No. 1-7562.
10.1 3-Year LC Agreement dated as of May 6, 2005 among The Gap, Inc., LC Subsidiaries, and HSBC Bank USA,National Association (formerly HSBC Bank USA), as LC Issuer, filed as Exhibit 10.2 to the Registrant’sForm 10-Q for the quarter ended May 1, 2010, Commission File No. 1-7562.
10.2 Letter Amendment No. 1 to the 3-Year Letter of Credit Agreement with HSBC Bank USA, NationalAssociation dated May 18, 2007, filed as Exhibit 10.3 to Registrant’s Form 8-K on May 24, 2007,Commission File No. 1-7562.
10.3 Letter Amendment No. 2 to the 3-Year Letter of Credit Agreement with HSBC Bank USA, NationalAssociation dated September 21, 2010, filed as Exhibit 10.1 to Registrant’s Form 10-Q for the quarter endedOctober 30, 2010, Commission File No. 1-7562.
10.4 Letter Agreement dated April 1, 2008 regarding the 3-Year Letter of Credit Agreement with HSBC BankUSA, National Association, filed as Exhibit 10.8 to Registrant’s Form 10-Q for the quarter ended May 3,2008, Commission File No. 1-7562.
10.5 3-Year LC Agreement dated as of May 6, 2005 among The Gap, Inc., LC Subsidiaries, and Citibank, N.A., asLC Issuer, filed as Exhibit 10.3 to the Registrant’s Form 10-Q for the quarter ended May 1, 2010, CommissionFile No. 1-7562.
10.6 Letter Amendment No. 1 to the 3-Year Letter of Credit Agreement with Citibank, N.A. dated May 18, 2007,filed as Exhibit 10.2 to Registrant’s Form 8-K on May 24, 2007, Commission File No. 1-7562.
10.7 Letter Agreement dated April 1, 2008 regarding the 3-Year Letter of Credit Agreement with CiticorpUSA Inc., filed as Exhibit 10.7 to Registrant’s Form 10-Q for the quarter ended May 3, 2008, CommissionFile No. 1-7562.
10.8 Letter Agreement dated September 21, 2010 terminating the 3-Year Letter of Credit Agreement withCiticorp USA Inc., filed as Exhibit 10.2 to Registrant’s Form 10-Q for the quarter ended October 30, 2010,Commission File No. 1-7562.
77
10.9 Term Loan and Revolving Credit Agreement dated April 7, 2011, filed as Exhibit 10.1 to Registrant’s Form 8-K on April 7, 2011, Commission File No. 1-7562. (1)
10.10 Amendment No. 1 to Term Loan and Revolving Credit Agreement dated April 25, 2011, filed as Exhibit 10.4to Registrant’s Form 10-Q for the quarter ended April 30, 2011, Commission File No. 1-7562. (1)
10.11 First Amended and Restated Master Services Agreement between Registrant and IBM, dated as ofMarch 2, 2009, filed as Exhibit 10.1 to Registrant’s Form 10-Q for the quarter ended May 2, 2009,Commission File No. 1-7562. (1)
EXECUTIVE COMPENSATION PLANS AND ARRANGEMENTS10.12 Executive Management Incentive Compensation Award Plan, filed as Appendix A to Registrant’s
definitive proxy statement for its annual meeting of stockholders held on May 18, 2010, CommissionFile No. 1-7562.
10.13 The Gap, Inc. Executive Deferred Compensation Plan, filed as Exhibit 10.3 to Registrant’s Form 10-Q forthe quarter ended October 31, 1998, Commission File No.1-7562.
10.14 Amendment to Executive Deferred Compensation Plan – Freezing of Plan Effective December 31, 2005,filed as Exhibit 10.1 to Registrant’s Form 8-K on November 8, 2005, Commission File No. 1-7562.
10.15 Amendment to Executive Deferred Compensation Plan – Merging of Plan into the SupplementalDeferred Compensation Plan, filed as Exhibit 10.29 to Registrant’s Form 10-K for the year endedJanuary 31, 2009, Commission File No. 1-7562.
10.16 Amendment to Executive Deferred Compensation Plan – Suspension of Pending Merger intoSupplemental Deferred Compensation Plan, filed as Exhibit 10.30 to Registrant’s Form 10-K for the yearended January 31, 2009, Commission File No. 1-7562.
10.17 Amendment to Executive Deferred Compensation Plan – Merging of Plan into the DeferredCompensation Plan, filed as Exhibit 10.1 to Registrant’s Form 10-Q for the quarter ended October 31,2009, Commission File No. 1-7562.
10.18 Deferred Compensation Plan, amended and restated effective September 1, 2011, filed as Exhibit 10.1 toRegistrant’s Form 10-Q for the quarter ended October 29, 2011, Commission File No. 1-7562.
10.19 Supplemental Deferred Compensation Plan, filed as Exhibit 4.1 to the Company’s Registration Statementon Form S-8, dated November 29, 2005, Commission File No. 333-129986.
10.20 First Amendment to Supplemental Deferred Compensation Plan, filed as Exhibit 10.32 to Registrant’sForm 10-K for the year ended January 31, 2009, Commission File No. 1-7562.
10.21 Second Amendment to Supplemental Deferred Compensation Plan – Merging of Executive DeferredCompensation Plan into the Plan and Name Change to Deferred Compensation Plan, filed asExhibit 10.33 to Registrant’s Form 10-K for the year ended January 31, 2009, Commission File No. 1-7562.
10.22 Third Amendment to Supplemental Deferred Compensation Plan – Suspension of Pending Merging ofExecutive Deferred Compensation Plan into the Plan and Name Change to Deferred Compensation Plan,filed as Exhibit 10.34 to Registrant’s Form 10-K for the year ended January 31, 2009, Commission FileNo. 1-7562.
10.23 Fourth Amendment to Supplemental Deferred Compensation Plan – Merging of Executive DeferredCompensation Plan into the Plan and Name Change to Deferred Compensation Plan, filed as Exhibit 10.2to Registrant’s Form 10-Q for the quarter ended October 31, 2009, Commission File No. 1-7562.
10.24 1981 Stock Option Plan, filed as Exhibit 4.1 to Registrant’s Registration Statement on Form S-8,Commission File No. 33-54690.
10.25 Management Incentive Restricted Stock Plan II, filed as Exhibit 4.1 to Registrant’s Registration Statementon Form S-8, Commission File No. 33-54686.
10.26 1996 Stock Option and Award Plan, filed as Exhibit A to Registrant’s definitive proxy statement for itsannual meeting of stockholders held on May 21, 1996, Commission File No. 1-7562.
10.27 Amendment Number 1 to Registrant’s 1996 Stock Option and Award Plan, filed as Exhibit 10.1 toRegistrant’s Form 10-Q for the quarter ended August 2, 1997, Commission File No. 1-7562.
10.28 Amendment Number 2 to Registrant’s 1996 Stock Option and Award Plan, filed as Exhibit 10.15 toRegistrant’s Form 10-K for the year ended January 31, 1998, Commission File No. 1-7562.
78 Gap Inc. Form 10-K
10.29 Amendment Number 3 to Registrant’s 1996 Stock Option and Award Plan, filed as Exhibit 10.1 toRegistrant’s Form 10-Q for the quarter ended October 31, 1998, Commission File No. 1-7562.
10.30 Amendment Number 4 to Registrant’s 1996 Stock Option and Award Plan, filed as Exhibit 10.3 toRegistrant’s Form 10-Q for the quarter ended July 29, 2000, Commission File No. 1-7562.
10.31 Amendment Number 5 to Registrant’s 1996 Stock Option and Award Plan, filed as Exhibit 10.13 toRegistrant’s Form 10-K for the year ended February 3, 2001, Commission File No. 1-7562.
10.32 Amendment Number 6 to Registrant’s 1996 Stock Option and Award Plan, filed as Exhibit 10.1 toRegistrant’s Form 10-Q for the quarter ended May 5, 2001, Commission File No. 1-7562.
10.33 1996 Stock Option and Award Plan (As Amended and Restated Effective as of January 28, 2003), filed asAppendix C to Registrant’s definitive proxy statement for its annual meeting of stockholders held onMay 14, 2003, Commission File No. 1-7562.
10.34 Form of Nonqualified Stock Option Agreement for employees under Registrant’s 1996 Stock Option andAward Plan, filed as Exhibit 10.5 to Registrant’s Form 10-Q for the quarter ended August 2, 1997,Commission File No. 1-7562.
10.35 Form of Nonqualified Stock Option Agreement for directors under Registrant’s 1996 Stock Option andAward Plan, filed as Exhibit 10.6 to Registrant’s Form 10-Q for the quarter ended August 2, 1997,Commission File No. 1-7562.
10.36 Form of Nonqualified Stock Option Agreement for consultants under Registrant’s 1996 Stock Option andAward Plan, filed as Exhibit 10.4 to Registrant’s Form 10-Q for the quarter ended October 31, 1998,Commission File No. 1-7562.
10.37 Form of Nonqualified Stock Option Agreement for employees in France under Registrant’s 1996 StockOption and Award Plan, filed as Exhibit 10.5 to Registrant’s Form 10-Q for the quarter endedOctober 31, 1998, Commission File No. 1-7562.
10.38 Form of Nonqualified Stock Option Agreement for international employees under Registrant’s 1996Stock Option and Award Plan, filed as Exhibit 10.6 to Registrant’s Form 10-Q for the quarter endedOctober 31, 1998, Commission File No. 1-7562.
10.39 Form of Nonqualified Stock Option Agreement for employees in Japan under Registrant’s 1996 StockOption and Award Plan, filed as Exhibit 10.7 to Registrant’s Form 10-Q for the quarter endedOctober 31, 1998, Commission File No. 1-7562.
10.40 Form of Stock Option Agreement for employees under the UK Sub-plan to the U.S. Stock Option andAward Plan, filed as Exhibit 10.8 to Registrant’s Form 10-Q for the quarter ended October 31, 1998,Commission File No. 1-7562.
10.41 Form of Nonqualified Stock Option Agreement for directors effective April 3, 2001 under Registrant’s1996 Stock Option and Award Plan, filed as Exhibit 10.4 to Registrant’s Form 10-Q for the quarter endedMay 5, 2001, Commission File No. 1-7562.
10.42 Form of Nonqualified Stock Option Agreement under Registrant’s 1996 Stock Option and Award Plan,filed as Exhibit 10.3 to Registrant’s Form 10-Q for the quarter ended November 3, 2001, CommissionFile No. 1-7562.
10.43 Form of Stock Award Agreement under Registrant’s 1996 Stock Option and Award Plan filed asExhibit 10.2 to Registrant’s Form 8-K on January 27, 2005, Commission File No. 1-7562.
10.44 Form of Stock Award Agreement under Registrant’s 1996 Stock Option and Award Plan, filed asExhibit 10.2 to Registrant’s Form 8-K on March 16, 2005, Commission File No. 1-7562.
10.45 Form of Stock Award Agreement under Registrant’s 1996 Stock Option and Award Plan, filed as Exhibit 10.4to Registrant’s Form 10-Q for the quarter ended October 29, 2005, Commission File No. 1-7562.
79

10.46 UK Employee Stock Purchase Plan, filed as Exhibit 4.1 to Registrant’s Registration Statement on Form S-8,Commission File No. 333-47508.
10.47 2002 Stock Option Plan, as amended, (formerly the 1999 Stock Option Plan as amended and Stock Up OnSuccess, The Gap, Inc.’s Stock Option Bonus Program) filed as Exhibit 4.1 to Registrant’s RegistrationStatement on Form S-8, Commission File No. 333-103128.
10.48 Form of Nonqualified Stock Option Agreement under Registrant’s 2002 Stock Option Plan (formerly the1999 Stock Option Plan as amended), filed as Exhibit 4.6 to Registrant’s Registration Statement onForm S-8, Commission File No. 333-76523.
10.49 Form of Domestic Nonqualified Stock Option Agreement under Registrant’s 2002 Stock Option Plan, asamended, filed as Exhibit 4.6 to Registrant’s Registration Statement on Form S-8, CommissionFile No. 333-72921.
10.50 Form of International Nonqualified Stock Option Agreement under Registrant’s 2002 Stock Option Plan,as amended, filed as Exhibit 4.7 to Registrant’s Registration Statement on Form S-8, CommissionFile No. 333-72921.
10.51 Non-Employee Director Retirement Plan, dated October 27, 1992, filed as Exhibit 10.43 to Registrant’sAnnual Report on Form 10-K for the year ended January 30, 1993, Commission File No. 1-7562.
10.52 Amendment, authorized as of August 20, 2008, to Nonemployee Director Retirement Plan, datedOctober 27, 1992, filed as Exhibit 10.2 to Registrant’s Form 10-Q for the quarter ended November 1, 2008,Commission File No. 1-7562.
10.53 Statement Regarding Non-Employee Director Retirement Plan, filed as Exhibit 10.25 to Registrant’sForm 10-K for the year ended January 31, 1998, Commission File No. 1-7562.
10.54 Nonemployee Director Deferred Compensation Plan, filed as Exhibit 4.1 to Registrant’s RegistrationStatement on Form S-8, Commission File No. 333-36265.
10.55 Amendment Number 1 to Registrant’s Nonemployee Director Deferred Compensation Plan, filed asExhibit 10.2 to Registrant’s Form 10-Q for the quarter ended October 31, 1998, Commission File No. 1-7562.
10.56 Amendment Number 2 to Registrant’s Nonemployee Director Deferred Compensation Plan, filed asExhibit 10.4 to Registrant’s Form 10-Q for the quarter ended July 29, 2000, Commission File No. 1-7562.
10.57 Amendment Number 3 to Registrant’s Nonemployee Director Deferred Compensation Plan, filed asExhibit 10.2 to Registrant’s Form 10-Q for the quarter ended May 5, 2001, Commission File No. 1-7562.
10.58 Nonemployee Director Deferred Compensation Plan, as amended and restated on October 30, 2001,filed as Exhibit 10.1 to Registrant’s Form 10-Q for the quarter ended November 3, 2001, CommissionFile No. 1-7562.
10.59 Nonemployee Director Deferred Compensation Plan, as amended and restated on December 9, 2003, filedas Exhibit 10.35 to Registrant’s Form 10-K for the year ended January 31, 2004, Commission File No. 1-7562.
10.60 Form of Discounted Stock Option Agreement under the Nonemployee Director Deferred CompensationPlan, filed as Exhibit 4.5 to Registrant’s Registration Statement on Form S-8, Commission File No. 333-36265.
10.61 Form of Nonqualified Stock Option Agreement for directors effective April 3, 2001 under Registrant’sNonemployee Director Deferred Compensation Plan, filed as Exhibit 10.5 to Registrant’s Form 10-Q forthe quarter ended May 5, 2001, Commission File No. 1-7562.
10.62 Nonemployee Director Deferred Compensation Plan – Suspension of Plan Effective January 6, 2005,filed as Exhibit 10.1 to Registrant’s Form 8-K on January 7, 2005, Commission File No. 1-7562.
10.63 Nonemployee Director Deferred Compensation Plan – Termination of Plan Effective September 27, 2005,filed as Exhibit 10.1 to Registrant’s Form 8-K on September 28, 2005, Commission File No. 1-7562.
80 Gap Inc. Form 10-K

10.64 2006 Long-Term Incentive Plan, filed as Appendix B to Registrant’s definitive proxy statement for itsannual meeting of stockholders held on May 9, 2006, Commission File No. 1-7562.
10.65 2006 Long-Term Incentive Plan, as amended and restated effective August 20, 2008, filed as Exhibit 10.1to Registrant’s Form 10-Q for the quarter ended November 1, 2008, Commission File No. 1-7562.
10.66 Amendment No. 1 to Registrant’s 2006 Long-Term Incentive Plan, filed as Exhibit 10.62 to Registrant’sForm 10-K for the year ended February 3, 2007, Commission File No. 1-7562.
10.67 2011 Long-Term Incentive Plan, filed as Appendix A to Registrant’s definitive proxy statement for itsannual meeting of stockholders held on May 17, 2011, Commission File No. 1-7562.
10.68 Form of Non-qualified Stock Option Agreement for Executives under the 2006 Long-Term Incentive Plan,filed as Exhibit 10.1 to Registrant’s Form 8-K on March 23, 2006, Commission File No. 1-7562.
10.69 Form of Non-Qualified Stock Option Agreement under the 2011 Long-Term Incentive Plan, filed as Exhibit10.8 to Registrant’s Form 10-Q for the quarter ended April 30, 2011, Commission File No. 1-7562.
10.70 Form of Stock Award Agreement for Executives under the 2006 Long-Term Incentive Plan, filed as Exhibit10.2 to Registrant’s Form 8-K on March 23, 2006, Commission File No. 1-7562.
10.71 Form of Nonqualified Stock Option Agreement for Chief Executive Officer under the 2006 Long-TermIncentive Plan, filed as Exhibit 10.3 to Registrant’s Form 8-K on March 23, 2006, Commission File No. 1-7562.
10.72 Form of Stock Award Agreement for Chief Executive Officer under the 2006 Long-Term Incentive Plan,filed as Exhibit 10.4 to Registrant’s Form 8-K on March 23, 2006, Commission File No. 1-7562.
10.73 Form of Stock Unit Agreement and Stock Unit Deferral Election Form for Nonemployee Directors underthe 2006 Long-Term Incentive Plan, filed as Exhibit 10.5 to Registrant’s Form 8-K on March 23, 2006,Commission File No. 1-7562.
10.74 Form of Stock Unit Agreement and Stock Unit Deferral Election Form for Nonemployee Directors underthe 2006 Long-Term Incentive Plan, filed as Exhibit 10.2 to Registrant’s Form 10-Q for the quarter endedJuly 29, 2006, Commission File No. 1-7562.
10.75 Form of Performance Share Agreement for Executives under the 2006 Long-Term Incentive Plan, filed asExhibit 10.2 to Registrant’s Form 8-K on July 26, 2007, Commission File No. 1-7562.
10.76 Form of Performance Share Agreement under the 2011 Long-Term Incentive Plan, filed as Exhibit 10.9 toRegistrant’s Form 10-Q for the quarter ended April 30, 2011, Commission File No. 1-7562.
10.77 Form of Restricted Stock Unit Award Agreement under the 2006 Long-Term Incentive Plan, filed as Exhibit10.1 to Registrant’s Form 10-Q for the quarter ended November 3, 2007, Commission File No. 1-7562.
10.78 Form of Restricted Stock Unit Award Agreement under the 2011 Long-Term Incentive Plan, filed as Exhibit10.7 to Registrant’s Form 10-Q for the quarter ended April 30, 2011, Commission File No. 1-7562.
10.79 Form of Performance Unit Award Agreement under the 2006 Long-Term Incentive Plan, filed as Exhibit 10.2to Registrant’s Form 10-Q for the quarter ended November 3, 2007, Commission File No. 1-7562.
10.80 Form of Performance Share Agreement under the 2006 Long-Term Incentive Plan, filed as Exhibit 10.3 toRegistrant’s Form 10-Q for the quarter ended November 3, 2007, Commission File No. 1-7562.
10.81 Form of Performance Share Agreement under the 2006 Long-Term Incentive Plan, filed as Exhibit 10.5 toRegistrant’s Form 10-Q for the quarter ended May 1, 2010, Commission File No. 1-7562
10.82 Form of Performance Share Agreement under the 2006 Long-Term Incentive Plan, filed as Exhibit 10.1 toRegistrant’s Form 8-K on March 11, 2011, Commission File No. 1-7562.
10.83 Form of Director Stock Unit Agreement and Stock Unit Deferral Election Form under the 2006 Long-TermIncentive Plan, filed as Exhibit 10.4 to Registrant’s Form 10-Q for the quarter ended November 3, 2007,Commission File No. 1-7562.
81

10.84 Form of Director Stock Unit Agreement and Stock Unit Deferral Election Form under the 2011 Long-Term Incentive Plan, filed as Exhibit 10.10 to Registrant’s Form 10-Q for the quarter ended April 30, 2011,Commission File No. 1-7562.
10.85 Summary of Revised Timing of Annual Board Member Stock Unit Grants, effective August 20, 2008,filed as Exhibit 10.3 to Registrant’s Form 10-Q for the quarter ended November 1, 2008, CommissionFile No. 1-7562.
10.86 Agreement with Marka Hansen dated February 16, 2007, and confirmed on February 20, 2007, filed asExhibit 10.2 to Registrant’s Form 10-Q for the quarter ended May 5, 2007, Commission File No. 1-7562.
10.87 Amendment to Agreement with Marka Hansen dated November 23, 2008, and confirmed onDecember 15, 2008, filed as Exhibit 10.94 to Registrant’s Form 10-K for the year ended January 31, 2009,Commission File No. 1-7562.
10.88 Release signed by Marka Hansen dated February 1, 2011, filed as Exhibit 10.1 to Registrant’s Form 10-Qfor the quarter ended April 30, 2011, Commission File No. 1-7562.
10.89 Agreement with Art Peck dated August 21, 2008, and confirmed on September 2, 2008, filed asExhibit 10.3 to Registrant’s Form 10-Q for the quarter ended May 2, 2009, Commission File No, 1-7562.
10.90 Agreement with Art Peck dated January 31, 2011, filed as Exhibit 10.2 to Registrant’s Form 10-Q for thequarter ended April 30, 2011, Commission File No, 1-7562.
10.91* Amendment to Agreement with Art Peck dated November 4, 2011, and confirmed on November 15, 2011.
10.92 Agreement with Eva Sage-Gavin dated March 16, 2007, and confirmed on March 27, 2007, filed asExhibit 10.6 to Registrant’s Form 10-Q for the quarter ended May 5, 2007, Commission File No. 1-7562.
10.93 Amendment to Agreement with Eva Sage-Gavin dated November 23, 2008, and confirmed onNovember 10, 2008, filed as Exhibit 10.101 to Registrant’s Form 10-K for the year ended January 31, 2009,Commission File No. 1-7562.
10.94* Amendment to Agreement with Eva Sage-Gavin dated November 4, 2011, and confirmed on January 3,2012.
10.95 Amended and Restated Employment Agreement by and between Glenn Murphy and the Company,dated December 1, 2008 and confirmed on December 1, 2008, filed as Exhibit 10.106 to Registrant’sForm 10-K for the year ended January 31, 2009, Commission File No. 1-7562.
10.96 Modification to Amended and Restated Employment Agreement by and between Glenn Murphy andthe Company dated February 9, 2009, filed as Exhibit 10.2 to Registrant’s Form 10-Q for the quarterended May 2, 2009, Commission File No. 1-7562.
10.97 Agreement with Sabrina L. Simmons dated February 4, 2008, and confirmed on February 6, 2008, filedas Exhibit 10.1 to Registrant’s Form 8-K on February 12, 2008, Commission File No. 1-7562.
10.98 Amendment to Agreement with Sabrina Simmons dated November 23, 2008, and confirmed onDecember 22, 2008, filed as Exhibit 10.110 to Registrant’s Form 10-K for the year ended January 31, 2009,Commission File No. 1-7562.
10.99* Amendment to Agreement with Sabrina L. Simmons dated November 4, 2011, and confirmed onJanuary 5, 2012.
10.100 Agreement with Tom Wyatt dated August 21, 2008, and confirmed on September 25, 2008, filed asExhibit 10.4 to Registrant’s Form 10-Q for the quarter ended May 2, 2009, Commission File No. 1-7562.
10.101 Amendment to Agreement with Tom Wyatt dated November 23, 2008, and confirmed on December 9,2008, filed as Exhibit 10.112 to Registrant’s Form 10-K for the year ended January 31, 2009, CommissionFile No. 1-7562.
10.102* Amendment to Agreement with Tom Wyatt dated November 4, 2011 and confirmed on November 16,2011.
82 Gap Inc. Form 10-K
10.103* Agreement with Tom Keiser dated November 18, 2009, and confirmed on November 20, 2009.
10.104* Amendment to Agreement with Tom Keiser dated November 4, 2011, and confirmed on December 7,2011.
10.105 Summary of Changes to Non-employee Director Compensation effective February 15, 2008, filed asExhibit 10.6 to Registrant’s Form 10-Q for the quarter ended May 3, 2008, Commission File No. 1-7562.
10.106 Summary of Changes to Non-employee Director Compensation, filed as Exhibit 10.5 to Registrant’s Form10-Q for the quarter ended May 2, 2009, Commission File No. 1-7562.
10.107 Summary of Changes to Executive Compensation Arrangements, filed as Exhibit 10.5 to Registrant’sForm 10-Q for the quarter ended May 3, 2008, Commission File No. 1-7562.
10.108 Summary of Changes to Executive Compensation Arrangements, filed as Exhibit 10.6 to Registrant’sForm 10-Q for the quarter ended May 2, 2009, Commission File No. 1-7562.
10.109 Description of Arrangement with Glenn Murphy for Corporate Jet Usage and Reimbursement forCommercial Travel, filed as Exhibit 101 to Registrant’s Form 10-K for the year ended February 2, 2008,Commission File No. 1-7562.
12* Ratio of Earnings to Fixed Charges
14 Code of Business Conduct, filed as Exhibit 14 to Registrant’s Form 10-K for the year ended January 30,2010, Commission File No. 1-7562.
21* Subsidiaries of Registrant
23* Consent of Independent Registered Public Accounting Firm
31.1* Rule 13a-14(a)/15d-14(a) Certification of the Chief Executive Officer of The Gap, Inc. (Section 302 of theSarbanes-Oxley Act of 2002)
31.2* Rule 13a-14(a)/15d-14(a) Certification of the Chief Financial Officer of The Gap, Inc. (Section 302 of theSarbanes-Oxley Act of 2002)
32.1* Certification of the Chief Executive Officer of The Gap, Inc. pursuant to 18 U.S.C. Section 1350, as adoptedpursuant to Section 906 of the Sarbanes-Oxley Act of 2002
32.2* Certification of the Chief Financial Officer of The Gap, Inc. pursuant to 18 U.S.C. Section 1350, as adoptedpursuant to Section 906 of the Sarbanes-Oxley Act of 2002
101+ The following materials from The Gap, Inc.’s Annual Report on Form 10-K for the year ended January 28,2012, formatted in XBRL (eXtensible Business Reporting Language): (i) the Consolidated Balance Sheets,(ii) the Consolidated Statements of Income, (iii) the Consolidated Statements of Stockholders’ Equity, (iv)the Consolidated Statements of Cash Flows, and (v) Notes to Consolidated Financial Statements.
(1) Pursuant to a request for confidential treatment, portions of this Exhibit have been redacted and have been provided separately to theSecurities and Exchange Commission.
* Filed herewith
+ Pursuant to Rule 406T of Regulation S-T, these interactive data files are deemed not filed or part of a registration statement orprospectus for purposes of Section 11 or 12 of the Securities Act of 1933, as amended, are deemed not filed for purposes of Section 18 ofthe Securities and Exchange Act of 1934, as amended, and otherwise are not subject to liability under those section.
83
ˆ?200D#FdLMb4v14ZJ)SŠ?200D#FdLMb4v14ZJ)
111124 ILB 1THE GAP, INC.FORM 10-K
22-Mar-2011 04:34 ESTCLNSFR
RR Donnelley ProFile WCRpreeh0dc 5*PMT 1C
WCRFBU-MWE-XN0210.7.14
[THIS PAGE INTENTIONALLY LEFT BLANK]

P
RINTED USIN
G
100%
WIND ENERG
Y
Supplied by Community Energy
Corporate and Shareholder Information Gap Inc. Investor Relations Please see the Investors tab on gapinc.com 2 Folsom Street San Francisco, CA 94105 415-427-0100 [email protected]
Stock Exchange listing Trading Symbol “GPS”/New York Stock Exchange
Annual Shareholders’ Meeting May 15, 2012, 10:00 a.m. Gap Inc. headquarters 2 Folsom Street San Francisco, CA 94105
Independent Registered Public Accounting Firm Deloitte & Touche LLP San Francisco, CA
Registrar and Transfer Agent (for registered shareholders) Wells Fargo Bank, N.A. Shareowner Services 161 North Concord Exchange Street South St. Paul, MN 55075
Beneficial Shareholders (shares held by your broker in the name of the brokerage house) should direct questions to your broker.
Fiscal 2012 sales release dates Please visit www.gapinc.com for up-to-date information about sales release dates.
Fiscal 2012 earnings release dates Live audio of each quarterly earnings conference call can be accessed through the investors page of our website at www.gapinc.com the day of the earnings release. Replays are available for up to a year following the event.
Board of Directors Adrian D. P. Bellamy, 70 (* +) Director since 1995. Non-Executive Chairman of Reckitt Benckiser plc. Non-Executive Chairman of Williams-Sonoma, Inc.
Domenico De Sole, 68 (*) Director since 2004. Chairman of Tom Ford International, a luxury retailer. Former President and Chief Executive Officer of Gucci Group NV. Director of Newell Rubbermaid, Inc.
Robert J. Fisher, 57 Director since 1990. Managing Director of Pisces, Inc., an investment group. Former Chairman, Interim CEO and executive of the company.
William S. Fisher, 55 Director since 2009. Founder and CEO of Manzanita Capital Limited, a private equity fund. Former executive of the company.
Bella Goren, 51 (^) Director since 2011. Chief Financial Officer of AMR Corporation and American Airlines, Inc.
Bob L. Martin, 63 (* +) Lead Independent Director. Director since 2002. Operating Partner of Stephens Group, Inc., a private equity group. Chief Executive Officer (part-time) of Mcon Management Services, Ltd., a consulting com-pany. Former President and Chief Executive Officer of Wal-Mart International. Director of Conn’s, Inc.
Jorge P. Montoya, 65 (^) Director since 2004. Former executive of The Procter & Gamble Company. Director of The Kroger Co.
Glenn K. Murphy, 50 Director since 2007. Chairman and Chief Executive Officer.
Mayo A. Shattuck III, 57 (^ +) Director since 2002. Executive Chairman of Exelon Corporation, an energy company. Former Chairman of Constellation Energy Group. Director of Capital One Financial Corporation.
Katherine Tsang, 54 (*) Director since 2010. Chairperson of Greater China, Standard Chartered Bank. Chairperson of Standard Chartered Bank (Taiwan). Chairperson of Standard Chartered Bank (Hong Kong). Director of Baoshan Iron & Steel Co. Limited.
Kneeland C. Youngblood, 56 (^) Director since 2006. Founding partner of Pharos Capital Group, LLC, a private equity firm. Director of Starwood Hotels and Resorts Worldwide, Inc. Not standing for reelection at the May 2012 Annual Meeting of Shareholders.
Doris F. Fisher Mrs. Fisher was named Honorary Lifetime Director in 2009. She served as Director of the company from 1969-2009 and merchandiser from 1969-2003. She founded the company with her husband Donald G. Fisher, who passed away in September 2009.
* Compensation and Management Development Committee
+ Governance and Nominating Committee^ Audit and Finance Committee
Executive Leadership Team Glenn K. Murphy Chairman of the Board and Chief Executive Officer
Michelle Banks EVP, General Counsel, Corporate Secretary and Chief Compliance Officer
Jack Calhoun President, Banana Republic
Colin Funnell EVP, Global Supply Chain
Tom Keiser EVP and Chief Information Officer
Toby Lenk President, Gap Inc. Direct
Art Peck President, Gap North America
Eva Sage-Gavin EVP, Global Human Resources and Corporate Affairs
Sabrina Simmons EVP and Chief Financial Officer
Stephen Sunnucks President, International
David Zoba SVP, Global Real Estate
Printing Considerations the gap inc. 2011 annual report was printed by an environmentally sustainable printer, which utilizes 100 percent renewable wind power and sustainable manufacturing principles including: socially responsible procurement; green chemistry principles; reduced Voc inks and coatings; recycling of residual materials; and carbon reduction strategies supporting forest carbon offset initiatives. Printed on FSc®- certified Finch paper supporting responsible forestry.

Wear your passion.