shareholder letter q4 2020
TRANSCRIPT

Shareholder LetterQ4 2020

2
Q4 2020 FY 2020
46.3M(39)% Y/Y
193.2M(41)% Y/Y
Nights and Experiences BookedNet of cancellations and alterations
• Despite the pandemic in 2020, Airbnb’s business proved highly resilient, with strength in North America, domestic travel, nearby travel, and long-term stays.
Gross Booking Value (GBV)Net of cancellations and alterations
• Airbnb attracted nearly $24B of bookings in 2020 based on the inherent adaptability of the platform to support a wide range of use cases.
$5.9B(31)% Y/Y (31)% Y/Y ex-FX
$23.9B(37)% Y/Y (37)% Y/Y ex-FX
Revenue
• Q4 2020 revenue was down only 22% year-over-year, demonstrating Airbnb’s resilience.
$859M(22)% Y/Y (22)% Y/Y ex-FX
$3.4B(30)% Y/Y (30)% Y/Y ex-FX
Net Income/(Loss)
• Q4 2020 net loss was impacted by charges related to our IPO, including $2.8B of stock-based compensation expense.
$(3.9)B $(4.6)B
Adjusted EBITDA*
• Q4 2020 Adjusted EBITDA was materially improved from a year ago, despite the impact of COVID-19 on our revenue.
• Due to our strong financial discipline in 2020, all operating expenses (excluding stock-based compensation and stock-settlement obligations) were down from a year ago.
$(21)M(2)% of revenue
$(251)M(7)% of revenue
* A reconciliation of non-GAAP financial measures to the most comparable GAAP measures is provided at the end of this letter.
3
Q4 2020 Shareholder Letter
2020 was a year when nearly everything changed—the way we live, the way we work, and the way we travel. Airbnb changed as well. We started the year preparing for our IPO, only to put it on hold as the world went into lockdown and global travel came to a standstill. In the face of a crisis, our business proved to be resilient, showing that as the world changes, our model is able to adapt. Through the crisis, we also sharpened our focus. We made many difficult decisions, but stayed true to our core principles and became a stronger company as a result. And we succeeded in going public after all.
But we did not get here on our own. As we share our first quarterly earnings as a public company, we want to thank our Hosts and guests, without whom we wouldn’t exist. We also want to thank our employees, who worked tirelessly for our community. Finally, we would like to thank our early shareholders for sticking by us all of these years, and our thousands of new Airbnb shareholders for joining us on this journey.
Here is a snapshot of our Q4 and full year 2020 results, and our 2021 plan:
• Q4 2020 revenue was down only 22% year-over-year, demonstrating Airbnb’s resilience. At the depth of the pandemic, we forecasted our 2020 revenue could be less than half of what it was in 2019. Yet in the end, total revenue of $3.4 billion for 2020 decreased only 30% compared with $4.8 billion in 2019. In Q4 2020, revenue of $859 million declined only 22% compared with $1.1 billion in Q4 2019, despite the second wave of COVID-19 cases and lockdowns the world experienced in Q4.
• Q4 2020 net income was impacted by charges related to our IPO. Charges associated with our IPO and our subsequent stock price increase contributed to our net loss in Q4 2020 and fiscal year 2020. Upon our IPO in December 2020, we recognized a non-cash stock-based compensation expense of $2.8 billion. This is much larger than a typical quarter because at the completion of the IPO (similar to many other companies) we were required to recognize a significant portion of all stock-based compensation provided to Airbnb employees over the last several years. The increase in our stock price also increased the value of warrants issued in connection with a term loan agreement entered into in April 2020. We recorded a non-cash mark-to-market adjustment of $827 million related to the warrants in Q4 2020. As a result, GAAP net loss was $3.9 billion in Q4 2020 and $4.6 billion in 2020, compared with GAAP net loss of $352 million in Q4 2019 and $674 million in 2019. GAAP net loss in the second half of 2020 was $3.7 billion, compared with $85 million in the second half of 2019.
• Q4 2020 Adjusted EBITDA was materially improved from a year ago, despite the impact of COVID-19 on our revenue. In Q4 2020, our Adjusted EBITDA was $(21) million, compared with $(276) million in Q4 2019, despite revenue being $248 million lower. In 2020, our Adjusted EBITDA was $(251) million, compared with $(253) million in 2019, despite revenue being $1.4 billion lower. For the second half of 2020, following our work to refocus the company and reduce costs, our Adjusted EBITDA was $481 million. In the second half of 2019, our Adjusted EBITDA was $37 million.1
1 A reconciliation of non-GAAP financial measures to the most comparable GAAP measures is provided at the end of this letter.

4
• Due to our strong financial discipline in 2020, all operating expense line items (excluding stock-based compensation and stock-settlement obligations) were down from a year ago. Excluding the impact of stock-based compensation and stock-settlement obligations, which represent employer and related taxes associated with the IPO, improvements in our cost structure enabled us to reduce our operating expenses on a year-over-year basis in all categories. This was due to our efforts throughout 2020 to reduce discretionary spending, improve variable costs and tightly manage fixed expenses across the company.
• Looking forward to 2021, we are preparing for the travel rebound. As the vaccine is rolled out and restrictions lift, we expect there will be a significant travel rebound. Our single priority in 2021 is to prepare for this travel rebound, perfecting our existing product by improving the entire end-to-end experience of our core service for both Hosts and guests.
Before we provide more details on our operating and financial performance, we want to make sure those of you who are less familiar with Airbnb have a chance to learn more. Our S-1 included a letter from our founders that described what makes Airbnb, Airbnb (please find a copy of the letter at: https://news.airbnb.com/what-makes-airbnb-airbnb/). We have summarized it below, and hope this helps you understand who we are and how we intend to operate for generations to come.
What makes Airbnb, Airbnb
Connection and Belonging
Airbnb started in 2007 when Brian Chesky and Joe Gebbia were trying to figure out a way to pay rent. A design conference was coming to San Francisco and hotels were sold out, so they inflated three airbeds and turned their apartment into an Airbed & Breakfast. They hosted three guests—Michael, Kat, and Amol—and in doing so, Brian and Joe became the first Hosts on Airbnb. Their guests arrived as strangers, but they left as friends. The connections they made led them to realize they were onto a bigger idea. Soon after, Nate Blecharcyzk joined Brian and Joe, and they created a way for people around the world to become Hosts.
Almost 14 years later, hosting remains at the center of Airbnb. Instead of traveling like tourists and feeling like outsiders, guests on Airbnb can experience connection to the communities they visit and the people who live there. This connection is delivered by our Hosts, and they provide guests with a deeply personal experience. As the world continues to change, people’s fundamental need for connection and belonging will not. This is what we will remain focused on.
Creatively-Led
We use curiosity and imagination to come up with unconventional solutions. Starting Airbnb was in itself a creative act, and we believe the biggest ideas are often leaps of the imagination. At the center of being creatively-led is our design-driven approach. At Airbnb, design isn’t just how something looks, it’s how it fundamentally works. We sit at the intersection of art and science, a commitment that started when Nate, an engineer, joined Joe and Brian, both designers. They used this approach to design a system of trust that allows strangers to live together, and a unique business model that allows Hosts to share in Airbnb’s success. And it’s this approach that will allow us to continue to design new possibilities for people. Being creatively-led is core to who we are and how we will run Airbnb.

5
Responsibility to our Stakeholders
Airbnb has always existed as a balance between our five stakeholders—our Hosts, our guests, the communities in which we operate, our employees, and our shareholders. In 2018, we set out to institutionalize our responsibility by defining a series of principles to serve each of our stakeholders and measuring our progress for serving each of them. We believe that in the long run, and when approached with creativity, we can design a win-win for all of our stakeholders. Our responsibility to our stakeholders will continue to guide how we operate because their collective success is key for our business to thrive.
These are the ideas at the core of Airbnb:
• Our community is based on connection and belonging. • Our creativity allows us to imagine new possibilities for people. • Our responsibility is to all of our stakeholders.
In the end, they all share a common thread—a fundamental belief that people are good and we’re in this
together. This is what makes Airbnb, Airbnb.
2020: Resiliency and Focus
A Resilient Model
COVID-19 had a severe impact on the travel industry and our business in 2020. When borders closed and travel stopped, our business declined by nearly 80% (on a gross bookings value basis, prior to cancellations and alterations). However, our asset-light business model proved to be resilient and inherently adaptable.
After months of being stuck inside their homes, people were yearning to connect with their loved ones in a safe way. They decided to get in their cars and visit places nearby, often staying in small towns and rural communities. Because we have millions of Hosts who offer nearly all types of homes and experiences around the world, we were able to adapt to the new use cases guests wanted—from working remotely from another home, to taking extended trips with family and friends.
Our business started to recover faster than anyone expected. With millions of guests booking stays closer to home, domestic travel quickly rebounded on Airbnb worldwide. The speed and scale of our recovery in 2020 shows that as the world changes, our model is able to adapt.
A More Focused and Efficient Company
COVID-19 led us to go back to our roots and focus on what is most unique about Airbnb—hosting. We focused on the core of our Host community, the everyday people who host their homes and offer experiences. We scaled back investments that did not directly support hosting. This focus improved our execution by helping to streamline our organization. For instance, rather than relying on business units with sometimes overlapping support functions, we moved to a centralized structure that allowed us to minimize redundant efforts and expense.
We were on the path to becoming a more efficient company prior to COVID-19, but the pandemic meaningfully accelerated our efforts. In a capital-constrained environment, we had to find ways to allocate resources more effectively. In response to COVID-19, we undertook an internal review of our cost structure and rapidly made changes, including material reductions to discretionary spending, suspension
6
of performance marketing, and a reduction in our workforce. These are just a few of the changes we made. Going forward, we expect to continue to be judicious in our spending, but we will continue to invest where we see opportunities for long-term growth.
2021: Preparing for the Recovery
The Coming Travel Rebound
It’s been nearly a year since the world went into lockdown, and we believe people are yearning for what has been taken away from them: travel and human connection. As restrictions gradually lift and borders begin to open, we expect there will be a significant travel rebound. But when travel does return, we believe it will look different from before the pandemic.
In 2021, travel will be less about where you go and when you go, and more about who you are with and what you can do together. We will see a shift from mass travel to meaningful travel. And with more people working from home, there will be more flexibility around where and when they travel. Our own data suggests this, and we recently conducted a survey of American consumers that helps confirm it. Here are some highlights:
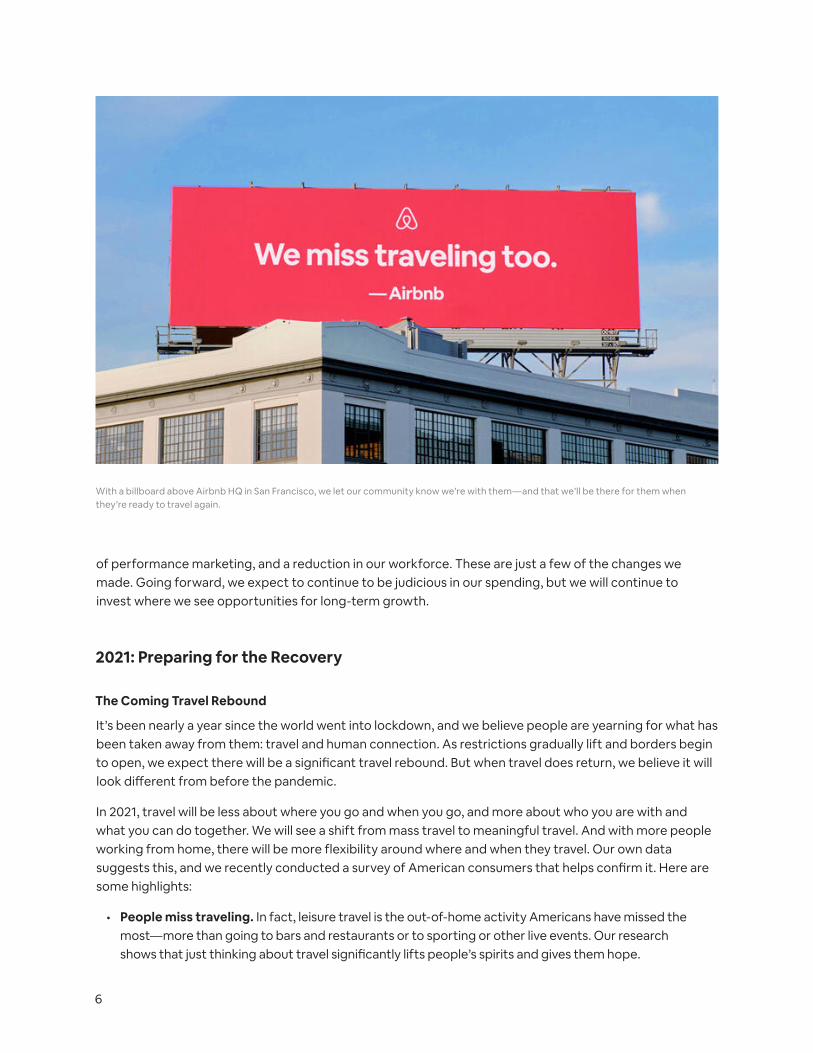
• People miss traveling. In fact, leisure travel is the out-of-home activity Americans have missed the most—more than going to bars and restaurants or to sporting or other live events. Our research shows that just thinking about travel significantly lifts people’s spirits and gives them hope.
With a billboard above Airbnb HQ in San Francisco, we let our community know we’re with them—and that we’ll be there for them when they’re ready to travel again.

7
• People plan to travel this year. More than half of those surveyed (54%) said they either already booked, are currently planning to travel, or expect to travel in 2021. This includes 57% of 18- to 29-year-olds, and 60% of 30- to 49-year-olds.
• When travel returns, it will be about connection. Those surveyed said the type of travel they have missed the most is spending time with family and friends. After their own health and the safety of others, the top reasons for getting vaccinated are the ability to connect with friends and family (37%), followed by the ability to feel safe to travel (32%).
• People will continue to travel nearby. A majority (56%) prefer a domestic or local destination versus just 21% who want to visit someplace international and farther away. People will get in cars and travel nearby, dispersing to thousands of smaller cities, towns, and rural communities, making tourism an important part of how local economies recover.
We believe Airbnb is uniquely positioned for the ways traveling and living are changing, and we have developed a plan for 2021 that will help us capitalize on this coming travel rebound.
Our 2021 Plan
In 2021, we will maintain the focus and discipline that helped us manage through the crisis last year. Our priority is to prepare for the coming travel rebound. To do this, we will perfect our existing product by improving the entire end-to-end experience of our core service for both Hosts and guests. Specifically, we plan to:
• Educate the world about what makes Airbnb different—hosting: Through our marketing and communications, we will educate guests that being hosted is a better way to travel, as well as inspire more people to become Hosts. See more about our new Made possible by Hosts campaign below.
• Recruit more Hosts and set them up for success: To ensure that we have enough high-quality homes, we are recruiting more Hosts, simplifying the onboarding process so it’s easier for them to get started, and improving our tools and support to help them succeed.
• Simplify the guest journey: To make it easier for guests to find the perfect stay, we are simplifying every part of the guest journey, as well as improving our search functionality to support more flexible travel patterns.
• Deliver world-class service: Finally, whenever our Hosts or guests need us, we need to deliver world-class service. We are actively fixing product issues that drive customer contacts, scaling our operations to match the potential rebound, and continually enhancing our support.

8
Made possible by Hosts
Recently, we launched our first large-scale marketing campaign in five years—Made possible by Hosts. Even though the Airbnb brand is mainstream, the idea of hosting is not. Our goal with the campaign is to make a long-term investment in educating the world about what makes Airbnb unique—our Hosts. This campaign will help our guests to understand our core value proposition of hosting and how the benefit of being hosted is unique to Airbnb. At the same time, the campaign will create awareness around the idea of becoming a Host by making it more mainstream and aspirational.
By using real guest photos from real hosted stays, the campaign shows with authenticity what the experience of being hosted feels like. Its deeply emotional, nostalgic tone speaks directly to the need for connection people are feeling from nearly a year of isolation.
Made possible by Hosts
Our campaign (above and on the cover) captured the magic of real trips on Airbnb. Here, an excited Aya and her mother explore the sun-drenched beach cottage in Narragansett where a week of adventure awaits, made possible by Hosts François & Ashley.

9
Serving our Stakeholders
As noted above, Airbnb has five stakeholders: Hosts, guests, the communities in which we operate, employees, and shareholders. In Q4 2020 and as we entered 2021, we took many steps and initiatives to support our stakeholders. Here are some of the highlights:
Serving our Hosts
Airbnb Host Endowment
To institutionalize our commitment to hosting and our Host community, we announced the creation of the Airbnb Host Endowment in October. The goal of the Host Endowment is to benefit our Host community through a variety of potential programs, initiatives, and grants. We seeded the endowment with 9.2 million shares from Airbnb, and Brian Chesky is putting plans in place to make an additional personal contribution of Airbnb shares worth over $100 million. Hosts will provide input on how funds from the endowment are allocated to benefit the broader Host community.
Host Advisory Board
We also announced the creation of the Airbnb Host Advisory Board in October. The Host Advisory Board will help present ideas and provide input on Airbnb practices. The Host Advisory Board will also help shape investments in the Host community from the Airbnb Host Endowment. In December, we introduced the 17 Hosts who hail from 14 countries and five regions and will be the first members of the Host Advisory Board for the 2021 term.
We are delighted to introduce one of these Hosts on the following pages.

10
H O ST S P OT L I G H T
Merrydith Callegari—Tasmania, Australia
SuperHost Merrydith, now a retired grandmother of four, had a lot more space in
her Tasmanian home once her daughters moved out. She’d find herself inviting
family, friends, and sometimes even complete strangers into her home to stay with
her and her husband, so the couple ended up remodeling what they used to call
the “teenagers retreat” into a separate two-bedroom apartment.

H O ST S P OT L I G H T
After realizing they loved hosting people from across the world, the couple listed
the apartment on Airbnb in 2016. “We just love to meet people, we love to talk… hear
stories,” said Merrydith, who is a firm believer in the pay it forward movement. “I want
my guests to feel instantly like they’re at home and that we care about them.”
When the pandemic first hit, like all Hosts in Tasmania, Merrydith lost all of her
bookings. But after a few months, Tasmania had effectively controlled COVID-19 and,
to prevent a spread, everyone had to stay cut off from mainland Australia. It was then
when local tourism really flourished, said Merrydith, with beaches and the country
areas becoming the biggest travel destinations. “Tasmanians were helping each other
to recover by spending money in the state, visiting places they hadn’t been for years.
It was wonderful.”
Listing on Airbnb has not only helped the couple generate extra income, but
Merrydith said it’s helped develop an even greater sense of trust in people. “I have
found that since I started doing Airbnb, it just opens you up to the world. You find
out that people are the same, they’re not any different, really. They might speak
differently and eat slightly differently, but they still have the same desires, the same
cares, and the same worries.”
Merrydith also became involved in advocacy for Hosts in Australia in 2016 (even
before she had her first booking), and through other Airbnb meet-ups, Merrydith
was inspired to start a local home sharing club with some friends. “People wanted
to do things, not just meet for coffee and chat. Straightaway, we started doing
community projects.”
“I’ve always had that feeling that collectively we can do a lot more than if we did
it separately. I like to think that Tasmanian Hosts have that ability to give more of
themselves, more of their heart.”
11
12
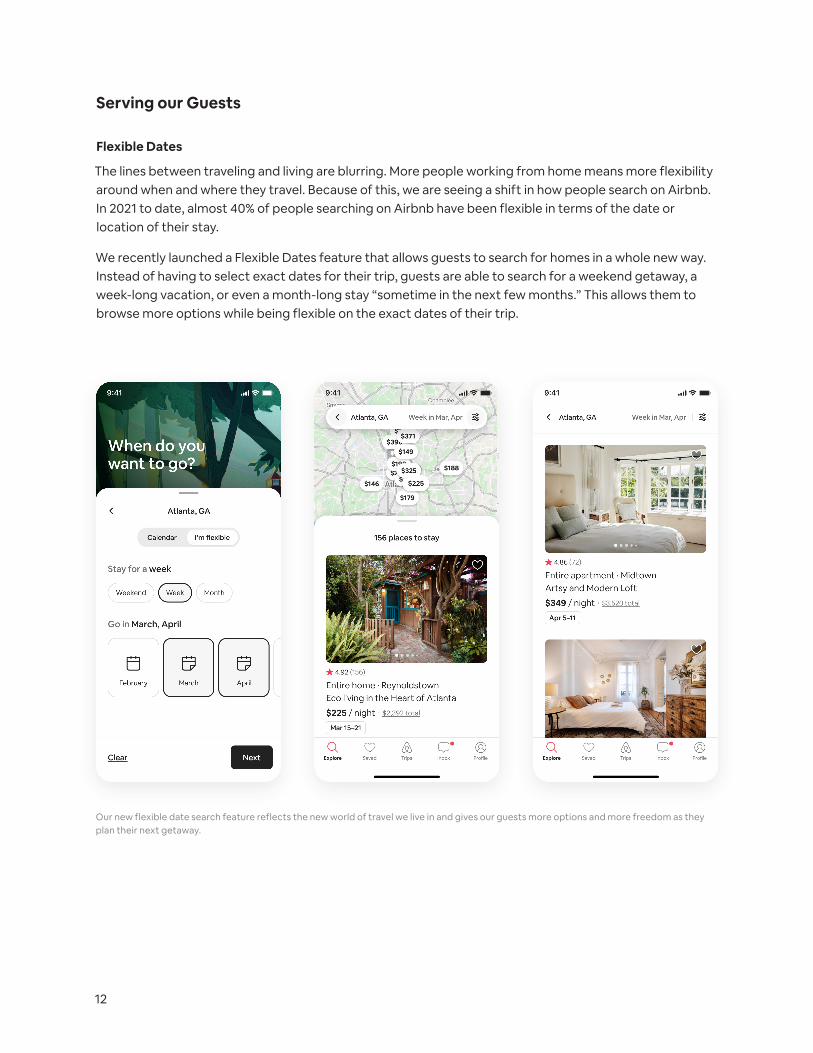
Our new flexible date search feature reflects the new world of travel we live in and gives our guests more options and more freedom as they plan their next getaway.
Serving our Guests
Flexible Dates
The lines between traveling and living are blurring. More people working from home means more flexibility around when and where they travel. Because of this, we are seeing a shift in how people search on Airbnb. In 2021 to date, almost 40% of people searching on Airbnb have been flexible in terms of the date or location of their stay.
We recently launched a Flexible Dates feature that allows guests to search for homes in a whole new way. Instead of having to select exact dates for their trip, guests are able to search for a weekend getaway, a week-long vacation, or even a month-long stay “sometime in the next few months.” This allows them to browse more options while being flexible on the exact dates of their trip.

13
Serving our Communities
Airbnb.org
Communities around the world have grappled with the devastating impacts of natural disasters in recent years and, more recently, the COVID-19 pandemic. To support those temporarily displaced and in need of housing because of such events, in December we launched Airbnb.org, an independent 501(c)(3) nonprofit organization dedicated to facilitating temporary stays. The organization helps provide stays to evacuees, relief workers, refugees, in addition to front-line workers, and has provided accommodations to over 75,000 people.
Support for Washington, D.C.
We took an active stance around the activities that took place in Washington, D.C. early in 2021. In response to local, state and federal officials asking people not to travel to Washington, D.C. in the lead up to Inauguration week in January, we announced that we would cancel reservations in the area. Guests whose reservations were canceled were refunded in full, and Hosts were paid the money they would have earned. We also identified numerous individuals who are associated with known hate groups and banned them from Airbnb’s platform.
Serving our Employees
Diversity and Inclusion
At Airbnb, diversity and belonging is more than a corporate responsibility—it is central to what we stand for. We will continue to foster an environment in which all our employees feel valued and supported in doing their best work. As of December 2020, underrepresented minority populations represented 12.3% of our U.S.-based employees and those who identify as women made up 47.0% of our employees globally.
In December, we announced that we set two key goals for ourselves:
• By the end of 2025, 20% of our U.S. employees will be underrepresented minorities. • By the end of 2025, at every level, 50% of our global employees who identify in the gender
binary will be women.
Serving our Shareholders
IPO
We completed our IPO in December 2020. Through the IPO, we welcomed many new institutional and individual investors. We were humbled by the thousands of individuals who chose to invest in Airbnb, and we believe this is a testament to the way our brand resonates with people around the world. We were also thrilled to have Hosts participate in our Directed Share Program. Our Hosts have been our partners from the very beginning, and thousands of them were able to participate in the success of Airbnb and the IPO.

14
Q4 2020
In Q4 2020, Airbnb delivered 46.3 million Nights and Experiences Booked (net of cancellations and alterations), representing a year-over-year change of (39)%. For the same period, Gross Booking Value (net of cancellations and alterations) was $5.9 billion, representing a year-over-year change of (31)% (with the same percentage change ex-FX).
Exiting Q3 2020, the travel industry continued to be impacted by rising COVID-19 cases and, subsequently, travel restrictions around the world. While this contributed to our business being below 2019 levels in Q4 2020, we have seen many areas of resilience continue from earlier in 2020: North America, domestic travel, nearby travel, long-term stays, and stays in less densely populated areas.
On a regional basis, North America has been our most stable region during the pandemic—this continued in Q4 2020. Nights booked in North America (prior to cancellations and alterations) were close to the levels reached in the same quarter of 2019.
Our business was most affected in EMEA, especially in countries that had lockdowns and cross-border travel restrictions, and which have historically relied more heavily on cross-border travel. Examples include Great Britain, Italy and Germany. We did see some slight reacceleration late in Q4 2020 in countries such as France, driven by the easing of some restrictions and holiday-related travel.
In Latin America, the pace of nights booked (prior to cancellations and alterations) remains below 2019 levels but was relatively stable during the quarter. We saw resilience in domestic travel of certain countries,
Q4 2020
46.3M Nights & Experiences Booked* (39)% Y/Y
$5.9B Gross Booking Value* (31)% Y/Y (31)% Y/Y ex-FX
FY 2020
193.2M Nights & Experiences Booked* (41)% Y/Y
$23.9B Gross Booking Value* (37)% Y/Y (37)% Y/Y ex-FX
*Net of cancellations and alterations
Q4 2020 and FY 2020 Business and Financial Performance

15
such as Brazil and Mexico. The recovery in Asia Pacific continues to take time, as many countries in the region have historically been reliant on cross-border travel, which remains well below 2019 levels.
In North America and across our global regions, domestic travel continues to be a strength for Airbnb as people seek out nearby locations that are less exposed to cross-border travel restrictions and can be reached by car. Across all regions, nights booked (prior to cancellations and alterations) for domestic travel in Q4 2020 exceeded that of the same period in 2019, though this has not been sufficient to offset the impact from the loss of cross-border travel. In terms of travel distance, we saw the most strength for nights booked growth (prior to cancellations and alterations) where people traveled less than 50 miles to their destinations. The growth of nights booked (prior to cancellations and alterations) for people traveling between 50–300 miles was also relatively strong.
Consistent with prior quarters, demand in Q4 2020 was supported by people seeking to travel to less densely populated locations. For example, in Q4 more guests stayed in Sicily than in Florence and Venice combined, and more in Devon than in Oxford and Cambridge combined. The pace of growth for nights booked (prior to cancellations and alterations) was strongest in non-urban areas during the quarter. We also saw relative strength for growth in nights booked (prior to cancellations and alterations) in what we term low-density urban locations, which would be away from areas such as city centers.
Due to these changing travel patterns, our business continues to be highly diversified—no city represented more than 1.1% of our revenue (before adjustments for incentives and refunds) during 2020, down from 2.5% of our revenue during 2019.
As people continue to live and travel more flexibly, entering 2020 and during the pandemic, we have seen steady growth in our long-term stays (stays of at least 28 nights). This continued in Q4 2020, with solid growth in nights booked (prior to cancellations and alterations) in this area relative to Q4 2019.
With regard to booking windows, people tended to book closer to their desired travel dates given the uncertainty of future travel restrictions. We saw the most resilience in bookings with lead times of under 30 days (between the booking and stay dates).
Average Daily Rates (“ADRs”), which we track as Gross Booking Value per Night and Experience Booked (net of cancellations and alterations), averaged approximately $128 in Q4 2020, an increase of 13% year-over-year. Supporting our ADRs were a continuation of trends that we saw earlier in the year, such as the strength of bookings in North America, where ADRs tend to be higher than other parts of the world. This was supported by more guests booking entire homes, relative to private or shared rooms, where prices are higher. The growth of our nights booked (prior to cancellations and alterations) was also stronger in non-urban and low-density urban areas, where ADRs tend to be higher when compared with high-density urban locations.
Finally, with regard to supply, active listings and experiences were relatively stable during Q4 2020, compared with Q3 2020.
FY 2020
In FY 2020, Airbnb delivered 193.2 million Nights and Experiences Booked (net of cancellations and alterations), representing a year-over-year change of (41)%. For the same period, Gross Booking Value (net of cancellations and alterations) was $23.9 billion, representing a year-over-year change of (37)% (with the same percentage change ex-FX).

16
Q4 2020
In Q4 2020, revenue was $859 million, representing a year-over-year change of (22)% (with the same percentage change ex-FX). Of note, as compared to the Q3 2020 revenue year-over-year change of (18)%, the Q4 2020 year-over-year decline was modestly impacted by the material second wave of COVID-19 cases and resulting travel restrictions experienced in many geographies.
GAAP net loss in Q4 2020 was $3.9 billion, representing (452)% of revenue, compared with $352 million in Q4 2019. Our GAAP net loss in Q4 2020 includes $2.9 billion of stock-based compensation expense, as well as $103 million of stock-settlement obligations, which represent employer and related taxes associated with the IPO. It also includes a mark-to-market adjustment of $827 million related to warrants issued in connection with a term loan agreement. Finally, net loss includes a mark-to-market adjustment of $37 million of acquisition-related impacts that we recorded within sales and marketing expense. These last two adjustments represent fluctuations in the estimated fair value of certain liabilities, which may go up or down in future periods based on specific metrics, including movements in our share price.
Adjusted EBITDA in Q4 2020 was $(21) million, representing (2)% of revenue. Despite our significantly lower revenue in Q4 2020 compared with the same period in 2019, our Q4 2020 Adjusted EBITDA exceeded the $(276) million of Adjusted EBITDA we recorded in Q4 2019.2 This was in large part due to our efforts to reduce both variable and fixed expenses in 2020.
Q4 2020
$859M Revenue (22)% Y/Y (22)% Y/Y ex-FX
$(3,888)M Net Income/(Loss)(452)% of revenue
$(21)M Adjusted EBITDA (2)% of revenue
FY 2020
$3,378M Revenue (30)% Y/Y (30)% Y/Y ex-FX
$(4,585)M Net Income/(Loss) (136)% of revenue
$(251)M Adjusted EBITDA (7)% of revenue
2 A reconciliation of non-GAAP financial measures to the most comparable GAAP measures is provided at the end of this letter.

17
Quarterly Revenue ($M)
Q4 2020 revenue was down only 22% year-over-year, demonstrating Airbnb’s resilience.
$1,600M
$2,000M
$1,200M
$800M
$400M
$0M
Q1 Q2 Q3 Q4
2019
Y/Y Change
2020
0%
(72%)
(18%)
(22%)$1,214
$335
$1,646
$1,342
$1,106
$859$839 $842
$250M
$500M
$0M
($250)M
($500)M
Adjusted EBITDA % of revenue
19%
(30%)
(4%)
(25%)
(2%)
(119%)(40%)
Q1 Q2 Q3 Q4
2019
2020
Quarterly Adjusted EBITDA ($M)
Q4 2020 Adjusted EBITDA was materially improved from a year ago, despite the impact of COVID-19 on our revenue.
37%
$(248)$(43)
$314
$501
$(334)$(397)
$(276)
$(21)
Net Income/(loss) % of revenue
Q1 Q2 Q3 Q4
$500M
$0M
($1,750)M
($4,000)M
2019
2020
Quarterly GAAP Net Income/(Loss) ($M)
Q4 2020 net loss was impacted by charges related to our IPO.
16% 16%$267 $219
(35%) (40%)
$(292) $(341)
(24%)(172%)
$(297)$(576)
(32%)
(452%)
$(352)
$(3,888)
Charges related to our IPO included $2.8B of
stock-based compensation provided to Airbnb
employees over the last several years and a non-cash mark-to-market adjustment
of $827 million related to warrants in Q4 2020.
18
Operating expenses in Q4 2020 included the impact of $2.8 billion of stock-based compensation expense, as well as $103 million of stock-settlement obligations related to the IPO. Both of these items are excluded from Adjusted EBITDA. The increase in these costs was related to restricted stock units (equity awards granted to employees in prior years) for which the liquidity-based vesting condition was satisfied upon our IPO.
Excluding the impact of stock-based compensation and the stock-settlement obligations, operating expenses declined on a year-over-year basis in all categories.3
• Cost of revenue for Q4 2020 declined by 29% year-over-year to $210 million due to lower payment processing fees associated with lower booking volumes, as well as lower infrastructure spending driven by efficiency gains and cost-containment efforts.
• Operations and support costs for Q4 2020 increased by 54% year-over-year to $330 million. Excluding the impact of stock-based compensation and stock-settlement obligations, operations and support costs for Q4 2020 declined by 14% year-over-year to $184 million, driven by lower booking and travel volumes relative to the same period in 2019.
• Product development expenses for Q4 2020 increased by 629% year-over-year to $2.1 billion. Excluding the impact of stock-based compensation and stock-settlement obligations, product development expenses fell 26% year-over-year to $201 million. This was due to lower payroll costs as a result of a lower average headcount in our product and engineering organizations stemming from our workforce reduction earlier in 2020.
• Sales and marketing expenses for Q4 2020 increased by 44% year-over-year to $630 million. Excluding the impact of stock-based compensation, stock-settlement obligations, and acquisition-related impacts, sales and marketing expenses for Q4 2020 decreased by 66% year-over-year to $148 million. This was primarily due to a decrease in performance marketing and brand campaign expenses, as we reduced discretionary spending during COVID-19.
• Finally, general and administrative expenses for Q4 2020 increased by 245% year-over-year to $714 million. Excluding the impact of stock-based compensation and stock-settlement obligations, general and administrative expenses for Q4 2020 fell by 15% year-over-year to $170 million. This was due to a reduction in third-party consultant fees, operating costs including travel and entertainment and facility-related costs due to temporary office closures, and payroll costs as a result of our workforce reduction earlier in 2020.
In Q4 2020, we reported $(139) million of net cash used in operating activities and $(147) million of Free Cash Flow.4 Due to seasonal patterns, we typically experience negative cash flow from operations and negative Free Cash Flow during the fourth quarter.
As of December 31, 2020, we had approximately $6.4 billion of cash, cash equivalents, short-term investments, and restricted cash. This was inclusive of approximately $3.7 billion of net proceeds after deducting underwriting discounts and commissions of $79 million and offering expenses of $10 million from our IPO in December (or $1.9 billion of net proceeds, net of cash used to pay employee tax withholding obligations). In addition, we had $2.2 billion of cash held on behalf of guests at the end of Q4 2020.
3, 4 A reconciliation of non-GAAP financial measures to the most comparable GAAP measures is provided at the end of this letter.

19
Unearned fees were $408 million at the end of Q4 2020, compared with $460 million at the end of Q3 2020. The sequential decrease was primarily a result of lower GBV due to seasonally lower travel during the quarter, coming off the peak summer months of Q3.
FY 2020
In FY 2020, revenue was $3.4 billion, representing a year-over-year change of (30)% (with the same percentage change ex-FX).
GAAP net loss in FY 2020 was $4.6 billion, representing (136)% of revenue. This was compared with GAAP net loss of $674 million in FY 2019.
Adjusted EBITDA in FY 2020 was $(251) million, representing (7)% of revenue. Despite 2020 revenue being $1.4 billion lower than that of 2019 (down 30% year-over-year), our Adjusted EBITDA in FY 2020 exceeded the $(253) million of Adjusted EBITDA in 2019.5
In FY 2020, we reported $(630) million of net cash used in operating activities and $(667) million of Free Cash Flow.6
Outlook
In the near term, we anticipate that year-over-year comparisons for Nights and Experiences Booked (net of cancellations and alterations), as well as for Gross Booking Value (net of cancellations and alterations), will be volatile and unreliable measures of the steady-state growth of our business. This is due to the significant increase in cancellations that we experienced in Q1 and Q2 of 2020. For both of these metrics, we anticipate that levels in Q1 2021 will be higher than those of Q1 2020, but lower than Q1 2019.
For revenue, the year-over-year decline in Q1 2021 is expected to be less than that of Q4 2020, as we continue to see gradual improvements in guests’ willingness to book stays. Year-over-year comparisons for revenue are not affected to the same degree by the increase in 2020 cancellations.
For the remainder of the year, it is too early to predict overall recovery trends for the travel industry and their impact on our business. We have been encouraged by our continued resilience and recovery, and are optimistic about the upcoming travel rebound. However, we continue to have limited visibility for growth trends in 2021 given the difficulty in determining the pace of vaccine roll-outs and the related impact on willingness to travel. We are not providing an outlook for the rest of 2021 at this time.
With regard to expenses, we will be focused on making continued progress in expanding our Adjusted EBITDA margin as we scale. Specifically in 2021, we plan to continue to improve our variable costs, materially increase our marketing efficiency and tightly manage our fixed expenses.
Due to typical seasonal patterns, our revenue is usually the lowest in Q1. We anticipate our Adjusted EBITDA margin to also be at its lowest during Q1. Additionally, we expect our Adjusted EBITDA margins to be lower in the first half of 2021 than the second half, both due to seasonality and due to investments we are making in certain areas.
5,6 A reconciliation of non-GAAP financial measures to the most comparable GAAP measures is provided at the end of this letter.

20
We expect that sales and marketing expenses as a percentage of revenue in the first half of 2021 will be higher than that of the second half. This is partially due to the marketing campaign that we are running in the first half of 2021 in advance of the summer travel season.
Similarly, we expect that operations and support as a percentage of revenue in the first half of 2021 will be higher than that of the second half. We plan to invest in our community support and trust platforms in the first half of 2021, ensuring that we are ready for the rebound in travel when it comes.
Finally, we anticipate capital expenditures in 2021 will be higher than that of 2020, but significantly lower than 2019. The majority of our expected investments are related to office improvements in North America, many of which were delayed in 2020.
Earnings Webcast
Airbnb will host an audio webcast to discuss its Q4 2020 and FY 2020 results at 2 p.m. PT / 5 p.m. ET on Thursday, February 25, 2021. The link to the webcast, as well as an audio replay, will be made available on Airbnb’s Investor Relations website at https://investors.airbnb.com.
Interested parties can register for the call in advance by visiting http://www.directeventreg.com/registration/event/6738169. After registering, instructions will be shared on how to join the call.
Following the call, a replay of the webcast will be available at the same website. A telephonic replay will be also available for three weeks following the call at (800) 585-8367 or (416) 621-4642 using conference ID: 6738169.
Investor Relations Contact [email protected]
Press Contact [email protected]
About Airbnb
Airbnb was born in 2007 when two Hosts welcomed three guests to their San Francisco home, and has since grown to 4 million Hosts who have welcomed over 800 million guest arrivals in almost every country across the globe. Every day, Hosts offer one-of-a-kind stays and unique Experiences that make it possible for guests to experience the world in a more authentic, connected way.
Forward-Looking Statements
This letter contains forward-looking statements within the meaning of the Private Securities Litigation Reform Act of 1995. All statements other than statements of historical fact could be deemed forward-looking, including, but not limited to, statements regarding the future performance of Airbnb, Inc. and its consolidated subsidiaries (the “Company”); the Company’s expectations regarding the impact of the COVID-19 pandemic on its business, travel trends and the travel industry; the Company’s expectations regarding its financial performance, including its revenue, Adjusted EBITDA, Free Cash Flow, expenses, costs and capital expenditures; the Company’s expectations regarding future operating performance, including Nights and Experiences Booked and GBV; the Company’s expectations regarding the resilience

21
of its model; the Company’s plans and goals with respect to serving all of its stakeholders; and the Company’s business strategy, plans, and objectives for future operations. In some cases, forward-looking statements can be identified by terms such as “may,” “will,” “appears,” “should,” “expects,” “plans,”
“anticipates,” “could,” “outlook,” “intends,” “target,” “projects,” “contemplates,” “believes,” “estimates,” “predicts,” “potential,” or “continue,” or the negative of these words or other similar terms or expressions that concern our expectations, strategy, plans, or intentions. Such statements are subject to a number of known and unknown risks, uncertainties, assumptions, and other factors that may cause the Company’s actual results, performance, or achievements to differ materially from results expressed or implied in this letter. Investors are cautioned not to place undue reliance on these statements, and reported results should not be considered as an indication of future performance.
Risks that contribute to the uncertain nature of the forward-looking statements include, among others, the effects of the COVID-19 pandemic on the Company’s business, the travel industry, travel trends, and the global economy generally; the declining trend of the Company’s Adjusted EBITDA and Free Cash Flow; the slowing of the Company’s revenue growth rate; the Company’s ability to retain existing Hosts and guests and add new Hosts and guests; any further and continued decline or disruption in the travel and hospitality industries or economic downturn; the Company’s ability to compete successfully; changes to the laws and regulations that may limit the Company’s Hosts’ ability and willingness to provide their listings, and/or result in significant fines, liabilities and penalties to the Company; the effect of extensive regulation and oversight, litigation and other proceedings related to the Company’s business in a variety of areas; the Company’s ability to maintain its brand and reputation, and effectively drive traffic to its platform; the effectiveness of the Company’s strategy and business initiatives, including measures to improve trust and safety; the Company’s operations in international markets; the Company’s substantial level of indebtedness; and changes in political, business, and economic conditions; as well as other risks listed or described from time to time in the Company’s filings with the Securities and Exchange Commission (the
“SEC”), including the Company’s Annual Report on Form 10-K for the fiscal year ended December 31, 2020, which will be on file with the SEC and available on the investor relations page of the Company’s website. All forward looking statements are based on information and estimates available to the Company at the time of this letter and are not guarantees of future performance. Except as required by law, the Company assumes no obligation to update any of the statements in this letter.
The information that can be accessed through hyperlinks or website addresses included herein is deemed not to be incorporated in or part of this letter.
Non-GAAP Financial Measures
In addition to our results determined in accordance with generally accepted accounting principles in the United States (“GAAP”), we review financial measures that are not calculated and presented in accordance with GAAP (“non-GAAP financial measures”). We believe our non-GAAP financial measures are useful in evaluating our operating performance. We use the following non-GAAP financial information, collectively, to evaluate our ongoing operations and for internal planning and forecasting purposes. We believe that non-GAAP financial information, when taken collectively, may be helpful to investors because it provides consistency and comparability with past financial performance, and assists in comparisons with other companies, some of which use similar non-GAAP financial information to supplement their GAAP results. Investors are encouraged to review the related GAAP financial measures and the reconciliation of these non-GAAP financial measures to their most directly comparable GAAP financial measures.

22
Our non-GAAP financial measures include Adjusted EBITDA, Adjusted EBITDA Margin and Free Cash Flow.
Adjusted EBITDA is defined as net income or loss adjusted for (i) provision for income taxes; (ii) interest income, interest expense, and other income (expense), net; (iii) depreciation and amortization; (iv) stock-based compensation expense and stock-settlement obligations related to the IPO; (v) acquisition-related impacts consisting of gains (losses) recognized on changes in the fair value of contingent consideration arrangements; (vi) net changes to the reserves for lodging taxes for which management believes it is probable that we may be held jointly liable with Hosts for collecting and remitting such taxes; and (vii) restructuring charges.
The above items are excluded from our Adjusted EBITDA measure because these items are non-cash in nature, or because the amount and timing of these items is unpredictable, not driven by core results of operations and renders comparisons with prior periods and competitors less meaningful. Reconciliations of expected Adjusted EBITDA margins to corresponding net income margins have not been provided because of the unpredictability of certain of the items excluded from Adjusted EBITDA and because we cannot determine their probable significance. We believe Adjusted EBITDA provides useful information to investors and others in understanding and evaluating our results of operations, as well as provides a useful measure for period-to-period comparisons of our business performance. Moreover, we have included Adjusted EBITDA in this letter because it is a key measurement used by our management internally to make operating decisions, including those related to operating expenses, evaluating performance, and performing strategic planning and annual budgeting. Adjusted EBITDA also excludes certain items related to transactional tax matters, for which management believes it is probable that we may be held jointly liable with Hosts in certain jurisdictions.
Adjusted EBITDA has limitations as a financial measure, should be considered as supplemental in nature, and is not meant as a substitute for the related financial information prepared in accordance with GAAP. These limitations include the following:
• Adjusted EBITDA does not reflect interest income (expense) and other income (expense), net, which include unrealized and realized gains and losses on foreign currency exchange, investments, and financial instruments, including the warrants issued in connection with a term loan agreement entered into in April 2020;
• Adjusted EBITDA excludes certain recurring, non-cash charges, such as depreciation of property and equipment and amortization of intangible assets, and although these are non-cash charges, the assets being depreciated and amortized may have to be replaced in the future, and Adjusted EBITDA does not reflect all cash requirements for such replacements or for new capital expenditure requirements;
• Adjusted EBITDA excludes stock-based compensation expense, which has been, and will continue to be for the foreseeable future, a significant recurring expense in our business and an important part of our compensation strategy, as well as stock-settlement obligations, which represent employer and related taxes related to the IPO;
• Adjusted EBITDA excludes acquisition-related impacts consisting of gains (losses) recognized on changes in the fair value of contingent consideration arrangements. The contingent consideration, which was in the form of equity, was valued as of the acquisition date and is

23
mark-to-market at each reporting period based on factors including our stock price. The changes in fair value of contingent consideration was insignificant prior to the fourth quarter of 2020;
• Adjusted EBITDA does not reflect net changes to the reserves for lodging taxes for which management believes it is probable that we may be held jointly liable with Hosts for collecting and remitting such taxes; and
• Adjusted EBITDA does not reflect restructuring charges, which include severance and other employee costs, lease impairments, and contract amendments and terminations.
Adjusted EBITDA Margin is defined as Adjusted EBITDA divided by revenue. Because of these limitations, you should consider Adjusted EBITDA and Adjusted EBITDA Margin alongside other financial performance measures, including net loss and our other GAAP results.
Free Cash Flow represents net cash provided by (used in) operating activities less purchases of property and equipment. We believe that Free Cash Flow is a meaningful indicator of liquidity that provides information to management and investors about the amount of cash generated from operations that, after purchases of property and equipment, can be used for strategic initiatives, including continuous investment in our business, growth through acquisitions, and strengthening our balance sheet. Our Free Cash Flow is impacted by the timing of GBV because we collect our service fees at the time of booking, which is generally before a stay or experience occurs. Funds held on behalf of our Hosts and guests and amounts payable to our Hosts and guests do not impact Free Cash Flow, except interest earned on these funds. Free Cash Flow has limitations as an analytical tool and should not be considered in isolation or as a substitute for analysis of other GAAP financial measures, such as net cash provided by (used in) operating activities. Free Cash Flow does not reflect our ability to meet future contractual commitments and may be calculated differently by other companies in our industry, limiting its usefulness as a comparative measure.

24
2020
Q1 Q2 Q3 Q4 FY
Nights and Experiences Booked, net of cancellations and alterations
57.1M 28.0M 61.8M 46.3M 193.2M
Y/Y (30)% (67)% (28)% (39)% (41)%
Gross Booking Value, net of cancellations and alterations
$6.8B $3.2B $8.0B $5.9B $23.9B
Y/Y (32)% (67)% (17)% (31)% (37)%
Gross Booking Value per Night and Experience Booked
$118.45 $114.18 $129.95 $127.56 $123.69
Y/Y (3)% (3)% 16% 13% 6%
2020
Q1 Q2 Q3 Q4 FY
Revenue $842M $335M $1,342M $859M $3,378M
Y/Y 0% (72)% (18)% (22)% (30)%
FX Neutral Y/Y 2% (72)% (19)% (22)% (30)%
Net income (loss) $(341)M $(576)M $219M $(3,888)M $(4,585)M
Adjusted EBITDA $(334)M $(397)M $501M $(21)M $(251)M
Net cash provided by (used in) operating activities $(570)M $(256)M $336M $(139)M $(630)M
Free Cash Flow $(585)M $(263)M $328M $(147)M $(667)M
Cash, restricted cash, and marketable securities $2,484M $4,169M $4,551M $6,425M $6,425M
Funds receivable and amounts held on behalf of customers
$2,688M $3,326M $2,354M $2,181M $2,181M
Unearned fees $658M $694M $460M $408M $408M
Ending headcount 7,429 5,506 5,465 5,597 5,597
Quarterly and Annual Summary

25
Three Months Ended December 31
Year Ended December 31
2019 2020 2019 2020
Revenue $1,106,796 $859,264 $4,805,239 $3,378,199
Costs and expenses:
Cost of revenue 293,618 209,747 1,196,313 876,042
Operations and support (1) 214,286 329,532 815,074 877,901
Product development (1) 282,899 2,062,195 976,695 2,752,872
Sales and marketing (1) 437,013 629,815 1,621,519 1,175,325
General and administrative (1) 206,919 713,769 697,181 1,134,851
Restructuring charges (1) - 14,386 - 151,355
Total costs and expenses 1,434,735 3,959,444 5,306,782 6,968,346
Loss from operations (327,939) (3,100,180) (501,543) (3,590,147)
Interest income 17,241 3,287 85,902 27,117
Interest expense (3,167) (64,140) (9,968) (171,688)
Other income (expense), net (28,224) (831,469) 13,906 (947,220)
Loss before income taxes (342,089) (3,992,502) (411,703) (4,681,938)
Provision for (benefit from) income taxes 9,449 (104,651) 262,636 (97,222)
Net loss $(351,538) $(3,887,851) $(674,339) $(4,584,716)
Net loss per share attributable to Class A and Class B common stockholders, basic and diluted
$(1.34) $(11.24) $(2.59) $(16.12)
Weighted-average shares used in computing net loss per share attributable to Class A and Class B common stockholders, basic and diluted
262,368 345,755 260,556 284,363
(1) Includes stock-based compensation expense as follows:
Operations and support $534 $141,128 $817 $143,997
Product development 11,641 1,814,705 56,632 1,878,793
Sales and marketing 6,845 423,293 23,919 435,272
General and administrative 6,217 512,397 16,179 544,086
Restructuring charges - 1,649 - (200)
Stock-based compensation expense $25,237 $2,893,172 $97,547 $3,001,948
Condensed Consolidated Statements of Operations Unaudited (in thousands, except per share amounts)
26
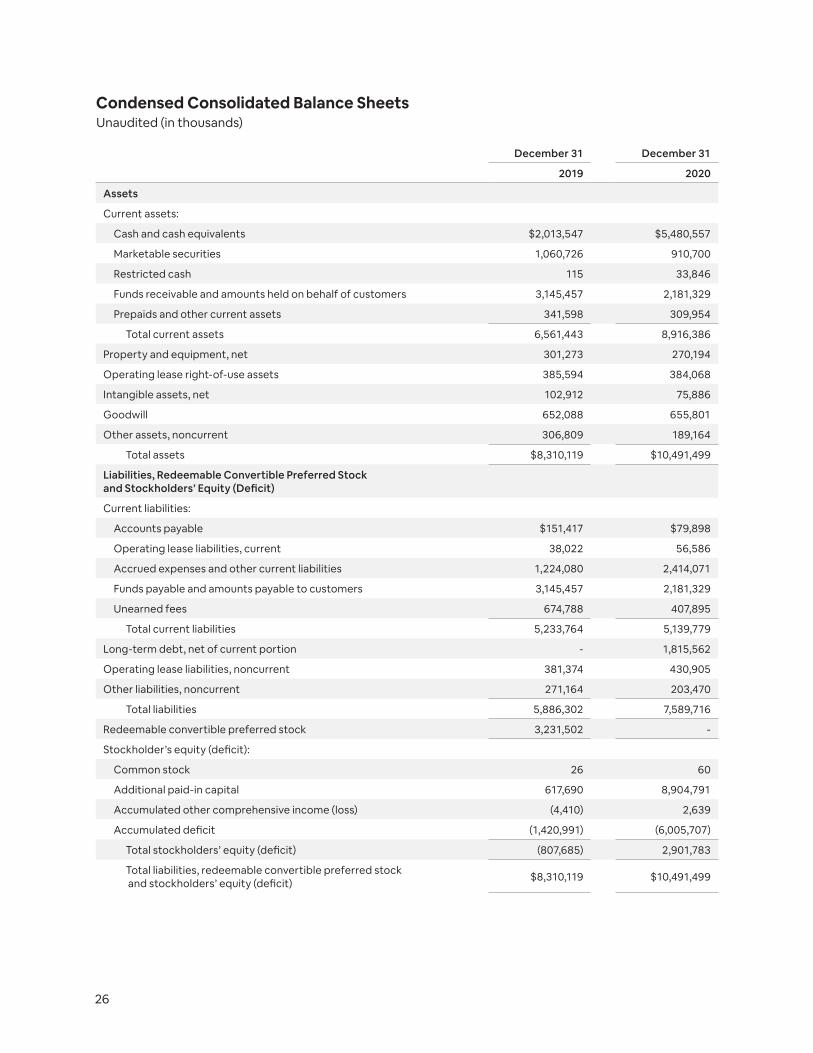
Condensed Consolidated Balance Sheets Unaudited (in thousands)
December 31 December 31
2019 2020
Assets
Current assets:
Cash and cash equivalents $2,013,547 $5,480,557
Marketable securities 1,060,726 910,700
Restricted cash 115 33,846
Funds receivable and amounts held on behalf of customers 3,145,457 2,181,329
Prepaids and other current assets 341,598 309,954
Total current assets 6,561,443 8,916,386
Property and equipment, net 301,273 270,194
Operating lease right-of-use assets 385,594 384,068
Intangible assets, net 102,912 75,886
Goodwill 652,088 655,801
Other assets, noncurrent 306,809 189,164
Total assets $8,310,119 $10,491,499
Liabilities, Redeemable Convertible Preferred Stock and Stockholders’ Equity (Deficit)
Current liabilities:
Accounts payable $151,417 $79,898
Operating lease liabilities, current 38,022 56,586
Accrued expenses and other current liabilities 1,224,080 2,414,071
Funds payable and amounts payable to customers 3,145,457 2,181,329
Unearned fees 674,788 407,895
Total current liabilities 5,233,764 5,139,779
Long-term debt, net of current portion - 1,815,562
Operating lease liabilities, noncurrent 381,374 430,905
Other liabilities, noncurrent 271,164 203,470
Total liabilities 5,886,302 7,589,716
Redeemable convertible preferred stock 3,231,502 -
Stockholder’s equity (deficit):
Common stock 26 60
Additional paid-in capital 617,690 8,904,791
Accumulated other comprehensive income (loss) (4,410) 2,639
Accumulated deficit (1,420,991) (6,005,707)
Total stockholders’ equity (deficit) (807,685) 2,901,783
Total liabilities, redeemable convertible preferred stock and stockholders’ equity (deficit)
$8,310,119 $10,491,499

27
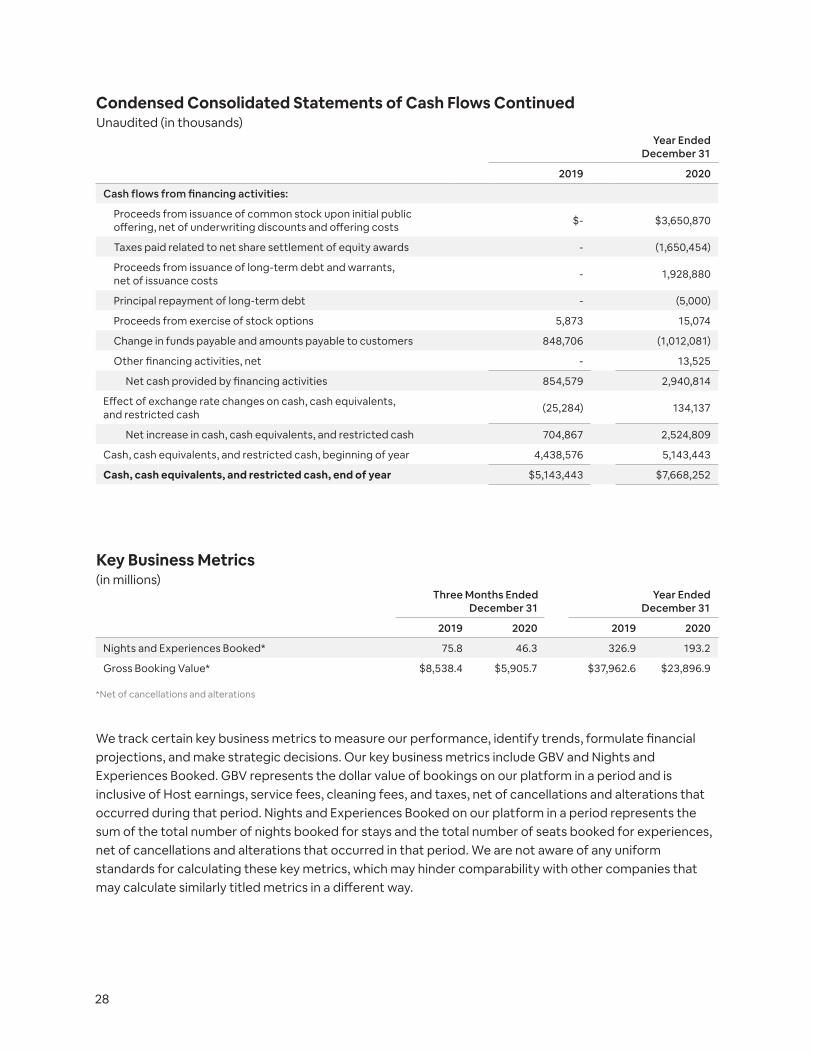
Condensed Consolidated Statements of Cash Flows Unaudited (in thousands)
Year Ended December 31
2019 2020
Cash flows from operating activities:
Net loss $(674,339) $(4,584,716)
Adjustments to reconcile net loss to cash provided by (used in) operating activities:
Depreciation and amortization 114,162 125,876
Bad debt expense 77,053 107,685
Stock-based compensation expense 97,547 3,001,948
Deferred income taxes (5,627) (19,601)
Impairment of investments 27,751 82,125
(Gain) loss on investments, net (38,472) 31,457
Change in fair value of warrant liability (286) 868,539
Amortization of debt discount and debt issuance costs - 18,323
Noncash interest (income) expense, net 4,153 5,769
Foreign exchange (gain) loss 2,927 (53,176)
Impairment of operating lease right-of-use assets - 35,772
Other, net (2,524) 34,877
Changes in operating assets and liabilities, net of acquisitions:
Prepaids and other assets (186,445) (15,863)
Operating lease right-of-use assets 49,126 (33,280)
Accounts payable 75,716 (73,111)
Accrued expenses and other liabilities 547,654 43,756
Operating lease liabilities (41,923) 60,897
Unearned fees 176,254 (267,009)
Net cash provided by (used in) operating activities 222,727 (629,732)
Cash flows from investing activities:
Purchases of property and equipment (125,452) (37,371)
Purchases of marketable securities (1,016,155) (3,032,664)
Sales of marketable securities 609,438 1,348,173
Maturities of marketable securities 551,647 1,810,052
Payments for equity investments in privately-held companies (208,182) -
Acquisitions, net of cash acquired (192,116) -
Other investing activities, net 33,665 (8,600)
Net cash provided by (used in) investing activities (347,155) 79,590
28
Three Months Ended December 31
Year Ended December 31
2019 2020 2019 2020
Nights and Experiences Booked* 75.8 46.3 326.9 193.2
Gross Booking Value* $8,538.4 $5,905.7 $37,962.6 $23,896.9
Key Business Metrics (in millions)
*Net of cancellations and alterations
We track certain key business metrics to measure our performance, identify trends, formulate financial projections, and make strategic decisions. Our key business metrics include GBV and Nights and Experiences Booked. GBV represents the dollar value of bookings on our platform in a period and is inclusive of Host earnings, service fees, cleaning fees, and taxes, net of cancellations and alterations that occurred during that period. Nights and Experiences Booked on our platform in a period represents the sum of the total number of nights booked for stays and the total number of seats booked for experiences, net of cancellations and alterations that occurred in that period. We are not aware of any uniform standards for calculating these key metrics, which may hinder comparability with other companies that may calculate similarly titled metrics in a different way.
Year Ended December 31
2019 2020
Cash flows from financing activities:
Proceeds from issuance of common stock upon initial public offering, net of underwriting discounts and offering costs
$- $3,650,870
Taxes paid related to net share settlement of equity awards - (1,650,454)
Proceeds from issuance of long-term debt and warrants, net of issuance costs
- 1,928,880
Principal repayment of long-term debt - (5,000)
Proceeds from exercise of stock options 5,873 15,074
Change in funds payable and amounts payable to customers 848,706 (1,012,081)
Other financing activities, net - 13,525
Net cash provided by financing activities 854,579 2,940,814
Effect of exchange rate changes on cash, cash equivalents, and restricted cash
(25,284) 134,137
Net increase in cash, cash equivalents, and restricted cash 704,867 2,524,809
Cash, cash equivalents, and restricted cash, beginning of year 4,438,576 5,143,443
Cash, cash equivalents, and restricted cash, end of year $5,143,443 $7,668,252
Condensed Consolidated Statements of Cash Flows Continued Unaudited (in thousands)

29
Three Months Ended Year Ended
Mar 31 2019
Jun 30 2019
Sep 30 2019
Dec 31 2019
Mar 31 2020
Jun 30 2020
Sep 30 2020
Dec 31 2020 2019 2020
Net income/(loss) $(292,027) $(297,424) $266,650 $(351,538) $(340,605) $(575,588) $219,328 $(3,887,851) $(674,339) $(4,584,716)
Adjusted to exclude the following:
Provision for (benefit from) income taxes
13,065 225,470 14,652 9,449 (16,485) (63,810) 87,724 (104,651) 262,636 (97,222)
Other (income) expense, net
(6,531) (6,284) (29,315) 28,224 46,760 12,848 56,143 831,469 (13,906) 947,220
Interest expense 1,818 2,450 2,533 3,167 (1,510) 49,191 59,867 64,140 9,968 171,688
Interest income (22,304) (24,367) (21,990) (17,241) (13,649) (5,856) (4,325) (3,287) (85,902) (27,117)
Depreciation and amortization
21,026 24,108 31,198 37,830 33,872 29,928 29,638 32,438 114,162 125,876
Stock-based compensation expense (1)
14,063 18,049 40,198 25,237 41,626 39,566 29,433 2,891,523 97,547 3,002,148
Stock-settlement obligations related to IPO
- - - - - - - 103,411 - 103,411
Acquisition-related impacts
- - - - - - - 37,215 - 37,215
Net changes in lodging tax reserves
23,025 15,406 9,657 (11,514) (84,280) 2,154 907 688 36,574 (80,531)
Restructuring charges - - - - - 114,241 22,728 14,386 - 151,355
Adjusted EBITDA $(247,865) $(42,592) $313,583 $(276,386) $(334,271) $(397,326) $501,443 $(20,519) $(253,260) $(250,673)
Adjusted EBITDA Reconciliation (in thousands)
(1) Excludes stock-based compensation related to restructuring, which is included in restructuring charges in the table above.
Reconciliations of Non-GAAP Financial Measures
The following is a reconciliation of Adjusted EBITDA to the most comparable GAAP measure, net loss.

30
Three Months Ended Year Ended
Mar 31 2019
Jun 30 2019
Sep 30 2019
Dec 31 2019
Mar 31 2020
Jun 30 2020
Sep 30 2020
Dec 31 2020 2019 2020
Net cash provided by (used in) operating activities
$314, 024 $151,634 $(46,557) $(196,374) $(569,830) $(256,462) $335,670 $(139,110) $222,727 $(629,732)
Purchases of property and equipment
(36,938) (30,527) (31,813) (26,174) (15,667) (6,186) (7,636) (7,882) (125,452) (37,371)
Free Cash Flow $277,086 $121,107 $(78,370) $(222,548) $(585,497) $(262,648) $328,034 $(146,992) $97,275 $(667,103)
Other cash flow components:
Net cash provided by (used in) investing activities
$41,645 $(109,654) $17,920 $(297,066) $2,259 $(581,070) $(237,293) $895,694 $(347,155) $79,590
Net cash provided by (used in) financing activities
$1,479,831 $624,885 $(1,420,518) $170,381 $(339,202) $2,543,390 $(1,029,981) $1,766,607 $854,579 $2,940,814
Free Cash Flow Reconciliation (in thousands)
The following is a reconciliation of Free Cash Flow to the most comparable GAAP measure, net cash provided by (used in) operating activities.

31
Three Months Ended December 31
Year Ended December 31
2019 2020 2019 2020
Operations and support $214,286 $329,532 $815,074 $877,901
Less: Stock-based compensation (534) (141,128) (817) (143,997)
Less: Stock-settlement obligations related to IPO - (4,902) - (4,902)
Operations and support excluding stock-based compensation and stock-settlement obligations related to IPO
$213,752 $183,502 $814,257 $729,002
Product development $282,899 $2,062,195 $976,695 $2,752,872
Less: Stock-based compensation (11,641) (1,814,705) (56,632) (1,878,793)
Less: Stock-settlement obligations related to IPO - (46,091) - (46,091)
Product development excluding stock-based compensation and stock-settlement obligations related to IPO
$271,258 $201,399 $920,063 $827,988
Sales and marketing $437,013 $629,815 $1,621,519 $1,175,325
Less: Stock-based compensation (6,845) (423,293) (23,919) (435,272)
Less: Stock-settlement obligations related to IPO - (21,364) - (21,364)
Less: Acquisition-related impacts - (37,215) - (37,215)
Sales and marketing excluding stock-based compensation, stock-settlement obligations related to IPO, and acquisition-related impacts
$430,168 $147,943 $1,597,600 $681,474
General and administrative $206,919 $713,769 $697,181 $1,134,851
Less: Stock-based compensation (6,217) (512,397) (16,179) (544,086)
Less: Stock-settlement obligations related to IPO - (31,054) - (31,054)
General and administrative excluding stock-based compensation and stock-settlement obligations related to IPO
$200,702 $170,318 $681,002 $559,711
Restructuring charges $- $14,386 $- $151,355
Less: Stock-based compensation - (1,649) - 200
Less: Stock-settlement obligations related to IPO - - - -
Restructuring charges excluding stock-based compensation and stock-settlement obligations related to IPO
$- $12,737 $- $151,555
The following is a reconciliation of operating expense line items less stock-based compensation, stock-settlement obligations related to the IPO, and acquisition-related impacts consisting of gains (losses) recognized on changes in the fair value of contingent consideration arrangements (in thousands):

32
Nights and Experiences Booked on our platform in a period represents the sum of the total number of nights booked for stays and the total number of seats booked for experiences, net of cancellations and alterations that occurred in that period.
Gross Booking Value (“GBV”) represents the dollar value of bookings on our platform in a period and is inclusive of Host earnings, service fees, cleaning fees, and taxes, net of cancellations and alterations that occurred during that period.
Revenue consists of service fees, net of incentives and refunds, charged to our customers.
Adjusted EBITDA is defined as net income or loss adjusted for (i) provision for income taxes; (ii) interest income, interest expense, and other income (expense), net; (iii) depreciation and amortization; (iv) stock-based compensation expense and stock-settlement obligations related to the IPO; (v) acquisition-related impacts consisting of gains (losses) recognized on changes in the fair value of contingent consideration arrangements; (vi) net changes to the reserves for lodging taxes for which management believes it is probable that we may be held jointly liable with Hosts for collecting and remitting such taxes; and (vii) restructuring charges.
Adjusted EBITDA Margin is defined as Adjusted EBITDA divided by revenue.
Free Cash Flow represents net cash provided by (used in) operating activities less purchases of property and equipment.
Glossary
Nights and Experiences Booked
Gross Booking Value
Revenue
Adjusted EBITDA
Adjusted EBITDA Margin
Free Cash Flow

33