shared measurement webinar - c.ymcdn.com · boston | geneva | san francisco | seattle | washington...
TRANSCRIPT

Boston | Geneva | San Francisco | Seattle | Washington FSG.ORG
Shared Measurement Webinar
prepared for:
Association of Baltimore Area Grantmakers
June 2, 2014
FSG.ORG
© 2013 FSG
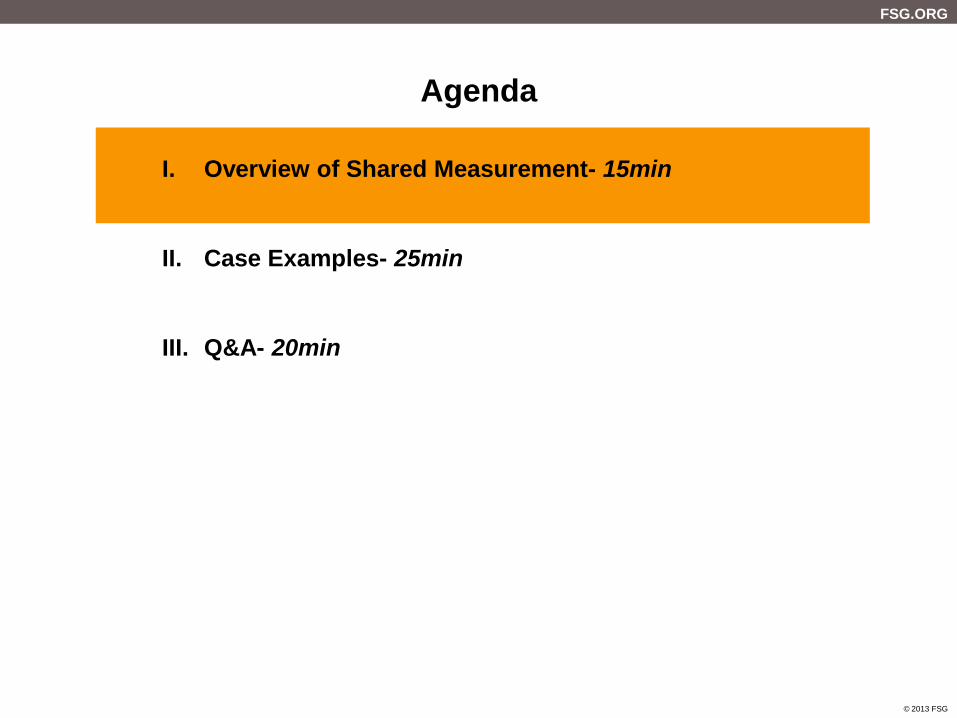
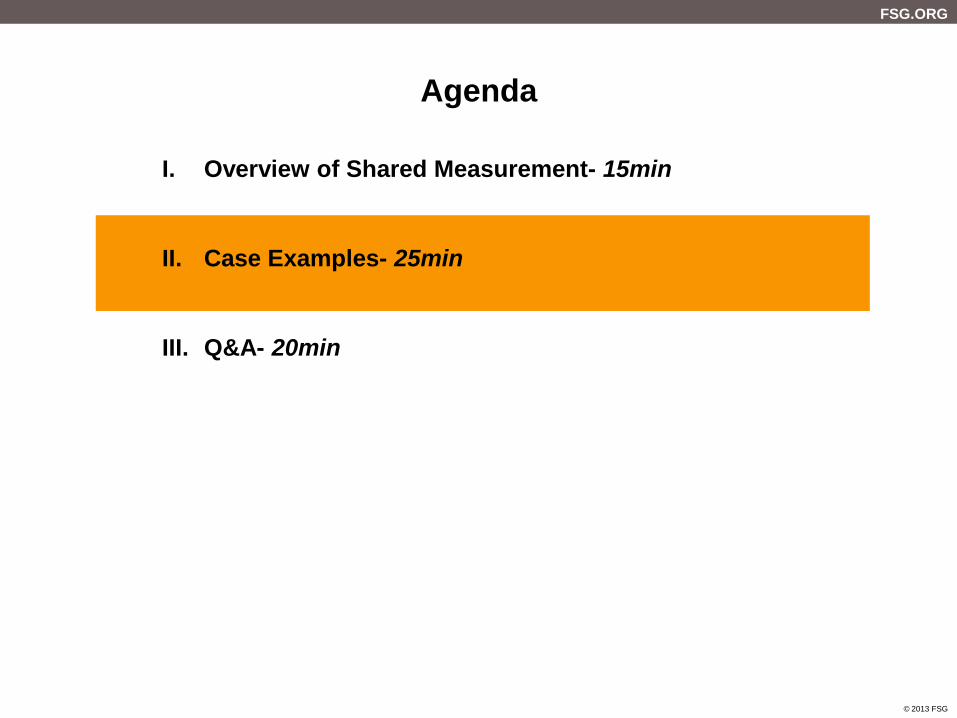
Agenda
I. Overview of Shared Measurement- 15min
II. Case Examples- 25min
III. Q&A- 20min

FSG.ORG
© 2013 FSG
Collective Impact is the commitment
of a group of important actors from different sectors to a common agenda
for solving a specific problem
FSG.ORG
4 © 2013 FSG
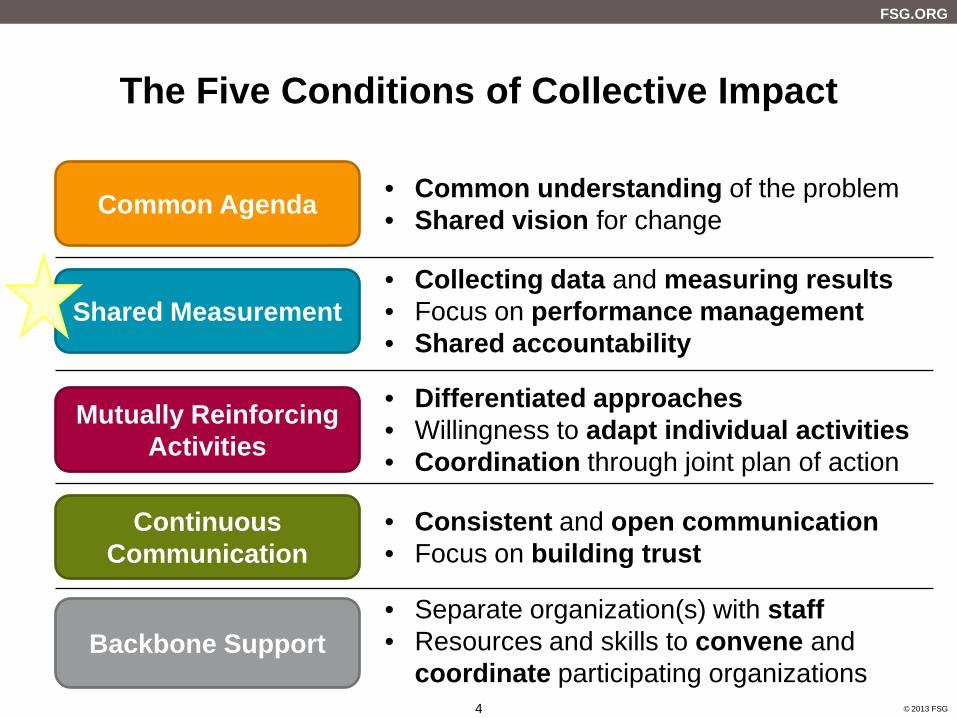
The Five Conditions of Collective Impact
Common Agenda • Common understanding of the problem • Shared vision for change
Shared Measurement • Collecting data and measuring results • Focus on performance management • Shared accountability
Mutually Reinforcing Activities
• Differentiated approaches • Willingness to adapt individual activities • Coordination through joint plan of action
Continuous Communication
• Consistent and open communication • Focus on building trust
Backbone Support • Separate organization(s) with staff • Resources and skills to convene and
coordinate participating organizations Source: Channeling Change: Making Collective Impact Work, 2012; FSG Interviews

FSG.ORG
© 2013 FSG
“My question is: Are we making an impact?”
Source: The New Yorker

FSG.ORG
© 2013 FSG
What is Shared Measurement?
Identifying meaningful common metrics for tracking progress toward a common agenda across organizations, and providing scalable platforms to share data, discuss learning, and improve strategy and action
Improved Data Quality
Tracking Progress Toward a Shared Goal
Enabling Coordination and Collaboration
Learning and Course Correction
Catalyzing Action
Definition
Benefits of Using Shared Measurement

FSG.ORG
© 2013 FSG
Keys for Successful Shared Measurement
Source: Breakthroughs in Shared Measurement and Social Impact, FSG, 2009
Effective Relationship with
Funders
Broad and Open Engagement
Infrastructure for Deployment
Pathways for Learning and Improvement
FSG.ORG
© 2013 FSG
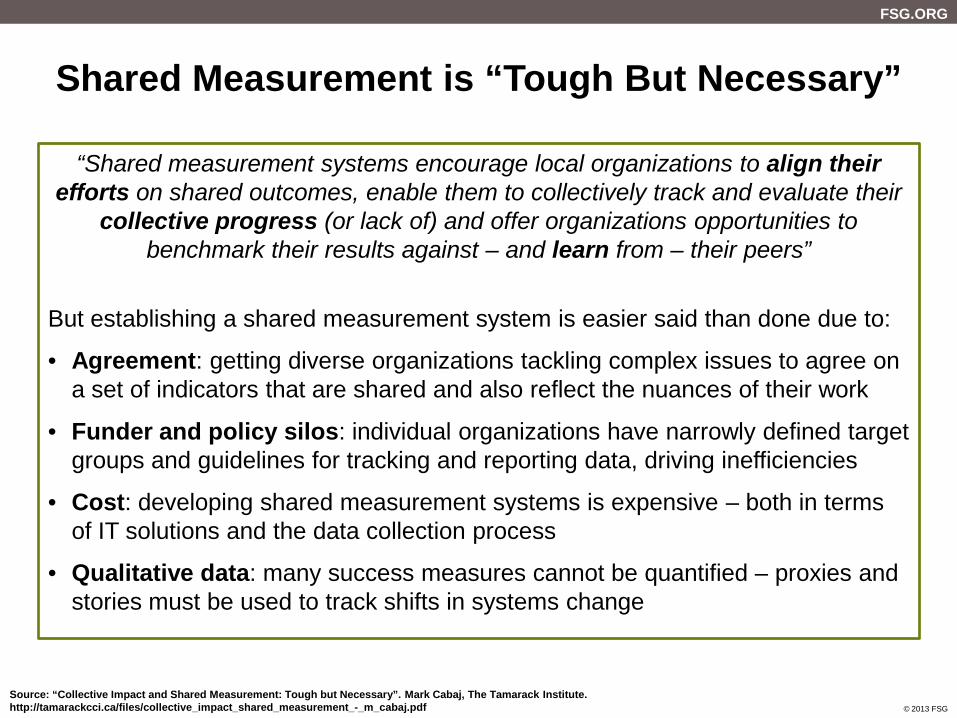
Shared Measurement is “Tough But Necessary”
“Shared measurement systems encourage local organizations to align their efforts on shared outcomes, enable them to collectively track and evaluate their
collective progress (or lack of) and offer organizations opportunities to benchmark their results against – and learn from – their peers”
But establishing a shared measurement system is easier said than done due to:
• Agreement: getting diverse organizations tackling complex issues to agree on a set of indicators that are shared and also reflect the nuances of their work
• Funder and policy silos: individual organizations have narrowly defined target groups and guidelines for tracking and reporting data, driving inefficiencies
• Cost: developing shared measurement systems is expensive – both in terms of IT solutions and the data collection process
• Qualitative data: many success measures cannot be quantified – proxies and stories must be used to track shifts in systems change
Source: “Collective Impact and Shared Measurement: Tough but Necessary”. Mark Cabaj, The Tamarack Institute. http://tamarackcci.ca/files/collective_impact_shared_measurement_-_m_cabaj.pdf
FSG.ORG
© 2013 FSG
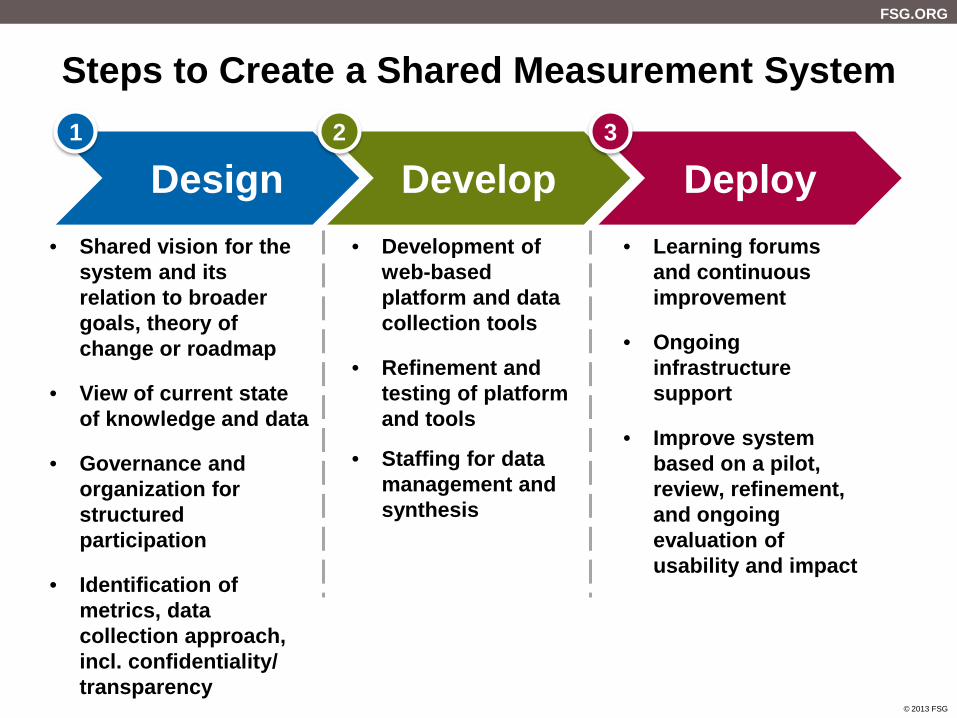
Steps to Create a Shared Measurement System
Design Develop Deploy 1 2 3
• Shared vision for the system and its relation to broader goals, theory of change or roadmap
• View of current state of knowledge and data
• Governance and organization for structured participation
• Identification of metrics, data collection approach, incl. confidentiality/ transparency
• Development of web-based platform and data collection tools
• Refinement and testing of platform and tools
• Staffing for data management and synthesis
• Learning forums and continuous improvement
• Ongoing infrastructure support
• Improve system based on a pilot, review, refinement, and ongoing evaluation of usability and impact
FSG.ORG
© 2013 FSG
Agenda
I. Overview of Shared Measurement- 15min
II. Case Examples- 25min
III. Q&A- 20min

FSG.ORG
© 2013 FSG
• By 2018, any person experiencing homelessness will have a plan towards safe, decent, affordable housing within 7 days of entering the homeless system
The Calgary 10 Year Plan to End Homelessness
Need
Implementation
Goal
• Canada's fastest growing homeless population
• Calgary Homeless Foundation as backbone
• Created a System Planning Framework, HMIS system
FSG.ORG
© 2013 FSG
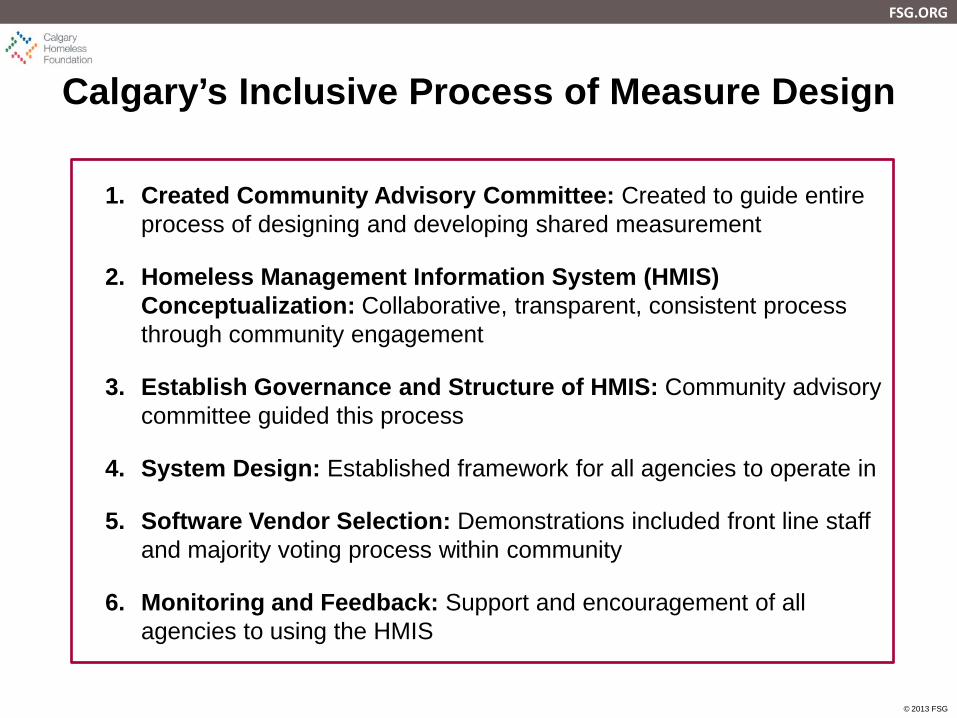
Calgary’s Inclusive Process of Measure Design
1. Created Community Advisory Committee: Created to guide entire process of designing and developing shared measurement
2. Homeless Management Information System (HMIS) Conceptualization: Collaborative, transparent, consistent process through community engagement
3. Establish Governance and Structure of HMIS: Community advisory committee guided this process
4. System Design: Established framework for all agencies to operate in
5. Software Vendor Selection: Demonstrations included front line staff and majority voting process within community
6. Monitoring and Feedback: Support and encouragement of all agencies to using the HMIS

FSG.ORG
© 2013 FSG
Homeless Management Information System
Note: System cost: $250-$300k per year; Calgary HMIS system is based on the National Alliance to End Homelessness HMIS system Source: FSG Interviews, Calgary Homeless Foundation, Bowman Systems
HMIS System
Systems Measures • Occupancy • Destinations at exit • Return to shelter/rough sleeping • Discharge from public institutions
Program Measures • Income gains at exit • Length of stay/stability • Client rate of engagement • Self-sufficiency measures
How Calgary is Using HMIS
• System planning, development and evolution
• Responding to real time changes in homelessness
• Program monitoring and quality improvement
• Annual strategic review and annual business planning process
• Data based 10 Year Plan implementation & investment decisions
FSG.ORG
© 2013 FSG
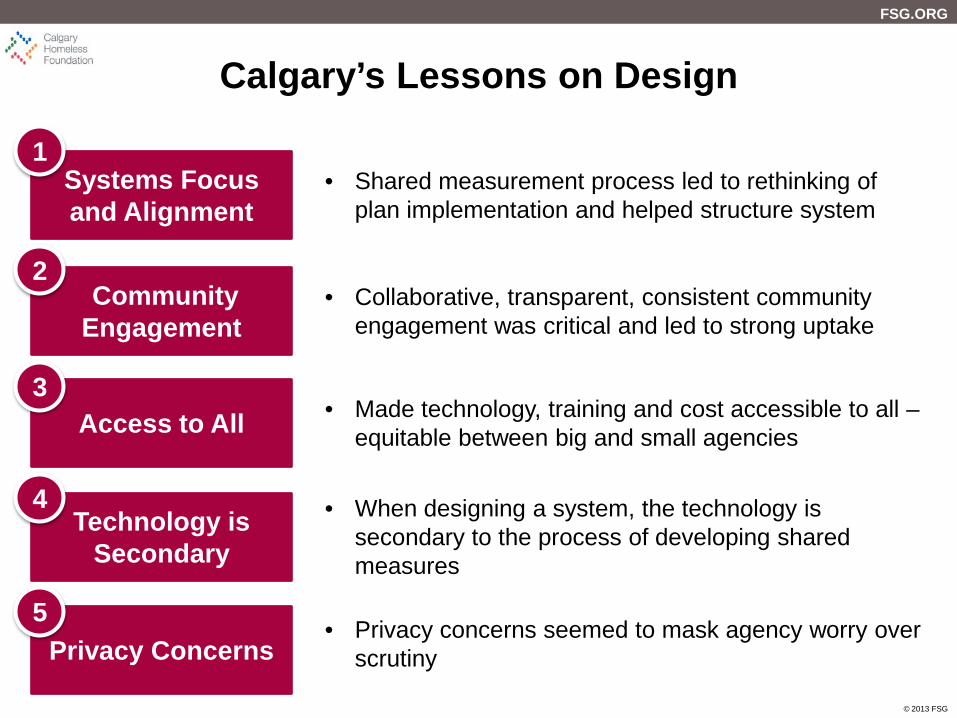
Calgary’s Lessons on Design
Systems Focus and Alignment
• Shared measurement process led to rethinking of plan implementation and helped structure system
Community Engagement
• Collaborative, transparent, consistent community engagement was critical and led to strong uptake
Access to All • Made technology, training and cost accessible to all – equitable between big and small agencies
Technology is Secondary
• When designing a system, the technology is secondary to the process of developing shared measures
Privacy Concerns • Privacy concerns seemed to mask agency worry over
scrutiny
1
2
4
3
5

FSG.ORG
© 2013 FSG
The Road Map Project (Seattle)
“The Road Map Project’s goal is to double
the number of students in South King
County and South Seattle who are on track
to graduate from college or earn a career
credential by 2020.
We are committed to nothing less than
closing the unacceptable achievement gaps
for low income students and children of
color, and increasing achievement for all
students from cradle to college and career.”

FSG.ORG
© 2013 FSG
Work Groups Used a Multi-Step Process to Identify, Vet, and Refine Indicators
Identify Indicators
Develop Work Groups
Track Progress and Refine over Time
• Each group used criteria to identify and prioritize indicators
• Work group chairs met to calibrate indicators across cradle-to-college continuum
• Short-list of top-level indicators were selected to set time-bound targets
• Additional supporting indicators are also tracked over time
• Four work groups formed in early learning, K-12 / in-school, K-12 / out-of-school, post-secondary)
• Groups were charged with identifying indicators of student success for their part of the cradle-to-college continuum
• The Road Map backbone (CCER) issues baseline and annual reports to track progress on all indicators where data is available
• A team of data experts advises on indicators over time so the list can evolve as warranted
FSG.ORG
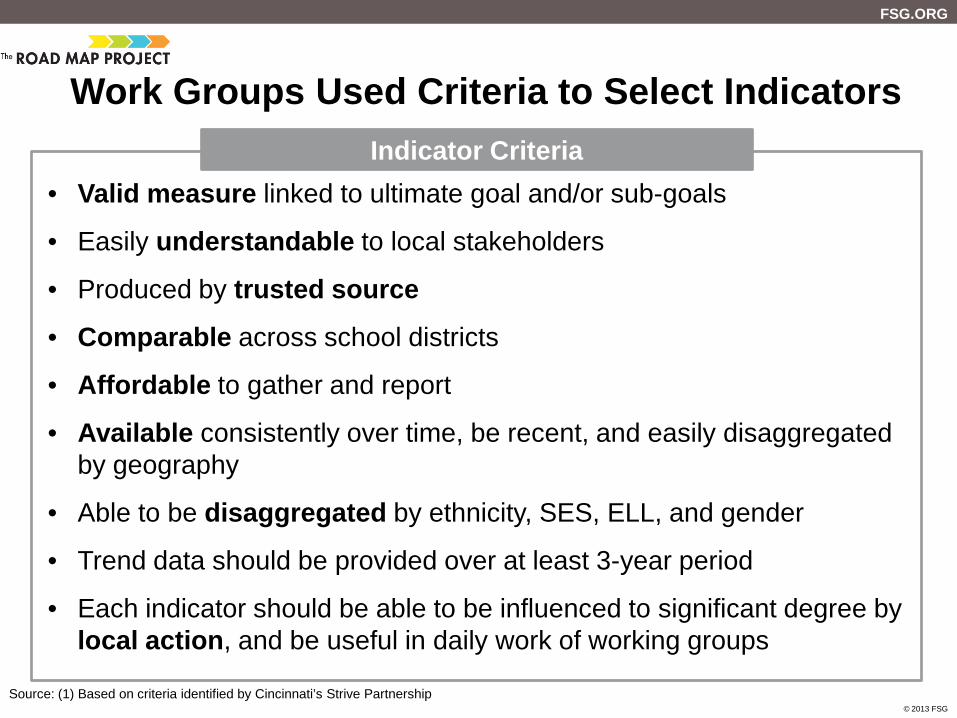
© 2013 FSG Source: (1) Based on criteria identified by Cincinnati’s Strive Partnership
• Valid measure linked to ultimate goal and/or sub-goals
• Easily understandable to local stakeholders
• Produced by trusted source
• Comparable across school districts
• Affordable to gather and report
• Available consistently over time, be recent, and easily disaggregated by geography
• Able to be disaggregated by ethnicity, SES, ELL, and gender
• Trend data should be provided over at least 3-year period
• Each indicator should be able to be influenced to significant degree by local action, and be useful in daily work of working groups
Indicator Criteria
Work Groups Used Criteria to Select Indicators
FSG.ORG
© 2013 FSG
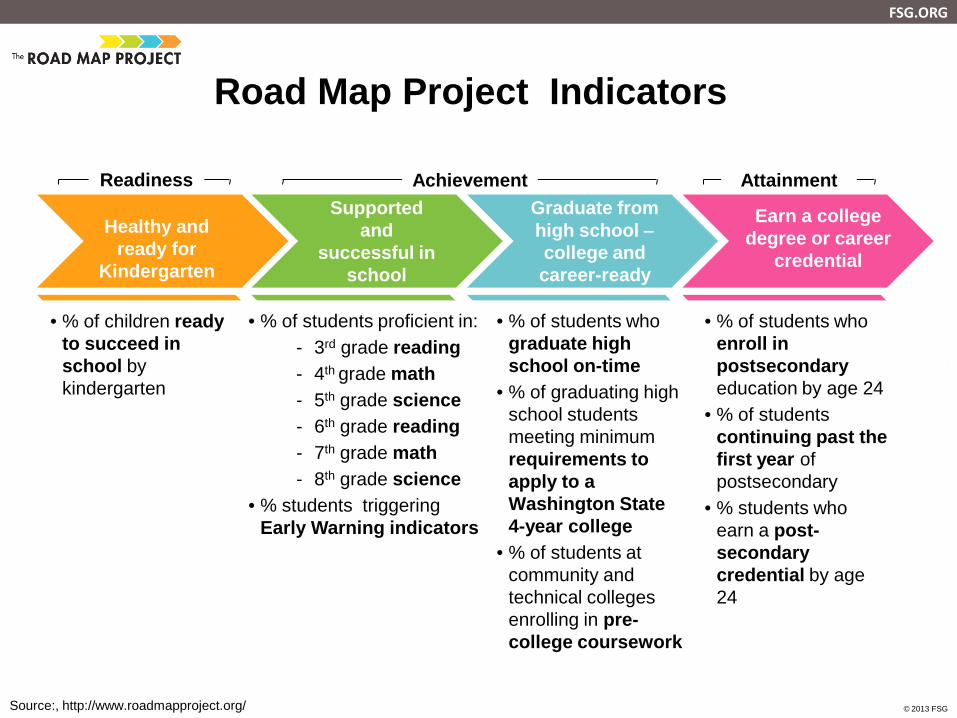
Road Map Project Indicators
Healthy and ready for
Kindergarten
Supported and
successful in school
Graduate from high school − college and career-ready
Earn a college degree or career
credential
• % of students proficient in: - 3rd grade reading - 4th grade math - 5th grade science - 6th grade reading - 7th grade math - 8th grade science
• % students triggering Early Warning indicators
• % of students who graduate high school on-time
• % of graduating high school students meeting minimum requirements to apply to a Washington State 4-year college
• % of students at community and technical colleges enrolling in pre-college coursework
• % of students who enroll in postsecondary education by age 24
• % of students continuing past the first year of postsecondary
• % students who earn a post-secondary credential by age 24
• % of children ready to succeed in school by kindergarten
Readiness Attainment Achievement
Source:, http://www.roadmapproject.org/
FSG.ORG
© 2013 FSG
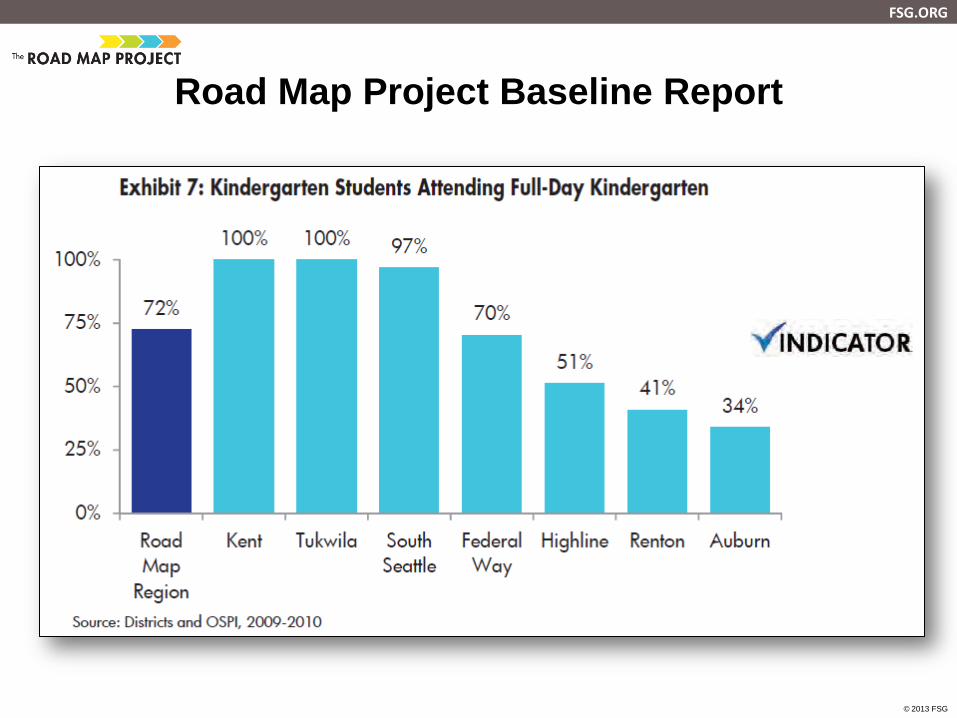
Road Map Project Baseline Report
FSG.ORG
© 2013 FSG
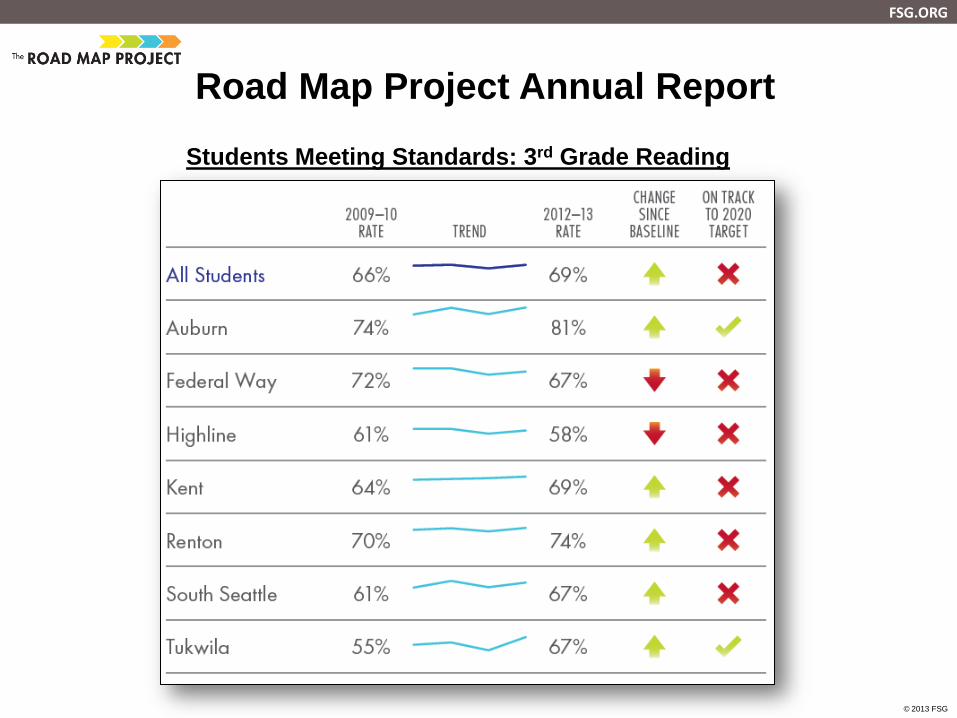
Road Map Project Annual Report
Students Meeting Standards: 3rd Grade Reading
FSG.ORG
© 2013 FSG
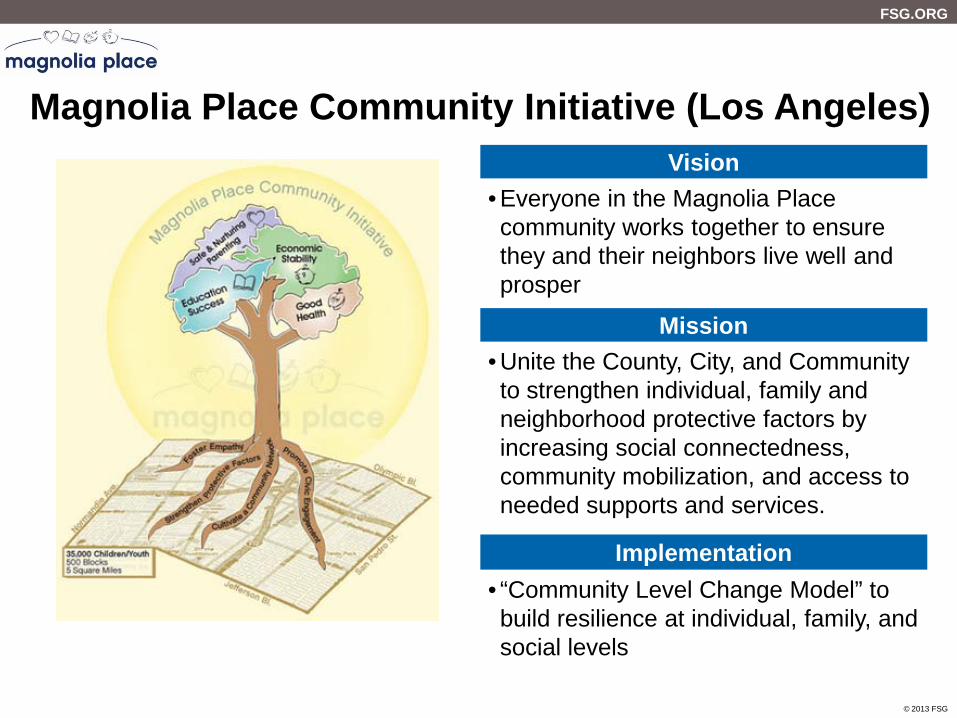
• Everyone in the Magnolia Place community works together to ensure they and their neighbors live well and prosper
Magnolia Place Community Initiative (Los Angeles)
• Unite the County, City, and Community to strengthen individual, family and neighborhood protective factors by increasing social connectedness, community mobilization, and access to needed supports and services.
Vision
Implementation
Mission
• “Community Level Change Model” to build resilience at individual, family, and social levels

FSG.ORG
© 2013 FSG
Magnolia Place Dashboard
Measures of real-time improvement in services and supports
Long-term outcomes (e.g. Developmental progress, by kindergarten; Reading proficiency, third grade)

FSG.ORG
© 2013 FSG
Magnolia Place Dashboard Supports Learning
Set SMART aims for the improvement: Specific Measurable Action oriented Realistic Timely Three levels of change: 1. System 2. Across organizations 3. Individual
organizations
FSG.ORG
© 2013 FSG
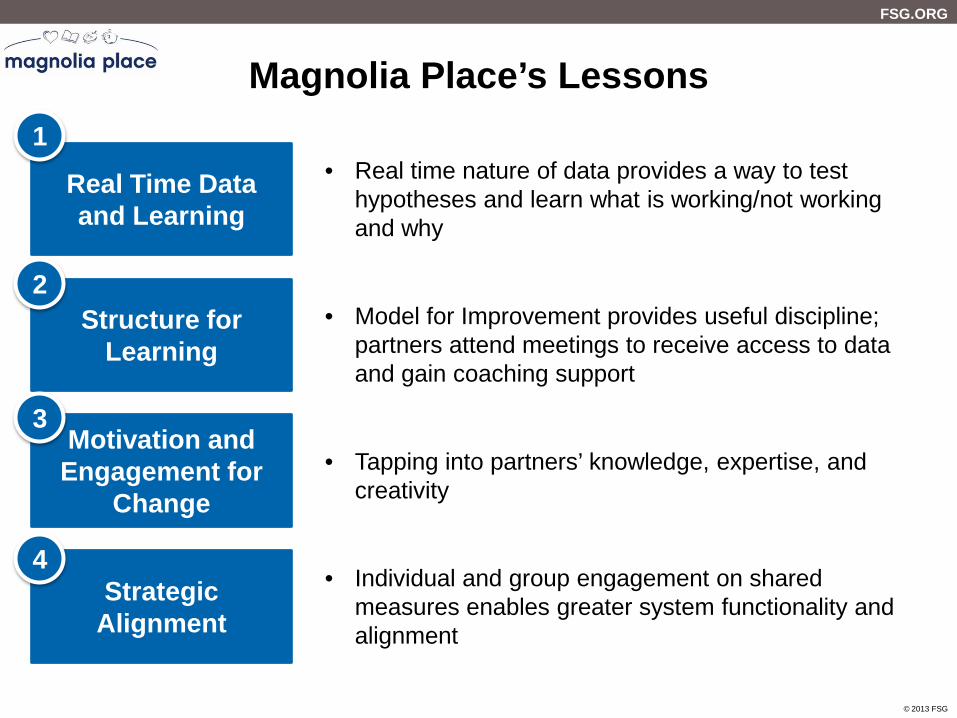
Magnolia Place’s Lessons
Real Time Data and Learning
• Real time nature of data provides a way to test hypotheses and learn what is working/not working and why
Structure for Learning
• Model for Improvement provides useful discipline; partners attend meetings to receive access to data and gain coaching support
Motivation and Engagement for
Change • Tapping into partners’ knowledge, expertise, and
creativity
Strategic Alignment
• Individual and group engagement on shared measures enables greater system functionality and alignment
1
2
4
3
FSG.ORG
© 2013 FSG
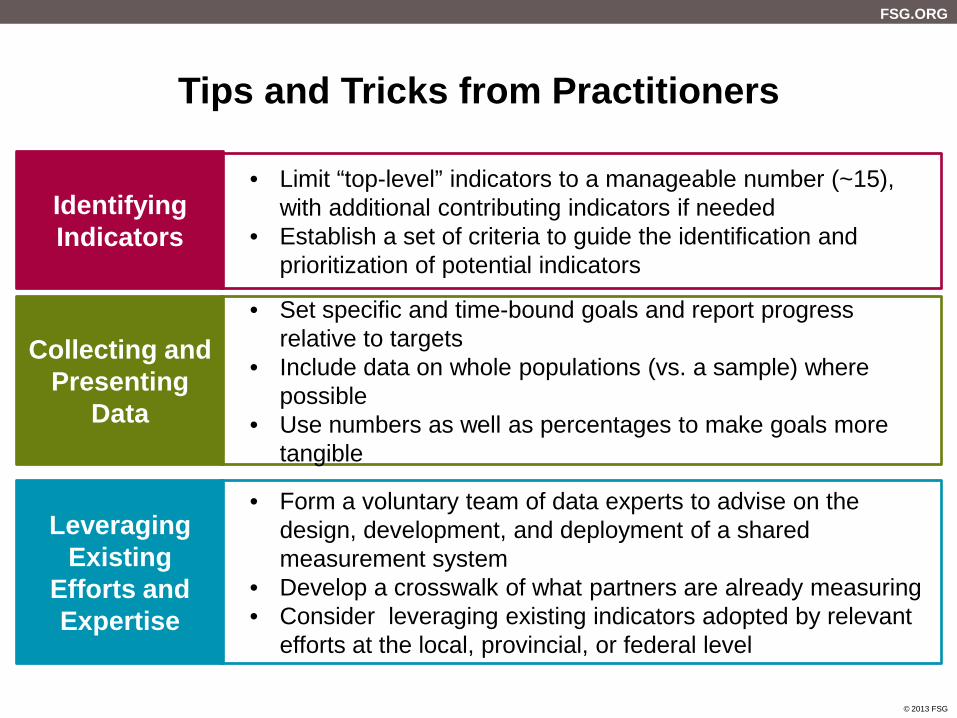
Tips and Tricks from Practitioners
Collecting and Presenting
Data
• Set specific and time-bound goals and report progress relative to targets
• Include data on whole populations (vs. a sample) where possible
• Use numbers as well as percentages to make goals more tangible
Identifying Indicators
• Limit “top-level” indicators to a manageable number (~15), with additional contributing indicators if needed
• Establish a set of criteria to guide the identification and prioritization of potential indicators
Leveraging Existing
Efforts and Expertise
• Form a voluntary team of data experts to advise on the design, development, and deployment of a shared measurement system
• Develop a crosswalk of what partners are already measuring • Consider leveraging existing indicators adopted by relevant
efforts at the local, provincial, or federal level
FSG.ORG
© 2013 FSG
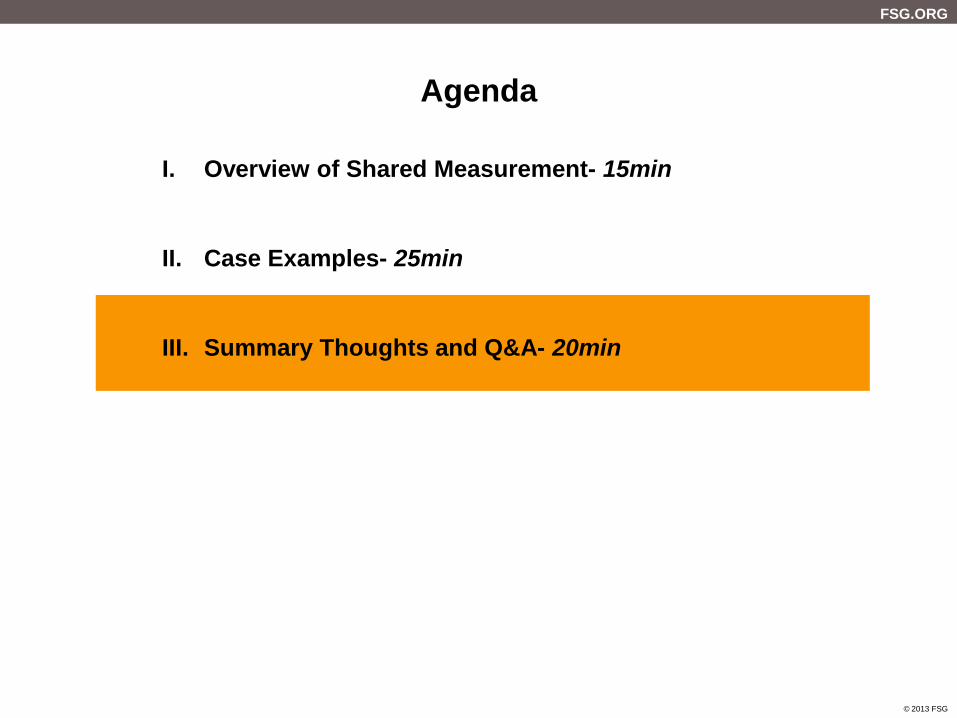
Agenda
I. Overview of Shared Measurement- 15min
II. Case Examples- 25min
III. Summary Thoughts and Q&A- 20min
FSG.ORG
27 © 2013 FSG
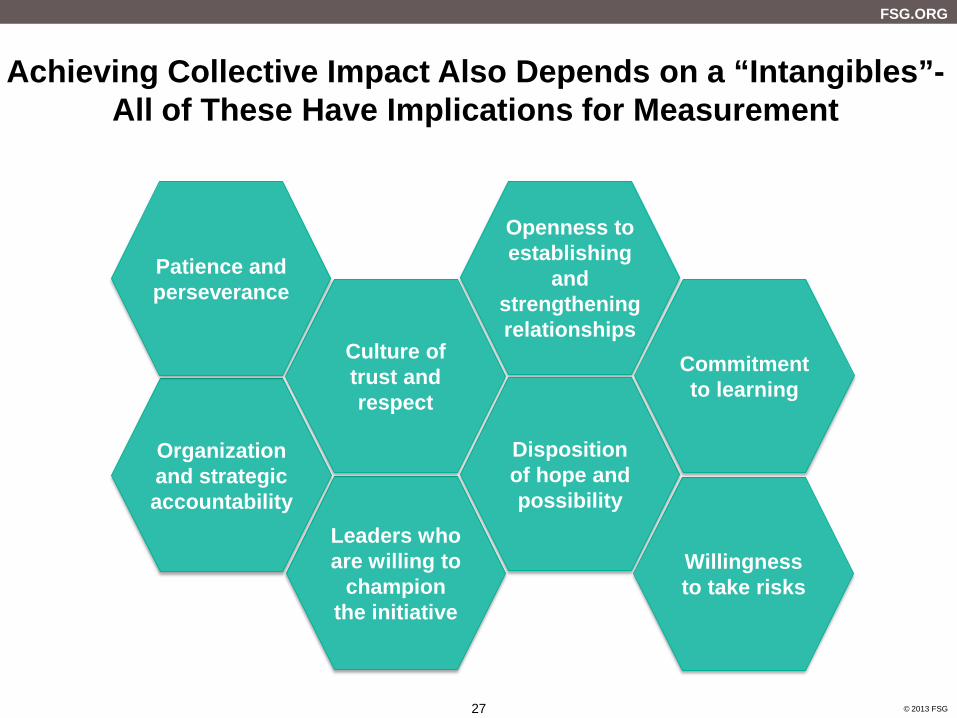
Achieving Collective Impact Also Depends on a “Intangibles”- All of These Have Implications for Measurement
Leaders who are willing to
champion the initiative
Openness to establishing
and strengthening relationships
Organization and strategic accountability
Willingness to take risks
Disposition of hope and possibility
Culture of trust and respect
Patience and perseverance
Commitment to learning
FSG.ORG
28 © 2013 FSG
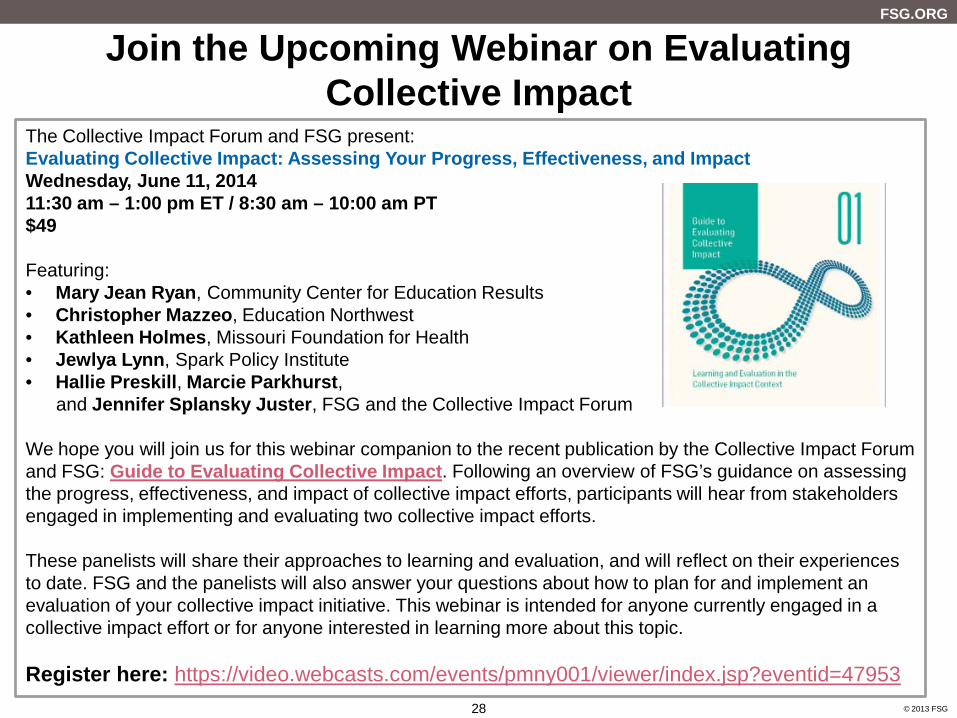
Join the Upcoming Webinar on Evaluating Collective Impact
The Collective Impact Forum and FSG present: Evaluating Collective Impact: Assessing Your Progress, Effectiveness, and Impact Wednesday, June 11, 2014 11:30 am – 1:00 pm ET / 8:30 am – 10:00 am PT $49 Featuring: • Mary Jean Ryan, Community Center for Education Results • Christopher Mazzeo, Education Northwest • Kathleen Holmes, Missouri Foundation for Health • Jewlya Lynn, Spark Policy Institute • Hallie Preskill, Marcie Parkhurst,
and Jennifer Splansky Juster, FSG and the Collective Impact Forum We hope you will join us for this webinar companion to the recent publication by the Collective Impact Forum and FSG: Guide to Evaluating Collective Impact. Following an overview of FSG’s guidance on assessing the progress, effectiveness, and impact of collective impact efforts, participants will hear from stakeholders engaged in implementing and evaluating two collective impact efforts. These panelists will share their approaches to learning and evaluation, and will reflect on their experiences to date. FSG and the panelists will also answer your questions about how to plan for and implement an evaluation of your collective impact initiative. This webinar is intended for anyone currently engaged in a collective impact effort or for anyone interested in learning more about this topic. Register here: https://video.webcasts.com/events/pmny001/viewer/index.jsp?eventid=47953
FSG.ORG
29 © 2013 FSG
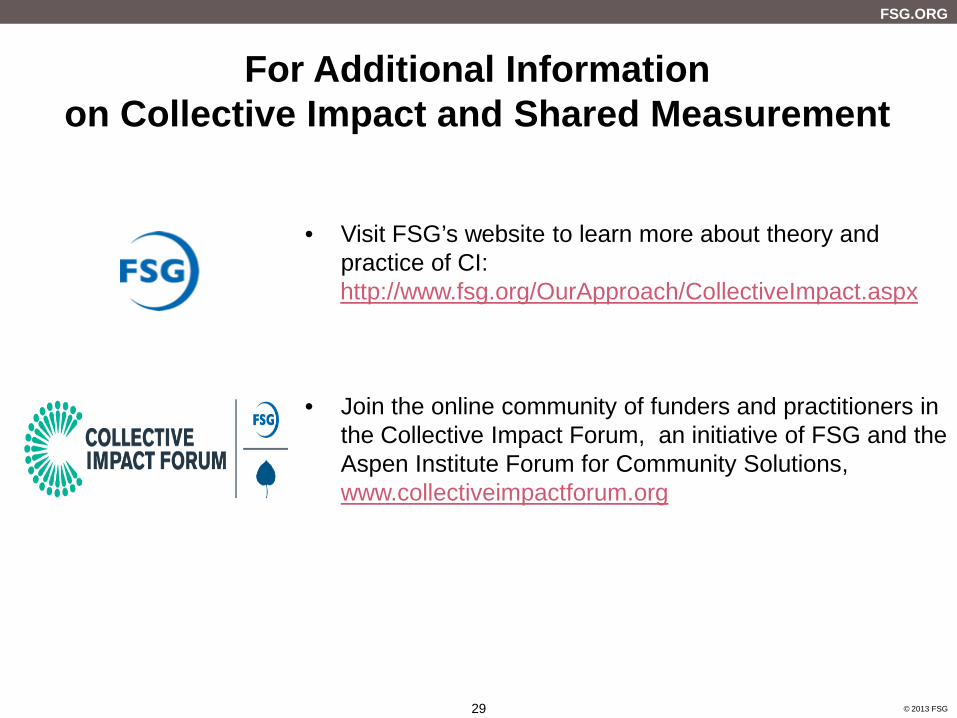
For Additional Information on Collective Impact and Shared Measurement
• Visit FSG’s website to learn more about theory and
practice of CI: http://www.fsg.org/OurApproach/CollectiveImpact.aspx
• Join the online community of funders and practitioners in the Collective Impact Forum, an initiative of FSG and the Aspen Institute Forum for Community Solutions, www.collectiveimpactforum.org
FSG.ORG
30 © 2013 FSG
Q&A