shape dependence of snow crystal fall speed
TRANSCRIPT

Atmos. Chem. Phys., 21, 7545–7565, 2021https://doi.org/10.5194/acp-21-7545-2021© Author(s) 2021. This work is distributed underthe Creative Commons Attribution 4.0 License.
Shape dependence of snow crystal fall speedSandra Vázquez-Martín1, Thomas Kuhn1, and Salomon Eliasson2
1Luleå University of Technology (LTU), Department of Computer Science, Electrical and Space Engineering,Division of Space Technology, 98 128, Kiruna, Sweden2Swedish Meteorological and Hydrological Institute (SMHI), 601 76, Norrköping, Sweden
Correspondence: Thomas Kuhn ([email protected])
Received: 9 October 2020 – Discussion started: 26 October 2020Revised: 27 February 2021 – Accepted: 4 March 2021 – Published: 18 May 2021
Abstract. Improved snowfall predictions require accurateknowledge of the properties of ice crystals and snow parti-cles, such as their size, cross-sectional area, shape, and fallspeed. The fall speed of ice particles is a critical parameterfor the representation of ice clouds and snow in atmosphericnumerical models, as it determines the rate of removal ofice from the modelled clouds. Fall speed is also requiredfor snowfall predictions alongside other properties such asice particle size, cross-sectional area, and shape. For exam-ple, shape is important as it strongly influences the scatteringproperties of these ice particles and thus their response to re-mote sensing techniques.
This work analyzes fall speed as a function of particle size(maximum dimension), cross-sectional area, and shape usingground-based in situ measurements. The measurements forthis study were done in Kiruna, Sweden, during the snowfallseasons of 2014 to 2019, using the ground-based in situ in-strument Dual Ice Crystal Imager (D-ICI). The resulting dataconsist of high-resolution images of falling hydrometeorsfrom two viewing geometries that are used to determine par-ticle size (maximum dimension), cross-sectional area, arearatio, orientation, and the fall speed of individual particles.The selected dataset covers sizes from about 0.06 to 3.2 mmand fall speeds from 0.06 to 1.6 m s−1.
Relationships between particle size, cross-sectional area,and fall speed are studied for different shapes. The data showin general low correlations to fitted fall speed relationshipsdue to large spread observed in fall speed. After binning thedata according to size or cross-sectional area, correlationsimprove, and we can report reliable parameterizations of fallspeed vs. particle size or cross-sectional area for part of theshapes. For most of these shapes, the fall speed is bettercorrelated with cross-sectional area than with particle size.
The effects of orientation and area ratio on the fall speed arealso studied, and measurements show that vertically orientedparticles fall faster on average. However, most particles forwhich orientation can be defined fall horizontally.
1 Introduction
The knowledge of the microphysical properties of atmo-spheric snow particles (ice crystals and snowflakes) is essen-tial to achieve accurate realistic parameterizations in atmo-spheric models (e.g., Stoelinga et al., 2003; Tao et al., 2003).Also, the accuracy of many different remote sensing applica-tions, such as cloud and precipitation retrievals from satellitepassive and active microwave measurements (Posselt et al.,2008; Zhang et al., 2009; Cooper and Garrett, 2010, and oth-ers), is highly dependent on the assumptions made on themicrophysical properties of snow particles. Some of thesecritical properties are particle size, particle size distribution,cross-sectional area, area ratio, shape, orientation, and fallspeed.
Several studies have classified snow crystal shape ac-cording to different classification schemes (Nakaya, 1954;Magono and Lee, 1966; Kikuchi et al., 2013; Vázquez-Martín et al., 2020). Particle shape is essential, not only forinvestigating growth processes but also because it affectsremote sensing measurements, for instance, radar measure-ments (e.g., Sun et al., 2011; Matrosov et al., 2012; Marc-hand et al., 2013) or passive measurements of microwavebrightness temperatures (Kneifel et al., 2010). Furthermore,it is of significant importance for optical remote sensing re-trievals of cloud properties (see, e.g., Yang et al., 2008; Baumet al., 2011; Xie et al., 2011; Loeb et al., 2018) and snow
Published by Copernicus Publications on behalf of the European Geosciences Union.

7546 S. Vázquez-Martín et al.: Shape dependence of snow crystal fall speed
albedo (e.g., Jin et al., 2008). The physical properties of snowparticles, including shape, govern their fall speed. For a givenvolume and density, non-spherical particles fall slower thanspheres (Haider, 1989). At the same size, shape variationsaccount for spread in fall speed, which causes variations inother properties such as the vertical mass flux of water (Dun-navan, 2021). Therefore, also the particle shape is an impor-tant parameter to ensure accurate cloud parameterizations inclimate and forecast models (e.g., Stoelinga et al., 2003; Taoet al., 2003), and for the understanding of precipitation incold climates.
Together with particle size and shape, the snow particleorientation also plays a significant role. It is highly depen-dent on the local aerodynamic conditions (Pruppacher andKlett, 1997), and significant uncertainties regarding particleorientation remain, especially for rimed particles and aggre-gates (Xie et al., 2012; Jiang et al., 2019). The particle ori-entation determines its horizontal cross-sectional area andinfluences its drag and therefore its fall speed. Particle ori-entation also affects the bulk scattering properties of clouds(Yang et al., 2008, 2011). For instance, for microwave radia-tion, particle orientation significantly affects the radar reflec-tivity (e.g., Sun et al., 2011; Gergely and Garrett, 2016) and,due to its sizable impact on absorption (e.g., Foster et al.,2000), strongly modulates the microwave brightness temper-ature (Xie and Miao, 2011; Xie et al., 2015).
The fall speed of snow crystals plays a significant rolein modeling microphysical precipitation processes (Schefoldet al., 2002) and for climate since it determines the lifetimeof cirrus clouds, and thus the cloud coverage and ice wa-ter path (Mitchell et al., 2008), and the top-of-atmosphereradiation budget (Westbrook and Sephton, 2017). Addition-ally, fall speed determines the snowfall rate, i.e., the rate ofparticle removal from clouds. The precipitation rate is pro-portional to the fall speed of the particles, implying quan-titative forecasts of this variable require accurate snowflakefall speeds (Westbrook and Sephton, 2017). Therefore, it isessential to know particle size, shape, and fall speed simulta-neously.
Earlier studies have used different methods to investigateand parameterize the dependence of fall speed on snow parti-cle size. Most parameterizations can be given as a power lawwith general form v = aD ·D
bD , where v is the fall speed,D is the particle size, and aD , bD are constant coefficients.This power-law relationship is often adopted because it fa-cilitates analytical solutions in models, for instance, for cal-culations of Doppler velocity, and appears in many studies(e.g., Locatelli and Hobbs, 1974; Heymsfield and Kajikawa,1987; Mitchell, 1996; Barthazy and Schefold, 2006; Yuteret al., 2006; Brandes et al., 2008; Heymsfield and Westbrook,2010; Zawadzki et al., 2010; Lee et al., 2015). The depen-dence of fall speed on particle cross-sectional area is alsoreadily represented as a power law, v = aA ·AbA , where v isthe fall speed, A is the cross-sectional area, and aA, bA areconstant coefficients (e.g., Kuhn and Gultepe, 2016; Kuhn
and Vázquez-Martín, 2020). In a few studies, different func-tions are used to describe relationships. For example, Bart-hazy and Schefold (2006) showed that an exponential func-tion that asymptotically approaches a constant speed at largersizes could also be used to describe the size dependence offall speed, in particular for particles larger than about 3 mm.
This study analyzes the fall speed relationships of snowparticles as a function of particle size and cross-sectionalarea based on a dataset of falling natural snow particles thathave been collected in Kiruna in northern Sweden with theground-based Dual Ice Crystal Imager (D-ICI) instrumentpresented in Kuhn and Vázquez-Martín (2020). Section 2 de-scribes the measurements and methods used to classify thesnow particle shape and determine their size, cross-sectionalarea, and fall speed. Section 3 investigates the influence ofthe particle shape on relationships between fall speed andparticle size or cross-sectional area. Furthermore, we exam-ine the dependence of fall speed on area ratio and particle ori-entation. These results are then compared to previous studies.Finally, this study is summarized and concluded in Sect. 4.
2 Methods
2.1 Measurements and instrument
Our measurements are carried out in Kiruna, Sweden(67.8◦ N, 20.4◦ E, at approximately 400 m above sea level),at a site described in Vázquez-Martín et al. (2020), using D-ICI, the ground-based in situ instrument described in Kuhnand Vázquez-Martín (2020). D-ICI captures and records dualimages of falling snow crystals and other hydrometeors. De-tected particles are imaged simultaneously from two differ-ent viewing directions. One is horizontal, recording a sideview, and one is close to vertical, recording a top view. Fromthe top-view image, we can determine particle size, cross-sectional area, and area ratio. From the side-view image,since it is exposed twice, we can determine fall speed (seeSect. 2.2).
These images have a high optical resolution of about10 µm, and one pixel corresponds to 3.7 µm. This resolutionallows for the identification of snow particles even smallerthan 0.1 mm. The additional information that dual imagesprovide improves the shape classification carried out by look-ing at both top- and side-view images. The particles areclassified according to their shape and sorted into 15 shapegroups, as described in Vázquez-Martín et al. (2020).
More than 10 000 particles have been recorded duringmultiple snowfall seasons, the winters of 2014/2015 to2018/2019. Each winter season at the Kiruna site lasts ap-proximately from the beginning of November to the middleof May. Part of these data from 2014 to 2018 were selected tocarry out this work. During image processing (see Sect. 2.2),we only consider particles that are entirely in the field ofview (FOV) and that are not significantly tumbling (for a
Atmos. Chem. Phys., 21, 7545–7565, 2021 https://doi.org/10.5194/acp-21-7545-2021

S. Vázquez-Martín et al.: Shape dependence of snow crystal fall speed 7547
detailed description, see Kuhn and Vázquez-Martín, 2020).Furthermore, the ambient wind speed is taken into account.As mentioned in Kuhn and Vázquez-Martín (2020), higherwind speeds may alter fall speed measurements. Therefore,data taken at averaged wind speeds higher than 3 m s−1 areexcluded. The Swedish Meteorological and Hydrological In-stitute (SMHI) weather data (SMHI, 2020), based on instru-ments at the Kiruna airport, are recorded 6 km away fromour measurement site and provide the wind speed data usedin this study. After excluding FOV and tumbling problems,about 3200 particles remained. Of these, 23 % were mea-sured at wind speeds higher than 3 m s−1, leaving a total of2461 particles to form our dataset.
2.2 Snow properties
Figure 1 shows two different snow particles from the side(right) and top views (left). The images from the top vieware used to determine particle size, cross-sectional area, andarea ratio by the automated process presented in Kuhn andVázquez-Martín (2020). For this, first, the background fea-tures are removed; then the in-focus particles are detectedand their boundaries traced. Consequently, the particle prop-erties, such as particle size, cross-sectional area, and area ra-tio, can be determined. As we have described in Vázquez-Martín et al. (2020), the maximum dimension,Dmax, definedas the smallest diameter that completely encircles the particleboundary in the top-view image, is used to describe the par-ticle size. Thus, in the following, particle size and maximumdimension are used synonymously. The cross-sectional area,A, is defined as the area in the top-view image enclosed bythe particle boundary based on pixel count. Once the particlesize and cross-sectional area are determined, the area ratioArcan be also calculated from these quantities:
Ar =A
π4 ·D
2max
. (1)
The aerodynamic drag, which chiefly governs fall speed,mostly depends on the quantitiesDmax, A, and Ar, which areretrieved using images that view the particles from above (inthe falling direction) as done by D-ICI, rather than from ahorizontal viewing direction as done by other instruments.Furthermore, this view is more suitable to enable compari-son with remote sensing measurements that often also have avertical viewing geometry.
The side-view images are exposed twice to enable fallspeed measurements so that both particle exposures are dis-played in the same image (Fig. 1, right). These particle expo-sures correspond to the first and second positions, respec-tively, of the particle when falling. In our data, the two-particle exposures in the side-view images might be partlyoverlapping due to a combination of fall speed and size ofthe particle. Figure 1a shows an example of non-overlappingparticles, whereas, in Fig. 1b, the particles are partly overlap-
Figure 1. Two particle examples (a–b). Left: top-view images.Right: side-view images, which are exposed twice to enable fallspeed measurements. Both viewing geometries are used to classifythe particle shape. In both examples, two pairs of points (P1, P3 andP2, P4) were selected to determine the fall speed.
ping. In both cases, a manual procedure is carried out for thefall speed determination, which is described in the following.
At least two points of the particle need to be selected, forinstance, the left and right edges of the particle (P1 and P3 inFig. 1, right). The same points are found by eye on the secondexposure (P2 and P4 in Fig. 1, right). The falling distance isthen the average of the Euclidean distances between P1 andP2, and between P3 and P4, and the fall speed is this fallingdistance divided by the time between exposures. These fallspeeds are reported as they are measured at our local condi-tions and are not corrected to, for example, sea level pressure,which would only change values by less than 3 %.
By selecting at least two points on each particle to deter-mine fall speed, one can notice differences of the fall speedacross the particle. If there is no difference, then the particleis falling straight. If there is a difference, then the particleis tumbling; i.e., it has a rotating motion in addition to thestraight falling motion. Tumbling is most noticeable if therotation is around an axis perpendicular to the imaging plane.
When rotating around an axis parallel to the imagingplane, it may be challenging to select the same points onthe second exposure. Particle images where it is difficult toidentify the same points on both exposures, or when signif-icant tumbling is apparent, are excluded. The tumbling limitis when the speed of the points differs by more than ±10 %from the mean speed. However, tumbling is not observed fre-quently in our dataset. Figure 2 shows different side-viewimages of particles included and excluded from the analy-sis, respectively. In Fig. 2a–d, the particles are not, or areonly slightly, tumbling, and therefore they are included inthe analysis. In Fig. 2e–h, the particles are tumbling signifi-
https://doi.org/10.5194/acp-21-7545-2021 Atmos. Chem. Phys., 21, 7545–7565, 2021

7548 S. Vázquez-Martín et al.: Shape dependence of snow crystal fall speed
Figure 2. Panels (a)–(h) show eight examples of different parti-cles with side-view images. Panels (a)–(d) show particles that wereincluded in the analysis. Panels (e)–(h) show particles that were ex-cluded since the two-particle exposures revealed significant tum-bling.
cantly. Consequently, these particles were discarded and notincluded in the analysis.
3 Results and discussions
3.1 Cross-sectional area
For this study, we use a large subset of the data fromVázquez-Martín et al. (2020). Although we excluded mea-surements with higher wind speeds than 3 m s−1, the cross-sectional areas as a function of particle size are nonethe-less very similar here to results presented in Vázquez-Martínet al. (2020). However, for completeness, we briefly analyzeand discuss the cross-sectional area vs. particle size, A vs.Dmax, for all the shape groups in this section. Table 1 showsthese results, along with the metadata on the particle groups,including their full names. For simplicity, we will use shorternames from here on (see, e.g., in Table 2). As seen in Table 1,generally, particle size and cross-sectional area are very wellcorrelated (R2 > 0.7) if expressed by the power law
A(Dmax)= a ·
(Dmax
1 mm
)b, (2)
where the parameter a corresponds to the cross-sectional areaat Dmax = 1 mm and b is the exponent in the power law.
Figure 3 shows these fitted A vs. Dmax relationships. Wenote that shape groups (1) Needles, (2) Crossed needles, and(3) Thick columns are the groups with the lowest values ofparameter b that are close to 1. For these groups, this is un-derstandable from their morphology. An increase in A pri-marily follows an increase in Dmax (needle length), rather
Figure 3. Cross-sectional area vs. particle size (A vs. Dmax) rela-tionships are shown in logarithmic scale for all the shape groups(solid lines) and all data (dashed black line). The median Dmax ofthe data is represented as a single point on each line. The length ofthe fit lines is defined by 16th and 84th percentiles of Dmax. For alegend of the shape groups, see Fig. 5. For comparison, the cross-sectional area of spheres given by (π/4)·D2
max is shown as a dashedgray line.
than in both Dmax and the diameter (needle width). The lowvalues of b also explain why the area ratio, Ar, decreasesmost rapidly with increasing Dmax for these shape groups,which can be seen if one expresses Ar as a power law inDmax (inserting Eq. 2 into 1),
Ar =4π·
a
1mm2 ·
(Dmax
1mm
)b−2
, (3)
as the exponent in this power law is b−2. It is also evidentin Fig. 4, which shows these power laws for all shape groupsdetermined from Eq. (3), and the coefficients given in Ta-ble 1.
For most other shape groups, the coefficient b varies be-tween 1.4 and 1.8. Only for the groups (12) Graupel and(15) Spherical is it larger with b = 2.0, which is the expectedtheoretical value for spherical shapes. Thus, apart from (15)Spherical, (12) Graupel is the only shape group where Arremains constant with increasing Dmax.
The fitted relationships for all particles (regardless ofshape) also appear in Figs. 3 and 4 for A vs.Dmax and Ar vs.Dmax, respectively. They represent a kind of average; how-ever, they do not seem to be a good approximation for mostof the shapes.
3.2 Fall speed relationships
Analysis of the shape dependence of fall speed (see Fig. 5)shows that shape groups (7) Bullet rosettes and (12) Grau-pel have the fastest fall speeds with a median value of v '0.6 m s−1, followed by shape groups (4) Capped columns,(9) Side planes, (11) Spatial stellar, (14) Irregulars, and (15)
Atmos. Chem. Phys., 21, 7545–7565, 2021 https://doi.org/10.5194/acp-21-7545-2021

S. Vázquez-Martín et al.: Shape dependence of snow crystal fall speed 7549
Table 1. Cross-sectional area vs. particle size (A vs. Dmax) relationships fitted to a power law given by Eq. (2) for each shape group and forall data, i.e., for all the particles regardless of shape. The number of particles N , the ranges of Dmax and A (min, max), the parameters a andb with their respective uncertainties, and the correlation coefficients R2 are shown for each shape group and all data. The root-mean-squareerror (RMSE) values of base-10 logarithms of measured A vs. predicted A are also shown to indicate the uncertainty of these power laws.Note that RMSE values of logarithms of Ar as determined from measurements using Eq. (1) vs. predicted values using Eq. (3) are the same.
Shape groups (1–15) N Dmax [mm] A [mm2]A vs. Dmax
a [mm2] b R2 RMSE
(1) Needles and thin or long columns 317 0.27–3.0 0.03–0.7 0.15± 0.01 1.06± 0.03 0.79 0.11(2) Crossed needles and crossed columns 66 0.57–2.6 0.10–0.7 0.18± 0.04 1.01± 0.08 0.70 0.10(3) Thick columns and bullets 103 0.16–0.9 0.02–0.2 0.17± 0.04 1.24± 0.05 0.88 0.09(4) Capped columns and capped bullets 189 0.28–2.1 0.02–1.3 0.32± 0.03 1.60± 0.06 0.79 0.15(5) Plates 197 0.21–1.7 0.03–1.3 0.45± 0.03 1.71± 0.03 0.93 0.09(6) Stellar crystals 43 0.54–2.3 0.13–1.9 0.40± 0.07 1.59± 0.15 0.75 0.12(7) Bullet rosettes 41 0.54–1.5 0.12–0.8 0.35± 0.04 1.62± 0.12 0.83 0.10(8) Branches 438 0.27–2.9 0.03–3.4 0.32± 0.01 1.74± 0.03 0.86 0.12(9) Side planes 350 0.29–2.7 0.04–2.7 0.37± 0.01 1.77± 0.04 0.87 0.09(10) Spatial plates 48 0.30–1.3 0.06–0.6 0.42± 0.05 1.62± 0.10 0.85 0.09(11) Spatial stellar crystals 185 0.36–2.8 0.06–2.9 0.40± 0.01 1.76± 0.03 0.95 0.08(12) Graupel 37 0.25–1.2 0.03–0.8 0.51± 0.04 1.99± 0.05 0.98 0.05(13) Ice and melting or sublimating particles 60 0.13–1.2 0.01–0.3 0.23± 0.09 1.45± 0.07 0.87 0.12(14) Irregulars and aggregates 346 0.21–3.2 0.02–2.7 0.34± 0.02 1.65± 0.03 0.91 0.13(15) Spherical particles 41 0.06–0.4 0.003–0.15 0.80± 0.02 2.04± 0.01 1.00 0.01
All data 2461 0.06–3.2 0.003–3.4 0.30± 0.01 1.54± 0.01 0.81 0.18
Figure 4. Area ratio vs. particle size (Ar vs. Dmax) relationshipsare shown in logarithmic scale for all the shape groups (solid lines)and all data (dashed black line). The median Dmax of the data isrepresented as a single point on each line. The length of the fit linesis defined by 16th and 84th percentiles ofDmax. For a legend of theshape groups, see Fig. 5.
Spherical with a median fall speed value of v ' 0.5 m s−1.The median of all data is approximately 0.43 m s−1, and mostshape groups have their median within ±0.08 m s−1 fromthis value. Shape groups (1) Needles, (2) Crossed needles,and (3) Thick columns have the lowest median values of0.34 m s−1 or less.
3.2.1 Fitting to individual data: Ma
Fall speed vs. particle size (v vs. Dmax) and fall speed vs.cross-sectional area (v vs. A) relationships are useful to pa-rameterize fall speed. In order to find the v vs.Dmax relation-ships on the data, one can apply a power-law fit given by
v(Dmax)= aD ·
(Dmax
1 mm
)bD. (4)
The parameters aD and bD are determined from linear fits tothe data expressed as logarithm of v vs. logarithm of Dmax.The v vs. A relationships result from fitting data to a powerlaw given by
v(A)= aA ·
(A
1 mm2
)bA. (5)
The parameters aA and bA are determined from linear fits tothe data expressed as log(v) vs. log(A). This method of fit-ting to individual data is further referred to as Ma. As anexample, we look at shape group (5) Plates, representinga commonly occurring shape that has clear results. The in-dividual data points of the measured fall speeds appear inFig. 6. It also shows the 68 % prediction band, which de-scribes the region of where to expect 68 % of any new mea-surements. The prediction band can be considered a measureof the spread of the data around the fit line, which appears inthe same color as the individual data points.
The large spread in fall speed apparent from Fig. 6 resultsin a low correlation to the fit functions. The results for this
https://doi.org/10.5194/acp-21-7545-2021 Atmos. Chem. Phys., 21, 7545–7565, 2021

7550 S. Vázquez-Martín et al.: Shape dependence of snow crystal fall speed
Figure 5. The fall speeds v of snow crystals for each shape group are shown in solid lines. The median and the distribution of v are shown.The values of the median are represented by points. The lower and upper ends of the vertical bars indicating the distributions are given bythe 16th and 84th percentiles, respectively. These bounds would correspond to ±1σ (standard deviation) if the distribution was normal. Forcomparison, a dashed black line shows all data (regardless of shape). Table 2 contains a list of these percentiles and medians.
Figure 6. Fall speed vs. particle size (v vs. Dmax) and fall speed vs. cross-sectional area (v vs. A) relationships for shape group (5) Plates.Individual data (brown symbols) and binned data (blue symbols with error bars) are displayed. Median values in the respective bins representthe binned data. The total length of the error bars represents the spread in fall speed data, which is given by the difference between the 16thand 84th percentiles. Fits that apply to individual data (Ma) and to binned data (Mb) are shown for comparison. The 68 % prediction bandsfor both fits (Ma, Mb) are shown. The 68 % confidence region is shown for Mb. (a) v vs. Dmax relationship given by Eq. (4). (b) v vs. Arelationship given by Eq. (5). The same data are shown in Table 3 for v vs. Dmax and in Table 4 for v vs. A.
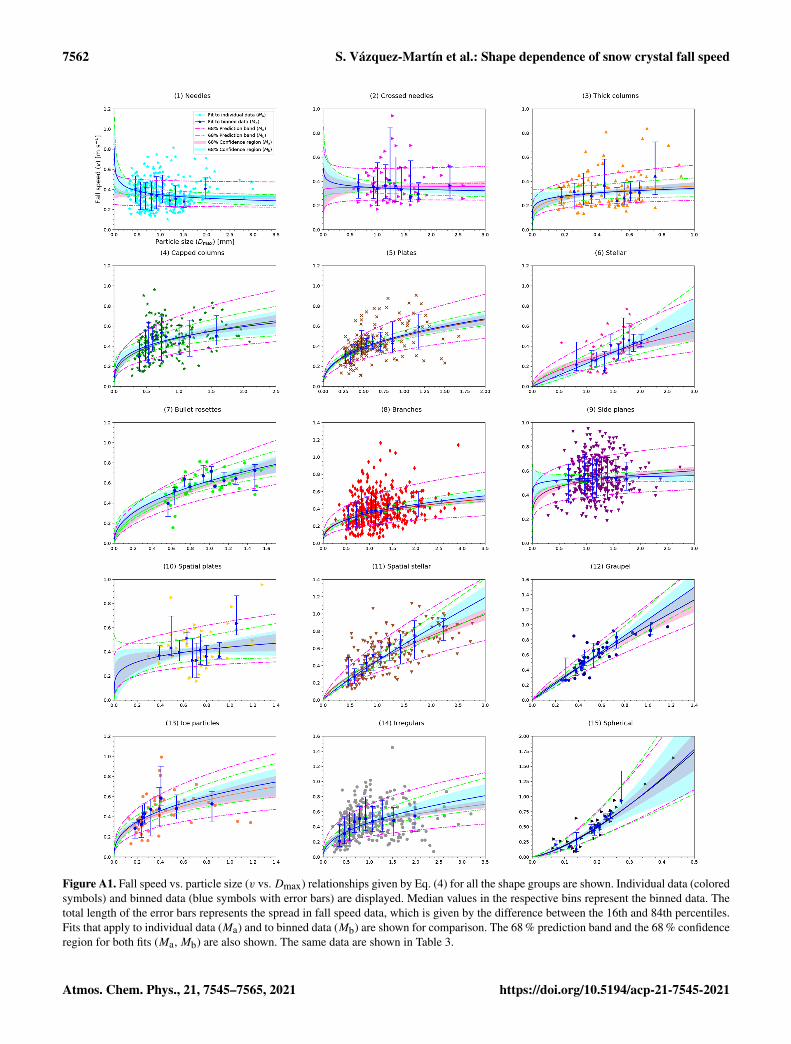
shape group represent the general features found in all shapegroups, i.e., a large spread in fall speed data and relativelylow R2 for Ma. The v vs. Dmax and v vs. A relationshipsfor all the shape groups are shown in Figs. A1–A2 (see Ap-pendix A). Tables 3 and 4 show these results for v vs. Dmaxand for v vs. A, respectively. The only exceptions from thegenerally low correlations are shape groups (11) Irregulars,(12) Graupel, and (15) Spherical withR2 > 0.5. For all othershape groups, the correlation coefficients forMa are R2.0.2for both v vs. Dmax and v vs. A. Judging by these low R2
values, it is uncertain if the fit functions are representative ofthe measured data.
3.2.2 Fitting to binned data: Mb
The spread of fall speed data is due to several factors such asparticle orientation and specific shape, and binning the datashould reduce the spread to some extent. Therefore, to im-prove the correlation, the data are first binned into 10 particlesize or cross-sectional area bins before fitting to Eqs. (4) and(5), respectively, where each bin contains as close to the samenumber of particles as possible. Therefore, the bin widths arevariable and specific to each shape group and thereby avoidthe problem of individual bins having a disproportional ef-fect on the fit. The number of bins (10) is a compromise:
Atmos. Chem. Phys., 21, 7545–7565, 2021 https://doi.org/10.5194/acp-21-7545-2021

S. Vázquez-Martín et al.: Shape dependence of snow crystal fall speed 7551
Table 2. Fall speed, v, for the shape groups. The fall speed range,median, and 16th and 84th percentiles are displayed. For compari-son, results for all the data, regardless of shape, are also shown.
Shape groups (1–15)v [m s−1]
Range Median 16th 84th
(1) Needles 0.10–0.8 0.34 0.23 0.48(2) Crossed needles 0.17–0.9 0.34 0.25 0.51(3) Thick columns 0.14–0.8 0.30 0.21 0.45(4) Capped columns 0.11–1.0 0.48 0.30 0.62(5) Plates 0.11–0.9 0.39 0.29 0.51(6) Stellar 0.13–0.8 0.39 0.19 0.53(7) Bullet rosettes 0.15–0.8 0.59 0.49 0.73(8) Branches 0.06–1.2 0.37 0.23 0.56(9) Side planes 0.19–0.9 0.53 0.40 0.71(10) Spatial plates 0.16–1.0 0.40 0.30 0.57(11) Spatial stellar 0.13–1.1 0.50 0.27 0.74(12) Graupel 0.26–1.0 0.57 0.35 0.86(13) Ice particles 0.13–1.0 0.41 0.29 0.58(14) Irregulars 0.06–1.5 0.45 0.23 0.67(15) Spherical 0.09–1.6 0.50 0.18 0.74
All data 0.06–1.6 0.43 0.26 0.63
a small enough number of bins to contain enough particlesper bin and a large enough number of bins to allow for agood fit to the measurements. The binned data consist of themedian values in each bin, i.e., median fall speeds vs. me-dian maximum dimensions and median fall speeds vs. me-dian cross-sectional areas. This method of fitting to binneddata is further referred to asMb. The apparent randomness infall speed, manifested as the wide spread in data, may haveseveral reasons. While instrumental uncertainties and errorsintroduced by the manual analysis (see Kuhn and Vázquez-Martín, 2020) contribute to the variability, much of the ob-served randomness is likely inherent to the data. For exam-ple, Dunnavan (2021) showed that aggregate snowflakes’ fallspeed is very sensitive to shape. Other studies have also re-ported a wide spread and used a similar method of binningfall speed before data fitting (e.g., Barthazy and Schefold,2006; Zawadzki et al., 2010). Shape and orientation affectthe fall speed, since they are responsible for the drag force.Within most shape groups, there is still a wide variety of dif-ferent shapes. In addition, for any particle shape, the orienta-tion may also contribute to the spread in data.
Since the binned data are based on the individual data, thefits obtained from the binned data (Mb) should be consistentwith the fits based on the individual data (Ma). If so, and,in particular, when R2 for Mb is high, the fits are deemedrepresentative of the given shape group. If R2 remains lowafter binning, it implies that no reliable relationship could befound. This may indicate that no adequate fit exists for thatparticular shape group, or it may be the consequence of toomuch spread in the fall speed data obscuring any relationship.
For example, Fig. 6 shows the binned data of shape group (5)Plates and the corresponding fit, which closely matches thefit to Ma. After binning, the correlation coefficients, whichfor clarity are denoted R2
D and R2A for the fits to v vs. Dmax
and v vs. A relationships, respectively, are much higher withR2D ' 0.88 (Table 3) and R2
A ' 0.88 (Table 4). Therefore,for this shape group, the fits Mb can be considered represen-tative.
The methodMa fits agree withMb fits for all shape groupsif considering confidence regions (see Figs. A1 and A2 inAppendix A). To judge if the relationships are reliable or not,the correlation coefficients R2
D (v vs. Dmax) and R2A (v vs.
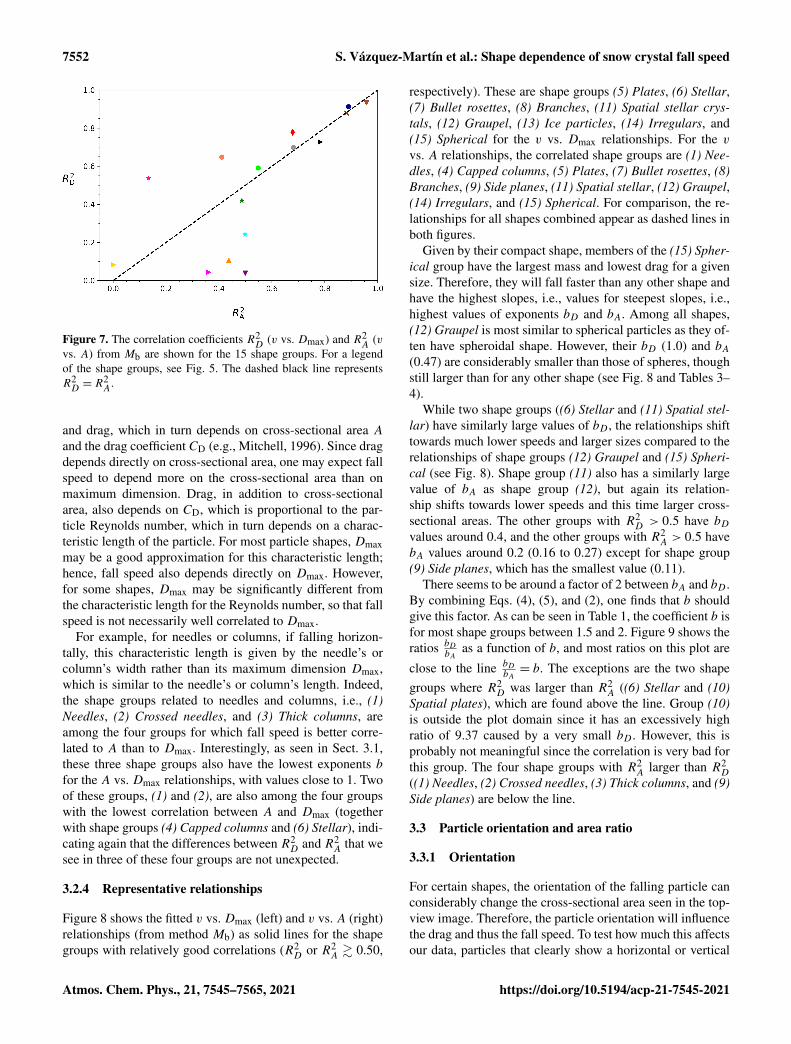
A) for Mb will be considered too. They are plotted in Fig. 7,which shows that the correlation coefficients of 7 out of 15groups improve past 0.5 in Mb for both R2
D and R2A (see Ta-
bles 3 and 4), including three shape groups with a very highcorrelation to their fit (both R2
D&0.9 and R2A&0.9), namely
groups (5) Plates, (11) Spatial stellar, and (12) Graupel.The other groups with both correlation coefficients R2
D andR2A > 0.5 are (7) Bullet rosettes, (8) Branches, (14) Irregu-
lars, and (15) Spherical. For the other eight shape groups,one of or both R2
D and R2A remain below 0.5. Therefore, for
these groups, no solid relationship could be found for v vs.Dmax, or v vs. A, or both.
3.2.3 Comparing size and cross-sectional areadependencies
For the seven groups with good correlations, R2D and R2
A aresimilar (see also Fig. 7). As discussed in Sect. 3.1, particlesize and cross-sectional area are very well correlated, so thisis expected. Only for two of the other eight groups are thevalues of R2
D and R2A similar. While for shape group (4)
Capped columns binning the data made a similar improve-ment to both R2
D and R2A, increasing the correlation towards
0.5, for (10) Spatial plates, both R2D and R2
A remain verylow for Mb. For the remaining six groups, there is a notice-able difference between R2
D and R2A. On the one hand, shape
groups (6) Stellar and (13) Ice particles have improved theircorrelation coefficients R2
D to above 0.5 but without an im-provement in R2
A. On the other hand, groups (1) Needles,(2) Crossed needles, (3) Thick columns, and (9) Side planeshave R2
A values that are significantly larger than the respec-tive R2
D values. For example, shape group (1) Needles hasR2D = 0.24 and R2
A = 0.50, and (3) Thick columns has R2D
= 0.11 and R2A = 0.44. For the groups (2) Crossed needles
and (9) Side planes, the difference between R2D and R2
A ismost pronounced with no improvement in R2
D but moderatevalues for R2
A of 0.36 and 0.50, respectively.The results discussed above show that among these groups
with a noticeable difference between R2D and R2
A, more havelarger R2
A (four groups) than larger R2D (two groups); i.e.,
more have better v vs. A correlation than v vs. Dmax. Par-ticles are falling at a speed for which gravitational and dragforces are in equilibrium; i.e., fall speed depends on mass
https://doi.org/10.5194/acp-21-7545-2021 Atmos. Chem. Phys., 21, 7545–7565, 2021
7552 S. Vázquez-Martín et al.: Shape dependence of snow crystal fall speed
Figure 7. The correlation coefficients R2D
(v vs. Dmax) and R2A
(vvs. A) from Mb are shown for the 15 shape groups. For a legendof the shape groups, see Fig. 5. The dashed black line representsR2D= R2
A.
and drag, which in turn depends on cross-sectional area Aand the drag coefficient CD (e.g., Mitchell, 1996). Since dragdepends directly on cross-sectional area, one may expect fallspeed to depend more on the cross-sectional area than onmaximum dimension. Drag, in addition to cross-sectionalarea, also depends on CD, which is proportional to the par-ticle Reynolds number, which in turn depends on a charac-teristic length of the particle. For most particle shapes, Dmaxmay be a good approximation for this characteristic length;hence, fall speed also depends directly on Dmax. However,for some shapes, Dmax may be significantly different fromthe characteristic length for the Reynolds number, so that fallspeed is not necessarily well correlated to Dmax.
For example, for needles or columns, if falling horizon-tally, this characteristic length is given by the needle’s orcolumn’s width rather than its maximum dimension Dmax,which is similar to the needle’s or column’s length. Indeed,the shape groups related to needles and columns, i.e., (1)Needles, (2) Crossed needles, and (3) Thick columns, areamong the four groups for which fall speed is better corre-lated to A than to Dmax. Interestingly, as seen in Sect. 3.1,these three shape groups also have the lowest exponents bfor the A vs. Dmax relationships, with values close to 1. Twoof these groups, (1) and (2), are also among the four groupswith the lowest correlation between A and Dmax (togetherwith shape groups (4) Capped columns and (6) Stellar), indi-cating again that the differences between R2
D and R2A that we
see in three of these four groups are not unexpected.
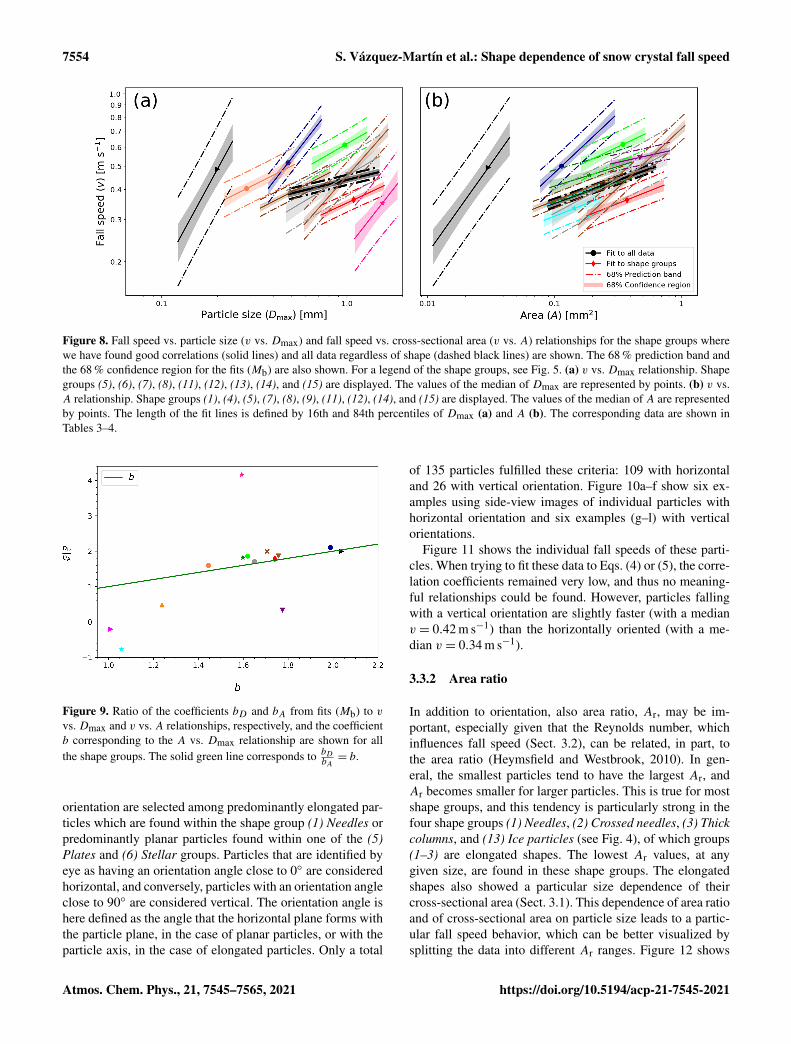
3.2.4 Representative relationships
Figure 8 shows the fitted v vs. Dmax (left) and v vs. A (right)relationships (from method Mb) as solid lines for the shapegroups with relatively good correlations (R2
D or R2A & 0.50,
respectively). These are shape groups (5) Plates, (6) Stellar,(7) Bullet rosettes, (8) Branches, (11) Spatial stellar crys-tals, (12) Graupel, (13) Ice particles, (14) Irregulars, and(15) Spherical for the v vs. Dmax relationships. For the vvs. A relationships, the correlated shape groups are (1) Nee-dles, (4) Capped columns, (5) Plates, (7) Bullet rosettes, (8)Branches, (9) Side planes, (11) Spatial stellar, (12) Graupel,(14) Irregulars, and (15) Spherical. For comparison, the re-lationships for all shapes combined appear as dashed lines inboth figures.
Given by their compact shape, members of the (15) Spher-ical group have the largest mass and lowest drag for a givensize. Therefore, they will fall faster than any other shape andhave the highest slopes, i.e., values for steepest slopes, i.e.,highest values of exponents bD and bA. Among all shapes,(12) Graupel is most similar to spherical particles as they of-ten have spheroidal shape. However, their bD (1.0) and bA(0.47) are considerably smaller than those of spheres, thoughstill larger than for any other shape (see Fig. 8 and Tables 3–4).
While two shape groups ((6) Stellar and (11) Spatial stel-lar) have similarly large values of bD , the relationships shifttowards much lower speeds and larger sizes compared to therelationships of shape groups (12) Graupel and (15) Spheri-cal (see Fig. 8). Shape group (11) also has a similarly largevalue of bA as shape group (12), but again its relation-ship shifts towards lower speeds and this time larger cross-sectional areas. The other groups with R2
D > 0.5 have bDvalues around 0.4, and the other groups with R2
A > 0.5 havebA values around 0.2 (0.16 to 0.27) except for shape group(9) Side planes, which has the smallest value (0.11).
There seems to be around a factor of 2 between bA and bD .By combining Eqs. (4), (5), and (2), one finds that b shouldgive this factor. As can be seen in Table 1, the coefficient b isfor most shape groups between 1.5 and 2. Figure 9 shows theratios bD
bAas a function of b, and most ratios on this plot are
close to the line bDbA= b. The exceptions are the two shape
groups where R2D was larger than R2
A ((6) Stellar and (10)Spatial plates), which are found above the line. Group (10)is outside the plot domain since it has an excessively highratio of 9.37 caused by a very small bD . However, this isprobably not meaningful since the correlation is very bad forthis group. The four shape groups with R2
A larger than R2D
((1) Needles, (2) Crossed needles, (3) Thick columns, and (9)Side planes) are below the line.
3.3 Particle orientation and area ratio
3.3.1 Orientation
For certain shapes, the orientation of the falling particle canconsiderably change the cross-sectional area seen in the top-view image. Therefore, the particle orientation will influencethe drag and thus the fall speed. To test how much this affectsour data, particles that clearly show a horizontal or vertical
Atmos. Chem. Phys., 21, 7545–7565, 2021 https://doi.org/10.5194/acp-21-7545-2021

S. Vázquez-Martín et al.: Shape dependence of snow crystal fall speed 7553
Table 3. Fall speed vs. particle size (v vs. Dmax) relationships fitted to Eq. (4) for each shape group and all data, i.e., for all the particlesregardless of shape. The parameters aD , bD with their respective uncertainties and the correlation coefficients R2
Dare shown for both
methods (Ma and Mb) for each shape group and regardless of shape. The RMSE values of base-10 logarithms of measured v vs. predicted vare also shown to indicate the uncertainty of these power laws.
v vs. Dmax
Shape groups (1–15)Method Ma Method Mb
aD [m s−1] bD R2D
aD [m s−1] bD R2D
RMSE
(1) Needles 0.34± 0.02 −0.03± 0.05 0.001 0.35± 0.05 −0.15± 0.11 0.24 0.05(2) Crossed needles 0.35± 0.06 0.01± 0.13 0.0002 0.35± 0.05 −0.07± 0.13 0.04 0.05(3) Thick columns 0.36± 0.08 0.19± 0.09 0.05 0.34± 0.14 0.12± 0.15 0.11 0.07(4) Capped columns 0.48± 0.03 0.33± 0.06 0.12 0.49± 0.07 0.28± 0.14 0.42 0.06(5) Plates 0.50± 0.04 0.40± 0.05 0.24 0.51± 0.05 0.39± 0.06 0.88 0.03(6) Stellar 0.26± 0.10 0.67± 0.21 0.20 0.23± 0.17 0.99± 0.37 0.54 0.11(7) Bullet rosettes 0.59± 0.04 0.51± 0.14 0.26 0.62± 0.05 0.44± 0.15 0.59 0.05(8) Branches 0.34± 0.02 0.33± 0.06 0.07 0.35± 0.03 0.36± 0.08 0.78 0.03(9) Side planes 0.52± 0.02 0.14± 0.05 0.02 0.54± 0.02 0.04± 0.08 0.04 0.02(10) Spatial plates 0.44± 0.09 0.21± 0.19 0.03 0.44± 0.13 0.20± 0.28 0.08 0.08(11) Spatial stellar 0.46± 0.03 0.70± 0.05 0.48 0.45± 0.04 0.88± 0.10 0.93 0.05(12) Graupel 0.98± 0.08 0.89± 0.11 0.65 1.07± 0.09 1.00± 0.13 0.91 0.05(13) Ice particles 0.61± 0.12 0.38± 0.10 0.21 0.65± 0.14 0.39± 0.12 0.65 0.06(14) Irregulars 0.44± 0.03 0.37± 0.05 0.16 0.46± 0.07 0.46± 0.12 0.70 0.07(15) Spherical 4.49± 0.28 1.37± 0.16 0.67 4.76± 0.63 1.42± 0.35 0.73 0.14
All data 0.42± 0.01 0.20± 0.02 0.06 0.44± 0.02 0.19± 0.03 0.87 0.02
Table 4. Fall speed vs. cross-sectional area (v vs. A) relationships fitted to Eq. (5) for each shape group and for all data, i.e., for all theparticles regardless of shape. The parameters aA, bA with their respective uncertainties and the correlation coefficients R2
Aare shown for
both methods (Ma and Mb) for each shape group and regardless of shape. The RMSE values of base-10 logarithms of measured v vs.predicted v are also shown to indicate the uncertainty of these power laws.
v vs. A
Shape groups (1–15)Method Ma Method Mb
aA [m s−1] bA R2A
aA [m s−1] bA R2A
RMSE
(1) Needles 0.51± 0.07 0.21± 0.04 0.10 0.50± 0.16 0.20± 0.08 0.50 0.04(2) Crossed needles 0.54± 0.15 0.30± 0.10 0.12 0.57± 0.27 0.33± 0.18 0.36 0.08(3) Thick columns 0.73± 0.17 0.31± 0.06 0.22 0.60± 0.34 0.26± 0.12 0.44 0.07(4) Capped columns 0.57± 0.07 0.17± 0.04 0.10 0.60± 0.12 0.16± 0.07 0.49 0.05(5) Plates 0.59± 0.06 0.22± 0.03 0.23 0.57± 0.06 0.20± 0.03 0.88 0.02(6) Stellar 0.37± 0.08 0.31± 0.12 0.14 0.37± 0.14 0.24± 0.25 0.13 0.13(7) Bullet rosettes 0.81± 0.10 0.30± 0.08 0.28 0.79± 0.11 0.24± 0.09 0.55 0.05(8) Branches 0.43± 0.04 0.20± 0.03 0.09 0.45± 0.07 0.20± 0.06 0.68 0.04(9) Side planes 0.57± 0.03 0.11± 0.03 0.05 0.59± 0.04 0.11± 0.05 0.50 0.03(10) Spatial plates 0.43± 0.17 0.04± 0.11 0.004 0.40± 0.40 0.02± 0.25 0.001 0.13(11) Spatial stellar 0.67± 0.04 0.40± 0.03 0.51 0.70± 0.05 0.47± 0.04 0.96 0.04(12) Graupel 1.35± 0.11 0.46± 0.05 0.69 1.40± 0.14 0.47± 0.07 0.89 0.05(13) Ice particles 1.01± 0.19 0.30± 0.06 0.31 0.87± 0.38 0.24± 0.12 0.41 0.09(14) Irregulars 0.56± 0.04 0.23± 0.03 0.19 0.60± 0.12 0.27± 0.08 0.68 0.07(15) Spherical 5.42± 0.29 0.68± 0.08 0.69 5.92± 0.59 0.71± 0.15 0.78 0.12
All data 0.52± 0.02 0.18± 0.01 0.14 0.54± 0.02 0.18± 0.01 0.97 0.01
https://doi.org/10.5194/acp-21-7545-2021 Atmos. Chem. Phys., 21, 7545–7565, 2021
7554 S. Vázquez-Martín et al.: Shape dependence of snow crystal fall speed
Figure 8. Fall speed vs. particle size (v vs. Dmax) and fall speed vs. cross-sectional area (v vs. A) relationships for the shape groups wherewe have found good correlations (solid lines) and all data regardless of shape (dashed black lines) are shown. The 68 % prediction band andthe 68 % confidence region for the fits (Mb) are also shown. For a legend of the shape groups, see Fig. 5. (a) v vs. Dmax relationship. Shapegroups (5), (6), (7), (8), (11), (12), (13), (14), and (15) are displayed. The values of the median of Dmax are represented by points. (b) v vs.A relationship. Shape groups (1), (4), (5), (7), (8), (9), (11), (12), (14), and (15) are displayed. The values of the median of A are representedby points. The length of the fit lines is defined by 16th and 84th percentiles of Dmax (a) and A (b). The corresponding data are shown inTables 3–4.
Figure 9. Ratio of the coefficients bD and bA from fits (Mb) to vvs.Dmax and v vs. A relationships, respectively, and the coefficientb corresponding to the A vs. Dmax relationship are shown for allthe shape groups. The solid green line corresponds to bD
bA= b.
orientation are selected among predominantly elongated par-ticles which are found within the shape group (1) Needles orpredominantly planar particles found within one of the (5)Plates and (6) Stellar groups. Particles that are identified byeye as having an orientation angle close to 0◦ are consideredhorizontal, and conversely, particles with an orientation angleclose to 90◦ are considered vertical. The orientation angle ishere defined as the angle that the horizontal plane forms withthe particle plane, in the case of planar particles, or with theparticle axis, in the case of elongated particles. Only a total
of 135 particles fulfilled these criteria: 109 with horizontaland 26 with vertical orientation. Figure 10a–f show six ex-amples using side-view images of individual particles withhorizontal orientation and six examples (g–l) with verticalorientations.
Figure 11 shows the individual fall speeds of these parti-cles. When trying to fit these data to Eqs. (4) or (5), the corre-lation coefficients remained very low, and thus no meaning-ful relationships could be found. However, particles fallingwith a vertical orientation are slightly faster (with a medianv = 0.42 m s−1) than the horizontally oriented (with a me-dian v = 0.34 m s−1).
3.3.2 Area ratio
In addition to orientation, also area ratio, Ar, may be im-portant, especially given that the Reynolds number, whichinfluences fall speed (Sect. 3.2), can be related, in part, tothe area ratio (Heymsfield and Westbrook, 2010). In gen-eral, the smallest particles tend to have the largest Ar, andAr becomes smaller for larger particles. This is true for mostshape groups, and this tendency is particularly strong in thefour shape groups (1) Needles, (2) Crossed needles, (3) Thickcolumns, and (13) Ice particles (see Fig. 4), of which groups(1–3) are elongated shapes. The lowest Ar values, at anygiven size, are found in these shape groups. The elongatedshapes also showed a particular size dependence of theircross-sectional area (Sect. 3.1). This dependence of area ratioand of cross-sectional area on particle size leads to a partic-ular fall speed behavior, which can be better visualized bysplitting the data into different Ar ranges. Figure 12 shows
Atmos. Chem. Phys., 21, 7545–7565, 2021 https://doi.org/10.5194/acp-21-7545-2021

S. Vázquez-Martín et al.: Shape dependence of snow crystal fall speed 7555
Figure 10. Panels (a)–(f) show six examples using side views of different particles with horizontal orientation, and panels (g)–(l) show sixexamples using side views of different particles with vertical orientation. These particles have an elongated shape (shape group (1) Needles)and planar shape (shape groups (5) Plates and (6) Stellar). Two examples of each shape group are displayed for both orientations. The samescaling is applied to all images; a 1 mm scale bar is shown for reference.
Figure 11. Fall speed vs. particle size (v vs. Dmax) and fall speed vs. cross-sectional area (v vs. A) for mixed particle shapes, elongatedparticles (shape group (1) Needles), and planar particles (shape groups (5) Plates and (6) Stellar), with horizontal and vertical orientationangles. (a) v vs. Dmax relationship. (b) v vs. A.
this after splitting the data equally into three distinct regionsof low, intermediate, and high Ar values. In each range, thereis a different fall speed relationship for both v vs. Dmax andv vs. A. As can be seen in Fig. 12, these relationships arespread out in a way so that for a given particle size or cross-sectional area, higher and lower Ar means higher and lowerfall speed, respectively. One may expect the effects of ori-entation to be responsible since the same elongated particlewould have a relatively larger Ar when oriented vertically,and thus falling faster, compared to when oriented horizon-
tally. However, a closer inspection of the data shows thatthe majority of particles are horizontally oriented. The pre-dominance of the horizontal orientation is probably a conse-quence of vertically falling particles being less aerodynami-cally stable and thus likely to transition to horizontal orien-tation. Therefore, particle orientation does not appear to ex-plain the dependence of fall speed on area ratio. Instead, par-ticles with higher area ratios are generally bulkier, i.e., nee-dles or columns that are shorter in length, and consequentlyfall faster.
https://doi.org/10.5194/acp-21-7545-2021 Atmos. Chem. Phys., 21, 7545–7565, 2021

7556 S. Vázquez-Martín et al.: Shape dependence of snow crystal fall speed
To better understand this area ratio dependence of fallspeed, we first consider elongated particles that have thesame Dmax (approximately given by the length) but differ-ent values of Ar. Note that the top-view images, used to de-termine A, always present a view perpendicular to the majoraxis of elongated particles if these are horizontally oriented.Therefore, the cross-sectional area is approximately given bythe length of a particle multiplied by its diameter d (withdiameter, we refer to the width perpendicular to the majoraxis), i.e., A≈Dmax · d .
Also, as can be seen in Eq. (1), the cross-sectional area Ais proportional to Ar for the case of Dmax being constant asconsidered here. Then, also diameter is proportional to Ar.Consequently, volume (≈Dmax · d
2) or mass (m) is propor-tional to A2
r . While, in the case of constant Dmax, A∝ Ar isvalid in general for all shapes, the strong dependencem∝ A2
ris distinctive for elongated shapes. Then, for these shapes, asAr increases, mass increases much more rapidly than A, andconsequently, fall speed needs to increase considerably fordrag to compensate gravitational force. This effect can ex-plain the strong dependence of fall speed on area ratio forthese elongated shapes.
For other shapes, the general dependence may be similar,though less pronounced due to a weaker Ar dependence ofm. Additionally, for these other shapes, the range of Ar is notas wide as for the elongated shapes. Moreover, for no othershape group do the fall speeds separate into distinguishablerelationships after splitting the data according to Ar. That in-dicates that the natural spread in fall speed may hide the Ardependence of fall speed.
To examine further, we also consider what happens at in-creasing Dmax in the case of constant Ar. In this case, A∝D2
max in general and m∝Dβmax where β is between 2 and3. Consequently, as m increases more rapidly with increas-ing Dmax than A (for all cases but the extreme m∝D2
max),the fall speed also increases rapidly with increasing Dmax,which is consistent with the strongest size dependence of fallspeed existing in shape groups (12) Graupel and (15) Spher-ical (see Sect. 3.2).
Finally, considering the general case when neither Dmaxnor Ar is constant, one needs to take into account both ofthe special cases explained above. On the one hand, increas-ing Dmax leads directly to increasing fall speed. On the otherhand, increasing Dmax changes the particle morphology sothat Ar decreases, which, in turn, causes fall speed to de-crease. Since these effects are opposed, they cancel eachother out to some extent. The stronger the negative size de-pendence of Ar, the weaker the positive size dependency offall speed. If the effect related to Ar is the strongest, theycancel out almost entirely, as in the case of shape groups (1–3) where this results in the weakest size dependence of fallspeed with low correlation. Another consequence of the Ardependence of fall speed is that variations in Ar cause vari-ations in fall speed; i.e., they account in part for the naturalspread in the data.
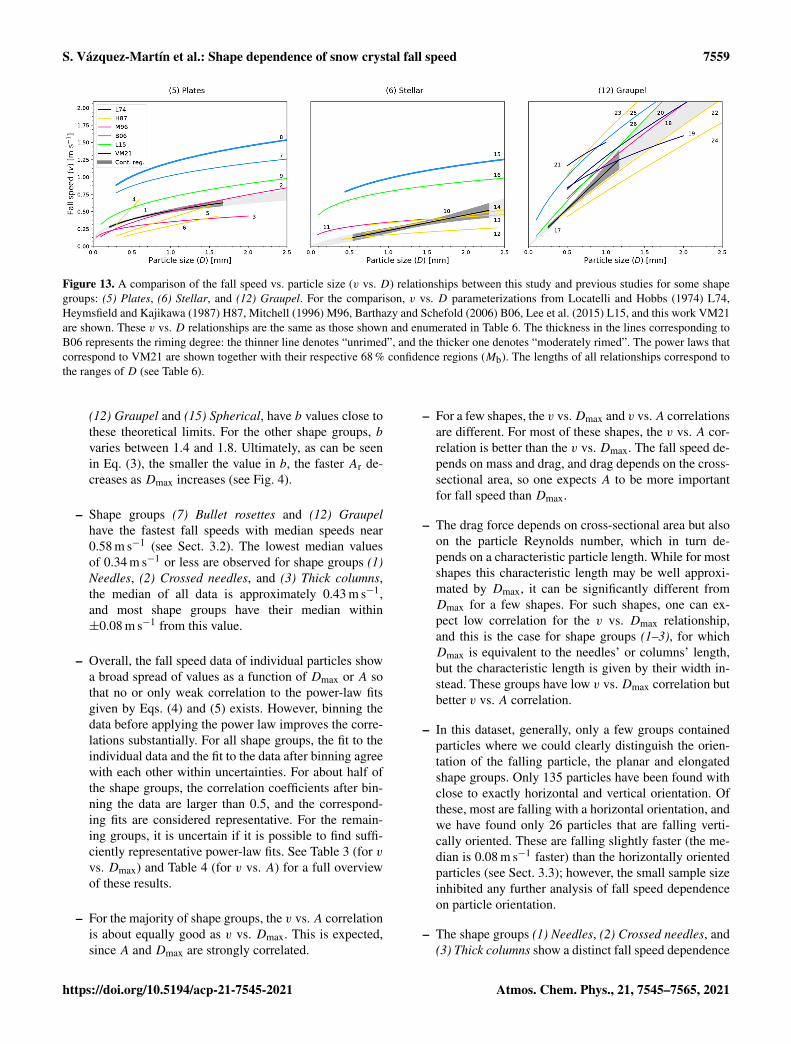
3.4 Comparison with previous fall speed relationships
For shape groups (5) Plates, (6) Stellar (called dendrites inother studies), and (12) Graupel, where we found good cor-relation (R2
D&0.5), we compare our fall speed relationshipsas functions of particle size, further referred to as VM21,against parameterizations of previous studies. Table 6 liststhe parameterizations of Locatelli and Hobbs (1974) L74,Heymsfield and Kajikawa (1987) H87, Mitchell (1996) M96,Barthazy and Schefold (2006) B06, and Lee et al. (2015) L15used in the comparison.
Before comparing, it is important to note that the parti-cle size D was defined somewhat differently depending onthe study. For VM21, as well as for H87 and M96, D corre-sponds to Dmax. For L74, D is the diameter of an estimatedcircle that has the same cross-sectional area as the imagedparticle, and for B06 and L15, D corresponds to the maxi-mum length of any horizontal row in the side-view shadowgraphs. Furthermore, we have not adjusted the different stud-ies to common temperature and pressure conditions but com-pared them as they are reported. While some did adjust mea-surements to some standard conditions, others did not. Forexample, H87 adjusted measurements from about 1000 m al-titude to a pressure level of 1000 hPa, whereas L74 used mea-surements from, on average, the same altitude but did notadjust them to a common or standard pressure level, whichresults in a difference of about 5 %.
L74 studied fall speeds of different types of ice crystalsby first measuring the fall speed of individual particles andthen subsequently collecting and imaging them. Their fittedrelationships of fall speed are often used as a reference byother studies in the literature. H87 also used data from fallspeed measurements and subsequent imaging of individualsnow particles, which were collected by Kajikawa (1972).What L74 and H87 have in common with VM21 is that allice particles that contribute to a fall speed parameterizationare individually shape classified and therefore belong to thestudied shape. B06, on the other hand, loosely tied particleshape to fall speeds by determining the dominant particleshape (occurrence> 50 %) per time interval from an inde-pendent instrument and later associated the fall speeds in thetime interval to the dominant shape. L15 used a method sim-ilar to B06; however, they used a higher occurrence thresh-old of 70 %. The fall speed parameterizations of the study byM96 are predicted from previous literature relationships ofcross-sectional area and mass vs. particle size.
Figure 13 shows that, for plates, the previous relation-ships by H87 and M96 are closest to results from VM21.While their relationships for crystal with sector-like branches(P1b) produce slower fall speeds than VM21, their relation-ships for plates are closer and extend into or cross the con-fidence region of VM21. H87 also reported a relationshipfor thick plates, which, in most of its size range, is justabove VM21. The relationships reported by B06 have thehighest fall speeds for plates. They reported different rela-
Atmos. Chem. Phys., 21, 7545–7565, 2021 https://doi.org/10.5194/acp-21-7545-2021

S. Vázquez-Martín et al.: Shape dependence of snow crystal fall speed 7557
Figure 12. Fall speed vs. particle size (a) and fall speed vs. cross-sectional area (b) relationships for the combination of shape groups(1) Needles, (2) Crossed needles, and (3) Thick columns. Fits that apply to binned data (Mb; see Sect. 3.2.2) are shown for all the data (solidblack line) and for different Ar (low, intermediate, and high) ranges. All data, in this case, only include particles in these three shape groups,i.e., (1–3). Same data are shown in Table 5.
Table 5. Fall speed vs. particle size (v vs. Dmax) and fall speed vs. cross-sectional area (v vs. A) relationships fitted to binned data (Mb) forthe combination of particles in shape groups (1) Needles, (2) Crossed needles, and (3) Thick columns with different area ratio Ar ranges (low,intermediate, and high). The number of particles, N , the parameters aD , bD , aA, bA, and their respective uncertainties, and the correlationcoefficients R2
bare shown. All data are also shown. In this case, all data include only particles in these three shape groups, i.e., (1–3).
Ranges Nv vs. Dmax v vs. A
aD [m s−1] bD R2D
aA [m s−1] bA R2A
All data (1–3) 486 0.34± 0.04 0.01± 0.07 0.01 0.50± 0.10 0.20± 0.05 0.74Ar low 161 0.23± 0.05 0.64± 0.11 0.84 0.58± 0.08 0.43± 0.05 0.93Ar intermediate 164 0.37± 0.04 0.72± 0.14 0.82 0.87± 0.12 0.48± 0.06 0.91Ar high 161 0.50± 0.07 0.38± 0.08 0.80 0.93± 0.20 0.35± 0.08 0.78
tionships for different degrees of riming, with more rimingleading to higher fall speeds. Our data included in shapegroup (5) Plates are mainly composed of unrimed particles(for a detailed description, see Vázquez-Martín et al., 2020).However, even the unrimed plates from B06 appear to bemuch faster. The relationships from B06 may overestimatefall speeds because of their classification method mentionedabove, which allowed up to half of the particles that con-tributed to the relationship to have different shapes. L15 alsoreported a relationship for plates’ speed that is faster than ourrelationship, although much closer and considerably slowerthan those of B06. The better agreement is possibly due to amore accurate shape classification, while otherwise using asimilar method to B06.
As for plates, also for stellar particles the previous rela-tionships by H87 and M96 are closest to those of VM21.Note that M96 is based on the flow regime for particles largerthan about 1 mm (Eq. 20 in M96). Using the flow regimefor smaller particles, M96 would come somewhat closer toVM21 below about 0.6 mm. Again, L15 and B06 reportedrelationships with considerably higher fall speeds.
L74 reported three relationships for lump graupel with dif-ferent densities. The higher the density, i.e., the more com-pact the graupel particles are, the faster their predicted fallspeeds will be. The relationship for lump graupel by M96 isbased on the mass relationship of the medium density graupelby L74; consequently, it is very close to the correspondingfall speed relationship. These are within or above VM21’sconfidence region. H87 reported lump graupel for tempera-tures below and above 0.5 ◦C, with faster speeds for highertemperatures. These are below and above VM21’s confidenceregion, respectively. Their relationship for colder tempera-tures than 0.5 ◦C is closer to VM21. The relationship by L15is close to VM21, just above the confidence region, and therelationship from B06 is again at higher speeds, similar to thedifferences for plates and stellar.
In general, our v vs. D relationships agree with the previ-ous studies. The studies with the largest disparity comparedto this study may, in large part, be explained by the differentapproach to classifying snow particle shapes.
https://doi.org/10.5194/acp-21-7545-2021 Atmos. Chem. Phys., 21, 7545–7565, 2021
7558 S. Vázquez-Martín et al.: Shape dependence of snow crystal fall speed
Table 6. The v vs. D relationships of previous studies given by Locatelli and Hobbs (1974) L74, Heymsfield and Kajikawa (1987) H87,Mitchell (1996) M96, Barthazy and Schefold (2006) B06, and Lee et al. (2015) L15 are shown for some shapes that were selected for thecomparison and correspond to (5) Plates, (6) Stellar, and (12) Graupel. The power laws for M96 have been determined by using Eqs. (20)and (22) in Mitchell (1996). The relationships found in this work are also shown as VM21. The power laws from the literature have beenconverted to use the same units, i.e., mm and m s−1, as in VM21. The snow particle type, the total number of particles N , ranges of particlesizes D, v vs. D relationships, the correlation coefficient R2, and the references of the studies are displayed. In some of these studies, theparticle size is defined somewhat differently. However, in H87 and M96, D is defined as Dmax as in VM21. Magono and Lee (1966)’ssymbols are sometimes added for shape clarification. These v vs. D relationships are shown in Fig. 13. To easily connect the fit lines to thepower laws, the same relationship numbers have been used in Table 6 and Fig. 13.
Snow particle type N Range of D Relationship (v–D) R2 Ref.
Shape group (5) Plates 197 0.21–1.7 mm 1. v/(m s−1)= 0.51 · (D/mm)0.39 0.88 VM21Hexagonal plates – 0.10–3.0 mm 2. v/(m s−1)= 0.51 · (D/mm)0.56 – M96Crystal with sector-like branches (P1b) – 0.04–2.0 mm 3. v/(m s−1)= 0.35 · (D/mm)0.31 – M96Thick plate (C1h) 19 0.30–0.6 mm 4. v/(m s−1)= 1.18 · (D/mm)1.09 0.46 H87Hexagonal plate (P1a) 34 0.30–1.5 mm 5. v/(m s−1)= 0.41 · (D/mm)0.86 0.69 H87Crystal with sector-like branches (P1b) 19 0.40–1.6 mm 6. v/(m s−1)= 0.29 · (D/mm)0.81 0.96 H87Unrimed plates – 0.30–2.7 mm 7. v/(m s−1)= 1.02 · (D/mm)0.23 0.87 B06Moderately rimed plates – 0.30–3.6 mm 8. v/(m s−1)= 1.21 · (D/mm)0.26 0.73 B06Plate – 0–4.0 mm 9. v/(m s−1)= 0.71 · (D/mm)0.35 – L15
Shape group (6) Stellar 43 0.54–2.3 mm 10. v/(m s−1)= 0.23 · (D/mm)0.99 0.54 VM21Stellar crystal with broad arms (P1d) – 0.09–1.5 mm 11. v/(m s−1)= 0.35 · (D/mm)0.30 – M96Stellar crystal with broad arms (P1d) 23 0.40–2.4 mm 12. v/(m s−1)= 0.16 · (D/mm)0.55 0.82 H87Stellar with end plates (P2a) 11 0.70–3.0 mm 13. v/(m s−1)= 0.34 · (D/mm)0.33 0.54 H87Plate with dendritic extensions (P2g) 10 0.70–2.8 mm 14. v/(m s−1)= 0.25 · (D/mm)0.80 0.89 H87Moderately rimed dendrites – 0.45–3.7 mm 15. v/(m s−1)= 0.98 · (D/mm)0.27 0.69 B06Dendrite – 0–4.0 mm 16. v/(m s−1)= 0.79 · (D/mm)0.24 – L15
Shape group (12) Graupel 37 0.25–1.2 mm 17. v/(m s−1)= 1.07 · (D/mm)1.00 0.91 VM21Lump graupel (R4b) – 0.5–3.0 mm 18. v/(m s−1)= 1.18 · (D/mm)0.79 – M96Lump graupel (R4b) 35 0.5–2.0 mm 19. v/(m s−1)= 1.16 · (D/mm)0.46 r = 0.55 L74Lump graupel (R4b) 58 0.5–3.0 mm 20. v/(m s−1)= 1.3 · (D/mm)0.66 r = 0.77 L74Lump graupel (R4b) 17 0.5–1.0 mm 21. v/(m s−1)= 1.5 · (D/mm)0.37 r = 0.58 L74Lump graupel (R4b) 116 0.4–9.0 mm 22. v/(m s−1)= 0.94 · (D/mm)0.89 0.78 H87R4b, T ≥ 0.5 ◦C 31 0.5–4.7 mm 23. v/(m s−1)= 1.65 · (D/mm)0.68 0.92 H87R4b, T < 0.5 ◦C 85 0.5–9.0 mm 24. v/(m s−1)= 0.79 · (D/mm)0.89 0.92 H87Graupel – 0–4.8 mm 25. v/(m s−1)= 1.54 · (D/mm)0.61 0.95 B06Graupel – 0–4.0 mm 26. v/(m s−1)= 1.25 · (D/mm)0.94 – L15
4 Summary and conclusions
We have presented D-ICI measurements of natural snow, icecrystals, and other hydrometeors, covering sizes from 0.06 to3.2 mm. These data with dual images of every particle enablethe retrieval of the particle shape, as well as size parametersfrom the top view and fall speed from the double-exposedside-view images.
The particles were sorted according to a classificationscheme presented in Vázquez-Martín et al. (2020), whichuses 15 different shape groups: Needles, Crossed needles,Thick columns, Capped columns, Plates, Stellar crystals,Bullet rosettes, Branches, Side planes, Spatial plates, Spa-tial stellar, Graupel, Ice particles, Irregulars, and Sphericalparticles. In this study, we have analyzed fall speed vs. par-
ticle size (v vs. Dmax) and fall speed vs. cross-sectional area(v vs. A) for each of the 15 shape groups. Fall speed depen-dence of particle orientation has also been studied as well asdependence of area ratio. The following is a summary of theconclusions drawn.
– Power-law functions represent the relationship betweenthe cross-sectional area and the maximum dimension(Eq. 2) very well for all shape groups (see Table 1). Theexponent b varies between about 1 and 2. Theoretically,the value approaches 1.0 for very elongated shapes thatpredominantly grow in only one of the two dimensionsshown on the top-view images and 2.0 for sphericalshapes. Indeed, data from the shape groups with veryelongated shapes, (1) Needles, (2) Crossed needles, and(3) Thick columns, and the groups with round particles,
Atmos. Chem. Phys., 21, 7545–7565, 2021 https://doi.org/10.5194/acp-21-7545-2021
S. Vázquez-Martín et al.: Shape dependence of snow crystal fall speed 7559
Figure 13. A comparison of the fall speed vs. particle size (v vs. D) relationships between this study and previous studies for some shapegroups: (5) Plates, (6) Stellar, and (12) Graupel. For the comparison, v vs. D parameterizations from Locatelli and Hobbs (1974) L74,Heymsfield and Kajikawa (1987) H87, Mitchell (1996) M96, Barthazy and Schefold (2006) B06, Lee et al. (2015) L15, and this work VM21are shown. These v vs. D relationships are the same as those shown and enumerated in Table 6. The thickness in the lines corresponding toB06 represents the riming degree: the thinner line denotes “unrimed”, and the thicker one denotes “moderately rimed”. The power laws thatcorrespond to VM21 are shown together with their respective 68 % confidence regions (Mb). The lengths of all relationships correspond tothe ranges of D (see Table 6).
(12) Graupel and (15) Spherical, have b values close tothese theoretical limits. For the other shape groups, bvaries between 1.4 and 1.8. Ultimately, as can be seenin Eq. (3), the smaller the value in b, the faster Ar de-creases as Dmax increases (see Fig. 4).
– Shape groups (7) Bullet rosettes and (12) Graupelhave the fastest fall speeds with median speeds near0.58 m s−1 (see Sect. 3.2). The lowest median valuesof 0.34 m s−1 or less are observed for shape groups (1)Needles, (2) Crossed needles, and (3) Thick columns,the median of all data is approximately 0.43 m s−1,and most shape groups have their median within±0.08 m s−1 from this value.
– Overall, the fall speed data of individual particles showa broad spread of values as a function of Dmax or A sothat no or only weak correlation to the power-law fitsgiven by Eqs. (4) and (5) exists. However, binning thedata before applying the power law improves the corre-lations substantially. For all shape groups, the fit to theindividual data and the fit to the data after binning agreewith each other within uncertainties. For about half ofthe shape groups, the correlation coefficients after bin-ning the data are larger than 0.5, and the correspond-ing fits are considered representative. For the remain-ing groups, it is uncertain if it is possible to find suffi-ciently representative power-law fits. See Table 3 (for vvs. Dmax) and Table 4 (for v vs. A) for a full overviewof these results.
– For the majority of shape groups, the v vs.A correlationis about equally good as v vs. Dmax. This is expected,since A and Dmax are strongly correlated.
– For a few shapes, the v vs.Dmax and v vs.A correlationsare different. For most of these shapes, the v vs. A cor-relation is better than the v vs. Dmax. The fall speed de-pends on mass and drag, and drag depends on the cross-sectional area, so one expects A to be more importantfor fall speed than Dmax.
– The drag force depends on cross-sectional area but alsoon the particle Reynolds number, which in turn de-pends on a characteristic particle length. While for mostshapes this characteristic length may be well approxi-mated by Dmax, it can be significantly different fromDmax for a few shapes. For such shapes, one can ex-pect low correlation for the v vs. Dmax relationship,and this is the case for shape groups (1–3), for whichDmax is equivalent to the needles’ or columns’ length,but the characteristic length is given by their width in-stead. These groups have low v vs.Dmax correlation butbetter v vs. A correlation.
– In this dataset, generally, only a few groups containedparticles where we could clearly distinguish the orien-tation of the falling particle, the planar and elongatedshape groups. Only 135 particles have been found withclose to exactly horizontal and vertical orientation. Ofthese, most are falling with a horizontal orientation, andwe have found only 26 particles that are falling verti-cally oriented. These are falling slightly faster (the me-dian is 0.08 m s−1 faster) than the horizontally orientedparticles (see Sect. 3.3); however, the small sample sizeinhibited any further analysis of fall speed dependenceon particle orientation.
– The shape groups (1) Needles, (2) Crossed needles, and(3) Thick columns show a distinct fall speed dependence
https://doi.org/10.5194/acp-21-7545-2021 Atmos. Chem. Phys., 21, 7545–7565, 2021

7560 S. Vázquez-Martín et al.: Shape dependence of snow crystal fall speed
on area ratio. By splitting particles of the same size orcross-sectional area into three categories of area ratio(low, medium, high), we found that those with largerarea ratios have higher fall speeds. These relationshipshave a high correlation, and it is much higher than be-fore splitting the data into different area ratio ranges (seeTable 5). Only these three shape groups show this be-havior. Thus, if a similar area ratio dependence existsfor other shapes, then it is less pronounced.
– Our v vs. Dmax relationships for some of the better-correlated shape groups, (5) Plates, (6) Stellar, and(12) Graupel, are compared with other fall speed rela-tionships given by previous studies. Our results mostlyagree with the studies that determined shape and fallspeed for all particles or based on literature area–dimensional and mass–dimensional relationships forspecific shapes. Of these studies, some of them aresomewhat faster and some are somewhat slower thanour relationships for the corresponding shape group.Other studies differ significantly from our relationships.However, in these studies, the shape groups were deter-mined based on the identity of the most frequent par-ticle shape within a time interval; i.e., other particleshapes undoubtedly reduced the precision of the datasetand therefore may be the cause of the bias between thisdataset and theirs (see Sect. 3.4).
These resulting parameterizations of the snow microphys-ical properties as a function of particle shape may be usefulfor improving our understanding of precipitation in cold cli-mates in addition to helping improve the microphysical pa-rameterizations in the climate and forecast models.
Atmos. Chem. Phys., 21, 7545–7565, 2021 https://doi.org/10.5194/acp-21-7545-2021

S. Vázquez-Martín et al.: Shape dependence of snow crystal fall speed 7561
Appendix A: Fall speed relationships for the shapegroups
Figures A1 and A2 represent v vs.Dmax and v vs. A, respec-tively, fitted to a power law, for all 15 shape groups, and, asin Fig. 6 (Sect. 3.2), both methods (Ma, Mb) are shown forcomparison.
https://doi.org/10.5194/acp-21-7545-2021 Atmos. Chem. Phys., 21, 7545–7565, 2021
7562 S. Vázquez-Martín et al.: Shape dependence of snow crystal fall speed
Figure A1. Fall speed vs. particle size (v vs.Dmax) relationships given by Eq. (4) for all the shape groups are shown. Individual data (coloredsymbols) and binned data (blue symbols with error bars) are displayed. Median values in the respective bins represent the binned data. Thetotal length of the error bars represents the spread in fall speed data, which is given by the difference between the 16th and 84th percentiles.Fits that apply to individual data (Ma) and to binned data (Mb) are shown for comparison. The 68 % prediction band and the 68 % confidenceregion for both fits (Ma, Mb) are also shown. The same data are shown in Table 3.
Atmos. Chem. Phys., 21, 7545–7565, 2021 https://doi.org/10.5194/acp-21-7545-2021

S. Vázquez-Martín et al.: Shape dependence of snow crystal fall speed 7563
Figure A2. Same as for Fig. A1, but fall speed vs. cross-sectional area (v vs. A) relationships given by Eq. (5) are shown here.
https://doi.org/10.5194/acp-21-7545-2021 Atmos. Chem. Phys., 21, 7545–7565, 2021
7564 S. Vázquez-Martín et al.: Shape dependence of snow crystal fall speed
Data availability. The presented data are available atthe Swedish National Data Service (SND-ID: 2021-125;https://doi.org/10.5878/dgak-p185, Kuhn and Vázquez-Martín,2021).
Author contributions. TK and SVM performed the conceptualiza-tion; TK prepared the resources and the instrumentation; SVM andTK performed the experiments and data collection; SVM and TKprepared the formal analysis; SVM and TK carried out the data cu-ration; SVM prepared the original draft; SVM, TK and SE con-tributed to changes and writing during review and revisions; SVMprepared the visualization that includes tables and figures; TK andSE carried out the supervision of the research project.
Competing interests. The authors declare that they have no conflictof interest.
Acknowledgements. We thank the Graduate School of Space Tech-nology at the Luleå University of Technology for financial supportand the Swedish Institute of Space Physics (IRF) at Kiruna for of-fering its facilities for our instrument.
Review statement. This paper was edited by Timothy Garrett andreviewed by two anonymous referees.
References
Barthazy, E. and Schefold, R.: Fall velocity of snowflakes of differ-ent riming degree and crystal types, J. Atmos. Res., 82, 391–398,https://doi.org/10.1016/j.atmosres.2005.12.009, 2006.
Baum, B. A., Yang, P., Heymsfield, A. J., Schmitt, C. G., Xie, Y.,Bansemer, A., Hu, Y.-X., and Zhang, Z.: Improvements in Short-wave Bulk Scattering and Absorption Models for the RemoteSensing of Ice Clouds, J. Appl. Meteorol. Clim., 50, 1037–1056,https://doi.org/10.1175/2010JAMC2608.1, 2011.
Brandes, E. A., Ikeda, K., Thompson, G., and Schön-huber, M.: Aggregate Terminal Velocity/TemperatureRelations, J. Appl. Meteorol. Clim., 47, 2729–2736,https://doi.org/10.1175/2008JAMC1869.1, 2008.
Cooper, S. J. and Garrett, T. J.: Identification of small ice cloud par-ticles using passive radiometric observations, J. Appl. Meteorol.,49, 2334–247, 2010.
Dunnavan, E. L.: How Snow Aggregate Ellipsoid Shape and Ori-entation Variability Affects Fall Speed and Self-AggregationRates, J. Atmos. Sci., 78, 51–73, https://doi.org/10.1175/JAS-D-20-0128.1, 2021.
Foster, J., Barton, J., Chang, A., and Hall, D.: Snow crys-tal orientation effects on the scattering of passive mi-crowave radiation, IEEE T. Geosci. Remote, 38, 2430–2434,https://doi.org/10.1109/36.868899, 2000.
Gergely, M. and Garrett, T. J.: Impact of the natural variabilityin snowflake diameter, aspect ratio, and orientation on modeled
snowfall radar reflectivity, J. Geophys. Res.-Atmos., 121, 12236–12252, https://doi.org/10.1002/2016JD025192, 2016.
Haider, A.: Drag Coefficient and Terminal Velocity of Spheri-cal and Non-Spherical Particles, Powder Technol., 58, 63–70,https://doi.org/10.1016/0032-5910(89)80008-7, 1989.
Heymsfield, A. J. and Kajikawa, M.: An Improved Approach toCalculating Terminal Velocities of Plate-like Crystals and Grau-pel, J. Atmos. Sci., 44, 1088–1099, https://doi.org/10.1175/1520-0469(1987)044<1088:AIATCT>2.0.CO;2, 1987.
Heymsfield, A. J. and Westbrook, C. D.: Advances in theEstimation of Ice Particle Fall Speeds Using Laboratoryand Field Measurements, J. Atmos. Sci., 67, 2469–2482,https://doi.org/10.1175/2010JAS3379.1, 2010.
Jiang, Z., Verlinde, J., Clothiaux, E., Aydin, K., and Schmitt,C.: Shapes and Fall Orientations of Ice Particle Aggregates, J.Atmos. Sci., 76, 1903–1916, https://doi.org/10.1175/JAS-D-18-0251.1, 2019.
Jin, Z., Charlock, T. P., Yang, P., Xie, Y., and Miller, W.: Snow op-tical properties for different particle shapes with application tosnow grain size retrieval and MODIS/CERES radiance compar-ison over Antarctica, Remote Sens. Environ., 112, 3563–3581,https://doi.org/10.1016/j.rse.2008.04.011, 2008.
Kajikawa, M.: Measurement of Falling Velocity of Individual SnowCrystals, J. Meteorol. Soc. Japan, 50, 577–583, 1972.
Kikuchi, K., Kameda, T., Higuchi, K., and Yamashita, A.:A global classification of snow crystals, ice crystals, andsolid precipitation based on observations from middle lat-itudes to polar regions, Atmos. Res., 132–133, 460–472,https://doi.org/10.1016/j.atmosres.2013.06.006, 2013.
Kneifel, S., Löhnert, U., Battaglia, A., Crewell, S., and Siebler, D.:Snow scattering signals in ground-based passive microwave ra-diometer measurements, J. Geophys. Res.-Atmos., 115, 1–17,https://doi.org/10.1029/2010JD013856, 2010.
Kuhn, T. and Gultepe, I.: Ice Fog and Light Snow Measure-ments Using a High-Resolution Camera System, Pure Appl.Geophys., 173, 3049–3064, https://doi.org/10.1007/s00024-016-1343-7, 2016.
Kuhn, T. and Vázquez-Martín, S.: Microphysical properties andfall speed measurements of snow ice crystals using the DualIce Crystal Imager (D-ICI), Atmos. Meas. Tech., 13, 1273–1285,https://doi.org/10.5194/amt-13-1273-2020, 2020.
Kuhn, T. and Vázquez-Martín, S.: Snow ice particle microphysicalproperties and fall speed from particle images taken in Kiruna(Sweden) 2014–2018, Swedish National Data Service, Version1.0, https://doi.org/10.5878/dgak-p185, 2021.
Lee, J., Jung, S.-H., Park, H.-M., KWON, S., Lin, P.-L.,and Lee, G.: Classification of Precipitation Types UsingFall Velocity-Diameter Relationships from 2D-Video Dis-trometer Measurements, Adv. Atmos. Sci., 32, 1277–1290,https://doi.org/10.1007/s00376-015-4234-4, 2015.
Locatelli, J. D. and Hobbs, P. V.: Fall speeds and masses ofsolid precipitation particles, J. Geophys. Res., 79, 2185–2197,https://doi.org/10.1029/JC079i015p02185, 1974.
Loeb, N. G., Yang, P., Rose, F. G., Hong, G., Sun-Mack, S., Min-nis, P., Kato, S., Ham, S.-H., Smith, W. L., Hioki, S., and Tang,G.: Impact of Ice Cloud Microphysics on Satellite Cloud Re-trievals and Broadband Flux Radiative Transfer Model Calcula-tions, J. Climate, 31, 1851–1864, https://doi.org/10.1175/JCLI-D-17-0426.1, 2018.
Atmos. Chem. Phys., 21, 7545–7565, 2021 https://doi.org/10.5194/acp-21-7545-2021

S. Vázquez-Martín et al.: Shape dependence of snow crystal fall speed 7565
Magono, C. and Lee, C. W.: Meteorological classification of naturalsnow crystals, J. Fac. Sci. Hokkaido Univ., 2, 321–335, 1966.
Marchand, R., Mace, G., Hallar, A., McCubbin, I., Matrosov, S.,and Shupe, M.: Enhanced Radar Backscattering due to OrientedIce Particles at 95 GHz during StormVEx, J. Atmos. Ocean.Technol., 30, 2336–2351, https://doi.org/10.1175/JTECH-D-13-00005.1, 2013.
Matrosov, S., Mace, G., Marchand, R., Shupe, M., Hallar, A., andMcCubbin, I.: Observations of Ice Crystal Habits with a Scan-ning Polarimetric W-Band Radar at Slant Linear Depolariza-tion Ratio Mode, J. Atmos. Ocean. Technol., 29, 989–1008,https://doi.org/10.1175/JTECH-D-11-00131.1, 2012.
Mitchell, D. L.: Use of Mass- and Area-Dimensional PowerLaws for Determining Precipitation Particle Terminal Velocities,J. Atmos. Sci., 53, 1710–1723, https://doi.org/10.1175/1520-0469(1996)053<1710:UOMAAD>2.0.CO;2, 1996.
Mitchell, D. L., Rasch, P., Ivanova, D., McFarquhar, G., and Nou-siainen, T.: Impact of small ice crystal assumptions on ice sedi-mentation rates in cirrus clouds and GCM simulations, Geophys.Res. Lett., 35, 1–5, https://doi.org/10.1029/2008GL033552,2008.
Nakaya, U.: Snow crystals: natural and artificial, Harvard Univer-sity Press, Cambridge, 1954.
Posselt, D. J., L’Ecuyer, T. S., and Stephens, G. L.: Exploring theerror characteristics of thin ice cloud property retrievals usinga Markov chain Monte Carlo algorithm, J. Geophys. Res., 113,D24206, https://doi.org/10.1029/2008JD010832, 2008.
Pruppacher, H. R. and Klett, J. D.: Microphysics of clouds and pre-cipitation, Kluwer Academic Publishers, Dordrecht, 2nd rev. andenl. edn., 1997.
Schefold, R., Baschek, B., Wüest, M., and Barthazy, E.: Fall ve-locity and axial ratio of snowflakes, In Proceedings of ERAD(2002), pp. 1–6, Copernicus GmbH, available at: https://iacweb.ethz.ch/doc/publications/schefold_delft_2002.pdf (last access:30 April 2021), 2002.
SMHI: Ladda ner meteorologiska observationer,available at: https://www.smhi.se/data/meteorologi/ladda-ner-meteorologiska-observationer/#param=wind,stations=all,stationid=180940, last access: 5 February 2020.
Stoelinga, M. T., Hobbs, P. V., Mass, C. F., Locatelli, J. D., Colle,B. A., Houze, R. A., Rangno, A. L., Bond, N. A., Smull, B. F.,Rasmussen, R. M., Thompson, G., and Colman, B. R.: Improve-ment of Microphysical Parameterization through ObservationalVerification Experiment, Bull. Amer. Met. Soc., 84, 1807–1826,https://doi.org/10.1175/bams-84-12-1807, 2003.
Sun, W., Hu, Y., Lin, B., Liu, Z., and Videen, G.: The impact of icecloud particle microphysics on the uncertainty of ice water con-tent retrievals, J. Quant. Spectrosc. Radiat. Transfer, 112, 189–196, https://doi.org/10.1016/j.jqsrt.2010.04.003, 2011.
Tao, W.-K., Simpson, J., Baker, D., Braun, S., Chou, M.-D., Ferrier,B., Johnson, D., Khain, A., Lang, S., Lynn, B., Shie, C.-L., Starr,D., Sui, C.-H., Wang, Y., and Wetzel, P.: Microphysics, radiationand surface processes in the Goddard Cumulus Ensemble (GCE)model, Meteorol. Atmos. Phys., 82, 97–137, 2003.
Vázquez-Martín, S., Kuhn, T., and Eliasson, S.: Shape Depen-dence of Falling Snow Crystals’ Microphysical Properties Us-ing an Updated Shape Classification, Appl. Sci., 10, 1163,https://doi.org/10.3390/app10031163, 2020.
Westbrook, C. D. and Sephton, E. K.: Using 3-D-printed ana-logues to investigate the fall speeds and orientations ofcomplex ice particles, Geophys. Res. Lett., 44, 7994–8001,https://doi.org/10.1002/2017GL074130, 2017.
Xie, X. and Miao, J.: Polarization difference due to nonran-domly oriented ice particles at millimeter/submillimeter wave-band, J. Quant. Spectrosc. Radiat. Transfer, 112, 1090–1098,https://doi.org/10.1016/j.jqsrt.2010.11.020, 2011.
Xie, X., Löhnert, U., Kneifel, S., and Crewell, S.: Snow par-ticle orientation observed by ground-based microwaveradiometry, J. Geophys. Res.-Atmos., 117, D02206,https://doi.org/10.1029/2011JD016369, 2012.
Xie, X., Crewell, S., Löhnert, U., Simmer, C., and Miao, J.: Polar-ization signatures and brightness temperatures caused by hori-zontally oriented snow particles at microwave bands: Effects ofatmospheric absorption, J. Geophys. Res.-Atmos., 120, 6145–6160, https://doi.org/10.1002/2015JD023158, 2015.
Xie, Y., Yang, P., Kattawar, G., Baum, B., and Hu, Y.: Simulationof the optical properties of plate aggregates for application tothe remote sensing of cirrus clouds, Appl. Opt., 50, 1065–81,https://doi.org/10.1364/AO.50.001065, 2011.
Yang, P., Zhang, Z., Kattawar, G. W., Warren, S. G., Baum, B. A.,Huang, H.-L., Hu, Y. X., Winker, D., and Iaquinta, J.: Ef-fect of Cavities on the Optical Properties of Bullet Rosettes:Implications for Active and Passive Remote Sensing of IceCloud Properties, J. Appl. Meteorol. Clim., 47, 2311–2330,https://doi.org/10.1175/2008JAMC1905.1, 2008.
Yang, P., Wendisch, M., Bi, L., Kattawar, G., and Hu, Y.: De-pendence of extinction cross-section on incident polarizationstate and particle orientation, J. Quant. Spectrosc. Radiat. Trans-fer, 112, 2035–2039, https://doi.org/10.1016/j.jqsrt.2011.04.012,2011.
Yuter, S., Kingsmill, D., Nance, L., and Löffler-Mang, M.: Observa-tions of precipitation size and fall speed characteristics within co-existing rain and wet snow, J. Appl. Meteorol. Clim., 45, 1450–1464, 2006.
Zawadzki, I., Jung, E., and Lee, G.: Snow Studies. Part I: A Studyof Natural Variability of Snow Terminal Velocity, J. Atmos. Sci.,67, 1591–1604, https://doi.org/10.1175/2010JAS3342.1, 2010.
Zhang, Z., Yang, P., Kattawar, G., Riedi, J., -Labonnote, L. C.,Baum, B. A., Platnick, S., and Huang, H.-L.: Influence of iceparticle model on satellite ice cloud retrieval: lessons learnedfrom MODIS and POLDER cloud product comparison, Atmos.Chem. Phys., 9, 7115–7129, https://doi.org/10.5194/acp-9-7115-2009, 2009.
https://doi.org/10.5194/acp-21-7545-2021 Atmos. Chem. Phys., 21, 7545–7565, 2021