shamsun nahar msc (accounting and finance), uk m.b.a, b.b
TRANSCRIPT

Risk Disclosure Practices: Their Determinants and Association with Bank
Performance
Shamsun Nahar MSc (Accounting and Finance), UK
M.B.A, B.B.A (Accounting and Information system), Bangladesh
A Thesis Submitted in Fulfilment of the Requirements for the Degree of
Doctor of Philosophy
Faculty of Business and Enterprise
Swinburne University of Technology
2015


Abstract
In recent times, corporate risk disclosure has been an issue of major concern to the
global community and has gained considerable attention from stakeholders, policy
makers and regulators. This research explores risk disclosures practices, their
determinants and association with bank performance in the context of a developing
country, Bangladesh. Most existing studies on risk disclosure provide empirical
evidence from developed countries. However, the difference in institutional and socio-
economic settings between developed and developing countries might affect the extent
of corporate risk disclosure differentially. Specifically, Bangladesh makes an ideal site
in which to examine risk disclosures and their determinants within an agency and neo
institutional isomorphism conceptual framework because risk disclosures are effectively
voluntary.
This research is comprised of three interrelated Phases. Employing content analysis, the
first Phase investigates corporate risk disclosure practices by sample banks from 2006
to 2012. A comprehensive Risk Disclosure Index (RDI) is developed based on
international standards and is used as a benchmark against which to score actual risk
disclosures. The second Phase investigates determinants for such disclosures. Informed
by thematic analysis of semi-structured interviews with senior banking executives and
regulators, this Phase investigates the Risk Disclosure Index score and its association
with banks’ corporate governance and financial characteristics. The third and final
Phase uses multiple regression analysis to investigate the association between the extent
of risk disclosure and performance. Bank performance is measured using two broad
aspects: bank operating performance and bank valuation.
Overall, the Risk Disclosure Index developed in this study is of relevance to financial
institutions seeking to provide information for stakeholders and, indeed, to all relevant
parties seeking to assess or evaluate information in relation to risk disclosure. The
analysis suggests that listed banks in Bangladesh made significant improvement in risk
disclosure over time, predominantly on a voluntary basis, and this improvement is
associated with several key bank characteristics, consistent with agency and neo

ii
institutional isomorphism tenets. In addition, analysis of interview findings suggest that
institutional weakness, political interference and inadequate monitoring by the Central
Bank hinders risk disclosure practices. The findings provide evidence also that lagged
risk disclosure is positively associated with banks’ return on assets, solvency and
employee efficiency. This research should assist also accounting regulators and
legislators in developing reporting requirements that satisfy stakeholders’ demands in
relation to risk disclosure. Research implications from the findings are discussed,
together with limitations and recommendations for future research.

iii
Acknowledgement
First, I am grateful to almighty Allah for granting me strength and courage to the long,
arduous journey towards the completion of the PhD thesis.
Writing this thesis is not like making a journey alone. I would like to express my
gratitude and acknowledgement to many people for their guidance and support along
my PhD journey.
My deepest gratefulness for support and encouragement throughout my doctoral study
goes to my supervisor, Dr. Mohammad Azim. He had always been kind to me,
providing me advice and guidance throughout my entire journey. I owe him a big
gratitude.
This project could not be completed without the input and guidance provided by
Professor Christine Jubb. Her extremely valuable feedback and timely suggestions are
much appreciated. It has been my privilege to have her as my supervisor. Thank you.
I am also thankful to Dr Ron Kluvers, for all his beneficial advice and guidance. I am
sincerely pleased to the interview participants, who shared their time, knowledge and
wisdom with me and everyone who has taken part in this study. I appreciate my
distinguished colleagues in the PhD research lab at Swinburne University for their
support and friendship.
My efforts and dreams would not be materialised if Swinburne University of
Technology would not have provided me prestigious Swinburne University
Postgraduate Research Award (SUPRA) for doing PhD.
I would like to acknowledge my family- my husband, brothers, sisters, brother- in-law
and my dearest parents for having faith in my capabilities, giving me unconditional

iv
support and continuous encouragement. Very special thanks to my three-year-old ‘little
superman’ son, Rayyan, my biggest source of inspiration throughout this long journey.
Thank you.
Lastly, I wish to convey my gratitude to all my friends who always provided valuable
support, interest, and help in every possible way throughout the process of this study.

v
Declaration
This thesis contains no material that has been accepted for the award of any other
degree or diploma in any other institution. To the best of my knowledge, the work of no
other person has been used without due acknowledgement, and the thesis is not written
in collaboration with any other person.
Shamsun Nahar
June, 2015

vi

vii
Table of contents
Abstract…………. ............................................................................................................ i
Acknowledgment ............................................................................................................ iii
Declaration ....................................................................................................................... v
Table of Contents .......................................................................................................... vii
List of Tables ................................................................................................................. xv
List of Figures .............................................................................................................. xvii
List of Appendices ........................................................................................................ xix
PART ONE 1 PRELIMINARIES 1
Chapter 1: Introduction 1
1.1 Introduction ................................................................................................................. 3
1.2 Research background and motivation ......................................................................... 4
1.3 Research justification and objectives .......................................................................... 7
1.4 Key terms .................................................................................................................... 9
1.5 Research approach .................................................................................................... 10
1.6 Research contribution…………………………………………………………… 12
1.7 Thesis outline……………………………………………………………………… 12
Chapter 2: Risk Reporting as an Issue of Concern 14
2.1 Introduction ............................................................................................................... 15
2.2 Background to risk reporting .................................................................................... 15
2.2.1 Changes in business environment and emergence of risk reporting ................. 16
2.2.2 Risk reporting as an issue of concern in banking institutions .......................... 18
2.3 Risk disclosure related policies, pressures and corporate responses......................... 19
2.4 Institutional arrangements and accounting regulations ............................................. 21
2.4.1 Cadbury Report ................................................................................................ 21
2.4.2 The American Institute of Certified Public Accountants .................................. 22
2.4.3 The Institute of Chartered Accountants in England and Wales ........................ 22
2.4.4 Hampel Report ................................................................................................. 24
2.4.5 Higgs Report and Smith Report ....................................................................... 24
2.4.6 International Financial Reporting Standards .................................................... 24
2.4.7 BASEL II: Pillar 3 (Market Discipline) ............................................................ 26
2.5 Risk disclosure as a major concern in Bangladesh ................................................... 28

viii
2.6 Chapter conclusion .................................................................................................... 31
Chapter 3: Bangladesh- the Context of the Study 33
3.1 Introduction ............................................................................................................... 33
3.2 Bangladesh as the country of study ........................................................................... 33
3.2.1 Bangladesh: Country profile ............................................................................. 34
3.2.2 Political and historical context .......................................................................... 34
3.2.3 Economic context .............................................................................................. 35
3.2.4 Socio-cultural context ........................................................................................ 38
3.2.5 Legal and institutional context .......................................................................... 39
3.3 The financial system in Bangladesh .......................................................................... 43
3.4 Banking industry in Bangladesh ............................................................................... 44
3.4.1 Evolution of banking industry ........................................................................... 45
3.4.2 Structure of the banking sector in Bangladesh .................................................. 45
3.5 Financial reforms in banking sector .......................................................................... 47
3.5.1 Risk measure policy reforms in banks .............................................................. 49
3.5.2 Institutional reform of risk measures ................................................................. 51
3.5.3 Legal reform ...................................................................................................... 53
3.6 Motivation for choosing Bangladesh as the context for this study ........................... 53
3.7 Motivation for selecting listed banks in Bangladesh ................................................ 55
3.8 Chapter conclusion .................................................................................................... 57
PART TWO 59
LITERATURE REVIEW AND THEORETICAL UNDERPINNING 59
Chapter 4: Literature Review 61
4.1 Introduction ............................................................................................................... 61
4.2 Risk and risk disclosure ............................................................................................ 62
4.2.1 The concept of risk ............................................................................................ 62
4.2.2 Classification of risk .......................................................................................... 63
4.3 The concept of disclosure in accounting and economics research ............................ 65
4.4 Risk disclosure: Review of previous studies ............................................................. 66
4.4.1 Empirical studies of risk reporting by banking institutions .............................. 69
4.4.2 Empirical studies of risk reporting in other than banking institutions .............. 71
4.5 Gaps in the literature ................................................................................................. 86
4.6 Chapter conclusion .................................................................................................... 87

ix
Chapter 5: Conceptual Framework and Hypotheses 89
5.1 Introduction ............................................................................................................... 89
5.2 Theories discussed in previous disclosure studies .................................................... 90
5.3 Agency theory ........................................................................................................... 90
5.3.1 The agency problem .......................................................................................... 91
5.3.2 Agency theory and the organisational perspective ............................................ 93
5.3.3 Relevance of agency theory in this study: Development of Hypotheses .......... 95
5.4 Institutional theory .................................................................................................... 97
5.4.1Defining institution ............................................................................................. 98
5.4.2 New institutionalism ........................................................................................ 101
5.4.3 Significance of institutional isomorphism ....................................................... 102
5.4.4 Isomorphism processes .................................................................................... 103
5.4.4.1 Coercive isomorphism ............................................................................. 103 5.4.4.2 Mimetic isomorphism .............................................................................. 105 5.4.4.3 Normative isomorphism .......................................................................... 107
5.5 The relation between risk disclosure and bank performance .................................. 108
5.5.1 Employee efficiency ........................................................................................ 109
5.5.2 Solvency efficiency ......................................................................................... 109
5.5.3 Deposit concentration ...................................................................................... 111
5.5.4 Financial performance ..................................................................................... 111
5.5.5 Risk disclosure and bank valuation ................................................................. 112
5.6 Conceptual framework ............................................................................................ 112
5.7 Chapter conclusion .................................................................................................. 113
PART THREE 116
METHODOLOGY ............................................. 116
Chapter 6: Research Methodology 118
6.1 Introduction ............................................................................................................. 118
6.2 Philosophical assumption ........................................................................................ 119
6.2.1 Ontological assumption ................................................................................... 120
6.2.2 Epistemological assumption ............................................................................ 121
6.3 Research type .......................................................................................................... 122
6.4 Theoretical perspective ........................................................................................... 122
6.5 Methodology ........................................................................................................... 123
6.5.1 Quantitative research approach ....................................................................... 123
6.5.2 Qualitative research approach ......................................................................... 124

x
6.5.3 Mixed method approach .................................................................................. 124
6.5.4 Paradigm adopted in this study ....................................................................... 125
6.5.5 Designing triangulation in mixed method research ......................................... 125
6.5.6 The convergence model of triangulation ......................................................... 127
6.6 The quantitative method .......................................................................................... 129
6.6.1 Research instrument ........................................................................................ 129
6.6.1.1 Content analysis approach ....................................................................... 129 6.6.1.2 Risk Disclosure Index .............................................................................. 131
6.6.2 Reliability of Risk Disclosure Index score ...................................................... 153
6.6.3 Sample design .................................................................................................. 154
6.6.4 Data collection ................................................................................................. 154
6.6.5 The dependent variable ................................................................................... 154
6.6.6 Independent and control variables ................................................................... 155
6.6.7 Statistical data analysis techniques .................................................................. 155
6.6.7.1 Descriptive statistics ................................................................................ 156 6.6.7.2 Univariate statistics .................................................................................. 156 6.6.7.3 Bivariate analysis .................................................................................... 157 6.6.7.4 Multiple regression model ....................................................................... 157
6.6.8 Sensitivity and supplemental analysis ............................................................. 166
6.7 The qualitative method ............................................................................................ 167
6.7.1 Justification of sampling procedure ................................................................ 168
6.7.2 Designing interview protocol .......................................................................... 169
6.7.3 Designing the interview protocol .................................................................... 169
6.7.4 Data collection technique ................................................................................ 170
6.7.5 Data analysis .................................................................................................... 171
6.7.6 Reliability and validity .................................................................................... 172
6.8. Ethical clearance .................................................................................................... 173
6.9 Chapter conclusion .................................................................................................. 173
PART FOUR 174 ANALYSIS .......................................................... 174
Phase One
Chapter 7: Content Analysis of Annual Reports………………………….. 170
7.1 Introduction ............................................................................................................. 176
7.2 Trends in total corporate risk disclosure ................................................................. 177
7.2.1 Risk disclosure by key categories ................................................................... 193
7.2.2 Risk disclosure by Risk Types ........................................................................ 194

xi
7.2.3 Qualitative and quantitative disclosure ........................................................... 195
7.3 Descriptive statistics for the Risk Disclosure Index ............................................... 196
7.4 Comparison of Risk Disclosure Index over the period: Univariate analysis ......... 199
7.4.1 Significance of Risk Disclosure Index over the period: ANOVA .................. 199
7.4.2 Conventional and non-conventional banks .................................................... 200
7.4.3 Comparisons of pre- and post GFC periods .................................................... 201
7.5 Discussion of results ............................................................................................... 203
7.6 Chapter conclusion .................................................................................................. 204
Phase Two
Chapter 8: Qualitative Analysis of Interview Data 206
8.1 Introduction ............................................................................................................. 206
8.2 Risk disclosure practices and rationale for disclosure ............................................ 208
8.3 Determinants of risk disclosure ............................................................................... 210
8.3.1 Institutional isomorphism ................................................................................ 211
8.3.2 Risk governance factors .................................................................................. 214
8.4 Additional findings from interviewees.................................................................... 216
8.4.1 Institutional weakness ..................................................................................... 216
8.4.2 Political interference ........................................................................................ 218
8.4.3 Lack of central bank autonomy ....................................................................... 220
8.4.4 Lack of accountability ..................................................................................... 221
8.4.5 Lack of demand from governments ................................................................. 221
8.4.6 Lack of education ............................................................................................ 222
8.4.7 Brief and concise report .................................................................................. 223
8.5 Chapter conclusion .................................................................................................. 223
Chapter 9: Descriptive, Univariate and Bivariate Analyses 226
9.1 Introduction ............................................................................................................. 226
9.2 Sample and source of data ...................................................................................... 227
9.3 Descriptive statistics................................................................................................ 227
9.4 Univariate statistics: ANOVA and Chi-Square tests .............................................. 238
9.4.1 Significance of mean over time: ANOVA ...................................................... 238
9.4.2 Continuous variable: T tests ............................................................................ 238
9.4.3 Categorical variables: Chi-Square tests ........................................................... 239

xii
9.5 Bivariate analysis .................................................................................................... 240
9.6 Chapter conclusion .................................................................................................. 244
Chapter 10: Factors Underlying Risk Disclosure: Multivariate Statistics 246
10.1 Introduction ........................................................................................................... 246
10.2 Multivariate regression model .............................................................................. 247
10.3 Normality and multicollinearity ............................................................................ 248
10.3.1 Normality ....................................................................................................... 248
10.3.2 Multicollinearity ............................................................................................ 251
10.4 Multiple regression results: Hypothesis testing .................................................... 253
10.4.1 Agency theory and Risk Disclosure Index ................................................... 255
10.4.2 Institutional isomorphism and Risk Disclosure Index .................................. 256
10.4.3 Control variables ........................................................................................... 257
10.5 Sensitivity analysis ................................................................................................ 257
10.6 Robustness check .................................................................................................. 261
10.6.1 Association of Risk Disclosure Index with profitability ............................... 261
10.6.2 Five types of Risk Disclosure ........................................................................ 263
10.7 Change in Risk Disclosure Index across the sample periods ................................ 268
10.8 Discussion of results ............................................................................................. 276
10.9 Chapter conclusion ................................................................................................ 278
Phase Three
Chapter 11: Risk Disclosure and Bank Performance 279
11.1 Introduction ........................................................................................................... 279
11.2 Descriptives, t-tests and correlations..................................................................... 283
11.3 Regression analysis ............................................................................................... 287
11.4 Supplemental analysis ........................................................................................... 291
11.4.1 Bank performance in risk disclosure groups ................................................. 291
11.4.2 Bank performance and risk disclosure in Non-Islamic and Islamic banks ... 297
11.4.3 Bank performance and Risk Types ............................................................... 300
11.5 Discussion of results ............................................................................................. 312
11.6 Chapter conclusion ................................................................................................ 313

xiii
PART FIVE 314 CONCLUSION ......................................................... 314
Chapter 12: Conclusion 316
12.1 Introduction ........................................................................................................... 316
12.2 Overview ............................................................................................................... 317
12.3 Research findings and implications ...................................................................... 322
12.4 Research contribution............................................................................................ 325
12.5 Research limitations .............................................................................................. 328
12.6 Suggestions for future research ............................................................................. 329
References .......................................................................................................... 333
Appendices ......................................................................................................... 351

xiv

xv
List of Tables
Table 1.1: Key terms ......................................................................................................... 9
Table 3.1: Economy of Bangladesh ................................................................................ 37
Table 3.2: Structure of the banking system in Bangladesh ............................................. 46
Table 3.3: Bank branches in urban and rural areas (up to June 2013) ............................ 47
Table 4.1: Classification of risk in extant literature ........................................................ 64
Table 4.2: Empirical studies of corporate risk disclosure ............................................... 77
Table 5.1: Components of institutional analysis ........................................................... 100
Table 5.2: The new and old institutionalism ................................................................. 101
Table 6.1: Paradigmatic concerns and research approaches ......................................... 125
Table 6.2: Risk Disclosure Index .................................................................................. 134
Table 6.3: Reliability tests of Risk Disclosure Index comparability ............................ 153
Table 6.4: Variable definitions (Model 1)..................................................................... 161
Table 6.5: Variable definitions (Models 2-7) ................................................................ 165
Table 6.6: Variable definition ....................................................................................... 167
Table 7.1: Average Risk Disclosure Index (RDI) score .............................................. 178
Table 7.2: Mean Risk Disclosure Index score (per cent of max. possible [147]) ......... 179
Table 7.3: Mean Risk Disclosure Index (RDI) score (%) by category ......................... 193
Table 7.4: Mean Risk Disclosure Index (RDI) score (%) by Risk Type .................... 194
Table 7.5: Mean Qualitative and Quantitative Risk Disclosure Index (RDI) score ...... 196
Table 7.6: Descriptive statistics for seven key categories of Risk Disclosure Index .... 197
Table 7.7: Descriptive statistics for seven categories individually and aggregately ..... 198
Table 7.8: Risk Disclosure Index (%) by year ANOVA ............................................... 199
Table 7.9: Mean difference between conventional and non-conventional ................... 200
Table 7.10: Wilcoxon Signed Rank tests ...................................................................... 201
Table 7.11: Paired sample t tests of mean RDI (%) across discrete periods ................. 202
Table 7.12: Paired sample t-tests .................................................................................. 203
Table 9.1: Descriptive statistics by complete sample ................................................... 229
Table 9.2(Panel A): Descriptive statistics year 2006 .................................................... 231
Table 9.2(Panel B): Descriptive statistics year 2007 .................................................... 232
Table 9.2(Panel C): Descriptive statistics year 2008 .................................................... 233
Table 9.2(Panel D): Descriptive statistics year 2009 .................................................... 234
Table 9.2(Panel E): Descriptive statistics year 2010 .................................................... 235
Table 9.2(Panel F): Descriptive statistics year 2011 ..................................................... 236

xvi
Table 9.2:(Panel G): Descriptive statistics year 2012 ................................................... 237
Table 9.3: ANOVA by year .......................................................................................... 238
Table 9.4: t tests for continuous variables ................................................................... 238
Table 9.5: Pearson Chi-Square test for categorical variables ....................................... 240
Table 9.6: Pearson’s Correlations Pooled Data............................................................. 242
Table 10.1: Variable Definitions ................................................................................... 248
Table 10.2: Normality analysis for pooled data ............................................................ 250
Table 10.3: Collinearity statistics for pooled data ........................................................ 252
Table 10.4: Pooled OLS robust regression results for Risk Disclosure Index .............. 254
Table 10.5: Pooled OLS regression results for the Risk Disclosure Index ................... 259
Table 10.6: Pooled OLS regression results for Risk Disclosure Index ......................... 260
Table 10.7: Pooled OLS regression results for Risk Disclosure Index ......................... 262
Table 10.8: Pooled OLS regression results for five types of risks ................................ 265
Table 10.9: Variable definitions .................................................................................... 269
Table 10.10:Change in Risk Disclosure Index in pre and post GFC periods ............... 272
Table 10.11: Summary of significant variables from Table 10.10 ............................... 274
Table 10.12: Difference in Mean Risk Disclosure between the periods ....................... 275
Table 11.1: Variable definitions .................................................................................... 282
Table 11.2: Descriptive and t- statistics by complete sample ....................................... 284
Table 11.3: Pearson’s Correlations Pooled Data........................................................... 286
Table 11.4: Regression model (Models 2-7) ................................................................. 289
Table 11.5: Descriptive Statistics and t-tests for variables ........................................... 293
Table 11.6: Regression results for High and Low Risk Disclosure groups .................. 295
Table 11.7: Regression results for High and Low Risk Disclosure groups .................. 298
Table 11.8: Regression results -Lag_Market Risk Disclosure Index ............................ 302
Table 11.9: Regression results -Lag Credit Risk Disclosure Index .............................. 304
Table 11.10: Regression results -Lag Solvency Risk Disclosure Index ....................... 306
Table 11.11: Regression results -Lag Operational Risk Disclosure Index ................... 308
Table 11.12: Regression results -Lag Equities Risk Disclosure Index ......................... 310
Table 12.1: This thesis’ research at a glance................................................................. 318

xvii
List of Figures
Figure 1.1: Roadmap of Chapter ....................................................................................... 3
Figure 1.2: Depiction of the framework for this research ................................................. 9
Figure 1.3: Research purpose and the three Phases ........................................................ 11
Figure 1.4: Structure of the thesis ................................................................................... 13
Figure 2.1: Roadmap of Chapter ..................................................................................... 15
Figure 2.2: Factors affecting financial reporting............................................................. 17
Figure 3.1: Roadmap of Chapter ..................................................................................... 33
Figure 3.2: The national flag and map of Bangladesh .................................................... 35
Figure 3.3: Structure of the financial system in Bangladesh .......................................... 44
Figure 3.4: Bangladesh real GDP growth ....................................................................... 55
Figure 3.5: Deposits in years 2008-2012 ........................................................................ 56
Figure 3.6: Deposits in the banking sector, 2012 ............................................................ 56
Figure 3.7: Percentage share of assets (2007-2012)........................................................ 57
Figure 4.1: Roadmap of Chapter ..................................................................................... 61
Figure 5.1: Roadmap of Chapter ..................................................................................... 90
Figure 5.2: Agency theoretical perspective ..................................................................... 93
Figure 5.3: Conceptual framework for this study ......................................................... 113
Figure 6.1: Roadmap of Chapter ................................................................................... 118
Figure 6.2: Continuum of ontological assumptions ...................................................... 120
Figure 6.3: The convergence model used in this study ................................................. 127
Figure 6.4: Summary of the research design ................................................................. 128
Figure 6.5: Narratives in annual reports ........................................................................ 130
Figure 6.6: Qualitative data analysis technique ............................................................ 172
Figure 7.1: Roadmap of Chapter 7 ................................................................................ 177
Figure 8.1: Roadmap of Chapter 8 ................................................................................ 207
Figure 9.1: Roadmap of Chapter 9 ................................................................................ 227
Figure 10.1: Roadmap of Chapter 10 ............................................................................ 247
Figure 11.1: Roadmap of Chapter 11………………………………………………… 282

xviii
xix
List of Appendices
Appendix 6.1: Research paradigmatic dichotomies………………………………. 349
Appendix 6.2: Research types……………………………………………………… 350
Appendix 6.3: Summarises the prototypical characteristics of mixed method…… 351
Appendix 6.4: Interview Protocol ………………………………………………… 352
Appendix 6.5: Consent form………………………………………………………… 354
Appendix 6.6: Ethics Approval Letter………………………………………………. 356
Appendix 7.1: Tukey HSD………………………………………………………… 359
Appendix 7.2: Eta squared statistic ……………………………………………….. 360
Appendix 9.1: Presents the post hoc Tukey p values in each year………………… 361
Appendix 9.2: Eta squared statistic………………………………………………….. 364
Appendix 10.1: Correlations A-E……………………………………………………. 365
Appendix 10.2: Correlations change Risk Disclosure Index 2006 and 2008………... 370
Appendix 10.3: Correlations change Risk Disclosure Index 2006 and 2012 …….. 371
Appendix 10.4: Correlations change Risk Disclosure Index 2006 and 2010……... 372
Appendix 10.5: Correlations change Risk Disclosure Index 2010 and 2012……... 373


1
PART ONE
PRELIMINARIES
Part one of this thesis introduces the research background and provides the structure of
the thesis. Chapter 1 presents an overview of the study. It starts with a brief discussion
of the background to the research, objectives of the study, research approach and
outlines the structure of the thesis. Chapter 2 provides discussion of the issue of risk
reporting in detail and Chapter 3 provides an overview of Bangladesh as a country and
why it is chosen as the location for this study.
Chapter 1: Introduction
Chapter 2: Risk reporting as an issue of concern
Chapter 3: Bangladesh – the context of the study

2

3
CHAPTER 1: Introduction
1.1 Introduction
This study extends our knowledge by undertaking an empirical investigation into
financial institutions’ corporate risk disclosure practices in an effectively voluntary
environment, the determinants of those practices and their association with financial
performance. This is an underexplored area in receipt of little attention in the financial
reporting literature.
Briefly, the study consists of three interrelated Phases under a common theme of ‘risk
disclosure practices: their determinants and their association with bank performance’.
The first Phase of the study investigates the corporate risk disclosure practices of all
listed banks in Bangladesh over a seven-year period (2006-2012). The second Phase
investigates the determinants of these corporate risk disclosure practices. The third and
final Phase of the study investigates the association of corporate risk disclosure with
bank performance. Taken together, the three Phases enhance and advance corporate risk
reporting research using various methodological lenses and perspectives. The purpose
of this Chapter is to provide an overview of the study. Figure 1.1 provides a roadmap of
this Chapter.
1Figure 1.1: Roadmap of Chapter
Introduction (1.1) Research
background and
motivation (1.2)
Introduction (1.1)
Glossary of key
terms (1.4)
Research
justification and
objectives (1.3)
Thesis outline
(1.6)
Research approach
(1.5)
4
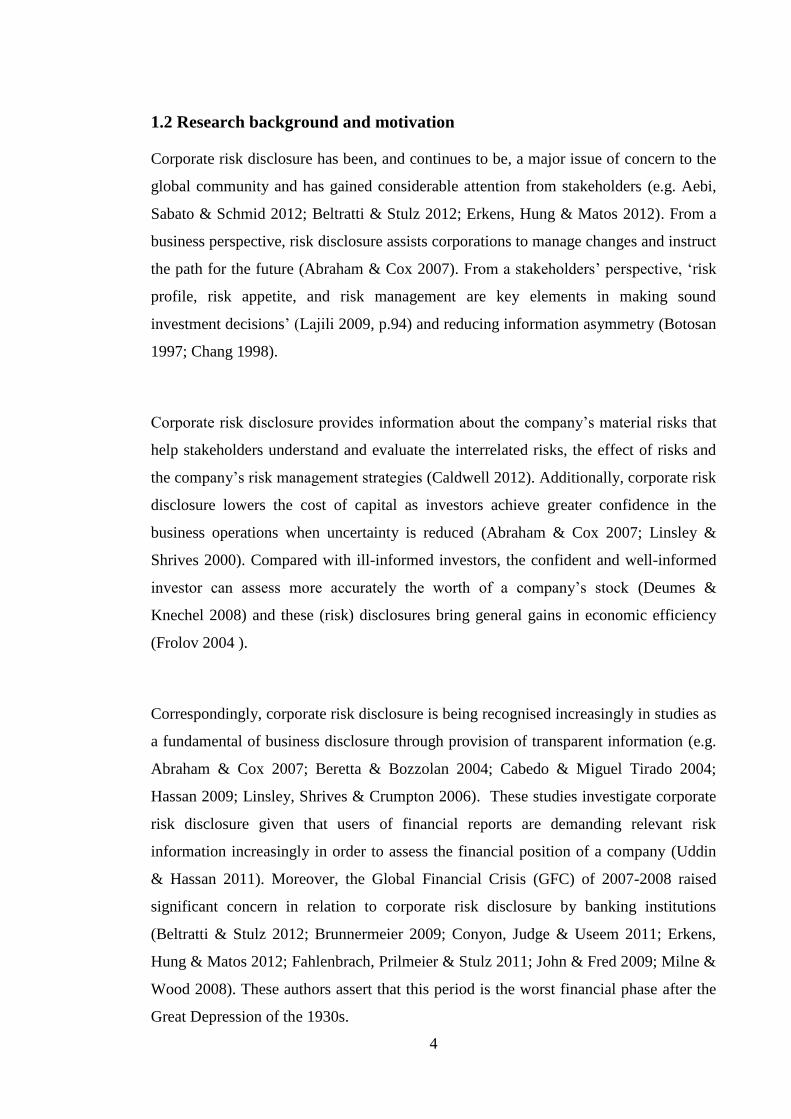
1.2 Research background and motivation
Corporate risk disclosure has been, and continues to be, a major issue of concern to the
global community and has gained considerable attention from stakeholders (e.g. Aebi,
Sabato & Schmid 2012; Beltratti & Stulz 2012; Erkens, Hung & Matos 2012). From a
business perspective, risk disclosure assists corporations to manage changes and instruct
the path for the future (Abraham & Cox 2007). From a stakeholders’ perspective, ‘risk
profile, risk appetite, and risk management are key elements in making sound
investment decisions’ (Lajili 2009, p.94) and reducing information asymmetry (Botosan
1997; Chang 1998).
Corporate risk disclosure provides information about the company’s material risks that
help stakeholders understand and evaluate the interrelated risks, the effect of risks and
the company’s risk management strategies (Caldwell 2012). Additionally, corporate risk
disclosure lowers the cost of capital as investors achieve greater confidence in the
business operations when uncertainty is reduced (Abraham & Cox 2007; Linsley &
Shrives 2000). Compared with ill-informed investors, the confident and well-informed
investor can assess more accurately the worth of a company’s stock (Deumes &
Knechel 2008) and these (risk) disclosures bring general gains in economic efficiency
(Frolov 2004 ).
Correspondingly, corporate risk disclosure is being recognised increasingly in studies as
a fundamental of business disclosure through provision of transparent information (e.g.
Abraham & Cox 2007; Beretta & Bozzolan 2004; Cabedo & Miguel Tirado 2004;
Hassan 2009; Linsley, Shrives & Crumpton 2006). These studies investigate corporate
risk disclosure given that users of financial reports are demanding relevant risk
information increasingly in order to assess the financial position of a company (Uddin
& Hassan 2011). Moreover, the Global Financial Crisis (GFC) of 2007-2008 raised
significant concern in relation to corporate risk disclosure by banking institutions
(Beltratti & Stulz 2012; Brunnermeier 2009; Conyon, Judge & Useem 2011; Erkens,
Hung & Matos 2012; Fahlenbrach, Prilmeier & Stulz 2011; John & Fred 2009; Milne &
Wood 2008). These authors assert that this period is the worst financial phase after the
Great Depression of the 1930s.

5
Despite the growing attention on and importance of corporate risk disclosure,
considerable bodies of literature that reflect detailed academic work on disclosure and
on corporate governance, there remains limited research on corporate risk disclosure. In
particular, research linking risk disclosure with governance mechanisms, is rare
(Abraham & Cox 2007; Lajili 2009; Lajili & Zéghal 2005). According to Linsley and
Shrives (2005a), although various aspects of disclosure have been investigated in the
last 20-30 years, risk disclosure has not yet been examined seriously.
Most existing studies on risk disclosure, whether in financial or non-financial
institutional settings, provide empirical evidence from developed countries. The extant
studies focus on Anglo-Saxon countries (e.g. Abraham & Cox 2007; Deumes &
Knechel 2008; Lajili 2009; Lajili & Zéghal 2005; Linsley & Lawrence 2007; Linsley,
Shrives & Crumpton 2006; Solomon et al. 2000); European Latin countries (e.g.
Oliveira, Rodrigues & Craig 2011), French (e.g.Thuélin, Henneron & Touron 2006);
Asian countries (e.g. Mohobbot 2005); and Arab countries (e.g. Hassan 2009).
However, the difference in institutional and socio-economic settings might affect the
extent and nature of corporate risk disclosure differentially in between developed and
developing countries. For example, institutional pressure might create doubts about the
effectiveness of the Anglo-Saxon model of corporate governance when applied in
developing countries (Khan, Muttakin & Siddiqui 2013). Developing countries, which
are economically more vulnerable, many have not yet implemented international
disclosure standards from which they might benefit.
The International Accounting Standards Board (IASB) issued International Financial
Reporting Standard (IFRS) 7 (Financial Instruments: Disclosures) in 2005 to become
effective in January 2007. However, the slowdown in the global economy during the
GFC (2007-2008) and the increasing demand for risk reporting highlighted diverse risk
reporting practices, some of which were deficient, resulting in several regulatory
amendments in IFRS 7. In the banking industry, another relevant standard is Basel II:
Market Discipline (hereafter international standards), which was issued by the Basel
Committee on Banking Supervision (BCBS) in 2004. Basel II provides
recommendations on banking laws and regulations, guidelines for accounting practices

6
and disclosure and creates requirements in some countries. The implementation process
of Basel II: Market Discipline was generally slow prior to 2007-2008 until the GFC
caused a major banking crisis through default credit, mortgage backed securities, and
similar derivatives (Barth & Landsman 2010; Brunnermeier 2009). The issuance of
global guidance in relation to risk reporting, and its tightening via amendments over
time in the context of the GFC, offers the opportunity to document corporate responses
and to examine changes in reporting practices over time. Examining these changes in a
developing country is especially important since the changes are likely to be from a
comparatively low base of risk disclosure. Bangladesh, among the developing
countries, marked the beginning of a major development in its financial reporting
through implementing both of these international standards after the GFC (2007-2008).
In addition, the presence of a number of listed banks (30) in Bangladesh provides an
adequate sample for the collection of information and provides sufficient statistical
power for this longitudinal study to provide rigorous results. Moreover, the population
of banks in Bangladesh consists of both conventional (i.e. interest-based operations) and
non-conventional (Islamic Shariah based, i.e. profit/loss sharing mode) banks. The
practice of non-conventional (Islamic) banking in Bangladesh, which follows Islamic
Shariah law, might mean different levels of corporate risk disclosure compared with that
of conventional banks. For these reasons, corporate risk disclosure, particularly in the
banking industry, is deserving of greater research attention than it has received to date.
Previous studies (e.g. Abraham & Cox 2007; Dobler, Lajili & Zéghal 2011; Lajili 2009;
Linsley & Shrives 2005a) investigate corporate risk disclosures and the determinants of
these empirically by examining annual reports, however, very little is known about
regulators’ perceptions of the determinants of corporate risk disclosure. As regulators
are involved, either directly or indirectly, in the risk reporting process, it is important to
explore regulators’ insights in order to achieve a better understanding. This study
reports analysis of interviews with senior regulators and bank officials in order to
provide greater insights to evidence from empirical analysis. Access to such senior
personnel is rare and no prior disclosure studies combine evidence from multiple
sources in the way this study achieves. Briefly put, this research aims to investigate risk

7
disclosure practices, their determinants and the association of risk disclosure with
financial performance by banking institutions in a comprehensive longitudinal study
using Bangladesh as the institutional setting using both quantitative and qualitative
research methods.
1.3 Research justification and objectives
There are three objectives of this study. The first objective is to examine corporate risk
disclosure practices as evidenced in Bangladesh listed banks’ annual reports over a
seven-year period (2006-2012). The purpose of this longitudinal study is to provide a
snapshot of the volume and types of risk disclosure and examine whether the issuance
of international standards (IFRS 7 and Basel II: Market Discipline) triggered changes in
corporate risk disclosure. In addition, the lack of longitudinal studies investigating
changes in risk disclosure behaviours by banks motivates this study, which attempts to
fill a research gap and add to the existing body of knowledge on risk disclosure
practices. It is of interest to investigate how risk reporting has developed over time in
response to the development of new international standards and codes of corporate
governance (Ahsan, Skully & Wickramanayake 2009) in order to evaluate likely future
changes, for example in response to implementation of Basel III1. This is especially so
in a developing country such as Bangladesh due to implementation of Basel III in 2015
(Siddikee, Parvin & Hossain 2013).
The second objective is to identify the relationship between risk disclosure and bank
characteristics. The findings of previous studies (Helbok & Wagner 2006; Hossain
2008) reveal that the extent of risk disclosure is related to bank characteristics, however
perceptions by regulators in relation to risk disclosure determinants has been unexplored
in previous studies. This study focuses on the determinants of risk disclosure by testing
data gathered from annual reports empirically and, in addition, by interviewing
representatives from the banking regulatory sphere to identify their perceptions about
risk disclosure.
1 Basel III was initially scheduled to be implemented from 2013 until 2015; however, the implementation
process is now extended until March 2019.

8
The third objective of this study is to investigate the association of risk disclosure with
banks’ financial performance. Previous studies offer insights into the potential
usefulness and perceived benefits and cost of disclosure (Botosan 1997; Lajili 2009;
Linsley, Shrives & Crumpton 2006). These authors assert that improved disclosure
enhances corporate transparency and provides useful information to stakeholders,
lowers the cost of capital, and reduces information asymmetry. There has been limited
research on whether forces attributable to institutional theory are capable of influencing
banking operational behaviour, and more specifically, even more limited research on
this topic in developing economies. As mentioned earlier, the institutional setting of a
developing country is different from that of a developed country. Examining the
association of corporate risk disclosure with financial performance warrants research in
a developing economy setting. This study goes one-step further by examining the
association of risk disclosure with banks’ operating performance and bank valuation.
Based on the above research objectives, the research questions posed in this study are:
Research Question 1: What is the extent of corporate risk disclosure and to what extent
did banks in Bangladesh respond to the development of international standards relevant
to risk and its disclosure (IFRS 7 and Basel II: Market Discipline)?
Research Question 2: What bank characteristics and/or institutional pressures act as
determinants for disclosure of risk?
Research Question 3: Does risk disclosure have an association with bank performance?
Based on the research questions above, Figure 1.2 depicts the framework for this
research.

9
1.4 Key terms
This section highlights the definitions of key concepts and terms that are used
extensively throughout this thesis. These are presented in Table 1.1.
Term Explanation
Risk Disclosure ‘If the reader is informed of any opportunity or prospect, or of any hazard,
danger, harm, threat or exposure, that has already impacted upon the
company or may impact upon the company in the future or of the
management of any such opportunity, prospect, hazard, harm, threat or
exposure’ (Linsley & Shrives 2006, p.389).
Risk Disclosure
Index
A comprehensive Risk Disclosure Index has been developed in this study
to examine the extent of risk disclosure by listed banks in Bangladesh.
This benchmark set is based on international standards (IFRS 7 and Basel
II: Market Discipline) and an extensive list of risk disclosure items from
key previous studies. The Risk Disclosure Index consists of 147 specific
risk items in seven categories.
2Figure 1.2: Depiction of the framework for this research
1 Table 1.1: Key terms
Research Question 1 Research Question 2
Research Question 3
The extent of risk disclosure in annual
reports
Determinants of risk disclosure
Association of risk disclosure with
performance

10
Term Explanation
Voluntary and
Mandatory
disclosures
Mandatory disclosure: Any disclosure that is required by law,
accounting principles, or regulatory agencies’ regulations are
mandatory disclosure (Hassan & Halbouni 2013).
Voluntary disclosure: Any disclosure that is not classed as mandatory.
In the absence of mandatory requirements under the Bangladesh Bank
Company Act 1991 (amended in 2003), or the Companies Act 1994,
International Financial Reporting Standards (IFRS) or Bangladesh
Accounting Standards (Bangladesh Financial Reporting Standards), it is
argued in this thesis that risk disclosure effectively is voluntary for listed
banking institutions.
Determinants The key underlying factors in relation to risk disclosure in this study are
based on two underpinning theories (agency theory and neo institutional
isomorphism).
Performance Bank performance is measured using two aspects; bank operating
performance (e.g. financial performance, employee efficiency, solvency
efficiency and deposit concentration) and bank valuation (Tobin’s q and
book-to market ratio).
Global financial
crisis (GFC)
The GFC (2007-2008) raised significant concern in relation to corporate
risk disclosure as large numbers of financial institutions collapsed in the
U.K (RBS and HBOS), in the U.S (Citigroup, Lehman Brothers, Merrill
Lynch, and also in other European Countries (Dexia, Hypo RealEstate
and UBS). In Bangladesh, there is growing evidence that the post- GFC
(2007-2008) impacts are manifested in declining exports, declining
migration of labour, a growing number of sick industries, industrial
unrest, and reduced growth (Bangladesh Bank 2013b).
1.5 Research approach
As mentioned earlier, three interrelated Phases examine the research questions involved
in this study. The research method employed is detailed in Chapter 6. As shown in
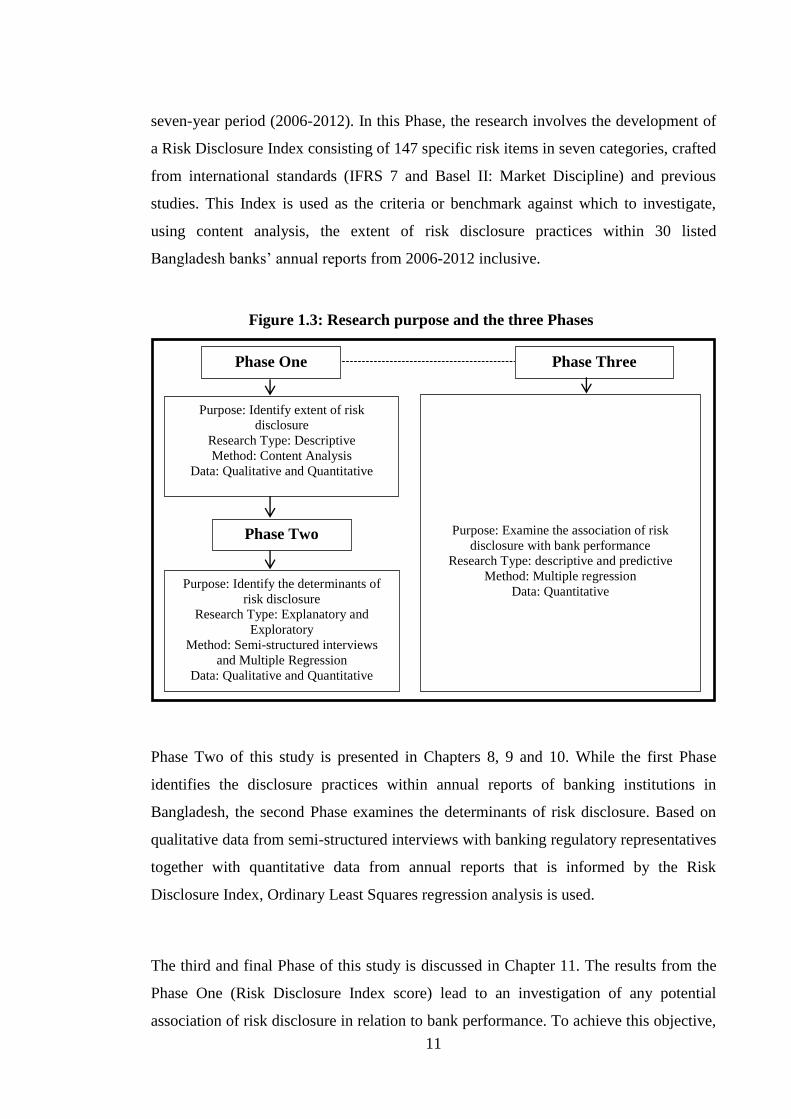
Figure 1.3, Phase One of this study, presented in Chapter 7, investigates the extent of
risk disclosure of all listed banks on the Dhaka Stock Exchange in Bangladesh over a
11
seven-year period (2006-2012). In this Phase, the research involves the development of
a Risk Disclosure Index consisting of 147 specific risk items in seven categories, crafted
from international standards (IFRS 7 and Basel II: Market Discipline) and previous
studies. This Index is used as the criteria or benchmark against which to investigate,
using content analysis, the extent of risk disclosure practices within 30 listed
Bangladesh banks’ annual reports from 2006-2012 inclusive.
Phase Two of this study is presented in Chapters 8, 9 and 10. While the first Phase
identifies the disclosure practices within annual reports of banking institutions in
Bangladesh, the second Phase examines the determinants of risk disclosure. Based on
qualitative data from semi-structured interviews with banking regulatory representatives
together with quantitative data from annual reports that is informed by the Risk
Disclosure Index, Ordinary Least Squares regression analysis is used.
The third and final Phase of this study is discussed in Chapter 11. The results from the
Phase One (Risk Disclosure Index score) lead to an investigation of any potential
association of risk disclosure in relation to bank performance. To achieve this objective,
3 Figure 1.3: Research purpose and the three Phases
Phase One Phase Three
Phase Two
Purpose: Identify extent of risk
disclosure
Research Type: Descriptive
Method: Content Analysis
Data: Qualitative and Quantitative
Purpose: Identify the determinants of
risk disclosure
Research Type: Explanatory and
Exploratory
Method: Semi-structured interviews
and Multiple Regression
Data: Qualitative and Quantitative
Purpose: Examine the association of risk
disclosure with bank performance
Research Type: descriptive and predictive
Method: Multiple regression
Data: Quantitative

12
this Phase utilises primarily quantitative financial data from the annual reports of the
banks within this study.
1.6 Research contribution
The study contributes to the literature in several ways; First, in an attempt to redress in
part the empirical scarcity in risk disclosure studies in South Asian developing
countries, this study is the first to provide knowledge of corporate risk disclosure
practices and their underlying factors. Second, it helps assess the impact of new
international standards upon the extent of risk disclosures in a weak economic period
(GFC) and beyond. Third, a comprehensive Risk Disclosure Index is developed based
on international standards and is used as a benchmark against which to score actual risk
disclosures. The Risk Disclosure Index constructed in this study is of relevance to
financial institutions seeking to provide information for stakeholders and, indeed, to all
relevant parties seeking to assess or evaluate information in relation to risk disclosure.
To the researcher knowledge, the Risk Disclosure Index developed in this study is the
first, developed for the banking industry. Finally, the Risk Disclosure Index could be
used as a guideline for corporate risk disclosure in financial reporting and could be
used as an early warning system for banking institutions in any country. In addition, the
Risk Disclosure Index, developed in this research, contributes to the literature by
quantifying the extent of risk disclosure and identifying the factors determining them.
Stakeholders, particularly depositors and investors, can use this Index in selecting
their bank of interest. A detailed discussion on research contribution is presented in
Chapter 12.
1.7 Thesis outline
Figure 1.4 depicts the structure of the study and reveals that it is organised in Five Parts.
Part One comprises three Chapters. Chapter 1, this Chapter, describes the significance
of the study, research objectives and research questions, the approach, and thesis
structure. Chapter 2 introduces risk disclosure as an issue of concern and overviews the
regulatory framework and institutional arrangements for developing a risk-reporting
framework. Chapter 3 presents the contextual background and explains the major
impetus for selecting Bangladesh as the location for this study.

13
4Figure 1.4: Structure of the thesis
Part One: Introduction and research background
Chapter 1 presents an introduction to the research study
Chapter 2 provides the background to risk disclosure concerns
Chapter 3 presents the background context of Bangladesh as the location for the study
Part Two: Literature Review and Theoretical Underpinning
Chapter 4 presents previous studies on corporate risk disclosure
Chapter 5 presents the theoretical framework, conceptual framework and development
of Hypotheses
Part Three: Methodology
Chapter 6 presents the research methodology adopted. Data collection techniques are
described in this Chapter also
Part Four: Analysis and results
Phase One
Chapter 7 reports on the content analysis of sample banks’ annual reports
Phase Two
Chapter 8 presents the thematical discussion using qualitative interview data in relation
to the determinants of risk disclosure
Chapter 9 reports the descriptive results prior to further analysis of quantitative data
Chapter 10 reports the multiple regression results for the model adopted to investigate
the association between risk disclosures and their potential determinants
Phase Three
Chapter 11 presents the multiple regression results for the model developed to examine
the association between risk disclosure and bank performance
Part Five: Conclusion
Chapter 12 comprises a summary of the findings, implications, limitations, and
recommendations for future research

14
Part Two consists of two Chapters, Chapters 4 and 5. Chapter 4 reviews relevant
literature. This Chapter also identifies gaps in the literature addressed by this study and
the applicability of risk disclosure practices within developing country contexts.
Chapter 5 presents the theoretical framework for this study and provides justification for
and an overview of the theoretical framework (agency theory and neo institutional
isomorphism) underpinning this research. This Chapter introduces the conceptual
framework underpinning this study also.
Part Three explains the methodology used in this study. Chapter 6 describes the
research design, sample, research instruments and analytical techniques and approaches.
As the research objectives of this study support a mixed method approach, the Chapter
explains both qualitative and quantitative methods of data collection and analysis
techniques. Part Four presents analysis of the data gathered from annual reports and
interviews. Chapter 7 presents the content analysis of data elicited from annual reports,
Chapter 8 thematically analyses the qualitative data and Chapters 9, 10 and 11 present
the quantitative data analysis using statistical techniques such as multiple regression.
The final Part presents the research findings, conclusions and implications. Chapter 12
provides the conclusions relating to risk disclosure practices, their determinants and
performance by banks in Bangladesh. The thesis concludes with the summary of the
findings, the research limitations and ideas for further potential research are provided.

15
CHAPTER 2: Risk Reporting as an Issue of Concern
2.1 Introduction
The primary objective of this Chapter is to introduce the issue of risk reporting as a
corporate and regulatory concern. This Chapter presents a background to and overview
of risk reporting to provide an explanation of corporate risk reporting practice.
Shareholders and other stakeholders desire banks to disclose both financial and non-
financial information for related investment, credit and other decisions. To fulfil
stakeholders’ demands effectively, financial reporting has been improving and
increasingly communicating information with regard to risk profile (Beretta & Bozzolan
2004). Moreover, the demand by stakeholders for risk reporting has been increasing
after the GFC of 2007-2008 (Lajili 2009; Michael, Kaouthar & Daniel 2011).
Before turning to discussion of the background contextualisation of Bangladesh in the
next Chapter, this Chapter addresses the key concepts underlying the research questions
identified in Chapter 1. Figure 2.1 depicts the structure of this Chapter as follows.
2.2 Background to risk reporting
Risk reporting has been of increasing importance in international policy arenas and
raised significant interest around the world (Aebi, Sabato & Schmid 2012). The
5Figure 2.1: Roadmap of Chapter
Introduction (2.1)
Background to risk
reporting (2.2)
Overview of
institutional setting
(2.4)
Policies, pressures
and corporate
response (2.3)
Risk disclosure as a
major concern in
Bangladesh (2.5)
Chapter conclusion
(2.6)

16
increasing complexity of business and need for transparency create demand for clarity
in disclosing companies’ risk profiles, risk management and risk monitoring processes
(Michael, Kaouthar & Daniel 2011). Hassan and Halbouni (2013) argue that annual
reports should provide the integral business process that communicates between the
company and key stakeholders as to whether stakeholders’ concerns have been
understood by the company. This section highlights the characteristics of the business
environment that create demand for risk disclosure and motivates regulators and
accounting professionals to enhance the quality of reporting.
2.2.1 Changes in business environment and emergence of risk reporting
The business environment has changed dramatically over the past decade, driven by
technological advancement, globalisation of markets and concentration of power in
market investors (Albrecht & Sack 2010). These changes make the business
environment more demanding for stakeholders to comprehend and similarly so for
business information without complete accompanying explanations (Beretta &
Bozzolan 2004). Figure 2.2 highlights the factors affecting reporting by companies.
Technological advancements such as computers, the internet, and data transmission
software have simplified the development of business, thereby creating opportunities
and challenges for companies. Such technological advancement has made it easier for
companies to communicate with investors. Additionally, globalisation of business has
allowed the world to become one giant marketplace with increased availability of
competitive information (Albrecht & Sack 2010). Given the differences in legal, social
and economic circumstances in different countries and also the differences in need for
accounting information among users of financial information, there have been calls by
international standard setters to harmonise accounting standards related to the
preparation of financial reporting (Beretta & Bozzolan 2004). Particularly, the
international harmonisation of accounting practices has been a central concern for
companies operating in more than one country (Marshall & Weetman 2002).

17
Source: Adapted from Albrecht and Sack (2010)
Albrecht and Sack (2010) argue that the combined forces of technology, globalisation
and market power have increased competition, regulation, financial volatility and the
level of uncertainty about business entities. Consequently, shareholders and other
stakeholders want listed companies to disclose financial as well as non-financial
information in relation to companies’ future performance (Albrecht & Sack 2010;
Beretta & Bozzolan 2004). In this sense, Beretta and Bozzolan (2004, p. 266) argue
that ‘listed companies have been improving the communication of their long-term
value-generation capabilities by increasing the amount of information disclosed with
regard to the risks faced and their expected impact on future profits’.
Moreover, many organisations have adopted rapid business expansion through either
internal development or mergers and acquisitions (Hill & Short 2009). However, such
expansion raises many challenges and concerns for investors. In addition, companies are
being confronted with frequent change in laws and regulations (Barth, Caprio Jr &
Levine 2004). Complying with these regulations is sometimes costly and adversely
affects companies’ operating cost and performance. Therefore, extant research argues
that corporate risk disclosure could be an effective monitoring system because it
provides a greater transparency and increases investors’ confidence in their decisions
6Figure 2.2: Factors affecting financial reporting
Drivers
Changes
- Technology
- Globalisation
- Concentration of Market Power
- Increased competition - Increased regulation - Financial volatility - Concentrated Market Power - Increasingly complex business - Better, quicker, and more decisive strategic actions by management - Increased focus on customer satisfaction
-Increased uncertainty and the explicit recognition of
risk
Demand for risk reporting Results

18
(Cabedo & Miguel Tirado 2004; Linsley & Shrives 2006; Solomon et al. 2000).
Deumes and Knechel (2008) argue that risk disclosure creates corporate transparency
for well-functioning markets and brings general gains in economic efficiency.
2.2.2 Risk reporting as an issue of concern in banking institutions during
financial crises
A large number of financial institutions collapsed during the GFC of 2007-2008 and
that raised significant concern in global credit markets about their performance and risk
governance (Erkens, Hung & Matos 2012; Fahlenbrach & Stulz 2011). Thereafter,
some studies have examined the performance of corporate governance and additional
attention has been paid to banks’ risk management (Adams 2012; Bebchuk 2010;
Beltratti & Stulz 2012; Erkens, Hung & Matos 2012).
Banking crises have been a common phenomenon throughout history; indeed banks are
at the centre of financial crises (Barth & Landsman 2010). To some extent, banking
crises are like periodic events that ‘unexpectedly emerge from the earth’ (Laeven 2011,
p.18). Reinhart and Rogoff (2013) count 268 banking crises over the period from 1800
through to 2008. Bordo et al. (2001) revealed that the frequency of banking crises has
been increasing in recent decades. According to Reinhart and Rogoff (2013, p.4557)
‘the historical frequency of banking crises is quite similar in high- and middle-to-low-
income countries, with quantitative and qualitative parallels in both the run-ups and the
aftermath’. The National Commission on the Causes of the Financial and Economic
Crises in the U.S. (2011; p. xvii) concluded that ‘dramatic failures of corporate
governance ….at many systematically important financial institutions were a key cause
of financial crises’.
The lack of risk management and failure of governance mechanisms are cited
commonly as the key contributing factors to the GFC of 2007-2008 (Aebi, Sabato &
Schmid 2012; Beltratti & Stulz 2012; Diamond & Rajan 2009; Hashagen, Harman &
Conover 2009; Strebel 2009). These raise several questions for regulators with respect
to corporate governance and banks and for testing the value of ‘risk governance’ and
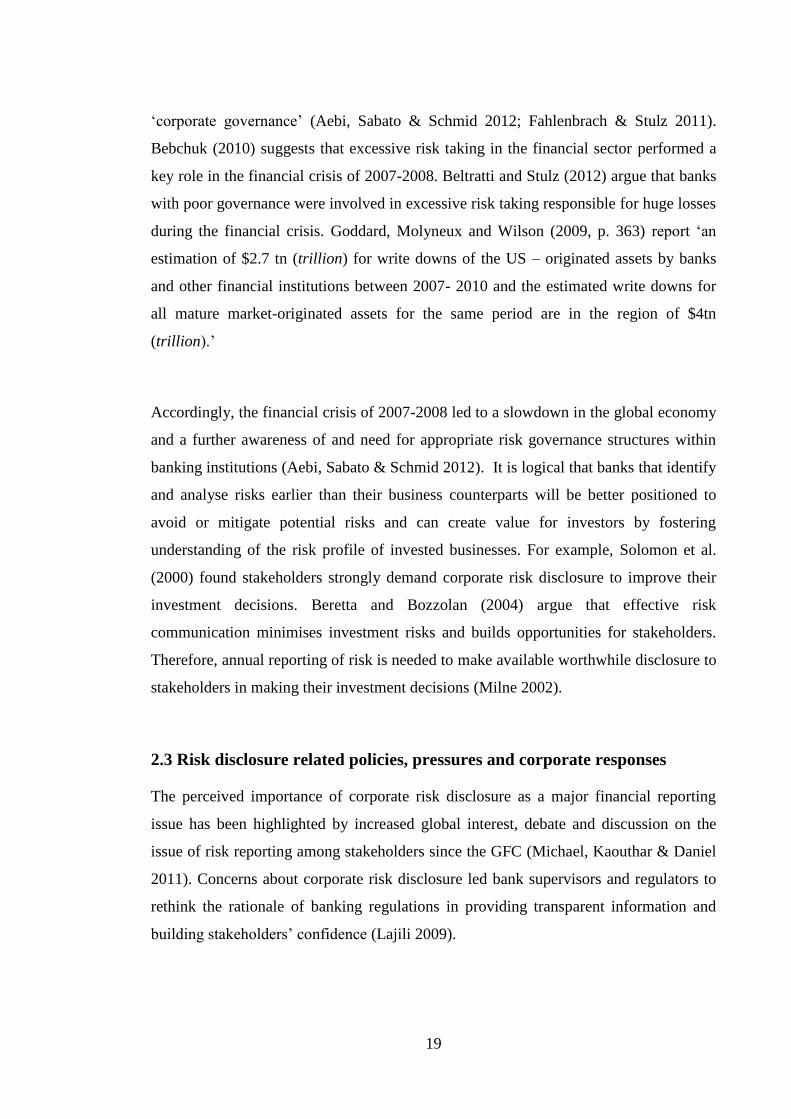
19
‘corporate governance’ (Aebi, Sabato & Schmid 2012; Fahlenbrach & Stulz 2011).
Bebchuk (2010) suggests that excessive risk taking in the financial sector performed a
key role in the financial crisis of 2007-2008. Beltratti and Stulz (2012) argue that banks
with poor governance were involved in excessive risk taking responsible for huge losses
during the financial crisis. Goddard, Molyneux and Wilson (2009, p. 363) report ‘an
estimation of $2.7 tn (trillion) for write downs of the US – originated assets by banks
and other financial institutions between 2007- 2010 and the estimated write downs for
all mature market-originated assets for the same period are in the region of $4tn
(trillion).’
Accordingly, the financial crisis of 2007-2008 led to a slowdown in the global economy
and a further awareness of and need for appropriate risk governance structures within
banking institutions (Aebi, Sabato & Schmid 2012). It is logical that banks that identify
and analyse risks earlier than their business counterparts will be better positioned to
avoid or mitigate potential risks and can create value for investors by fostering
understanding of the risk profile of invested businesses. For example, Solomon et al.
(2000) found stakeholders strongly demand corporate risk disclosure to improve their
investment decisions. Beretta and Bozzolan (2004) argue that effective risk
communication minimises investment risks and builds opportunities for stakeholders.
Therefore, annual reporting of risk is needed to make available worthwhile disclosure to
stakeholders in making their investment decisions (Milne 2002).
2.3 Risk disclosure related policies, pressures and corporate responses
The perceived importance of corporate risk disclosure as a major financial reporting
issue has been highlighted by increased global interest, debate and discussion on the
issue of risk reporting among stakeholders since the GFC (Michael, Kaouthar & Daniel
2011). Concerns about corporate risk disclosure led bank supervisors and regulators to
rethink the rationale of banking regulations in providing transparent information and
building stakeholders’ confidence (Lajili 2009).

20
Several academic and professional reports (AICPA 1995; IASB 2007; ICAEW 1995;
Schrand & Elliott 1998), particularly in the U.S.A., U.K. and other European countries,
demand for inclusive risk information in financial reports. Acknowledging the
importance of risk disclosure, standard setters have enhanced regulatory reforms in
recent years; such as by issuing International Financial Reporting Standard 7 [Financial
Instruments: Disclosures] (IFRS 7) and BASEL II: Market Discipline, to govern
accounting practices and disclosure. Internationally, to date, the most advanced risk
disclosure regulations exist in the U.S.A., Canada, U.K and Germany (Michael,
Kaouthar & Daniel 2011). These countries require and enforce risk information in both
the notes to financial reports and supplementary management reports.
In the U.S.A., Financial Reporting Release No 48 ‘Disclosure of Accounting Policies
for Derivative Financial Instruments and Derivative Commodity Instruments and
Disclosure of Quantitative and Qualitative Information about Market Risk Inherent in
Derivative Financial Instruments, Other Financial Instruments, and Derivative
Commodity Instruments’ (FRR 48) was issued in 1997. This document requires
Securities and Exchange Commission enlisted companies to disclose market risks in the
notes and in the Management reports. Listed companies in Canada also apply FRR 48
to disclose risk information in the Management Discussion and Analysis (MD&A)
section. In the U.K, the Operating and Financial Review (OFR), issued in 1993,
necessitates disclosure of information about key risks. The Australian Securities
Exchange (ASX) issued its first version of Corporate Governance Principles and
Recommendations in 2003 (amended in 2007 and 2010) where Principle 7 pertains to
risk management and recognition. These events provide evidence of the increasing
importance of risk disclosure as measure of good corporate governance practices.
Nonetheless, from a regulatory viewpoint, the status of risk reporting is piecemeal in
nature, focusing mainly on market risk (Amran, Bin & Mohd 2008; Beretta & Bozzolan
2004; Michael, Kaouthar & Daniel 2011). Additionally, domestic regulations in each
country take different approaches in requiring disclosure of risk information. For
example, both the U.S.A. and Canada require disclosure of market risk, including
forward-looking information (FRR 48). However, in Canada, disclosure of qualitative
21
types of information is voluntary and is guided by the Ontario Securities Commission
(Michael, Kaouthar & Daniel 2011). The importance of risk reporting has been
increasing in the last decade (Bordo et al. 2001; Lajili 2009; Reinhart & Rogoff 2013).
However, regulatory bodies provided less attempt to make available for an explicit and
combined risk disclosure outline. In this study, a comprehensive Risk Disclosure Index
is developed for the analysis of risk information provided within annual reports. To the
researchers’ knowledge, this Index is the first integrated instrument developed to
quantify recommended risk disclosures for the banking industry.
2.4 An overview of the institutional arrangements and accounting
regulations in developing a risk reporting framework
Several professional and institutional reports worldwide highlight the importance of risk
reporting and call for comprehensive disclosure of risk information to satisfy the users
of financial reports. This section documents the evolution of thinking on risk and risk
disclosure by professional and institutional bodies in developing a risk reporting
framework.
2.4.1 Cadbury Report (1992)
In the U.K., the issue of corporate risk reporting attracted mainstream public attention in
the 1990s, leading to the Cadbury Report in 1992. After establishing the Cadbury
Committee in 1991, the Financial Reporting Council (U.K.) and the London Stock
Exchange issued the Cadbury Code in 1992, which included best practice code and
recommended the code for adoption by the London Stock Exchange enlisted companies.
The code in the Cadbury Report centred attention in four major areas: ‘the board of
directors’; ‘non-executive directors’; ‘executive directors’; and ‘control and reporting’.
This Report recommended the disclosure of risk information by companies as part of
reforming corporate governance and suggested improvements in disclosure about
internal controls. The European Union, the U.S.A. and the World Bank adopted this
recommendation also (Linsley & Shrives 2000).

22
2.4.2 The American Institute of Certified Public Accountants (AICPA)
With an aim to improve financial reporting, the American Institute of Certified
Accountants (AICPA) proposed a comprehensive business-reporting model focusing on
risk disclosure. The model included information that forecasts future events and focuses
attention on non-financial information. The Jenkins Report (AICPA 1994) followed the
Cadbury Report (1992) and recommended that business reports should include
information about risk and opportunity to facilitate analysis of each business segment
separately and identify the diverse opportunities and risks.
2.4.3 The Institute of Chartered Accountants in England and Wales
Financial risk reporting is the foundation for accounting and business practices as it
builds an early warning system into the existing management information system
(ICAEW 2010b). The Institute of Chartered Accountants in England and Wales
(ICAEW) in 1997 issued a discussion paper on business risk proposing listed companies
be at the forefront of improving risk disclosure in annual reports, including disclosure
about relevant measures of risks and actions to manage risks. It concentrated on forward
looking information disclosure to help investors to forecast in the longer run.
Subsequently, the ICAEW and London Stock Exchange agreed to provide guidance for
board of directors on implementing internal control. As a result, the Turnbull Report
(1999) was published titled ‘Internal control: Guidance for directors on the combined
code’. The Report emphasised that ‘a company’s system of internal control has a key
role in the management of risks that are significant to the fulfilment of its business
objectives (Para. 10)’. In conjunction with guidance on risk and control mechanisms,
the Turnbull Report focused on risk assessment, the control environment and control
activities over risks, information and communication of risk and monitoring activities.
The Turnbull Report thus highlighted the link between internal control and risk
(Abraham & Cox 2007). The Turnbull Report viewed the advantages of providing key
business risk information from several aspects; first, practical information; second,

23
reduced cost of capital; third, better risk supervision; and fourth, maintenance of
improved accountability towards stakeholders (Wallage 2000).
Highlighting users’ demands for risk information, sources, assumptions, determining
factors and alternative outcomes of uncertainties, the ICAEW published another report
in 2003 (ICAEW 2003). The report focused on disclosure of prospective financial
information and the factual representation of business risk analysis. The demand for
improved risk reporting intensified in GFC (2007-2008) period, (e.g. Dobler, Lajili &
Zéghal 2011; Uddin & Hassan 2011) the ICAEW published reports in 2010 highlighting
lessons from the crisis for banking institutions (ICAEW 2010a). The report mentioned
that:
Risk information is often presented in a piecemeal manner in bank annual reports,
spread between the audited financial statements and the unaudited front sections. Banks
need to focus on clearer presentation, which allows users to understand the big picture,
which is currently often obscured by the volume of detailed information. Summary risk
statements are a potential way of providing this big picture (p.4).
The report suggested increasing transparency and stakeholders’ confidence in financial
reporting. The report further suggested that directors disclose the governance policies
and risk management practices of the company.
Next, the ICAEW (2011) identified the key challenges for risk reporting: inherent
unreliability, costs exceeding perceived benefits and generic disclosure. Inherent
unreliability occurs as judgement about risk information is subjective. The report
recommended seven principles for better risk reporting; providing useful information
for assessing business risks, disclosure of detailed qualitative information, integration of
risk information with forward looking information along with broader context, thinking
beyond the annual reporting cycle of risk information, keeping a list of principal risks,
highlighting current concerns and reviewing risk experiences.

24
2.4.4 Hampel Report (1998)
The Hampel Report titled ‘Committee on Corporate Governance’ published in the U.K.
in 1998, revised the corporate governance system there after implementation of the
Cadbury Report in 1992. The concept of internal control used in the Cadbury Report is
explained more elaborately in the Hampel Report, addressing business risk assessment,
agreement with regulations and maintenance of assets, including the minimising of
fraud.
2.4.5 Higgs Report (2003) and Smith Report (2003)
The Higgs Report (2003) titled ‘Review of the role and effectiveness of non-executive
directors’ revised the Cadbury Report, providing recommendations for board
composition and emphasising risk assessment and risk management. The Report argues
that ‘the board’s role is to provide entrepreneurial leadership of the company within a
framework of prudent and effective controls which enable risk to be assessed and
managed’ (p.21). In addition, in terms of specifying the responsibilities of the non-
executive director, the Report noted: ‘non-executive directors should satisfy themselves
that financial information is accurate and that financial controls and systems of risk
management are robust and defensible’ (p.27). Furthermore, the Smith Report (2003)
titled ‘Audit Committees Combined Code Guidance’ suggested that the board establish a
separate risk committee to assess the scope and risk management systems of the
organisation to identify, assess, manage and monitor financial risk.
2.4.6 International Financial Reporting Standards (IFRS)
The Financial Accounting Standards Board (FASB) in the U.S.A. and the International
Accounting Standards Board (IASB) in the U.K. require risk disclosures for users of
annual reports in making their investment decisions. As mentioned in in Chapter 1,
International Financial Reporting Standard 7 (IFRS 7) [Financial Instruments:
Disclosures] was issued by the IASB in 2005 to became effective in January 2007.
IFRS 7 sets guidelines for enhancing financial disclosure and, when adopted and

25
enforced, requires disclosure of risk information arising from financial instruments2 in
financial reports (IASB 2007).
Furthermore, IFRS 7 seeks provision of information in relation to companies’ financial
performance, the associated risk of financial instruments and the risk management
policies (IASB 2009). IFRS 7 includes financial instrument disclosure requirements for
all companies under one standard as it incorporates the disclosure requirements
regarding financial instruments which were previously set out in IAS 30 (Disclosure in
the Financial Statements of Banks and Similar Financial Institutions) and IAS 32
(Financial Instruments: Presentation). IFRS 7 states that ‘an entity shall disclose
information that enables users of its financial statements to evaluate the nature and
extent of risks arising from financial instruments to which the entity is exposed at the
reporting date’ (Para. 7.31).
IFRS 7 requires minimum disclosure of qualitative and quantitative information about
market, credit and liquidity risk information (IASB 2007). The ‘qualitative disclosures
describe management’s objectives, policies and processes for managing those
risks…(and) the quantitative disclosures provide information about the extent to which
the entity is exposed to risk, based on information provided internally to the entity’s key
management personnel’ (IASB 2007, Para IN 5b).
After the GFC (2007-2008), the IASB issued several amendments to IFRS 7. The first
being in October 2008 permits reclassification of some financial instruments. The next
amendment in 2009 introduced a three level hierarchy for fair value measurement
disclosure to improve comparability between companies and strengthen the disclosure
about liquidity risk associated with financial instruments (assets and liabilities) (IASB
2009). However, these amendments were controversial as fair value was argued to hide
the real risks to which companies are exposed and increase the mistrust by stakeholders
(Judge, Douglas & Kutan 2008). In addition to that, reclassification of financial assets
2‘In banking institutions, financial instruments comprise most of the assets and liabilities (IASB 2007).’

26
amendments was controversial as the changes were seen as political3 and were adopted
without due process (Laux & Leuz 2009).
2.4.7 BASEL II: Pillar 3 (Market Discipline)
The Basel Committee on Banking Supervision (BCBS)4 is a forum for regular
cooperation on banking supervisory matters. The Basel Committee consists of
representatives from Central Banks and regulatory authorities around the world.
Member countries implement recommendations by the Basel Committee through their
national laws and regulations. The Basel Committee requires banks to disclose risks
under a capital adequacy and market discipline framework. Since 1974, the BCBS has
worked to enhance understanding of key supervisory issues and improve the quality of
banking supervision all over the world. In 1988, it published the first global banking
guideline for capital adequacy (BASEL I) with two major aims; first, to support the
trustworthiness and firmness of the worldwide banking system and second, to achieve
fair and consistent practices among international banks (Basel 2003).
Basel I required banks to hold a minimum capital reserve based on their owned assets,
the base for capital with Tiers; such as, Tier 1 consisting of common equity and
preferred stock and Tier 2 comprising subordinated debt and hybrid instruments.
BASEL I weaknesses in calculating the ratio of risk weighted assets were overcome by
Basel II in 2004, which developed a framework to further strengthen the soundness of
banking institutions (Barth, Caprio & Levine 2004).
3 According to Bischof, Brüggemann and Daske (2010, p.1) ‘these (IFRS 7) amendments leave
commercial banks reporting under IFRS with the choice to retroactively reclassify financial assets that
were previously measured at fair value into categories which require measurement at amortized cost, i.e.
to effectively suspend fair value accounting for these assets. This decision sharply contrasted the IASB’s
general strategy in reporting for financial instruments and its strong initial position against
reclassifications. However, the board eventually surrendered to severe political pressure by the EU
Commission and EU leaders’. 4 The BCBS was established in 1974 comprising representatives from Central Banks and supervisory
authorities of the Group of Ten countries (Belgium, Canada, France, Germany, Italy, Japan, Netherlands,
Sweden, Switzerland, United Kingdom, United States and Luxembourg). The Committee meets at the
Bank for International Settlements, Basle, Switzerland. To date, it comprises 27 countries worldwide,
including Bangladesh.

27
The Basel II framework features three ‘Pillars’, comprising minimum capital
requirements (Pillar 1), supervisory review processes through governance of banks
(Pillar 2) and market discipline (Pillar 3). Pillar 1 includes minimum capital
requirements and Pillar 2 provides risk management guidance with respect to banking
institutions in relation to interest rate, credit risks and operational risks. The aim of the
second pillar in the framework is to make sure sufficient capital to maintain all risks and
encourage banks to improve better monitoring techniques to manage their risks (Basel
2012).
In conjunction with Pillar 1 and Pillar 2, Pillar 3 aims to improve market discipline5 by
providing disclosure guidelines for capital adequacy, risk exposure and risk assessment
process information provided to market participants (Basel 2012; Ismail, Rahman &
Ahmad 2013; Nier & Baumann 2006). The market discipline framework can act as a
regulatory tool by providing for the information needs of an effective capital market
(Barth & Landsman 2010). In 2006, the Basel Committee revised the Basel II
framework to encourage stronger risk management practices in the banking industry.
Pillar 3 disclosure requires both quantitative and qualitative information (Basel 2006).
Nier and Baumann (2006) showed three conditions that should be satisfied to achieve
market discipline; first, investors’ consideration about the risk of default by banks,
second, market responses to banks’ risk profiles and the cost benefit for banks and their
managers, and third, adequate information to determine the riskiness of banks.
After the GFC of 2007-2008, the Basel Committee promoted the adoption of sound
corporate governance guidance practices in the banking sector, stating that ‘risk
reporting systems should be dynamic, comprehensive and accurate and should draw on
a range of underlying assumptions’ (Basel 2010, p.22). They also suggested that by
engaging an internal auditor, the board and senior management can identify the risk
management process and improve the quality of risk reporting (Basel 2010).
5 According to Basel Committee (2001, p.4) ‘market discipline enforces supervisory efforts to promote
safety and soundness in banks and financial systems. It describes the bank’s objective and strategy for the
public disclosure of information on its financial condition and performance’.

28
To develop a more resilient banking sector and as a feedback to the GFC, the Basel
Committee programmed Basel III6 to be implemented from 2013 until 2019. Basel III
introduced an additional capital buffer and a minimum leverage ratio and liquidity
coverage ratio. The examination of Basel III is beyond the scope of this study. At
present, Basel II: Market Discipline (Pillar 3) contains the most specific disclosure
framework to communicate risk exposure and risk assessment in banking institutions
internationally.
The timeline for this present study lends to its importance, coming as it does a few years
after the publication and implementation of IFRS 7 and its amendments and BASEL II:
Market Discipline. In the Bangladesh context, it is expected that risk disclosure would
be increased as an evidence of and endorsement towards corporate governance
improvements (Solomon et al. 2000). This research hypothesises that banks will
respond to these international standards by enhancing the extent of risk disclosure even
where compliance is not compulsory as in a country such as Bangladesh.
2.5 Risk disclosure as a major concern in Bangladesh
A growing number of studies argue that accounting and reporting systems in developing
countries differ significantly from those in developed countries (Hassan 2009; Khan
2013; Mir & Rahaman 2005; Wallace & Naser 1995). Such studies revealed that the
institutional setting, accounting technologies, the regulatory framework and rules in
developing countries differ from those in developed countries. The institutional setting
of any country depends on factors including political, social and historical (Prowse
1998).
Bangladesh is an emerging7 economy. According to Farooque et al. (2007, p.130)
‘Corporate governance systems here [i.e. in Bangladesh] are arguably less evolved than
6 In the aftermath of GFC (2007-2008), Basel Committee revised existing capital adequacy framework
and issued Basel III : Capital and their liquidity requirements in November 2010. 7 According to Khan, Muttakin and Siddiqui (2013, p.208) ‘in 2005, Goldman Sachs, the global asset
management company, classified Bangladesh as one of the ‘next 11’ emerging economies for its high
potentials, along with the BRIC countries, to be the largest economies in the twenty-first century

29
those in developed countries’. The institutional setting in Bangladesh has been inherited
from 200 years of British colonial rule. The regulatory settings in Bangladesh were
impacted by the British governing settings and the political oppression for 23 years
during the Pakistani period. The next Chapter provides a more detailed analysis of
Bangladesh. According to Farooque et al. (2007), these two periods have impacted the
institutional settings along with the political and economic environment.
The 200 years of British colonial rule has twin impact…on the one hand, it allowed
Bangladesh to inherit an English-style institutional and regulatory framework,
Westminster-style parliamentary democracy, a judiciary independent of the legislature
and the executive wings of the government, and a highly powerful and insensitive
bureaucracy. On the other hand, the prolonged economic exploitation and political
domination coupled with the creation of crony elite subservient to the expatriate rulers
contributed to institutionalizing corruption in the bureaucracy, creating only a limited
pool of entrepreneurs, and inhibiting development of a broad based capital market. The
23 years of internal colonization during the Pakistan period also saw a continuation of
political suppression and economic negligence….. did not allow the country….. to build
capital market institutions (p.131).
The country continues to experience weak institutional settings in the form of highly
concentrated ownership structures (such as family owned or controlled substantial
shareholdings of businesses) and a weak capital market, along with poor legal structure
(Khan, Muttakin & Siddiqui 2013). A Bangladesh Enterprise Institute (2003) survey
provided evidence that family members dominate the boards of 73 per cent of listed
companies. In Bangladesh, the closely held family members on the board often become
advisors to internal auditors without much technical and specialised knowledge (Hopper
et al. 2003). Moreover, the legal system in Bangladesh is poor in its ability to oversee
corporate affairs (Belal, Cooper & Roberts 2013; La Porta, Lopez-De-Silanes &
Shleifer 1999). Additionally, the Bangladesh Securities and Exchange Commission has
scant resources in terms of technical, personnel and logistic support to monitor
(http://www.goldmansachs.com)’. BRIC countries are Brazil, Russia, India and China.
30
disclosure of financial reporting (Khan 2004). In Bangladesh, disclosure practices in
annual reports operate within a framework of different regulations, laws and guidelines;
some mandatory, some merely recommended (Belal 2001). These are namely the
Companies Act 1994, the Bank Company Act 1991 (for banking institutions), the
Insurance Act 1938 (for insurance companies), the Income Tax ordinance, 1984 (for all
companies and public enterprise).
The Bangladesh Bank Order 1972, the Bank Company Act 1991 and the Companies Act
1994 regulate annual reporting by banking institutions in Bangladesh. The external
corporate audit is governed based on the Bangladesh Chartered Accountants By-laws
1973. The Bangladesh Bank Order 1972 and the Bank Company Act 1991 mandate
banks to provide audited balance sheets and profit and loss accounts (with working
papers) to Bangladesh Bank (the Central Bank), the Registrar of Joint Stock companies
and to publish these documents annually. The Companies Act 1994 requires that
companies should provide the annual report in a prescribed form and audited by a
chartered accountant. However, the Act does not necessitate mandatory compliance
with adopted accounting standards. In the absence of mandatory requirements by
company law or the Bank Company Act 1991, compliance with International Financial
Reporting Standards (IFRS) or Bangladesh Accounting Standards (Bangladesh
Financial Reporting Standards) is voluntary effectively for banking institutions, listed or
otherwise. The World Bank’s Report on the Observance of Standards and Codes (2003,
p.11) for Bangladesh noted the necessity for ‘the enactment of a new Financial
Reporting Act and the repeal of provisions on accounting, auditing, and financial
reporting in the Companies Act 1994, Bank Companies Act 1991, Insurance Act 1938,
and other related regulations’.
Extant studies have found that due to weak enforcement mechanisms, lack of auditor
independence and the perceived undemocratic nature of the International Financial
Reporting Standards (and their predecessors) implementation process in Bangladesh,
there is resultant low disclosure in annual reports (Mir & Rahaman 2005; Sobhani,
Amran & Zainuddin 2012). A team from the World Bank provided a systematic
assessment of strengths and weaknesses of accounting and auditing practices in

31
Bangladesh. They remarked ‘the accounting and auditing practices in Bangladesh suffer
from institutional weaknesses in regulation, compliance, and enforcement of standards
and rules. The preparation of financial statements and conduct of audits, in many cases,
are not consistent with internationally acceptable standards and practices’ (World Bank
2003, p.3). Despite this, auditors issued unqualified audit reports on these annual reports
(Mir & Rahaman 2005).
Apart from this, the financial sector perceives increasing non-performing loans, low
recovery rates, operational weaknesses, excessive political, government and owners’
interference, substandard accounting and audit quality and a weak regulatory
supervisory role (World Bank 2003; Khan et al. 2011; Uddin & Choudhury 2008b).
Therefore, examining risk disclosure in a weak regulatory environment (such as
Bangladesh) are likely to provide greater insights to risk disclosures and their
determinants because little variation could be expected in mandated disclosures within a
highly regulated environment with effective enforcement. Hence, corporate risk
disclosure, particularly in the banking industry, warrants research significance. The goal
of this study is to fill the gap in the literature on risk disclosure using a sample of banks
from a developing country, Bangladesh, where the institutional setting creates, in effect,
voluntary rather than mandatory compliance with accounting and other standards of
public reporting of risk and performance.
2.6 Chapter conclusion
The objective of this Chapter is to provide evidence that the issue of corporate risk
disclosure has become of major concern. The discussion within this Chapter provides an
overview of corporate risk disclosure as an issue of concern during the financial crisis of
2007-2008, especially for financial institutions. It provides an overview of policies and
responses to institutional arrangements in relation to risk disclosure in the developing
country of Bangladesh. Thus, this Chapter builds the platform for a broader study that
investigates the disclosure of risk matters by banks in Bangladesh. Chapter 3
incorporates detailed discussion regarding the research context and provides the
motivation for selecting Bangladesh as the setting for this study.

32

33
CHAPTER 3: Bangladesh - the Context of the Study
3.1 Introduction
A rapidly growing economy resulting from increasing globalisation of various sectors,
increasing customer demand and growing competition, makes the banking sector of
Bangladesh an interesting research context. Since this study’s focus is on risk reporting
practices in the banking sector, it is essential to provide an overall picture of the
country’s banking sector in comparison with that of other countries, explain its
evolution and explain why Bangladesh creates an appropriate research setting. This
Chapter reviews the development of the accounting setting, the institutional background
and the country’s political, economic and social factors and provides an overview of the
development of banking institutions and risk reporting practices in Bangladesh. Figure
3.1 presents the structure of this Chapter as follows.
3.2 Bangladesh as the country of study
This section outlines the historical, political, socio-economic and regulatory setting for
disclosure practices in financial reporting in Bangladesh. Discussion of these contextual
factors is necessary in order to provide the background to this research and a thorough
understanding of risk reporting in Bangladesh.
7Figure 3.1 Roadmap of Chapter
Introduction (3.1)
Bangladesh as a
country of study (3.2)
Financial system in
Bangladesh (3.3)
Banking industry (3.4)
and financial reform in
banking sector (3.5) in
Bangladesh
Motivation for
choosing Bangladesh
as a context for the
study (3.6)
Motivation for selecting
listed banks in
Bangladesh (3.7) and
chapter conclusion (3.8)

34
3.2.1 Bangladesh: Country profile
The People’s Republic of Bangladesh is one of the largest deltas in the world with an
area of 147,570 sq. km. and one of the most densely populated (estimated 163.7M
July 2013, 8th
in world ranking8) countries in South Asia, situated on the Bay of
Bengal. Bangladesh became an independent and sovereign country in 1971 after a long
liberation war against Pakistan. The official language is Bengali (Bangla), however
English is widely used in educational institutions, the media and commerce. The capital
city is Dhaka with seven divisional cities (i.e. Dhaka, Khulna, Rajshahi, Chittagong,
Rangpur, Sylhet and Barisal). More than 75 per cent of the population live in rural
areas; however, urbanisation has been increasing rapidly over the last two decades9.
3.2.2 Political and historical context
The origin of Bangladesh dates back to during the remnants of civilisation in the greater
Bengal 4000 years ago (Xinhua 2006) when the region was settled by Dravidian,
Tibeto-Burma, and Austro-Asiatic peoples. In the 12th
century (AD), Bengal fell to
Muslim conquest from West India and a large part of Bengal was subjugated by Sultans
and Lords. By the 16th
century, The Mughal Empire controlled Bengal and Dhaka
became the important provincial centre of Mughal administration (Eaton 1996). At the
end of the 15th
century, European traders arrived in Bengal and formed the British East
India Company. Their control and influence grew following the Battle of Plessey in
1757 (Baxter 1998). The rebellion of 1857, known as the ‘Sepoy Munity’ led to
dissolution of the British East India Company. British colonial rule was over in 1947
with India and Pakistan partitioned under religious coverage. The political, economic
and linguistic discrimination led to liberation of East Pakistan from West Pakistan.
Bangladesh received independence after nine months of a liberation war under the
leadership of Bangabandhu Sheikh Mujibur Rahman.
8 https://www.cia.gov/library/publications/the-world-factbook/geos/bg.html
9 Bangladesh Bureau of Statistics (2013).

35
After its independence, Bangladesh established a parliamentary democracy with Sheikh
Mujib as Prime minister. In August 1975, Sheikh Mujib and his family were
assassinated in a military coup and until 1990, Bangladesh was more or less under
military rule (Belal 2001); however, an active democratic parliament commenced in
1991. Since then two political parties, either the Awami League (AL) or the Bangladesh
Nationalist party (BNP), have ruled the country under democratic elections. A
democratic environment has had a positive impact on the economy of the country.
However, true democracy is not yet observed in Bangladesh (Belal 2001). Figure 3.2
presents a map of Bangladesh along with the national flag.
Source: http://www.lonelyplanet.com/maps/asia/bangladesh/
3.2.3 Economic context
The advantages of a mild, tropical climate and fertile soil helped Bangladesh develop as
an agrarian country; however, structural changes towards development of the
manufacturing and services sectors has increased in the past few years. Yet, 45 per cent
of people depend on the agricultural sector with rice as the staple crop10
. In addition,
extensive growth in the industrial and services sectors has contributed to the overall
economy of the country. In financial year 2012-13, growth in the agriculture, industrial
and service sectors was estimated at 2.54 per cent, 10.27 per cent and 6.16 per cent
respectively11
. The negative growth in the world economy due to the GFC slowed the
10
https://www.cia.gov/library/publications/the-world-factbook/geos/bg.html 11
Board of Investment Bangladesh (2014).
8Figure 3.2: The national flag and map of Bangladesh

36
growth of the Bangladesh economy in financial year 2008-2009, although the average
growth remained above 6 per cent following the recession period12
. Bangladesh has
been affected post GFC through the reduction of remittances, migration, readymade
garments and agricultural exports (shrimp and tea) (Bangladesh Bank 2013).
The present environment of global competition and a free market economy highlights
the importance of private sector development in Bangladesh. The private sector
emphasis is on growth of the industrial and services sectors following the principles of a
market economy (Belal 2001). The government also accepts private sector management
as one of the key regulatory forces in achieving economic growth (Bhattacharya &
Chowdhury 2003). Several initiatives have been adopted and opportunities seized to
encourage private sector and overseas investors. Examples include publicly managed
enterprises being transferred to private ownership; administrative, infrastructure and
institutional facilities relating to business and industry facilities being increased through
establishment of different institutions; strengthening of the capital market through the
Dhaka and Chittagong Stock Exchanges and regulating the capital market through the
Bangladesh Securities and Exchange Commission.
Wages and salaries in Bangladesh remain the lowest in Asia for skilled workers13
. The
Japan External Trade Organisation surveyed 29 major cities in Asia and found
management remuneration grades in Dhaka to be two to three times less than in
Singapore, Shanghai and Bangkok. Further, renting industrial estate costs less than in
Shanghai, Jakarta or Bangkok and rental for both offices and housing, together with
transportation costs, are less expensive compared with other international cities (JETRO
2010). With youthful educated demographics, cheap labour, low business establishment
costs, advanced technology and economic growth, Bangladesh has a huge domestic
market. Table 3.1 presents statistics about the economy of Bangladesh.
12
Ministry of finance, Government of Bangladesh (2014). 13
The 20th Survey of Investment-Related Cost Comparison in Major Cities and Regions in Asia (JETRO
2010).

37
Fiscal Year
1 July - 30 June
GDP total
US$112.00 billion (at current prices 2012-13)
GDP per capita
US$848 (at current prices 2012-13)
GDP growth rate (%)
6.32 (at constant prices 2012-13)
GDP composition
Agriculture: 17.5 per cent; industry: 28.5 per
cent; services: 53.9 per cent (2013 est.)
Total exports
US$24.287 bn (2012-13)
Total imports
US$35.44 bn (2012-13)
Budget Revenues: US$14.03 billion; expenditures:
US$19.69 billion (2013 est.)
Total FDI
US$1.136 bn (2013), US$462.77 m (Jan-June,2013)
Foreign exchange reserves
US$12.35 bn (Nov, 2013)
Currency: Inflation, April,
2013
BDT (1 BDT=US$0.0121) (avg. 2012-13) 7.93per
cent
Exchange Rate Taka (BDT) per US dollar - 81.863 (2014
est.);74.152 (2013 est.)
Industries Jute, cotton, garments, paper, leather,
fertilizer, iron and steel, cement,petroleum
products,tobacco,pharmaceuticals,ceramics,tea
,salt, sugar, edible oils, soap and detergent,
fabricated metal products, electricity and
natural gas Source: Bangladesh Economic Review- Ministry of Finance, March 2014
Bangladesh is becoming increasingly attractive to business and foreign direct
investment. The Foreign Private Investment Act 1980 provides protection to foreign
investors. Bangladesh is a member to the Multilateral Investment Guarantee Agency
(MIGA), Overseas Private Investment Corporation (OPIC), U.S.A.; International Centre
for Settlement of Investment Disputes (ICSID); World Intellectual Property
Organisation (WIPO) and has bilateral agreements to avoid double taxation14
.
14
Board of Investment Bangladesh (2014).
2Table 3.1: Economy of Bangladesh

38
3.2.4 Socio-cultural context
After nine months of liberation war ending in 1971, Bangladesh faced severe social,
economic and political problems and took steps to overcome the situation (Sultana
2012). As a result, in recent times there has been remarkable progress in socioeconomic
development indicators for Bangladesh. The United Nations Development Programme
(UNDP, 2013) reported that between the years 1980 to 2012, the Human Development
Index (HDI) rose by 1.5 per cent annually, an increase of 65 per cent overall. The
accelerated growth rate in per capita gross domestic product (GDP) since the early
1990s has impacted on the social development process. Social development indicators
along with per capita GDP ranked Bangladesh among the top performing countries with
similar per capita income level in year 2005 and it is among the few developing
countries achieving targets set by the Millennium Development Goals (World Bank
2005a). According to the UNDP (2010) Report, Bangladesh is making significant
progress in gender equality, primary education, reducing population growth, women’s
empowerment, renewable energy, food production and health. However, political
corruption, political instability, over-population and global climate change continue to
hinder the economic development of the country (Uddin & Suzuki 2011).
Bangladesh encompasses a rich heritage with a remarkable cultural history. Diversity of
social groups in Bangladesh is characterised by an emphasis on social values along with
dominant elite groups (Belal 2001; Parry & Khan 1984). As mentioned earlier, more
than 75 per cent of the population live in rural areas; however, urbanisation has been
occurring rapidly in the last two decades (Bangladesh Bureau of Statistics, 2006). The
largest religion is Islam (about 89 per cent), with the rest of the population following
Hinduism, Buddhism, Christianity and Animists. A high degree of ethnic and religious
harmony exists in the country.
In the late 1990s, the government expanded credit policy and directed banks to sanction
loans to the public sector and give priority to private sector enterprise with low interest
39
rates (Ahmed & Islam 2004). In most cases, public sector loans remain overdue and the
profitability of nationalised commercial banks15
has declined (Ahmed & Islam 2004).
The corporate governance system has been developed following a hybrid of the Anglo-
American outsider-dominated market model (rule and compliance-based) and the
German-Japanese insider dominated bank-based control model (relationship-based)
(Farooque et al. 2007; Islam 2008). However, like many other Asian countries, in
Bangladesh the lack of adequate financial disclosure, weak capital market, corruption,
political instability and an inefficient judicial system impedes establishment of rules and
a compliance-based market (Claessens, Fan & Lang 1999). As a result, the under-
developed institutional settings impact and make a significant difference compared with
developed countries to the socio-economic and cultural context (Ahmed & Islam 2004).
3.2.5 Legal and institutional context
Bangladesh Securities and Exchange Commission
Through enactment of the Securities and Commission Act 1993, the Bangladesh
Securities and Exchange Commission was established as a statutory body under the
Ministry of Finance. The Bangladesh Securities and Exchange Commission acts as the
regulator of the capital market in Bangladesh. By protecting the interests of investors,
along with developing and maintaining a fair and transparent market, the Bangladesh
Securities and Exchange Commission monitors financial institutions, including listed
banks. To encourage high standards of corporate governance, the Bangladesh Securities
and Exchange Commission issued corporate governance guidelines in 200616
. However,
these guidelines do not provide detailed discussion on corporate risk disclosure. Banks
provide their annual financial reports to the Bangladesh Securities and Exchange
Commission, along with their compliance status in relation to corporate governance
guidelines, according to a prescribed form. For non-compliance, with governance
guidelines, the Bangladesh Securities and Exchange Commission prescribes penalties,
with the power to suspend or remove listing privileges.
15
The banking system in Bangladesh is comprised of four State Owned Commercial Banks, four
Specialised Banks, thirty Private Commercial Banks and nine Foreign Commercial Banks. 16
The Code for Corporate Governance for Bangladesh 2006.

40
The Stock Exchanges (Dhaka Stock Exchange and Chittagong Stock Exchange)
After gaining independence in 1971, Bangladesh inherited a single stock exchange, the
Dhaka Stock Exchange that had been established in 1954. The second stock exchange,
Chittagong Stock Exchange, was formed in 1995. Both of these exchanges are regulated
under the Securities and Exchange Ordinance 1969 along with the Companies Act
1994. The major functions of these stock exchanges include listing of companies,
capital market surveillance and monitoring the activities of listed companies. Both
Stock Exchanges place continuous monitoring and reporting obligations on listed
companies in Bangladesh (Akhtaruddin 2005).
The Institute of Chartered Accountants of Bangladesh and the Institute of Cost
and Management Accountants of Bangladesh
The Institute of Chartered Accountants of Bangladesh (ICAB) and the Institute of Cost
and Management Accountants of Bangladesh (ICMAB) are two professional institutions
providing awareness and guidance to the accounting profession in Bangladesh. The
Chartered Accountants Order 1973 and the Cost and Management Accountants
Ordinance, 1977 were responsible for formation of ICAB and ICMAB. These two
statutory organisations are administered through the Ministry of Commerce,
Government Republic of Bangladesh. These two institutions are managed and operated
by internally elected council members.
Initiation of adoption of the International Accounting Standards was started in
Bangladesh in 1999 resulting from a grant from the World Bank. Initially the
Government delegated the adoption process to the Bangladesh Securities and Exchange
Commission. However, due to lack of resources and capabilities, the Bangladesh
Securities and Exchange Commission delegates this responsibility to the ICAB. This
Institute made some minor adjustments and adopted International Financial Reporting
Standards (IFRS) as Bangladesh Financial Reporting Standards (BFRS). ICAB adopted
IFRS 7 as BFRS 7 in January 2010. In more recent times, all BFRS have been updated
based on IFRS 201217
. Although ICAB is responsible for adoption of BFRS, this body
17
http://www.icab.org.bd/index.php?option=com_content&view=article&id=82&Itemid=116

41
has no legal mandate for enforcement of these standards for listed companies
(Bhattacharjee & Islam 2008; Mir & Rahaman 2005; Sobhani, Amran & Zainuddin
2012). Furthermore, as mentioned in Chapter 2, The Companies Act 1994 and the Bank
Company Act 1991 do not require adherence to any particular accounting standards. As
a result all the risk reporting disclosures in relation to international standards are argued
to be voluntary for Bangladesh banks.
ICAB delivers professional, ethical and technical standards to its members to develop
and support individuals, organisations and communities with sustainable economic
growth. ICAB has global membership with leading accounting bodies across the world
such as the International Federation of Accountants (IFAC), the International
Accounting Standards Committee (IASC) and the Confederation of Asian & Pacific
Accountants (CAPA), the South Asian Federation of Accountants (SAFA), and the
Chartered Accountants of England and Wales (ICAEW).
ICMAB assists in developing, formulating and implementing IFRS and Cost
Accounting and Auditing Standards in Bangladesh. ICMAB members are regarded as
competent cost and management accounting professionals. Like ICAB, ICMAB has
global affiliations, such as with IFAC, CAPA, SAFA, and the IASC.
The Central Bank (Bangladesh Bank)
As a Central Bank, Bangladesh Bank came into existence under the Bangladesh Bank
Order in 1972. As a financial sector regulator in Bangladesh, Bangladesh Bank
regulates and supervises banks and non-bank financial institutions with guidelines,
circulars and directives. Bangladesh Bank guidelines are meant to assist banking
institutions in adopting international best practices and allowing their capital structures
to be more risk absorbent.
In 2010, Bangladesh Bank issued Risk-Based Capital Adequacy guidelines, prepared
based on Basel II and Basel I (Wadood et al. 2010). This guideline was issued with an
aim to establish good governance and managing of risks for banks. The Risk-Based
42
Capital Adequacy guidelines are structured in three aspects; firstly, they outline the
minimum capital requirement for credit, market and operational risks; secondly, they
provide a comprehensive risk assessment process and thirdly, they present a public
disclosure framework for a bank’s risk profile, capital adequacy and risk management
system (BRPD 2010).
According to Bangladesh Bank’s roadmap18
, the year 2010 has been considered as the
full transition to Basel II. However, in practice, only limited number of banks had
adopted by that year (Ahmed & Pandit 2012). According to the Bank Company Act
1991, Bangladesh Bank may impose a penalty for nonconformity if a bank be
unsuccessful to meet minimum capital requirements in the stipulated time, no penalty is
imposed if banks fail to follow other disclosure requirements, such as public disclosure
of banks’ market discipline (Basel II: Market Discipline). After two years, in 2012,
Bangladesh Bank issued another guideline named ‘Risk Management Guidelines for
Banks’19
. This guideline suggested banks submit their quarterly and annual risk
management reports to the board of directors for consideration. However, this guideline
has no suggestion whether this should, in part at least, be included in annual reports. As
a result, banks submit their quarterly report to the Central Bank and do not mandatorily
disclose Basel II: Market discipline disclosures in annual reports.
To strengthen bank supervision, regulatory enforcement and resolution procedures,
Bangladesh Bank adopted a new management structure in 2012 aimed at consolidating
management over onsite and offsite supervision activities (International Monetary Fund
2013). For example, Bangladesh Bank established a ‘Financial Stability Department’ to
assess risks and vulnerabilities in the financial system. Apart from this, the ‘Financial
Integrity and Customer Service Department’ of Bangladesh Bank inspects all banks’
operational risks and their published annual reports, indicating the financial soundness
of each bank.
18
http://www.bb.org.bd/openpdf.php
19
http://www.bb.org.bd/openpdf.php

43
3.3 The financial system in Bangladesh
The financial system in Bangladesh is characterised by three major categories; formal;
semi-formal; and informal. The formal category includes all regulated banks and non-
bank financial institutions, insurance companies, capital market intermediaries (i.e.
broker houses, merchant banks) and microfinance institutions. However, semi-formal
institutions (such as non-government organisations, Grameen Bank, cooperatives) are
specialised financial institutions and not regulated under the Central Bank or the
Bangladesh Securities and Exchange Commission20
. The unregulated private
intermediaries comprise the informal sector in Bangladesh.
Figure 3.3 presents the structure of the financial system21
. It can be seen that the formal
categories are comprised of three types of money market; money market instruments are
treasury bills, commercial paper, negotiable certificates of deposits, banker acceptance
and capital market instruments consist of bonds, stock, government securities, bank and
consumer commercial paper, debentures and mortgages. Bangladesh Bank regulates
scheduled, non-scheduled and non-bank financial institutions. As a regulatory body for
the capital market, the Bangladesh Securities and Exchange Commission regulates the
stock exchanges, stock dealers, brokers, merchant banks, and credit rating agencies. The
Insurance Authority and Micro Credit Regulatory Authority regulate 18 life insurance
and 44 non-life insurance companies (as of March 201422
). The Microcredit Regulatory
Authority regulates 599 microfinance institutions (as of March 201423
).
20
Bangladesh Bank Website available at http://www.bangladesh-bank.org/fnansys/index.php 21
The financial system of Bangladesh consists of scheduled and non-scheduled banks, non-bank financial
institutions, microfinance institutions, insurance companies, co-operative banks, credit rating companies,
merchant banks, brokerage houses and stock exchanges. Scheduled Banks are banks that are licensed to
operate under the Bank Company Act, 1991 (Amended in 2003). Non-Scheduled Banks are banks that
are established for special and definite objectives and operate under the Acts enacted for meeting those
objectives. These banks cannot perform all the functions of scheduled banks (Bangladesh Bank 2013a). 22
Bangladesh Bank website available at http://www.bangladesh-bank.org/fnansys/index.php 23
Bangladesh Bank website available at http://www.bangladesh-bank.org/fnansys/index.php

44
Adapted from: Bangladesh Bank website at http://www.bangladeshbank.org/fnansys/index.php
3.4 Banking industry in Bangladesh
The economy of Bangladesh is growing gradually, moving up eight positions in the
Global Competitiveness Index in 2013 (compared to 2008). In addition, per capita
annual income crossed $US1000 recently (World Economic Forum 2013). According to
the ruling Government Mission 2021, Bangladesh wants to be a middle-income country
by 2021 (Bangladesh Bureau of Statistics 2013). The Bangladesh banking sector plays a
vital role in the national economy (Samad 2008; Siddikee, Parvin & Hossain 2013). The
banking sector accounted for 53 per cent of total market capitalisation in June 2013
(Bangladesh Bank 2013b).
9Figure 3.3: Structure of the financial system in Bangladesh
Non-banks
Capital Market
Bangladesh Bank
Formal Informal Semi-Formal
Money Market
Financial Market Regulators and
Institutions
Foreign
Exchange
Market
Banks
Bangladesh Securities and Exchange Commission
Micro credit Regulatory Authority
Specialised
Financial
Institutions
Private
intermediaries
Insurance Authority
Financial system in Bangladesh

45
3.4.1 Evolution of the banking industry
The banking system in Bangladesh originated from a Western banking style based on a
mechanism of interest rate spread24
. However, as a member of the Organisation of
Islamic Cooperation (OIC), in Bangladesh Islami Shariah based banks began operations
in 1983. After independence in 1971, the government was committed to rapid
development of the economy after an anarchic situation during the liberation period.
Political independence provided a conducive environment for economic growth in the
newly born Bangladesh. However, most of the private, commercial and service sectors
were owned by West Pakistani entrepreneurs who left the country before or during the
war of liberation time with their properties abandoned (Sobhan & Ahmad 1980). The
newly independent government adopted a socialist model for the economic
development of the country (Sobhan & Ahmad 1980). In line with this policy, the
government nationalised all commercial banks without paying compensation to the
owners of those banks, who were mostly non Bengalis and West Pakistani in identity
(Samad 2008).
After independence, Bangladesh began its journey with six nationalised commercial
banks, two state owned specialised banks and three foreign banks. The existing
commercial banks during the liberation period transferred their assets and liabilities to
the six newly formed nationalised banks. The banking sector was highly controlled and
protected from global competition with nationalised commercial banks in the domestic
market until the mid-1980s. However, financial reform in the banking sector changed
the situation (Sarker 1999).
3.4.2 Structure of the banking sector in Bangladesh
Financial reform in the mid-1980s expanded the banking sector in Bangladesh to
include a number of private banks. The banking system in Bangladesh is comprised of
four State Owned Commercial Banks, four Specialised Banks, thirty Private
24
In banking, the spread is the percentage difference between the interest rate charged on a bank loan and
the lender's cost of funds.

46
Commercial Banks and nine Foreign Commercial Banks. State Owned Commercial
Banks and Specialised Banks are fully or majority owned by government, Private
Commercial Banks are majorly privately owned and listed on a stock exchange and
Foreign Commercial Banks are branches of international banks in Bangladesh
(Bangladesh Bank 2013a). Recently, nine new banks have been permitted to enter the
market of which two are Specialised and seven are Commercial Banks. Private
Commercial Banks are characterised by conventional banking (i.e. interest-based
operations) and non-conventional or Islami Shariah-based (i.e. profit/ loss sharing
mode) banking system. There are seven Islami Shariah-based and three conventional
with Shariah-based25
branches operating in Bangladesh. Evidence from Bangladesh
indicates that Islamic banks can survive within a conventional banking framework by
switching over from a profit and loss sharing mode to trade-related modes of financing
(Sarker 1999).
As of June 2013, 47 scheduled (refer footnote 19) banks were operating in Bangladesh
(Ministry of Finance 2013). The structure of banks with their total number of branches,
deposits and assets is shown in Table 3.2. The Table reports that more than 60 per cent
of total asset deposits are handled by Private Commercial Banks, about 27 per cent of
total assets and 25 per cent of deposits by State Owned Commercial Banks and
Specialised Banks have 5.66 per cent of total assets with 4.91 per cent of deposits.
Source: Annual report, Bangladesh Bank 2014, p.27.
25
Conventional with Shariah-based banking offers both conventional and Shariah products.
3Table 3.2: Structure of the banking system in Bangladesh
(up to June 2013) Type of Banks No. No. of
Branches
Per cent of
Total Assets
Per cent of
Total Deposits
State owned commercial
4 3449 27.17 25.98
Specialised
4 1417 5.66 4.91
Private commercial listed
30 3130 60.82 62.81
Foreign commercial
9 63 6.36 6.31
Total 47 8059 100 100

47
Each of these types of banks has a different pattern of branch location as presented in
Table 3.3. According to the Financial Stability Report (Bangladesh Bank June 2013),
Private Commercial Banks are mostly (i.e. three quarters) located in urban areas.
(Bangladesh Bank 2013b). In addition, 36 per cent of State Owned Commercial Banks
are in urban areas. Specialised Banks are mostly (i.e. three quarters) in rural areas while
Foreign Commercial Banks have no branches in rural areas.
Type of
Banks
No.
of
Banks
No. of Branches Per cent of Total
Urban Rural Total Urban Rural Total
State owned commercial 4 1247 2202 3449 36 64 100
Specialised 4 168 1249 1417 11 88 100
Private commercial 30 1974 1156 3130 63 36 100
Foreign commercial 9 63 0 63 100 0 100
Total 47 3452 4607 8059 42 57 100
Source: Annual report, Bangladesh Bank 2014, p.27.
3.5 Financial reforms in banking sector
To minimise high debt overhang and to increase the stability of the balance of
payments26
, the developing countries around the world experienced major reform in
fiscal adjustment, financial reform, trade liberalisation and privatisation in the 1980s
(Sarker 1999). Bangladesh also entered into financial reform like many other
developing countries with the internal and external pressures that occurred in the mid-
1980s. Internal pressure, such as through the deregulation of the Pubali and Uttara
banks (two of six Nationalised Banks) and external pressure from donor agencies (for
example, the International Monetary Fund (IMF) and World Bank), drove the country to
reform the financial sector (Hossain & Chowdhury 1996). The financial reforms
26
According to Stein (2014), ‘the balance of payments accounts of a country record the payments and
receipts of the residents of the country in their transactions with residents of other countries. See 20th
June,
2014 online at http://www.econlib.org/library/Enc/BalanceofPayments.html.
4Table 3.3: Bank branches in urban and rural areas (up to June 2013)

48
encouraged Private and Foreign Banks to operate with more relaxed policies (Sarker
1999) than previously. As a result, during the 1980s, the loss making State Owned
Banks were privatised, domestic Commercial Banks were promoted and Foreign
Domestic Banks were increased in number (Uddin & Suzuki 2011).
As mentioned earlier, high debt overhang, problems with the balance of payments and
slow growth in many developing countries required financial reform to attain the
objective of financial adjustment, trade liberalisation and to keep control of a
deregulated financial market (Sheng 1996). The developed countries initiated this
reform and South Asian countries followed up the process around the 1980s (Samad
2008). Extant studies evidenced this reform process in several Asian countries;
examples include India (Choudhury 2007), Pakistan (Ahmad & Ahmad 2008), Sri
Lanka (Mukherjee & Nath 2003), and Nepal (Demetriades & Luintel 1996). However,
the outcome of the reform program was mixed (Uddin & Suzuki 2011).
Bangladesh initiated ‘The Financial Sector Reform Programme’ in 1982 with an
objective of encouraging the private sector and to create a competitive capital market
(Samad 2008). During the early phase of reform (in 1984), Bangladesh established ‘The
Money, Banking and Credit Commission’ to define the scope of reform with the
assistance of the World Bank. Under the ‘Financial Sector Reform Programme’,
significant measures were implemented, such as liberalisation in interest rate policy to
improve efficiency, lending and subsidies to priority sectors, improved monetary policy,
strengthening of the capital market, empowerment of the Central Bank, improvement in
State Owned Commercial Banks and reforms in the legal and institutional context.
During the period 1992-1996 the Commission developed new management and
operational tools, such as Lending Risk Analysis, Performance Planning Systems,
Management Information Systems, and the CAMEL (Capital, Asset, Management,
Earnings and Solvency) rating for off-site supervision of banks and disseminated these
tools through an extensive training process to bank officers (Kamal 2006).
The review outcome as evaluated by the ‘Structural Adjustment Participatory Review
Initiative’ in year 2000 indicated that implementation of the reform policy was

49
satisfactory; however, the desired outcome was not achieved (Bhattacharjee & Islam
2008). The Structural Adjustment Participatory Review Initiative Report (2000) further
evidenced that the absence of strict supervision, coupled with rigid economic regulation
by the Central Bank (Bangladesh Bank), could not generate the expected result in the
denationalisation and privatisation process. However, service quality has been improved
rather than overall banking efficiency. The Structural Adjustment Participatory Review
Initiative Committee recommended that macro-economic stability, political
commitment, non-interference by Government and vested interest groups, a
comprehensive framework for demand and supply aspects and sequential policy
measures could assist to achieve the goals of financial reform. The rest of this section
discusses financial reforms in the banking sector.
3.5.1 Risk measure policy reforms in banks
The reform programs aimed to achieve three aspects; policy reform, institutional reform
and legal reform. Bangladesh Bank circulated a number of policy reform frameworks.
The risk-based policy reform, of greatest relevance to this thesis, is discussed in this
section.
Risk based capital adequacy
Capital is the ‘cushion’ that covers the risk of a bank. Capital adequacy is the safeguard
for depositors and describes the financial health of a bank. A Minimum Capital
Adequacy Requirement (MCAR) for credit risks was incorporated in the Bank Company
Act 199127
. With the recommendation of the Bank for International Settlements (BIS),
the Central Bank directed all banks to measure ‘Risk Weighted Capital Adequacy’ in
1996 (Wadood et al. 2010). At that time banks published a summary of Risk Weighted
Capital Adequacy in their annual reports, however, this was not mandatory and Risk
Weighted Capital Adequacy measurement was undertaken primarily for credit risk
measurement. Later, in 2010, to align with international best practices and to make the
27 The Bank Company Act 1991is an act made to make provisions for banking companies

50
capital of a bank more risk sensitive and shock resilient, Bangladesh Bank introduced
guidelines on Risk Based Capital Adequacy for Banks (a revised regulatory capital
framework in line with Basel II). This Guideline recommends banks maintain a
minimum capital requirement, adequate capital, and includes disclosure requirements.
This Guideline assists banks in measuring, assessing and indicating risks appropriately
and follows the Basel II framework in the banking sector of Bangladesh.
Credit Risk Grading
The government’s liberal financial reform policy during the mid-1980s encouraged
banks to reduce interest rates and to increase the volume of credit disbursement in the
financial sector. As a result, National Commercial Banks and Private Commercial
Banks reduced their lending rates. However, the weak association between the bank rate
and the market interest rate in the monetary sector resulted in a decline in the interest
rate spread for Private Commercial Banks and Foreign Commercial Banks
(Bhattacharya & Chowdhury 2003). Under these circumstances, the Bangladesh Bank
introduced a ‘Credit Risk Grading System’ classifying loans into different categories
(BRPD 2009). Bangladesh Bank also published two separate manuals for banks and
non-bank financial institutions (Credit Risk Grading Manual-Banks, Credit Risk
Grading Manual-Non-Bank Financial Institutions).
Classified Loans and Provisioning
Bangladesh Bank has gradually improved the risk assessment process through identifying
early recognition of non-performing loans, resulting in credit discipline and strengthening
the financial stability of banks. At present, the Bangladesh Bank classifies all loans and
advances into four categories, consisting of (a) Continuous Loans, (b) Demand Loans, (c)
Fixed Term Loans, and (d) Short Term Agricultural and Micro Credit (BRPD 2012). If any
doubt arises in recovering loans, the loans are classified under a policy of applying
qualitative judgement into whether loans fall into ‘Sub-standard’, ‘Doubtful’, or ‘Bad Debt’
(BRPD 2012) categories.

51
Interest Rate Deregulation
In 1986, the government appointed ‘National Commission on Money, Banking and
Credit’ to identify major problems and to suggest remedial measures in the financial
system. The Commission recommended that Bangladesh Bank adopt a policy on
interest rate deregulation for both deposit-taking and lending. Bangladesh Bank
circulated this recommendation to all banks and the maximum allowable limit that a
bank can differentiate its rate by is three per cent considering risk elements among
borrowers and the lending category (BRPD 2009).
3.5.2 Institutional reform of risk measures
To improve the institutional capacity of banks in relation to measuring financial
stability and future risks, in the 1990s Bangladesh Bank introduced an off-site
supervision policy, the CAMEL rating. Additionally, institutional reform came through
the Credit Information Bureau and large loan reporting system (Wadood et al. 2010).
Off-site Supervision (CAMELS rating)
The CAMELS rating is a tool used to identify banking companies that have problems
and require increased supervision. Bangladesh introduced the CAMEL rating system in
1993 and a new component ‘S’ (sensitivity to market risks) was added from 2006 to this
rating tool. The CAMELS technique is used to assess the financial soundness and
operating efficiency of a bank and measures the sensitivity of market risks, such as
interest rate risk, commodity prices, equity prices etc. As an off-site supervision project,
Bangladesh Bank uses this device to assess banks’ financial health and to categorise the
bank as a ‘Sound bank’, ‘Early Warning bank’ or ‘Problem bank’ (Bangladesh Bank
2009). The components of the CAMELS rating are:
(C) Capital Adequacy - To strengthen the capital base and to implement the Basel II
accord, the ‘Risk Weighted Asset ratio’ has to be maintained at 10 per cent of which 5
per cent is core capital (Wadood et al. 2010).

52
(A) Asset Quality - Risk is associated with banks’ asset quality (i.e. loans and
advances). Asset quality measures the credit risk associated with particular assets and
identifies the amount and nature of non-performing assets.
(M) Management Soundness - Management competency regarding policies,
procedures, and internal control is judged using different ratios, such as, operating ratio,
profit per employee, expenses per employee, gross earning assets to total assets.
(E) Earnings Ability- Inadequate management may result in loan losses and in return
require higher loan loss allowance or pose a high level of market risks. Earnings ability
reflects the quantity and trend in earnings and factors that may affect the sustainability
of earnings.
(L) Solvency – The fund management practices in banks should be able to maintain a
level of solvency sufficient to meet their financial obligations in a timely manner and be
capable of quickly liquidating assets with minimal loss.
(S) Sensitivity to market risk- Sensitivity to market risks measures the adverse effects
due to deviations in interest rate, commodity price risk, and exchange rate and equity
price risks (Wadood et al. 2010).
Credit Information Bureau
To create a disciplined borrowing environment and to gather information about loan
applicants, the Bangladesh Bank established the Credit Information Bureau in 1992.
The Credit Information Bureau provides credit-related information for existing and
prospective borrowers (Bangladesh Bank 2012a). Bangladesh Bank directs all banks to
obtain a report about loan applicants from the Credit Information Bureau before
sanctioning a fresh loan, renewal of a regular loan, or rescheduling of a loan (BRPD
2009).

53
Large loan reporting system
The Bangladesh Bank established a ‘Department of Banking Operation and
Development’ in 1998 to monitor and review large loans. After examining prospective
borrowers’ applications, this Department allows commercial banks to sanction large
loans and signals the bank concerned to take action against undue risk in relation to
large loans.
3.5.3 Legal reform
The banking industry in Bangladesh experienced expanded regulatory development in
the 1990s. To strengthen the legal infrastructure, the Bank Company Act 1991, Artha
Rin Adalat Act 1990 and Bankruptcy Act 1997, were enacted.
3.6 Motivation for selecting Bangladesh as the context for this study
Bangladesh is selected as the context of this study for several reasons. First, the major
impetus comes from a desire to understand the extent of risk disclosure practices
according to international standards and the underlying factors that determine the level
of risk reporting in the setting of a developing country. As discussed in Chapter 1,
extant corporate risk disclosure studies have been conducted primarily in Western and
European countries. However, developing countries may benefit most from
implementing international standards, as these countries are more economically
vulnerable. The development of global guidance (IFRS 7 [Financial Instruments:
Disclosures] and Basel II: Market Discipline) for corporate risk disclosure thus offers
opportunity to investigate the response to these international standards and examine any
changes in risk reporting in a developing country like Bangladesh.
Second, to date, the risk disclosure literature in the context of developing economies is
scant (Hassan 2009). This study attempts to provide one step towards filling the
research gap by investigating both qualitatively and quantitatively banks’ corporate risk
disclosures and exploring the underlying driving factors for risk reporting by banks in
developing countries.

54
Third, although developing countries are by no means homogenous, they share a
number of political and economic concerns leading to problems in accounting
(Radebaugh & Gray 2005). It is argued that the accounting system in a developing
country should be relevant to the country’s requirements rather than imitating a
developed country’s accounting system (Samuels & Oliga 1982). In addition,
developing economies are characterised by family dominance, corruption and political
interference in corporate governance mechanisms and, therefore, are not conducive to
adoption of Western-styled governance models (Uddin & Choudhury 2008a). Like
many other developing countries, the corporate sector in Bangladesh is characterised by
poor enforcement in the regulatory and monitoring environment with external forces
imposed by donor agencies (Siddiqui 2010). The implementation of international
standards has been motivated largely by the country’s institutional settings along with
its economic, political and social framework. As discussed in Chapter 2, risk disclosure
in financial reporting is effectively voluntary in Bangladesh. Thus, Bangladesh provides
an opportunity to investigate how corporate governance mechanisms and isomorphic
behaviour influence risk governance and risk disclosure in banking institutions.
Fourth, the comparatively large sample of listed banks in Bangladesh, with both
conventional and non-conventional (Islamic) banks also favours selection of
Bangladesh as the setting for this study. As mentioned earlier, the banking system in
Bangladesh embraces both traditional interest rate banking along with a Shariah-based
banking system. Islamic banks in Bangladesh reflect a strong financial position with
future expansion possibilities (Bangladesh Bank 2013b). It is a particularly appropriate
time at which to analyse the extent of risk reporting by non-conventional banks in order
to fill a gap in the literature, as there is a dearth of research examining this sector.
Lastly, as the research seeks to identify risk governance insights and institutional
pressures for risk reporting using both qualitative and quantitative data, the researcher is
able to access for interview key executives at the Central Bank, the Bangladesh
Securities and Exchange Commission and the Commercial Banks, as she is of
Bangladeshi origin. This access assists the researcher to attain the research objectives of

55
this thesis. These aspects make investigating risk reporting in a developing country like
Bangladesh an ideal choice for this study.
3.7 Motivation for selecting listed banks in Bangladesh
The rationale for selecting the listed Private Commercial Banks as the research context
stems from several reasons. First, the economy of Bangladesh continued its rapid
growth and demonstrated considerable resilience during and following the GFC (2007-
2008) period. According to the Bangladesh Bureau of Statistics (2012), Bangladesh
achieved 6.3 per cent in real GDP growth in 2012 (Figure 3.4). The overall growth in
income increased deposits in banks over the period (see Figure 3.5). While the number
of banks has been growing, the amount of deposits has been proportionately increasing
in Private Commercial Banks (Bangladesh Bank 2013b). Therefore, this sector (Private
Commercial Banks) is an attractive context in which to conduct this research.
Source: Financial Stability Report, Bangladesh Bank (2013)
10Figure 3.4: Bangladesh real GDP growth

56
0
1000
2000
3000
4000
5000
6000
2008 2009 2010 2011 2012
Deposits
Deposits
Source: Financial Stability Report, Bangladesh Bank (2013)
Second until 2001, the banking sector in Bangladesh was dominated by Nationalised
Banks, while the growth of Commercial Banks imposed strong competition in the
market with better service quality. The inefficient administrative delay, use of
traditional technology and low regulatory and management supervision increased
interest in Private Commercial Banks. Figure 3.6 shows that around three quarters of
deposits belong to Private Commercial Banks, dominating the sector and growing from
51.4 per cent in 2007 to 60.8 per cent in 2012 while others’ asset share has been
declining (see Figure 3.7).
Source: Annual Report, Bangladesh Bank (2013)
11Figure 3.5: Deposits in years 2008-2012
12Figure 3.6: Deposits in the banking sector, 2012

57
0
10
20
30
40
50
60
70
Pe
rce
nta
ge
Year
SCBs
SBs
PCBs
FCBs
2007 2008 2009 2010 2011 2012
Source: Annual Report, Bangladesh Bank (2013)
Third, the Private Commercial Banks provide their financial data (such as in annual
reports) to the regulatory authorities (Bangladesh Bank and Bangladesh Securities and
Exchange Commission). The unlisted and non-financial sectors are opaque in nature
and provide limited information due to the absence of monitoring.
Finally, as the accessibility of Private Commercial Banks’ annual reports from the stock
exchange, Bangladesh Bank and banks’ websites allows the researcher to acquire
detailed data and to examine the extent of risk reporting practices in Bangladesh. Given
the competitive situation discussed above, the Private Commercial Banks (hereafter-
listed banks) emerge the most suitable sample used in this study.
3.8 Chapter conclusion
This Chapter describes the context of financial institutions in Bangladesh in detail. The
financial system, banking evolution, regulatory reforms and the accounting environment
in the country are described in order to explain the contextualisation of the study. The
next Chapter reviews the literature in line with the research objectives of this thesis.
13Figure 3.7: Percentage share of assets (2007-2012)

58

59
PART TWO
LITERATURE REVIEW AND THEORETICAL UNDERPINNING
Chapter 4: Literature Review
Chapter 5: Theoretical Perspective Underpinning the Research:
Conceptual Framework and Hypotheses

60
Part Two reviews the literature and provides the theoretical perspective underpinning
the research. The discussion in Chapter 4 presents in depth outline of the examination,
explaining the objectives of the research. The Chapter emphasis is on the importance of
disclosure in accounting research, previous related research and outlines the gaps in
previous research. Chapter 5 provides a discussion of theoretical aspects associated with
risk disclosure. That Chapter presents the conceptual framework and hypotheses
developed for the present study also.

61
CHAPTER 4: Literature Review
4.1 Introduction
The objectives of this Chapter to provide a review of financial reporting research
focusing on a specific research area: corporate risk disclosure. The initial discussion
focuses on the meaning of disclosure in accounting research. The Chapter then proceeds
with a review of prior research related to corporate risk disclosure, beginning with a
focus on the banking industry and then moving to non-industry specific studies. A
discussion on the main issue of this broader study follows; that is, ‘risk disclosure
practices: their determinants and performance’, and whether and how existing financial
reporting research addresses this issue. The Chapter leads to a comprehensive
framework of the examination and exposition of the objectives of the study. That is to
identify the extent of corporate risk disclosure practices for all listed banks in
Bangladesh, to identify the association between risk disclosure and determining factors
of such disclosure, and to examine the association of risk disclosure and bank
performance. The structure of this Chapter is presented in Figure 4.1.
14 Figure 4.1: Roadmap of Chapter
Introduction (4.1)
The concept and
classification of
risk (4.2)
The concept of
disclosure in (4.3)
Gaps in the
literature (4.5)
Review of previous
studies (4.4)
Chapter
conclusion (4.6)

62
4.2 The concept and classification of risk
4.2.1 The concept of risk
The present study investigates risk disclosure by banks, thus a principal concern lies in
the definition of risk. In the past, the word risk has been used to reflect adverse events
that have occurred (Deumes & Knechel 2008). However, following the industrial
revolution, the ideas of risks have changed. In the period of Renaissance, the insurance
industry and probability calculations developed the ideas behind risk (Linsley & Shrives
2000). In 1921, Knight introduced the pioneering concept of risk. He explained risk in
economics as a measurable uncertainty. Later on, the term ‘risk’ became used broadly in
everyday language (Linsley, Shrives & Crumpton 2006).
The ‘pre-modern’ idea of risk relates to ‘occurrence of natural events’ (Linsley &
Shrives 2006, p.388). The modern ideas of risk include both ‘positive and negative
outcomes of events’ (Linsley & Shrives 2006, p.388). Extant research defines risk in
several aspects. For example, risk is improbability that take account of either gain or
loss (IASB 2004; ICAEW 1995) and has potential impacts on expected results (Beretta
& Bozzolan 2004). Oliveira, Rodrigues and Craig (2011, p.820) defined risk as ‘actions
taken to manage, mitigate or deal with any opportunity, prospect, hazard, harm, threat,
or exposure’. Dobler (2008, p.187) explains risk using two views- the first view is
‘uncertainty–based…(and) defines risk as the randomness of uncertainty of future
outcome’. The second view is ‘target-based,…(and) defines risk as the ‘potential
deviation from a benchmark or target outcome’ (Dobler 2008, p.187).
According to Solomon et al. (2000) risk may result in either upside or downside risks.
Those authors refer to upside risk as the potential to gain while downside risks are
events where things may go wrong to some extent. Therefore, to create balance, risk
reporting should indicate the range of possible different outcomes with upside and
downside potentials (ICAEW 1999). In the view of the Institute of Chartered
Accountants of England and Wales (1999b), risk disclosure by business should reflect
both opportunities and threats.

63
From a business perspective, risk is influenced by various internal (e.g., finance,
business process, personnel, business strategy) and external factors (e.g., political,
regulatory, market etc.). Dobler (2008) noted ‘corporate risk management continuously
aims at identifying risk factors, analysing and evaluating their potential impact in future
outcomes and addressing the distribution by means of risk handling where appropriate’
(p.187). The key challenge of companies is to identify these risks factors and manage
the possible opportunities they present in a structured way.
4.2.2 Classification of risk
As argued in the earlier section, from an organisational viewpoint, risks arise from
different internal and external sources or factors. Different industries face different
types of risks (Solomon et al. 2000); therefore, it is difficult to establish a complete set
of risk types that are faced commonly by organisations. Different types of risks in extant
literature are defined and summarised in Table 4.1.
Scholars and professional reports have identified risks in several key categories. These
include business risk, political risk and environmental risk (Lajili & Zéghal 2005), non-
financial and financial risks (Cabedo & Miguel Tirado 2004), operational risks,
empowerment risks, information processing and technology risk (Linsley & Shrives
2006), and hazard-based risk (Lenckus 2001). Turnbull et al. (1999) stated risk types as
including business, operational, financial, compliance and other risks. The International
Financial Reporting Standard 7 (Financial Instruments: Disclosures) classifies financial
risk in three types: credit, liquidity and market risk.
It should be noted that the classifications presented in Table 4.1 are not uniform and that
there is no well-accepted classification model or taxonomy of risks. Companies use
different terminology when they refer to risk (Thuélin, Henneron & Touron 2006).
However, for the purposes of this study, the following classification is developed
focusing on risks relevant to banks and dividing risk disclosure into seven categories.
These are: i) Risk Types (Market, Credit, Liquidity, Operational and Equities risks); ii)
Capital Disclosure risks; iii) Internal Corporate Governance risks; iv) Information and

64
Communication risks; v) Strategic Decision risks; vi) General Risks Information; and
vii) Government Regulation risks. These classifications and their coverage are presented
in Chapter 6.
Author and Year Risk Categories
Deumes (2008) Eight risk components including macro environmental sources,
industry sources, internal sources, other sources, loss and
probability of loss, variance, lack of information, and lack of
control.
Papa (2007) Three risk components including environmental risk, process
risk, information for decision-making and eight risk sub-
components (operational, operational decision-making, financial,
empowerment risks, business reporting risk information,
processing risk, integrity risk, and strategic decision-making
risk).
IFRS 7 (2007) Credit, liquidity and market risk (interest, currency and other
price. Other price risks include prepayment, residual value, equity
price, commodity price)
Linsley and Shrives
(2006, p.389)
Financial, operational, empowerment and information processing
and technology risk, integrity and strategic risks.
Lajili and Zegal
(2005)
Financial, political, technology, environmental, weather,
government regulations, seasonality, operational, cyclicality,
suppliers and natural resources.
Cabedo and Tirado
(2004)
Non-financial (i.e. business and strategic); and financial (market,
credit, liquidity, operational and legal)
Institute of Risk
Management (IRM)
(2002)
Risks arise from external drivers and internal drivers, Risk
classified into financial, strategic, operational and hazard.
ICAEW (November
2002)
12 generic categories of risks: accounting, economic and political
environment, financial, human resources, legal/ regulatory/
corporate governance, management information, operation and
markets, project and IT, reputation, strategic, and
terrorist/criminal.
5Table 4.1: Classification of risk in extant literature

65
4.3 The concept of disclosure in accounting and economics
The disclosure-linked research has established into a distinct branch of accounting and
economics area (Frolov 2004). There are researches on disclosure from around the
world covering different aspects in the economics and accounting fields. Several studies
reveal the importance of financial disclosure in improving the accountability of business
entities in different countries (Akhtaruddin 2005; Hossain 2008; Hossain & Hammami
2009; Hossain, Islam & Andrew 2006; Nier & Baumann 2006). Many other scholars
have demonstrated clearly in accounting and economics research the necessity for
financial disclosure (Erkens, Hung & Matos 2012; Michael, Kaouthar & Daniel 2011;
Woods & Linsley 2007).
As expanded upon below, extant studies focus on harmonisation of accounting practices
in the world arena, the extent of disclosure, financial reporting frameworks, financial
reporting disclosure, discovering possible determinants of disclosure, mandatory and
voluntary disclosure association, determinants of regulatory disclosure compliance in
different economies, and non-financial disclosure (such as; corporate social and
environmental disclosure).
Research on corporate risk disclosure practices became widespread in the early 2000s
(see for example, Abraham & Cox 2007; Linsley & Shrives 2000; Linsley & Shrives
2005b; Solomon et al. 2000). An initial study on risk disclosure carried out by Solomon
et al. (2000) found that better risk disclosure would benefit investors in their decision-
making. This study strongly suggested the importance of risk disclosure as a measure of
corporate governance development. Following this study, Beretta and Bozzolan (2004);
Linsley and Shrives (2006); Abraham and Cox (2007); Hashagen, Harman and Conover
(2009); Cornett et al. (2011); Erkens, Hung and Matos (2012) focused more specifically
on risk disclosure in annual reports (the next section discusses these prior studies in
detail).
The GFC of 2007-08 raised the issue of risk disclosure and encouraged regulators and
accounting professionals to develop the quality of financial reporting and enhance its

66
credibility (Erkens, Hung & Matos 2012). The failure of a large number of financial
institutions28
during the GFC (2007-2008) period lead to great public apprehension and
investors becoming gradually doubtful of companies’ annual reports (Hill & Short
2009). Consequently, it has been argued that better communication by companies is
needed to overcome this public distrust and more research is required to guide
management and stakeholders to assess risk and uncertainties of business (Aebi, Sabato
& Schmid 2012; Dobler 2008; Lajili 2009; Woods 2007; Lajili & Zéghal 2005; Linsley
& Shrives 2006).
Hossain (2008) and Verrecchia (2001) distinguished three major disclosure problems in
extant disclosure literature. First, it is vital to determine the economic efficiency of
disclosure; second, it is vital to develop theoretical constructs with hypotheses and third,
it is vital to examine the consequence of disclosure on market performance. The focus
of this current research is on one specific area; corporate risk disclosure practices: their
determinants and the association of risk disclosure with bank performance. For this
purpose, the rest of this Chapter investigates how the existing literature in accounting
addresses the issue of corporate risk disclosure. Consequently, the next section provides
an review of literature on corporate risk disclosure.
4.4 Risk disclosure: Review of previous studies
The combination of concerns about financial reporting on the one aspect and declining
levels of societal trust in large corporations, on the other, continues to provide countless
actions to promote a change in organisations’ business practices (Pearce & Zahra 1992).
In this high scrutiny context, companies are expected to improve not only their
reporting compliance and performance, but are asked also to reveal risk-reporting
information publicly (Solomon et al. 2000). Accordingly, the field of accounting started
to investigate organisations’ disclosure of corporate risk information (Linsley & Shrives
2000). Since the 1990s, the financial accounting literature has been concerned with how
organisations manage their financial activities via disclosure in annual reports and other
28
Bear Stearns, Citigroup, Lehman Brothers, Merrill Lynch (in the U.S.A), HBOS and RBS (in the U.K.),
and Dexia, Fortis, Hypo Real Estate and UBS (in continental Europe) (Erkens, Hung & Matos 2012).

67
reporting mechanisms (Beretta & Bozzolan 2004; Linsley & Shrives 2000; Solomon et
al. 2000).
In past decades, researchers have examined corporate financial disclosure (Amran, Bin
& Mohd 2008; Hill & Short 2009; Hossain 2008; Hossain & Hammami 2009; Kajuter
2006; Linsley & Lawrence 2007; Linsley & Shrives 2000; Linsley & Shrives 2005a, b,
2006; Linsley, Shrives & Crumpton 2006; Schrand & Elliott 1998) and social and
environmental disclosure (Belal 2001; Belal, Cooper & Roberts 2013; Chowdhury
2012; Deloitte 2014; Guerreiro, Rodrigues & Craig 2012; Hossain, Islam & Andrew
2006; Sobhani, Amran & Zainuddin 2012; Villiers & Alexander 2010), amongst other
things. A decade of corporate annual report research (1990-2000) was reviewed by
Stanton and Stanton (2002) and revealed the presence of disclosure studies on image
management, marketing, legitimacy, political economy, accountability and
environmental disclosure; however, none was noted in that review to examine
disclosure of risk information. Similarly, Linsley, Shrives and Crumpton (2006) noted
that in the last 30 years, disclosure studies have focused on corporate disclosure in
general (i.e. financial, environmental, qualitative, quantitative, good/bad disclosure) and
are not specific to risk disclosure. They (Linsley, Shrives and Crumpton [2006]) also
discussed the debate over diversity in risk communication and the usefulness of risk
information to assess the risk profiles of firms.
Previous risk disclosure studies (Abraham & Cox 2007; Amran, Bin & Mohd 2008;
Beretta & Bozzolan 2004; Hernandez-Madrigal, Blanco-Dopico & Aibar-Guzman
2012; Kajuter 2006; Oliveira, Rodrigues & Craig 2011; Solomon et al. 2000) have
focused mainly on companies other than financial institutions. There are also risk
disclosure studies from the perspective of the capital market (Botosan 2004; Healy,
Hutton & Palepu 1999; Verrecchia 2001).
There are some investigations of specific disclosure items (e.g. market risks) in a
specific section (such as the Management Report) of the annual report (Amran, Bin &
Mohd 2008; Michael, Kaouthar & Daniel 2011). These research have investigated the
relationship of risk disclosure with companies’ performance and value and stock price

68
decisions (Aebi, Sabato & Schmid 2012; Amran, Bin & Mohd 2008; Beasley, Clune &
Hermanson 2005; Hoitash, Hoitash & Bedard 2009; Uddin & Hassan 2011). Some
studies examine comprehensively risk disclosure in annual report (Abraham & Cox
2007; Linsley & Shrives 2006; Solomon et al. 2000), while others examine risk
disclosure in prospectuses (Deumes & Knechel 2008; Wallage 2000).
A number of studies have analysed various accounting standards and other documents
and identified the extent of risk reporting in annual reports according to these standards
or other documents (Abraham & Cox 2007; Baysinger & Butler 1985; Eng & Mak
2003; Mair & Marti 2009; PWC 2008; Solomon & Lewis 2002). Apart from these
standards, some studies have concentrated on the richness of information by focusing on
the qualitative nature of risk disclosure (Abraham & Cox 2007; Beretta & Bozzolan
2004; Cabedo & Tirado 2004; Dobler 2008; Lajili & Zéghal 2005; Linsley & Shrives
2006).
Many researchers have investigated the determinants of corporate risk reporting and
found underlying risk reporting determinants, such as size (Beattie, McInnes & Fearnley
2004; Beretta & Bozzolan 2004; Linsley & Shrives 2006). Several studies have
concentrated on past-oriented risk disclosure rather than looking at forward-looking
disclosure (Beattie, McInnes & Fearnley 2004; Kajuter 2006; Lajili & Zéghal 2005;
Mohobbot 2005; Solomon & Lewis 2002). Some studies have focused only on the
management discussion and analysis section (MD &A) in annual reports rather than
investigating the whole report (Beretta & Bozzolan 2004).
Existing studies of corporate risk disclosure can be divided into two streams:
‘academic’ research (Dobler, Lajili & Zéghal 2011 Basel committee 1999, 2000, 2001;
Linsley et. al 2006; Ellul & Yerramilli 2010; Fahlenbrach & Stulz 2011) and ‘audit
firms’ research (e.g. Ernst & Young 2008; KPMG 2008; PricewaterhouseCoopers
2008). The discussion within this Chapter focuses on both streams.

69
4.4.2 Empirical studies of risk reporting by banking institutions
The Basel Committee on Banking Supervision conducted the first risk disclosure in the
context of financial institutions. To achieve the objective of analysing risk disclosure
characteristics, the Basel Committee analysed 54 banks from 13 countries all over world
for a three year (1999-2001) period. The Committee suggested the importance of timely
public disclosure within the context of market discipline (Basel 2003). Basel Committee
papers detailed comprehensive risk disclosure items under 12 categories29
and used a
survey including 104 questions, which were completed by each respective supervisory
authority. However, this study did not provide any further information in relation to risk
reporting in detail except ‘yes’ ‘no’ and ‘not applicable’ responses. The Basel
Committee Report (2003) noticed that increased disclosure over the period pertained to
disclosure of operational, legal, liquidity and interest risks.
One of the first exploratory studies of risk disclosures in the banking sector involved a
comparative analysis between two countries conducted by Linsley, Shrives and
Crumpton (2006). The study uses content analysis of 18 banks (nine British and nine
Canadian), and investigates the nature and characteristics of risk disclosure. They found
a positive association with size, profitability, and extent of risks. A major limitation of
this study is that the authors used qualitative measurement for coding (measured as
good, bad, neutral risk disclosure), which is subjective, at the researchers’ discretion and
depends on an individual’s perception (Amran, Bin & Mohd 2008). Additionally, the
sample size in this study is relatively small in number.
A more specific study was conducted by Helbok and Wagner (2006) who identified
operational risk management as being a fundamental concern for banks. The content
analysis and disclosure index approach used in that study involved examining annual
reports for 1998-2001 of 59 banks from North America, Asia and Europe. This study
concluded that equity and profitability ratios are negatively related to operational risk
29
These include capital structure, capital adequacy, market risk internal modelling, internal and external
rating, credit risk modelling, securitisation activities, credit risk allowances, credit derivatives and other
credit enhancement, derivatives, geographic and business line diversification, accounting policies, and all
other risks.

70
disclosure. However, in general this relationship is expected to be less evident in later
periods due to advances in international standards and risk disclosure regulation.
Additionally this study examined only operational risk disclosure. However, the present
study fills the gap in the literature as this study investigated comprehensive categories
of risk disclosure.
Hossain (2008) examined the extent of both voluntary and mandatory disclosure by
banks in India. The study found profitability, size, board composition and market
discipline variables (non- performing loans, capital adequacy ratio) significant in
explaining the extent of risk disclosure. However, this study used a single year of data
(2002-03) and further research using longitudinal data can measure the changes in risk
disclosure over periods. The present study incorporates longitudinal data to investigate
the development of corporate risk disclosure across the period 2006-2012.
Next, Ismail, Rahman and Ahmad (2013) examined risk disclosure by seventeen Islamic
financial institutions in Malaysia, including banks and non-banks, using data from
2006-2009. They found that risk disclosure had improved greatly over the sample
period. This study is amongst the first to examine risk disclosure in Islamic financial
institutions; however the study did not investigate the determinants of risk disclosure
nor make comparisons with non-Islamic financial institutions. The present study
investigates the determinants of both conventional (Non-Islamic) and non-conventional
(Islamic) banks on a contemporaneous basis over a substantial period.
Apart from the few examples of sector-specific academic research reviewed above,
public accounting firms, such as PricewaterhouseCoopers (PWC), KPMG, and Ernst &
Young have studied corporate risk disclosure. PWC (2008) examined annual reports
from year 2007 using a survey of 22 banks worldwide reporting under International
Financial Reporting Standards (IFRS) or US Generally Accepted Accounting Principles
(GAAP). The results revealed that the quality of risk disclosure had improved compared
to PWC’s previous survey in 2005. However, implementation of the accounting
standards did not result in an immediate improvement in risk disclosure by sample
banks and most samples did not provide a complete depiction of risk disclosure

71
potential best practice (PWC 2008). Another study by Ernst & Young (2008)
investigated the implementation status of IFRS 7 (Financial Instruments: Disclosures)
in 24 of the largest European banks. The key findings suggest that the GFC affected
reporting of risk significantly in year 2007 as banks provided detailed information about
their asset quality (Ernst & Young 2008). These two studies examined whether sample
banks complied with IFRS 7 or not, however, their research methodology was not
explained clearly.
To attain the objective of analysing risk disclosure and related regulation and emerging
ideas in the European financial sector, KPMG (2008) examined the annual reports of 39
European financial institutions (25 banks and 14 insurance companies) for the period
ending 2007. That study identified that risk disclosure in the area of credit risks was
more developed compared to business risk disclosure.
4.4.3 Empirical studies of risk reporting in other than banking institutions
As mentioned in section 4.2, the initial study on risk disclosure was carried out by
Solomon et al. (2000). It suggested the importance of internal corporate governance and
presented a picture of emerging issues surrounding risk disclosure. The authors
developed a conceptual framework for internal control in the context of risk
management and risk disclosure for institutional investors. By conducting a survey of
552 institutional investors in the U.K., Solomon et al. (2000) validates two conceptual
frameworks. This study indicated a need for conducting in-depth case study research of
banks or any other industry in future. The present study includes interviews with
corporate representatives and regulators with an aim to attain insights in relation to
corporate risk disclosure.
Another study by Linsley and Shrives (2000) discussed the merits and demerits of risk
disclosure from business and stakeholders’ aspects. They analysed ICAEW (1998) and
Basel (1998) proposals for greater bank transparency and much-admired the potential
benefits of enhanced risk disclosure. The present study goes beyond those previous
studies by examining the association between risk disclosure and bank performance.

72
Another noteworthy study by Beretta and Bozzolan (2004) contributes to the literature
by providing a multi-dimensional framework for risk analysis of non-financial
companies on the Italian Stock Exchange. The framework is based on risk three aspects
(company characteristics, company strategy, and external environment) and semantic
properties (positive, equal, negative, not disclosed), type of measure (financial/non-
financial, quantitative/qualitative, no measure), and outlook orientation
(information/action) using a sample of 85 non-financial companies. This study paid
attention to specific aspects of ‘what’ and ‘how’ market risk information was disclosed.
The authors found a positive association between the quantity of risk disclosure and size
and no association between the quality of risk disclosure and size. This study has been
criticised, as the quality of information is difficult to measure (Botosan 2004). The risk
disclosure outline in this study deals with many dimensions, which is argued to confuse
readers’ understanding (Thuélin, Henneron & Touron 2006). In addition, that study
examined only the management reports of annual reports. The present study classifies
risk disclosure under seven categories (refer Chapter 6) and the Risk Disclosure Index
used in this research is unique, constructed on international standards and former related
studies.
Classifying risk into financial and non-financial categories, Cabedo and Tirado (2004)
developed a risk quantification model. They used data from 1000 listed non-financial
firms on the Spanish Stock Exchange for 10 years (1991-2001) and calculated the value
at risk (VaR) for sample companies. They classified risks into business, strategic,
market, credit, operational and liquidity risks. However, the results limit the
generalisability of their conclusion for different industries, such as the banking industry.
Another group of studies has examined mandatory and voluntary risk disclosure. For
example, Lajili and Zéghal (2005) examined 300 Canadian Stock Exchange companies.
Using content analysis, this study analysed mandatory and voluntary risk disclosure in
annual reports for year 1999 under 12 risk factors. This study found a high degree of
risk disclosure intensity. However, the authors comment that a lack of uniformity,
clarity and quantification of risk disclosure items could potentially limit their usefulness
(Lajili & Zéghal 2005). Therefore, more formalised and comprehensive risk disclosure

73
is desirable to lessen the asymmetries of information between management and
stakeholders (Lajili & Zéghal 2005).
Several studies examine risk disclosure in non-financial companies. For example,
Mohobbot (2005) examined the relationship between risk disclosure and firm specific
characteristics in Japanese non-financial companies. The study identified that disclosure
of risk is related to company size. Linsley and Shrives (2006) conducted another
significant empirical study. They examined the sample of 79 FTSE 100 annual reports
of non-financial firms for the year 2000. The results showed a positive association
between risk disclosure quantity and firm size. In addition, the companies disclosed a
great amount of forward-looking and good news information in relation to general
statements of risk policy. However, the limitations of forward-looking information are
its incompleteness and it not being useful for investors who usually desire detailed
narrative risk information to understand the risk profile of business. The results also
showed that companies prefer forward-looking disclosure. The findings in this study are
inconsistent with those of Beretta and Bozzolan (2004) and Woods and Reber (2003).
Later, Thuélin, Henneron and Touron (2006) focused on a framework that investigated
listed non-financial companies in France to eliminate the deficiency in the lack of
consensus in laws and regulations of company practice. The study found that there is no
consensus between the different pieces of legislation. However, the study focused only
on mandatory provision of risk disclosure. Another study by Hill and Short (2009)
examined the Unlisted Securities Market and Alternative Investment Market in the U.K
and found that risk disclosure by initial public offering companies contains a greater
proportion of forward looking information rather than internal control and risk
management information.
Narrative risk disclosures from a broader perspective were first examined by Abraham
and Cox (2007). They examined whether the amount of narrative risk disclosure is
associated with ownership, governance and U.S.A. listing characteristics. After
examining 71 FTSE 100 annual reports for the year 2002, the study found risk
disclosure to be negatively associated to shareholders by long-term institutional

74
investors and positively associated to shareholders by short-term institutional investors.
Another finding in this study was that U.K./U.S.A. dual listed firms disclose more
information about risks than single exchange listers. A limitation of this study is that the
authors used words as a recording unit; however, risk related information could be
diluted by using other words. Therefore, the researcher may overlook insights
concerning risk information.
Apart from annual reports, Deumes and Knechel (2008) focused on managers’ financial
motivations for risk disclosure and implementation of sound internal controls over risk
management for public companies from The Netherlands. The study found a positive
relation between corporate risk disclosure and leverage. However, the authors focused
only on sample companies’ prospectuses that predict the volatility of companies’ future
stock price.
Some studies explored the association between risk disclosure and company
characteristics. For example, Hassan (2009) examined 41 UAE listed companies and
explored the association between the extent of risk disclosure and companies’
characteristics. They developed a risk disclosure index by categorising risk into
different groups. However, the index measured the risk disclosure variation among
UAE companies only, as the items were assembled subjectively based on their existence
in the sample companies’ annual reports. Therefore, this index is developed to account
the variation of risk disclosure for the sample country (UAE). However, the Risk
Disclosure Index in the present study is based on international standards and existing
related literatures and not developed for the sample (Bangladesh) country exclusively.
Additionally, Uddin and Hassan (2011) provided evidence on 36 UAE manufacturing
companies and found disclosure of risk information avoided uncertainty and maintained
effective diversification of investment portfolios by investors, which can minimise the
level of market risk. In that study however, it must be noted that the sample size is
relatively small in number.
Taylor, Tower and Neilson (2010) found corporate governance, capital raising, firm size
and leverage to be positively related with the extent of risk disclosure in Australian

75
listed resource firms. However, this study examined only financial risks and was
conducted using data from resource firms.
Marshall and Weetman (2002) first investigated comprehensive corporate risk
disclosure in multi-countries. The study compared regulatory requirements for foreign
exchange risk disclosure in the U.S.A. and U.K. using data from annual reports of 30
(from each country) listed firms. They found disclosure rules implemented in two
countries at the similar period could have dissimilar effects in different governing
settings. The findings lead to the authors’ conclusion that ‘in relation to qualitative
disclosure, there exists a regulatory dialectic in which the opposing forces are the
regulator’s desire for clarity and transparency matched against the corporate
management desire to protect the entity and perhaps to protect the managerial interest’
(Marshall & Weetman 2002, p.48).
Woods and Reber (2003) examined six U.K. and six German companies’ annual reports
for years 2000 and 2001. In particular, this study compared the pattern of risk reporting
between the two countries. The results showed German Accounting Standard 5: (Risk
Reporting) had a positive effect on reporting. However, the extent of risk disclosure is
advanced in the U.K. compared to German companies and the small sample limits
generalised conclusions from this study. Dobler, Lajili and Zéghal (2011) conducted
another multi country study. Using a sample from the U.S.A., Canada, U.K. and
Germany, they found that risk disclosure is published mainly in management reports, is
qualitative in nature, relates to the past and present and is non-time specific.
Recently, Hernandez-Madrigal, Blanco-Dopico and Aibar-Guzman (2012) examined
the impact of the Unified Code of Good Governance on the quality and quantity of risk
disclosure by 35 listed Spanish companies for the period 2004-2009. The authors
conclude that implementation (2006-2009) of the Unified Code has improved the
quality and quantity of risk information (Hernandez-Madrigal, Blanco-Dopico & Aibar-

76
Guzman 2012). However, the study analysed disclosure only in relation to the
Committee of Sponsoring Organisations (COSO) II30
framework.
Another recent study, Probohudono, Tower and Rusmin (2013a) examined voluntary
risk disclosure in South-East Asian countries using a sample of manufacturing firms for
the period 2007-2009 in Indonesia, Malaysia, Singapore, and Australia. Those authors
created a risk disclosure index including 34 items of voluntarily disclosed risk
information. They identified that these countries mostly disclose business risk items
rather than strategy risk. However, the findings limit generalisation to the banking
industry. In another study Probohudono, Tower and Rusmin (2013b) found consistent
risk disclosure during the GFC period. They found that the least developed country (i.e.
Indonesia) has the maximum business risk issues and has inferior level of disclosure
compared to Malaysia, Singapore and Australia. Table 4.2 provides a summary of
empirical research on risk disclosure by banks and non-financial firms.
30
The eight components of the COSO II framework consists of- i) internal environment, ii) objective
setting, iii) event identification, iv) risk assessment, v) risk response, vi) control activities, vii)
information and communication, and viii) monitoring.

77
6Table 4.2: Empirical studies of corporate risk disclosure
Author Focus Explanatory
variables/coding
Research Approach Research Findings Research Gap
Solomon et
al. (2000)
Developed a conceptual
framework refereeing to the
Turnbull Report for internal
control, risk management and
risk disclosure. They focused
on the disclosure aspect of the
conceptual framework for
internal control
Corporate
governance
perception,
investment decision,
demand for
information
Country: U.K.
Data: survey among
552 U.K. institutional
Investors in 1999
Method: Quantitative
(Multiple variable
analysis)
Theory: Agency
Increased risk
disclosure help
institutional investors
in making decision for
their investment
portfolio. In addition,
they require detailed
risk disclosure rather
business risk
information only.
Initial study of risk
disclosure and
indicated a need for
conducting in-depth
case study
Linsley and
Shrives
(2000)
Examine the merits and
demerits of risk disclosure
refereeing to ICAEW proposal
and Basel committee
recommendation on risk
disclosure
Discussion paper Few companies
disclose voluntary
risk disclosure and
argued regulations for
mandatory
requirements.
No empirical
evidence
Marshall
and
Weetman
(2002)
Compared foreign exchange
risk disclosure in between two
countries
Disclosure policy
and information
economics
Country: U.K. and
U.S.A.
Data: 30 Annual
reports from each
country in 1998
Method: Quantitative
Theory: Agency
Disclosure regulations
drawn in two
countries have
different implication
status
Focused only on
foreign exchange risk
disclosure

78
Author Focus Explanatory
variables/coding
Research Approach Research Findings Research Gap
Woods and
Reber (2003)
Compared U.K. and German
companies risk reporting
referring to German
Accounting Standard 5
coding Country: U.K. and
German
Data: 6 Annual
reports from each
country in 2000 and
2001
Method: Quantitative
and Qualitative
(Content analysis)
Theory: not discussed
Observed increased risk
disclosure after post
release of GAS5
through the overall
disclosure is higher in
U.K. compared to
German.
Small sample size
Beretta and
Bozzolan
(2004)
Risk disclosure outline in this
study measure the quality of
risk disclosure
Size, industry Country: Italy
Data: 85 annual
report from non-
financial companies in
2001
Method: Quantitative
Theory: signalling
Size or industry does
not influence quantity
of disclosure.
Quality of disclosure
is difficult to measure
and also many
dimensions of risk
disclosure in this study
confuses the readers’
understanding
Cabedo and
Tirado (2004)
Classified risks in financial and
non-financial category and
established a set of specific risk
quantification model
Risk quantification
model
Country: Spain
Data: 1000 financial
and non-financial
companies from 1991-
2001
Method: Quantitative
(Statistical
Distribution method)
Theory: Agency
Value at risk -
calculated companies’
risks and identified
systematic view of
risks affecting business
activity to put forward
a quantification model.
The results limit the
generalised conclusion
in different industries,
such as banking
Linsley and
Shrives (2005)
Discussion paper on three aspects; first, discussed risk disclosure debate; second, risk disclosure practices, and third, significant issues
arising out of the then proposed Basel requirements.
Mohobbot
(2005)
Examine risk disclosure
practices and firm specific
characteristics.
Size, profitability,
ownership pattern
Country: Japan
Data: 90 non-
financial companies in
Size and risk disclosure
are positively related,
no relationship with
The management
pattern in sample
country is not
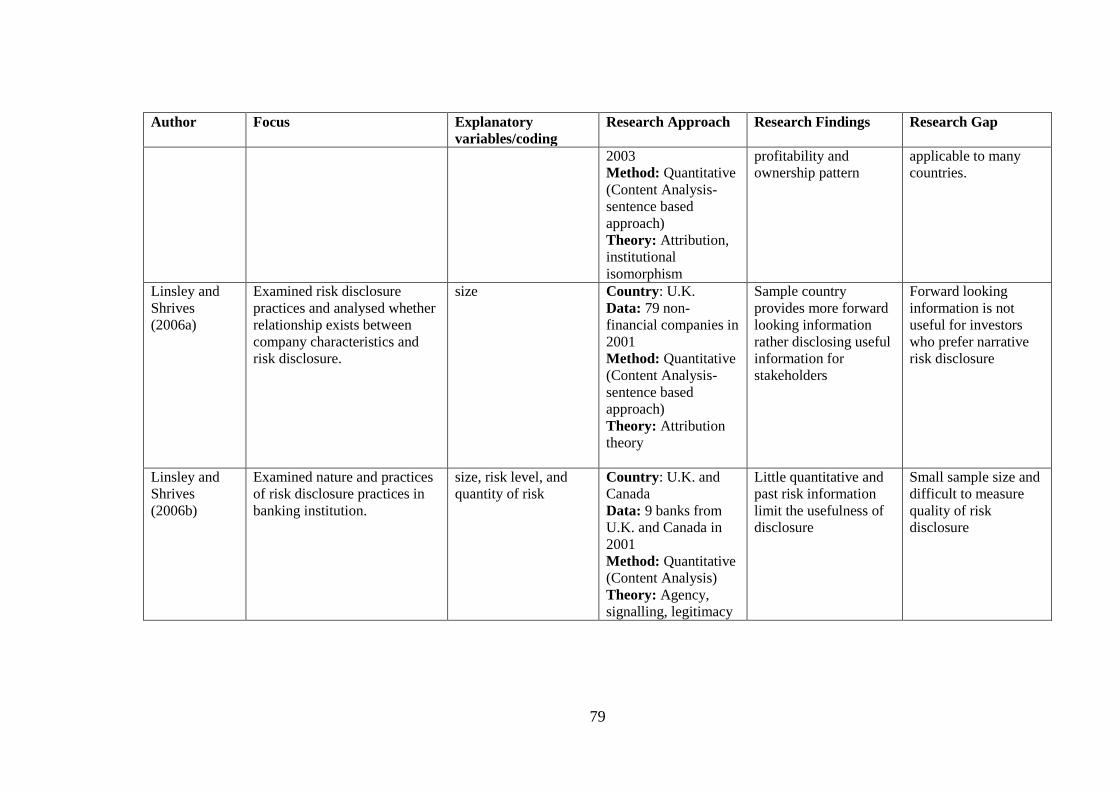
79
Author Focus Explanatory
variables/coding
Research Approach Research Findings Research Gap
2003
Method: Quantitative
(Content Analysis-
sentence based
approach)
Theory: Attribution,
institutional
isomorphism
profitability and
ownership pattern
applicable to many
countries.
Linsley and
Shrives
(2006a)
Examined risk disclosure
practices and analysed whether
relationship exists between
company characteristics and
risk disclosure.
size Country: U.K.
Data: 79 non-
financial companies in
2001
Method: Quantitative
(Content Analysis-
sentence based
approach)
Theory: Attribution
theory
Sample country
provides more forward
looking information
rather disclosing useful
information for
stakeholders
Forward looking
information is not
useful for investors
who prefer narrative
risk disclosure
Linsley and
Shrives
(2006b)
Examined nature and practices
of risk disclosure practices in
banking institution.
size, risk level, and
quantity of risk
Country: U.K. and
Canada
Data: 9 banks from
U.K. and Canada in
2001
Method: Quantitative
(Content Analysis)
Theory: Agency,
signalling, legitimacy
Little quantitative and
past risk information
limit the usefulness of
disclosure
Small sample size and
difficult to measure
quality of risk
disclosure

80
Author Focus Explanatory
variables/coding
Research Approach Research Findings Research Gap
Thuélin,
Henneron and
Touron (2006)
Focus on mandatory risk
reporting applying to
companies leads to the question
of whether or how companies
are compliant with regulations.
Coding
Country: France
Data: Annual
Reports, laws,
accounting standards,
professional source
Method: Qualitative
(Interactive model)
Theory: Grounded
Laws and regulations
terminology differ in
different countries.
Focused only on
mandatory risk
disclosure
Helbok and
Wagner
(2006)
Referring to the Basel
Committee Report, the study
focused on operational risk
disclosure
Equity, profitability Country: From North
America, Asia and
Europe
Data: 59 banks from
1998-2001
Method: Quantitative
(Content Analysis-
word count)
Theory: Agency ,
signalling and
political cost
Equity and profitability
ratio is negatively
related to operational
risk disclosure
Only operational risk
is examined
Linsley and
Lawrence
(2007)
Focus on readability and
obfuscation of risk disclosure
Readability, good
news, bad news
Country: U.K.
Data: 25 largest non-
financial companies
annual reports in 2001
Method: Quantitative
(Content Analysis-
sentence based
approach using Flesch
Reading Ease
formula)
Theory: Attribution
Level of readability of
risk disclosure is
difficult
Overlooked the
understandability of
disclosure

81
Author Focus Explanatory
variables/coding
Research Approach Research Findings Research Gap
Abraham and Cox
(2007)
Referring to FRS 13
and the Turnbull
Report examines the
quantity of risk
information
Ownership governance
and U.S.A. listing
characteristics
Country: U.K.
Data: 71 annual
reports in 2002
Method: Quantitative
(Content Analysis-
word based approach)
Theory: Agency
Risk disclosure is
negatively related to
share ownership.
Uses words as a
recording unit,
however, companies
can dilute risk related
information using
other words.
Furthermore, this study
only analysed the
narrative content of
annual reports.
PWC (2008) Referring to IFRS and GAAP the study surveyed 22 banks world-wide to examine whether the
sample banks implement fair value, structure finance and risk management and found the standards
positively influence reporting however, most of the banks did not provide a complete depiction of
risk management practices.
Survey study.
Methodology was not
clearly explained.
Ernst Young (2008) The study investigated the implementation status of IFRS for 24 largest European banks. The key
finding of this study is that after the recession, banks’ financial reports are more detailed.
KPMG (2008) Examined 39 European Financial institutions (25 banks and 14 Insurance companies) for the period
ending 2007 and identified the risk disclosure area in credit risks are the most developed compared
to business risks disclosure.
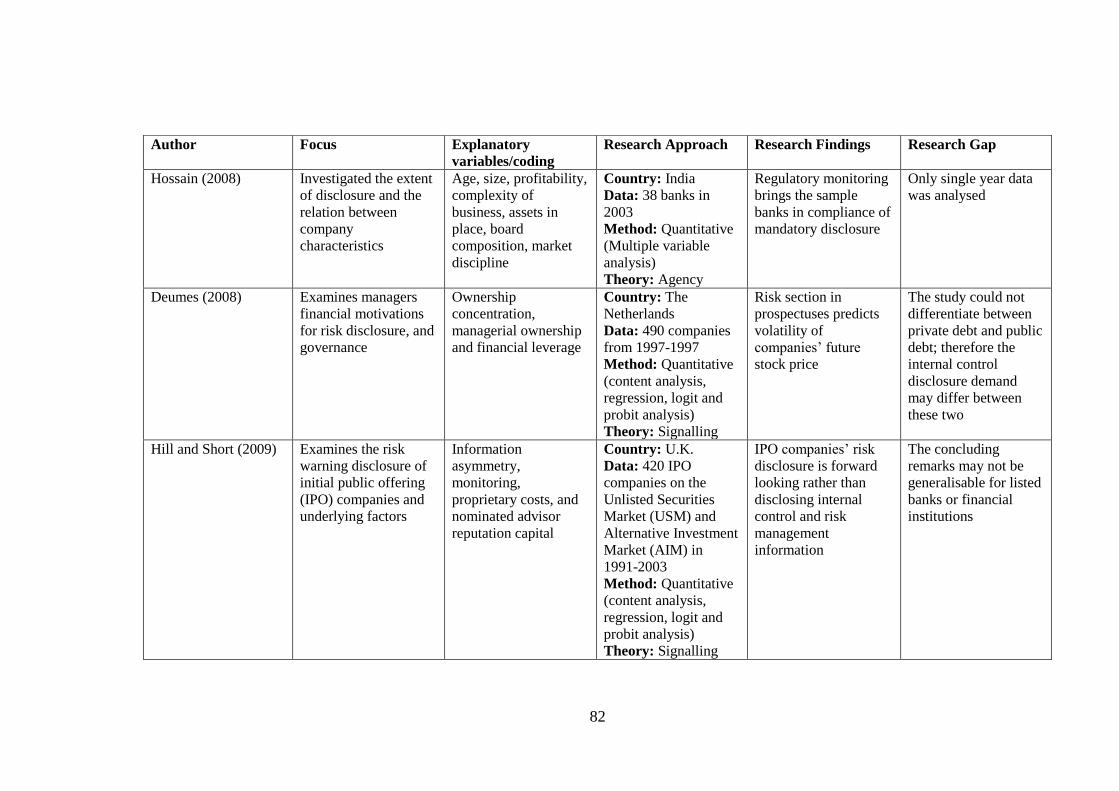
82
Author Focus Explanatory
variables/coding
Research Approach Research Findings Research Gap
Hossain (2008) Investigated the extent
of disclosure and the
relation between
company
characteristics
Age, size, profitability,
complexity of
business, assets in
place, board
composition, market
discipline
Country: India
Data: 38 banks in
2003
Method: Quantitative
(Multiple variable
analysis)
Theory: Agency
Regulatory monitoring
brings the sample
banks in compliance of
mandatory disclosure
Only single year data
was analysed
Deumes (2008) Examines managers
financial motivations
for risk disclosure, and
governance
Ownership
concentration,
managerial ownership
and financial leverage
Country: The
Netherlands
Data: 490 companies
from 1997-1997
Method: Quantitative
(content analysis,
regression, logit and
probit analysis)
Theory: Signalling
Risk section in
prospectuses predicts
volatility of
companies’ future
stock price
The study could not
differentiate between
private debt and public
debt; therefore the
internal control
disclosure demand
may differ between
these two
Hill and Short (2009) Examines the risk
warning disclosure of
initial public offering
(IPO) companies and
underlying factors
Information
asymmetry,
monitoring,
proprietary costs, and
nominated advisor
reputation capital
Country: U.K.
Data: 420 IPO
companies on the
Unlisted Securities
Market (USM) and
Alternative Investment
Market (AIM) in
1991-2003
Method: Quantitative
(content analysis,
regression, logit and
probit analysis)
Theory: Signalling
IPO companies’ risk
disclosure is forward
looking rather than
disclosing internal
control and risk
management
information
The concluding
remarks may not be
generalisable for listed
banks or financial
institutions

83
Author Focus Explanatory
variables/coding
Research Approach Research Findings Research Gap
Hassan (2009) Developing a Risk
Disclosure Index, the
study explored the
relationship among the
level of risk disclosure
and companies’
features.
Size, level of risks,
industry type
Country: UAE
Data: 49 financial and
nonfinancial
companies in year
2005
Method: Quantitative
(Multiple regression
analysis)
Theory: Institutional
Size is not
significantly related
with extent of risk
disclosure whereas
industry type is
significant in
explaining risk
disclosure
The index items are
subjectively assembled
based on sample
companies.
Taylor et al. (2010) Examines financial
risk management
disclosure
Adoption of IFRS,
corporate governance,
capital raising and
jurisdiction
Country: Australia
Data: 111 extractive
resource companies
2002-2006
Method: Quantitative
(Ordinary Least
Square regression)
Theory: Agency
IFRS has positive
impact on reporting
Resource firms and
financial risk were
analysed.
Dobler, Lajili, Zeghal
(2011)
Focused on multi
country risk disclosure
in manufacturing
companies
Size, country Country: U.S.A.
Canada, U.K. German
Data: 160 companies
in 2005
Method: Quantitative
(Multiple regression
analysis)
Theory: Agency
Size positively affects
number of risk
disclosure and negative
association between
leverage and quantity
of risk disclosure in
Germany. Positive
association in North
American settings.
Number of disclosure
cannot capture the
weights of information.
Cross-country findings
are not generalisable.

84
Author Focus Explanatory
variables/coding
Research Approach Research Findings Research Gap
Uddin and Hassan
(2011)
Examines whether
more risk disclosure
has a negative
association with stock
price and market risks.
Corporate risk
disclosure, Volatility
of securities return,
market risk factor
Country: UAE
Data: 36 companies in
2005
Method: Quantitative
(Multiple regression
analysis)
Theory: Capital asset
pricing, portfolio
theory
Risk disclosure has no
negative association
with the variables
examined
Only single year data
was analysed
Hernadez-Madrigal,
Blanco-Dopico and
Aibar-Guzman (2012)
Referring to COSO,
the study examines the
impact of Unified
Code of Good
Governance on the
quality and quantity of
corporate risk
disclosure
Coding Country: Spain
Data: 35 listed
companies from 2005-
2009
Method: Quantitative
(Content Analysis-
word count)
Theory: Legitimacy
The code influences
positively risk
disclosure narratives
COSO framework is
not adequate for
financial institution
analysis.
Probohundono, Tower
and Rusmin (2013)
Examined voluntary
risk disclosure of
South-East Asian
Countries
Country;
company size;
managerial ownership;
and board
independence.
Country: Indonesia,
Malaysia, Singapore,
and Australia
Data: 15
manufacturing
companies from each
country for 2007-2009
Method: Quantitative
(Multiple regression
Analysis)
Theory: Agency
Positive association
with Country, size
and board
independence and
negative association
with leverage and risk
disclosure
Small sample size

85
Author Focus Explanatory
variables/coding
Research Approach Research Findings Research Gap
Ismail, Rahman and
Ahmad (2013)
Examine risk
disclosure in Islamic
financial institutions in
pre and post-recession
periods
Scored risk disclosure
index
Country: Malaysia
Data: 17 Islamic
financial institutions
from 2006-2009
Method: Quantitative
(Multiple regression
Analysis)
Theory: Not discussed
The disclosure in
Islamic financial
institutions has been
improved across the
period
They did not
investigate the reason
for the increased level
of risk disclosure.

86
4.5 Gaps in the literature
This Chapter discusses financial reporting research with a particular focus on corporate
risk disclosure. Prior research on corporate risk disclosure has attempted to provide an
understanding of the trends in and motives for this type of disclosure. A review of prior
research on corporate risk disclosure practices recommends that the incidence and
quality of corporate risk disclosure practices has increased substantially since the 1990s
in general and the GFC (2007-2008) in particular. However, much of this literature
relates to developed countries. The discussions in this Chapter give directions to
consideration of the following research lacks in the relevant literature:
1. A review of prior literature indicates that currently there is a lack of research
investigating risk disclosure practices. While the extant research on risk disclosure
focuses primarily on the extent of risk disclosure practices based on annual reports, no
research to date has examined banks’ disclosure practices in relation to the international
standards banks have in place for addressing various issues associated with risk
disclosure. The in-depth interviews with banking regulatory representatives in this study
aim to attain insights to such disclosure.
2. A review of the literature also highlights that no research to date has documented a
longitudinal study that investigates banks in an emerging country (such as Bangladesh)
within their corporate governance context. Bangladesh it is argued is a site where
adoption of international standards, even by listed banks, is effectively voluntary. The
study of this nature would provide meaningless results if it was conducted using data
from a high rule of law country where enforcement of governance, accounting and
prudential standards is mandated (Chapters 2 and 3 explain in detail the necessity for
this context). Additionally, a longitudinal study could provide insights to risk reporting
practices.
3. A review of the literature also highlights that no research to date has documented risk
disclosure practices and determinants of risk disclosure within financial institutions.

87
The above deficiencies lead to the value of this particular research, which attempts to
add to the existing body of knowledge in investigating the nature of risk disclosure by
banks in Bangladesh. This study also seeks to explore the underlying factors that
explain risk disclosure and performance.
4.6 Chapter conclusion
The aim of this Chapter was to find out whether and how the extant accounting
literature addresses a specific financial reporting issue- in particular, risk disclosure
practices. A review of the literature points to gaps in extant financial accounting
research dealing with risk disclosure, many of which this study seeks to overcome.
While investigating the research issues identified in this Chapter, it is important to
embrace the relevant theoretical framework underpinning the research. In this regard,
Chapter 5 provides a thorough discussion of underpinning theories, as they are
appropriate to attain an understanding of the research objectives of this thesis.

88
89
CHAPTER 5: Theoretical Perspective Underpinning the Research -
Conceptual Framework and Hypotheses
5.1 Introduction
The aim of the study involves three interrelated aspects. The first aim is to investigate
the extent of risk reporting practices by listed banks in Bangladesh. What risk
information is disclosed in relation to best practice suggested by international standards
is investigated. The second aim is to explore the underlying factors associated with risk
reporting in relation to bank characteristics. Previous studies evidenced a variety of
theoretical perspectives to explain the determinants of disclosure. This study however,
restricts attention to agency theory to justify the hypothesised corporate governance
factors and neo-institutional theory to explain the hypothesised external isomorphic
influences on risk disclosure. The third aim of this study is to examine whether risk
disclosure has an association with bank performance.
The timeline for this present study lends to its importance, coming as it does a few years
after the publication and implementation of IFRS 7 and its amendments and BASEL II:
Market Discipline. In the Bangladesh context, it is expected that risk disclosure would
be increased as an evidence of and endorsement towards corporate governance
improvements (Solomon et al. 2000). This research hypothesises that banks will
respond to these international standards by enhancing the extent of risk disclosure even
where compliance is not compulsory as in a country such as Bangladesh. This leads to
the first hypothesis:
H1: There are significant differences in risk disclosure over the period under
examination (2006-2012).
The objective of this Chapter is to provide a discussion of theoretical aspects associated
with corporate risk disclosure, an important initial step in developing the conceptual
framework and Hypotheses for the present study. Theoretical considerations assist in
explaining the phenomenon of risk disclosure and managers’ motivations in disclosing
voluntary disclosure in addition to that required by legislation. The Chapter commences
with discussion of underpinning theories followed by development of research
hypotheses . Figure 5.1 provides an overview of this Chapter.

90
5.2 Theories discussed in previous disclosure studies
Prior literature on disclosure has focused mainly on institutional theory (Hassan 2009),
stakeholder theory (Amran, Bin & Mohd 2008), signalling theory (Helbok & Wagner
2006; Linsley & Shrives 2000; Marshall & Weetman 2002), agency theory (Abraham &
Cox 2007; Aziz A 2009; Bertomeu, Beyer & Dye 2011; Deumes & Knechel 2008;
Helbok & Wagner 2006; Lajili 2009; Linsley & Shrives 2000; Oliveira, Rodrigues &
Craig 2011), legitimacy theory (Oliveira, Rodrigues & Craig 2011), political cost theory
(Helbok & Wagner 2006; Linsley & Shrives 2000), capital need theory (Choi 1973),
and proprietary theory (Kajuter 2006; Mohobbot 2005). However, no single theory has
been available that articulates the phenomena of disclosure completely (Linsley &
Shrives 2000).
This study extends the analysis of risk disclosure practices and examination of
determinants of risk disclosure based on agency theory and neo institutional
isomorphism. The following section discusses the relevance of these underpinning
theories in detail.
5.3 Agency theory
Agency theory has dominated in the literature on economics and accounting and finance
(Hermalin & Weisbach 2012). The key idea of this theory is that the principal-agent
relationship should use information in the organisation efficiently to minimise
information asymmetry and risk bearing costs (Eisenhardt 1989). The shareholders act
15Figure 5.1: Roadmap of Chapter
Introduction (5.1)
Theoretical
perspective of
previous studies (5.2)
Agency theory (5.3)
Conceptual
framework (5.6)
Chapter conclusion
(5.7)
The relation between
risk disclosure and
bank performance
(5.5)
Institutional theory
(5.4)

91
as principals and managers as agents under this theory. Jensen and Meckling (1976,
p.308) define the agency relationship as ‘a contract under which one or more persons
(the principal(s)) engage another person (the agent) to perform some service on their
behalf which involves delegating some decision-making authority to the agent’.
Eisenhardt (1989, p.59) outlined two aspects of agency theory- the ‘principal-agent’
stream and ‘positivist’ stream. The principal-agent stream has a broader focus than the
positivist stream and greater interest in general in pointing out effective contracting
alternatives. The principal-agent relationship can be functional in any agency
relationship, such as employer-employee, lawyer-client, buyer-supplier. However, the
positivist stream focuses on classifying situation where agency relationship have
conflicts to accomplish their objectives and then describes the governance
mechanism(s) that control agents’ self-interested behaviour (Eisenhardt 1989).
Despite its wide scale use in several disciplines, including the accounting area, agency
theory has encountered controversy and has its critics. Perrow (1986) cited in
Eisenhardt (1989, p.58) argues that agency theory is ‘hardly subject to empirical tests
since it rarely tries to explain actual events’. Further to that, agency theory is one-sided
and fails to explore other key issues such as exploitation of workers (Eisenhardt 1989).
Moreover, the inherent distrust in agency theory perspective leads to a dehumanisation
of the agent, where the intrinsic motivations are ruthlessly replaced with a rational
calculation of the value of consequences (Shapiro 2005; Surendra 2010). Therefore, the
agency theory perspective is purely made for a model to be workable mathematically
and reduce agents’ dynamism (Ghoshal 2005; Surendara 2010). This has been
complemented by the development of a system based on formal rules, norms and moral
principles previously found in a rational society (Coleman 1993).
5.3.1 The agency problem
Shareholders delegate authority and responsibilities to the board of directors. As a
result, agency theory conceives two potential problems that may arise within the
manager-shareholder relationship: moral hazard and adverse selection.

92
In the context of agency relationships, a problem of information asymmetry occurs as
the agents have an information advantage. Shareholders may have limited ability to
assess managerial decisions. Consequently, managers may take advantage of greater
information access to increase their individual wealth (Foerster , Sapp & Shi 2013).
Information asymmetry creates moral hazard issues and may lead to imprudent
decisions from shareholders’ perspective. Jensen and Meckling (1976) hypothesised
that if principals and agents seek to maximise their own self-interest, agents become
opportunistic and maximise their own welfare by serving their own best interest. As a
result, they do not pursue maximisation of principals’ wealth. However, using a
monitoring system through financial disclosure may assist to lessen the agency problem
(Miller & Noulas 1996).
Adverse selection arises as a consequence of misrepresentation of the agent’s abilities.
Without the appropriate skills and abilities, the agent takes wrong decisions in respect
of the organisation’s policies and disclosure decisions.
Jensen and Meckling (1976) identified two classes of agency conflict: these involve
compensation contracts and owner-debt holder contracts. They further suggested that
accounting reports and disclosure of information could decrease the costs of these
conflicts, increase shareholders’ confidence level and reduce information asymmetry.
Figure 5.2 depicts the agency relationship between principals (shareholders) and agents
(managers) which can be let down by conflict.
Figure 5.2 shows the agency problem and scope of monitoring arising through
governance mechanisms. Contracts reduce the misalignment of interests. However, in
complex business environments, contracts cannot cover all eventualities. When
contracts fail to achieve their desired objectives, the principal relies on governance
mechanisms to supervise the agent.

93
Source: Cullen, Kirwan and Brenan (2006, p.11)
Further, Fama and Jensen (1983) argued that an agency problem arises as there is a
conflict of interest concerning principals and agents in relation to agency costs, such as,
costs of organisational structuring, monitoring, and bonding where contracts are not
written or, where written are not enforced. Effective supervisory practice can lessen
agency problems (Fama & Jensen 1983).
5.3.2 Agency theory and the organisational perspective: Association of
agency theory with disclosure
Eisenhardt (1989) identified that agency theory contributes to organisational thinking in
two aspects. The first is the usage of information that plays a vital role in the formal
information system, such as budgeting and more informal aspects such as managerial
supervision. A rich information system provides control over managerial opportunism.
Agency theory suggests the board can be used for monitoring purposes in shareholders’
16Figure 5.2: Agency theoretical perspective
Principal Agent Agency
relationship
Agency problem/conflict
Contract
Imperfect
contract
Perfect contract
Agency
costs
Governance
Mechanisms
Residual
agency costs
Bonding Costs

94
interests (Fama and Jensen 1983). Second, another contribution of agency theory is in
its risk implications as an uncertain future is controlled in part by organisation
members, rather than being influenced by governmental regulations, emergence of new
competitors or rapid technological innovation. Several empirical studies, such as
Botosan (2004); Healy, Hutton and Palepu (1999) have found a negative association
between the cost of capital and disclosure of information. The cost of equity capital
decreases when the amount of disclosure increases (Botosan 1997). In addition, a high
level of disclosure can increase market solvency, which leads to a more efficient capital
market by avoiding potential market failure (Healy, Hutton & Palepu 1999).
As stakeholders need to understand the risk profile of businesses, they seek information
about the risk profile to be disclosed by companies, together with how risks are being
managed. Improved risk disclosure assists stakeholders to be more aware of internal
governance and to interpret the level of various risks the company faces. These higher
levels of transparency simplify interpreting risks for external users and reduce agency
costs (Cabedo & Miguel Tirado 2004; Hill & Short 2009; Marshall & Weetman 2002).
In addition, operational risk disclosure might have the potential to reduce the cost of
capital, agency costs, and the cost of financial distress (Helbok & Wagner 2006).
Solomon et al. (2000) argue that risk disclosure represents a means of controlling the
agency problem. Furthermore, risk disclosure and sound governance are of interest to
regulators as they reduce agency problems (Abraham & Cox 2007).
Agency theory presumes that the board of directors will exercise the primary control
function in business organisations. Corporate governance mechanisms serve to monitor,
discipline, and remove ineffective management teams to ensure that managers pursue
shareholders’ interests (Ben Naceur & Kandil 2009). Therefore, functional governance
mechanisms with positive attributes (such as board independence, audit committee
independence, the presence of a risk committee) are necessary. In summary, agency
theory principles are advanced as an underpinning theoretical justification for the
development of Hypotheses in this study. The following section discusses these
Hypotheses in detail.

95
5.3.3 Relevance of agency theory in this study: Development of Hypotheses
This study focuses, in part, on agency theory in achieving its research objectives.
Agency theory is relevant to this study as it describes that information asymmetry
between principals and agent can be decreased by supervising the opportunistic
behaviours of agents (Jensen & Meckling 1976). Annual report disclosures provide a
mechanism for reducing monitoring costs and assist to lessen agency problems (e.g.
moral hazard and adverse selection). Moreover, in an active capital market, financial
reporting disclosure reduces information asymmetry and hence lessens the monitoring
burden between principals and agents (Marshall & Weetman 2002). Managers are
expected to have incentives to disclosure; for example, to keep their reputation and
remuneration (Healy, Hutton & Palepu 1999). Disclosure can mitigate information
asymmetry problems (Botosan 1997; Hill & Short 2009). If managers choose not to
disclose relevant information in annual reports, the information gap results in less
transparency in the annual report (Marshall & Weetman 2002) and the withheld
disclosure consequence is a possible conflict of interest concerning principal and agent.
This information may also affect users’ perceptions.
Unlike many other developing countries, in Bangladesh the corporate sector faces weak
enforcement of international standards (International Monetary Fund, World Bank) along
with poor legal structure (Khan, Muttakin & Siddiqui 2013). However, corporate
accountability, governance and transparency are vital for the development of and
sustainable growth in any country (Abhayawasnsa & Azim 2014). Shareholders and
creditors tend to introduce monitoring mechanisms to observe risk management
activities (Linsmeier et al. 2002). However, nonexistence of monitoring systems,
managers may be opportunistic in manipulating or providing misleading disclosure
(Latham & Jacobs 2000). Monitoring mechanisms depend on having an independent
board (Abraham & Cox 2007; Deumes & Knechel 2008; Lajili 2009; Oliveira,
Rodrigues & Craig 2011); an independent audit committee (Fraser & Henry 2007;
Oliveira, Rodrigues & Craig 2011); and risk committee (Aebi, Sabato & Schmid 2012).

96
Board Independence
Independent directors are defined as directors who do not have any other relationship,
whether pecuniary or otherwise, except for their board seat, whereas directors with any
other business ties are known as non-independent (or ‘grey’) directors (Aebi, Sabato &
Schmid 2012). It is expected that independent directors are impartial in disclosing more
risk information than non-independent directors disclose. The GFC of 2007-2008 has
been used as a setting in which to examine the performance of independent directors on
boards in several studies (Adams 2012; Beltratti & Stulz 2012; Hermalin & Weisbach
2012). Theoretically, independent directors have little involvement in daily internal
business and are not influenced by corporate insiders (Lim, Matolscsy & Chow 2007).
They are motivated to demand more risk disclosure than executive directors do to
balance the level of risk in the business and thereby maintain their personal reputations
(Amran, Bin & Mohd 2008; Beasley, Clune & Hermanson 2005; Oliveira, Rodrigues &
Craig 2011).
Consistent with previous studies, this study follows agency theory and adopts
independent board as a risk governance factor in explaining the level of risk disclosure.
The next Hypothesis is:
H2: The number of independent directors on the board is associated positively
with the extent of risk disclosure
Audit Committee Independence
Banks with a higher percentage of independent directors on the audit committee are
more expected to monitor the internal control risk management and risk reporting
process effectively (Fraser & Henry 2007; Oliveira, Rodrigues & Craig 2011). Boards
require support from audit committees to assist in ensuring transparency and
accountability and to monitor diversified business operations by reducing agency costs
(Fraser & Henry 2007). Independent directors on the audit committee assist in ensuring
the effectiveness and reliability of audit committees (Turley & Zaman 2004). The
Hypothesis is:

97
H3: The number of independent directors on the audit committee is associated
positively with the extent of risk disclosure.
Risk Committees
Risk committees assist in ensuring that a wide range of risks in banks is identified and
that risk exposures are managed within the risk strategy. By helping to maintain risks at
a desired level, risk committees assist in achieving banks’ desired financial goals. The
various types of risk committees include ‘asset/liability management committees, credit
committees, purchase committees, bank operation risk committees and bank risk
management committees. After the GFC (2007-2008), banks devoted greater attention
to risk disclosure and increased the number of risk committees and segregated their
duties and responsibilities (Aebi, Sabato & Schmid 2012). Therefore, it is expected that
the more a bank acknowledges its risk reporting concerns through establishing more
effective risk committees, the more likely it is to provide risk disclosure in its annual
report. However, given that data proxies for risk committee effectiveness (such as,
number of meetings, independence of members etc.) is not likely to be disclosed for
many banks in the sample, the number of risk committees is used as a proxy. Risk
committees monitor risk exposure, policies and procedures affecting loans, non-
performing loans, market, and operational areas within the risk strategy and risk appetite
of the bank, as established by the board of directors. Therefore, the following
Hypothesis is proposed:
H4: The number of risk committees is positively associated with the extent of
risk disclosure.
5.4 Institutional theory
Institutional theory takes a predominantly sociological view of organisations’
operational practices (Ahmed & Pandit 2012; Bank 2012b; Basel 2001). It is concerned
with ‘the relationship between organisations and their environments’ (Powell &
DiMaggio 1991 p.12). Institutional theory asserts that the process of creation of an
institutional environment, such as through rules, norms, structures and schemes,
influences entities strongly to form authoritative guidelines and develop formal
organisational structures (DiMaggio & Powell 1983; Scott 2004). Social and
institutional pressures impact organisational practices and procedures to be empowered
to prevail in social expectations to gain, maintain and repair legitimacy (Lenckus 2001).

98
The initial literature on institutional theory is now considered ‘old institutional theory’
and was developed by Berger (2011); Beyer et al. (2010). At that time, institutional
theory considered the organisation as an ‘adaptive organism’ embedded in a local
community environment and responding to pressure from the external environment,
depending on the organisations’ leadership and employees’ commitment.
Institutionalisation provides value to the structure (Beyer et al. 2010), and promotes
stability so that the structure persists over time (Farooque et al. 2007) to achieve
organisational effectiveness.
‘New institutional theory’ added a new outlook to the old institutional theorists, viewing
‘environment’ and ‘institution’ from a wider perspective in relation to professional and
industrial aspects. The new institutional theory31
is based on the concept of the social
structure of reality introduced by Shapiro (2005). New institutional theorists argue that
an organisation is embedded by behaviour and practices in order to be legitimate in its
environment and highlight the symbolic value of institutionalisation (DiMaggio &
Powell 1983; Laux & Leuz 2009). Therefore, ‘organisations require more than material
resources and technical information to survive and thrive in… (the environment). They
also need social acceptability and credibility’ with material and technical information
(Basel 2001, p.237).
To achieve societal justification and trustworthiness, institutional rules, norms, structure
and procedure function as powerful myths (Laux & Leuz 2009) that firms implement.
Laux and Leuz (2009) argued that ‘institutionalization involves the processes by which
social process, obligations, or actualities come to take on a rule-like status in social
thought and action’ (p. 341). In order to define institutional theory for the present
research, it is essential to define the meaning of ‘institution’ in the accounting literature.
5.4.1 Defining institution
31
New institutional theory is also termed as neo-institutional theory, new institutionalism and neo-
institutionalism.

99
The term ‘institution’ is used widely with different conceptualisations (Hollingsworth
2003). North (1990) proposes the commonly accepted definition of institutions as the
‘humanly devised constraints that shape human interaction’ (p.3) providing the ‘rules of
game in society’ (p.3)32
. According to Basel (2001, p.48), institutions are ‘social
structures that have achieved a high degree of resilience’. Basel (2001) describes
institutions as consisting of three elements; first, regulative which is comprised of laws
and regulation and the environment and coerces organisations to be legitimate; second,
normative includes norms and values that are developed in the institutional
environment; and third, cultural-cognitive elements shared by society and carried by
individuals. All of these factors together establish the rules of organisation.
Wysocki (2011) asserts that the actions of players (organisations) are governed by rules
(institutions). The rules are the combination of skill, strategy and coordination to win
the game, reduce uncertainty and determine the organisation’s success over time (North
1990). The definition includes political bodies (for example, political parties and
regulatory agencies), economic bodies (for example, firms, trade unions and
cooperatives), social bodies (for example, clubs and social associations) and educational
bodies (such as schools, universities and training centres), bound together to achieve
certain objectives. DiMaggio and Powell (1983) argued that organisations implement
structures that are legitimate, socially acceptable or imperative to achieve organisational
efficiency.
There are five basic elements that build the framework for ‘new institutional
accounting’ research that analyses the determinants and outcomes of accounting
institutions and non-accounting institutions (Wysocki 2011). These are, firstly,
institutional structure (formal versus informal). Informal institutions include values and
social norms whereas formal institutions are formed with laws and regulations (North
1990; Scott 2008). However, formal and informal institutions can be mutually
reinforcing because values and norms are often formalised into laws and regulations
while laws and regulations can provide validation of values and norms (Wysocki 2011).
Secondly, the level of analysis differentiates macro-institutions from micro-institutions.
32
Douglass C. North, the Alfred Nobel Memorial Prize winner in Economic Sciences (1994).

100
Thirdly, is causation that includes ‘exogenous’ and ‘endogenous’ institutions.
Exogenous institutions are the macro-level rules for both formal and informal
institutions, including the legal system, cultural norms and social patterns. Endogenous
institutions are micro-level rules for formal and informal institutions (Davis & North
1971). Fourthly, is interdependencies and fifth and finally, efficient versus inefficient
outcomes.
A multi-level institutional analysis is developed by Hollingsworth (2003) which can
assist in positioning of research. This analysis is reproduced in Table 5.1 The present
study is within the scope of the third level of Hollingsworth’s (2003) analysis, with
congruence with the other four. Therefore, institutions provide standards for the
organisation to reduce uncertainty and to operate in complex situations. Accounting is
an institutional mechanism to reduce transaction costs, information asymmetry, lower
coordination costs, improve enforcement of property rights and facilitate complex
transaction in an economy (North 1990; Watts & Zimmerman 1978; Wysocki 2011).
The use of accounting and auditing in collecting debt and in contract enforcement help
to facilitate economic development (North 1990; Watts & Zimmerman 1978). The next
section will define new institutional theory from a sociological view of institutions.
1 Institutions norms, rules, conventions, habits and values
2 Institutional
arrangements
markets, state, corporate hierarchies, networks,
associations, communities
3 Institutional sectors financial system, system of education, business system,
system of research, social system of production
4 Organisations
5 Output
and performance
statutes, administrative decisions, the nature, quantity
and quality of industrial products, sectoral and societal
performance
Source: Hollingsworth (2003, p.133)
7Table 5.1: Components of institutional analysis

101
5.4.2 New institutionalism - new institutional theory
‘New institutionalism’ developed in the mid-1980s and revived the concept of
institutions with proliferation of interest in economics, sociology, international relations
and political science (Scott 2008). Powell and DiMaggio (1991) mentioned old and new
institutionalism approaches in identifying different sources of constraint for
organisational rationality, shown in Table 5.2.
Old institutionalism New institutionalism
Conflicts of interest Central Peripheral
Sources of inertia Vested interests Legitimacy imperative
Structural emphasis Informal structure Symbolic role of formal
structure
Organisation embedded in Local community Field, sector, or society
Nature of embeddedness Co-operation Constitutive
Locus of institutionalisation Organisation Field or society
Organisational dynamics Change Persistence
Basis of critique of
utilitarianism
Theory of interest
aggregation
Theory of action
Evidence for critique of
utilitarianism Unanticipated consequences
Unreflective activity
Key forms of cognition Values, norms, attitudes Classifications, routines,
scripts, schema
Social psychology Socialisation theory Attribution theory
Cognitive basis of order Commitment Habit, practical action
Goals Displaced Ambiguous
Agenda Policy relevance Disciplinary
Source: Powell and DiMaggio (1991, p.13).
8Table 5.2: The new and old institutionalism

102
5.4.3 Significance of institutional isomorphism
Bischof, Brüggemann and Daske (2010, p.509) define isomorphism as the ‘adaption of
institutional practices by an organisation’. Hawley (1968) defined isomorphism as ‘a
constraining process that forces one unit in a population to resemble other units that
face the same set of environmental conditions’ (DiMaggio & Powell 1983, p.151). The
diversity of organisational forms in a population is isomorphic to environmental
diversity (DiMaggio & Powell 1983). Hannan and Freeman (1977) argued that
isomorphism could result as organisational decision-makers learn and respond
appropriately to adjust their behaviour. Institutional isomorphism is a relevant notion
for understanding the politics and factors that influence the modern organisation
(DiMaggio & Powell 1983).
Institutional isomorphism is concerned with legitimacies and strategies that are
acceptable and appropriate to society and creates organisations with similar conditions
(Laux & Leuz 2009). According to DiMaggio and Powell (1983, p.148), ‘once disparate
organisations in the same line of business are structured into an actual field……..
powerful forces emerge that lead them to become more similar to one another’.
Organisations within an industry tend to resemble each other structurally or become
‘isomorphic’ as a result of exposure to similar societal pressures being exerted by the
powerful stakeholder groups (DiMaggio & Powell 1983).
New institutionalism theorists (Meyer 1977, Fennell 1980, DiMaggio & Powell 1983)
discuss two forms of isomorphism: competitive and institutional. Competitive
isomorphism implements a system rationality that emphasises market competition,
change of function, measures the fitness of the organisation and exists in a free
competitive environment (DiMaggio & Powell 1983). In contrast, institutional
isomorphism influences organisations when they operate in a political power and
institutional legitimacy environment (Hawley 1968, Hassan 2008, DiMaggio & Powell
1983).

103
Bangladesh, among the developing countries, marked the beginning of an evolution
in its financial reporting through “ adopting” international standards after the GFC.
However, compliance remains effectively voluntary with little consequence for non-
compliance. The implementation of international standards is motivated largely
according to countries’ institutional settings, along with their economic, political and
social frameworks. Developing economies are often characterised by family dominance,
a high level of corruption and significant political interference and, therefore, are not
conducive to adoption of Western-styled governance models (Uddin & Choudhury
2008).
5.4.4 Isomorphism processes
DiMaggio and Powell (1983) identified three institutional isomorphic processes:
coercive, mimetic and normative. These three forms of institutional isomorphism are
powerful theoretical foundations within the accounting literature in investigating
organisational responses to changing institutional pressures and expectations (Lenckus
2001). For example, Carpenter and Feroz (2001) investigate the selection of government
accounting practices within the theoretical perspective of coercive isomorphism.
5.4.4.1 Coercive isomorphism
Coercive isomorphism is defined as ‘both formal and informal pressures exerted on
organisations by other organisations upon which they are dependent and by cultural
expectations in the society within which organisations function’ (DiMaggio & Powell
1983, p.150). In the accounting perspective, formal coercive isomorphism is exercised
through financial reporting and disclosure standards (Gordon, Loeb & Tseng 2009).
Institutional pressure creates formal coercive isomorphism through the ensuing rules,
regulations and legitimacy (Scott 2004). Such pressures derive from governmental
directives, existing laws, regulation and financial reporting requirements which have an
impact on organisational changes towards homogeneity within the given domain and

104
ritual to wider institutions (DiMaggio & Powell 1983). However, informal coercive
isomorphism forms through persuasion or invitation to join in collusion (DiMaggio &
Powell 1983). For example, finance providers can influence more transparent reporting
(Hassan 2009). DiMaggio and Powell (1983) also argued that the extent of coercive
isomorphism is associated with the extent to which one is dependent on others in terms
of individual and organisational level.
Laux and Leuz (2009) argued that societal and cultural expectations coerce
organisations to ensure legitimacy as they create a ‘social contract’ between the social
context and organisation. They also drive organisations to adopt socially acceptable
practices (Laux & Leuz 2009).
According to Tuttle and Dillard (2007, p.393), coercive isomorphic ‘change is imposed
by an external source such as a powerful constituent (e.g., customer, supplier,
competitor), government regulation, certification body, politically powerful referent
groups, or a powerful stakeholder’. Therefore, powerful stakeholders in adopting
organisational practices coerce other organisations. Lenckus (2001) argued coercive
isomorphism stems from the ‘power’ of stakeholders to exert pressure on organisations.
For example, stakeholder groups such as investors can coerce organisations to report
risk as companies are dependent on their finance resource.
Previous studies suggest that bank creditors (i.e. depositors) mandate disclosure
transparency (Barth, Caprio Jr & Levine 2004). Therefore, companies disclose a greater
level of risk disclosure to explain the causes of high level risks to creditors (Linsley &
Shrives 2006). The more the bank depends on debt financing, the more likely the
creditors’ power is exercised in risk reporting (Barth & Landsman 2010; Barth &
McNichols 1994; Cormier, Gordon & Magnan 2004). In a highly leveraged company,
creditors may demand more disclosure of information to understand the risk profile of
the business (Ahn & Lee 2004).

105
The theoretical perspective discussed within the coercive isomorphism concept
underlines that organisations are coerced by other more leading organisation as they are
dependent. This study hypothesises that depositors’ and investors’ coercive
isomorphism influences banks to provide more risk disclosure. Therefore, it is predicted
that more highly geared banks provide more risk disclosure than less geared banks.
H5: Coercive isomorphic pressures are positively associated with the extent of
risk disclosure.
5.4.4.2 Mimetic isomorphism
Industrial interdependencies can stem mimetic isomorphism (Powell & DiMaggio
1991). Organisations tend to model themselves on successful companies in the industry
to be perceived as more legitimate and successful (DiMaggio & Powell 1983). They
replicate as a mirror of other organisational practices those that are recognised ‘as
superior, as more successful’ (Gul & Leung 2004, p.45) and where ambiguity and
uncertainty arises, mimicking the organisational practices of a successful group is
recommended (Hassan 2009).
According to Tuttle and Dillard (2007, pp. 392-393), ‘change is voluntary and
associated with one entity copying the practices of another…….mimetic isomorphism
occurs when the processes motivated by these pressures become institutionalised so that
copying continues because of its institutional acceptance rather than its competitive
necessity’. That is, organisations imitate other organisations’ practices to improve
performance. Successful companies adopt disclosure practices to increase the
probability of survival. These adoption processes create social pressure to foster similar
organisational practices and policies among organisations, leading them to become
more isomorphic in order to comply with societal requirements (DiMaggio & Powell
1983; Scott 2008).
Gani and Jermias (2006, P.472) identified three distinctive modes of mimetic
isomorphism: ‘frequency imitation (copying very common practices), trait imitation
(copying practices of other organisations with certain features) and outcome imitation
(imitation based on a practice’s apparent impact on others)’. An organisation executes

106
frequency imitation by following practices used previously by a large number of other
organisations. Therefore it is merely a modal decision (Holder-Webb & Cohen 2007).
With trait imitation, certain traits are mimicked, such as large size. Outcome based
imitation follows the past good outcomes of other organisations and avoids bad
outcomes (Gani & Jermias 2006).
DiMaggio and Powell (1983) argued that mimetic isomorphism derives from
organisational uncertainty when the organisational technologies are understood poorly
or goals are ambiguous. Uncertainty causes mimicking behaviour and imitation of
successful organisations. Mimetic isomorphism may take place and be diffused
unintentionally, diffused indirectly through employee transfer or turnover, or diffused
explicitly through industry trade organisations (DiMaggio & Powell 1983). Thus, the
coercive isomorphism concept underlines the notion that organisations may model
themselves on others by adopting disclosure practices and in turn influence others in the
industry.
Previous studies have applied the theoretical concept of mimetic isomorphism in
examining, for instance, how corporate social responsibility is influenced by disclosure
practices adopted by other organisations (Bushman et al. 2004). Moreover, existing
studies have found that large rather than small banks characterise themselves by
disclosing more risk information which results in reduced monitoring costs and reduced
information asymmetry (Abraham & Cox 2007; Aebi, Sabato & Schmid 2012; Oliveira,
Rodrigues & Craig 2011). In addition, a higher extent of disclosure assists superior
companies to be more evident to relevant shareholders (Mashayekhi & Bazaz 2008).
Larger banks compared to smaller banks consider a higher level of risk disclosure to
imply closer scrutiny from stakeholders and thus enhancing of corporate reputation
(Amran, Bin & Mohd 2008; Oliveira, Rodrigues & Craig 2011). The discussion leads to
the hypothesis that mimetic isomorphism of larger banks has an influence on the degree
of risk reporting by smaller banks. However, as the influence of larger banks on smaller
banks is not testable empirically in a robust way, qualitative data is analysed to provide
evidence in support or refutation.

107
H6: Mimetic isomorphism of larger banks influences smaller banks to provide
more risk disclosure.
5.4.4.3 Normative isomorphism
DiMaggio and Powell (1983, p.152) defined normative isomorphism as ‘a third source
of isomorphic change …and stems primarily from professionalisation, which is defined
as the collective struggle of members of an occupation to define the condition and
methods of their work’. Experienced managers execute their specialised knowledge,
education and practical professional networks in the organisation.
Normative pressure is exerted through professionalisation by abiding common
standards, common educational background and professional socialisation. Normative
isomorphism forces professional influences on firm performance, resulting from
professional training and education. These employ social practices, such as financial
reporting disclosure among organisations in the industry (Hassan 2009).
DiMaggio and Powell (1983, p.152) identified two aspects of professionalisation as a
source of isomorphism, ‘One is the resting of formal education and of legitimation in a
cognitive base produced by university specialists; the second is the growth and
elaboration of professional networks that span organizations and across which new
models diffuse rapidly’. University education and professional training organisations
develop norms among professional managers. They create norms and values in the
organisation that cannot be viewed objectively but are assumed to be true by
stakeholders (Farooque et al. 2007). For example, professional education and training
programmes influence the level of education of the members who eventually are
employed in the organisation.
Professional and trade associations are another means of diffusion of normative rules
about professional behaviour and override variation in tradition and control that in turn
outline organisational behavioural change (Bank 2012b). These mechanisms ‘create a
pool of almost interchangeable individuals who occupy similar positions across a range
of organisations’ (DiMaggio & Powell 1983, p.152). Therefore, organisations might

108
change to follow professional norms and organisational practices in relation to
disclosure practices.
Applying normative isomorphism, Cerbioni and Parbonetti (2007) found that chief
executive officers who attended elite business schools were likely to adopt an approach
to organising a business known as the multi-dimensional form of institution. In the
context of the theoretical aspects of normative isomorphism, the present study
hypothesises that if a bank has a dedicated Risk Management Unit, normative
isomorphic power is expected to be exercised. That is, stronger risk communication is
expected in annual reports of these banks compared to banks that do not have a Risk
Management Unit. The Risk Management Unit is charged uniquely with risk
management and monitoring processes and practices that inform risk information
provided to the banks’ section responsible for compiling the disclousre in the annual
report. The Hypothesis is:
H7: Normative isomorphism is positively associated with the extent of risk
disclosure.
5.5 The relation between risk disclosure and bank performance
As discussed in Chapter 1, the third Phase of this study investigates whether risk
disclosure has an association with bank performance. Effective governance mechanisms
are an attempt to facilitate stakeholders and managers, which reduce agency costs and in
turn improve organisations’ performance. As ‘conflict of interest’ is inherent in
shareholder-manager relationships, disclosure of information can help shareholder-
manager interests and therefore, improve firm performance (Bhagat & Bolton 2008;
Jensen & Meckling 1976; Weir, Laing & McKnight 2002). Healy and Palepu (2001)
argue that disclosure communicates firms’ governance and performance to users of
financial reports. Correspondingly, voluntary disclosure of risk governance practices
makes users of financial statements aware of banking stability and risk resilience by
allowing assessment of the bank’s risk profile. Beverly (2007) argues that greater
disclosure is associated with lower risk, and in turn improves the risk-return trade-off.

109
Previous studies argue and find evidence that voluntary disclosure is an essential
mechanism that enhances the organisation’s performance (Healy & Palepu 2001; Miller
& Noulas 1996). Several cross-country studies suggest that voluntary disclosure
increases bank monitoring that reduces sovereign risk (Bertus, John & Yost 2007;
Demirgüç-Kunt, Detragiache & Tressel 2008), assists greater banking development,
lower interest rate and smaller non-performing loans (Barth, Caprio & Levine 2004).
Fernández and González (2005) provide further evidence indicating that the efficiency
of accounting and auditing devices balances the capital requirements and additional
monitoring on banking undertakings.
In this study, bank performance is measured using two broad aspects; bank operating
performance and bank valuation. Bank operating performance is measured as employee
efficiency, solvency efficiency, deposit concentration, financial performance, and bank
valuation is measured using Tobin’s q and the book to market ratio.
5.5.1 Employee efficiency
Extant studies (Katz 1998; McElroy 2001) argued that organisational information has a
consistent positive impact on organisational performance. Organisational information
connects employees, aligns their goals with those of the organisation and thus creates
integration in the work place (McElroy 2001). Additionally, it increases employee
identification, commitment to work and creates long-term organisational success (Katz
1998). Risk disclosure of information by banks is particularly important as employees
become aware of banks’ risk exposure, and hence better able to assess banks’ risk-
taking profile. The Hypothesis in this study is:
H8: Employee efficiency is positively associated with the extent of risk
disclosure.
5.5.2 Solvency efficiency
Disclosure of risk information is expected to result in higher solvency efficiency as it
allows stakeholders to assess risk and favourable managerial actions. Extant studies

110
argue that financial disclosure is a primary tool for market discipline and market
discipline has a positive association with bank solvency efficiency (Botosan 2004;
Verrecchia 2001). Richardson and Welker (2001) argue that market efficiency depends
on comprehensive and value-relevant, transparent disclosure. They argue that disclosure
benefits firms through lower cost of capital because of two aspects; first, disclosure
reduces transaction costs. Greater disclosure assists potential investors to overcome
hostile choice of bid-ask spread33
and reduces the cost of capital (Botosan 1997). More
disclosure reduces adverse price impacts associated with large trades and reduces
information asymmetry to investors, which leads to higher demand for securities in the
market, reduces transaction costs and improves solvency, in turn reducing the cost of
equity capital (Amihud 1986; Botosan 1997; Verrecchia 2001). Second, increased
disclosure reduces uncertainty or estimation risks (Clarkson, Guedes & Thompson
1996). Botosan (1997) argued that extant research suggests that greater disclosure
decrease the cost of equity capital. Extant studies (Demirgüç-Kunt, Detragiache &
Tressel 2008; Goddard, Molyneux & Wilson 2009) argue that well funded banks face
inferior insolvency costs and therefore lower subsidy costs. The next Hypothesis is:
H9: Solvency efficiency is positively associated with the extent of risk disclosure.
33
Bid-ask spread is the amount by which the ask price exceeds the bid. This is essentially the difference
in price between the highest price that a buyer is willing to pay for an asset and the lowest price for which
a seller is willing to sell it (see online at http://www.investopedia.com/terms/b/bid-askspread.asp)

111
5.5.3 Deposit concentration
Stakeholders are concerned with bank strategies and respond accordingly to risk
exposure (Nier & Baumann 2006). The banking industry is characterised by high asset
investments. Frolov (2004) argued that;
….asset opacity is in the nature of the banking business, and it amplifies the banks’
incentive to moral hazard and creates conditions for their profiting at the expense of
uninformed creditors. But better bank disclosure can curtail the moral hazard both ex
ante and ex post. With the ex-ante effect, the funding cost of risky institutions gets
higher as potential depositors and other creditors appreciate the banks’ (disclosed)
financial condition. When ex post, the banks’ risk-taking is disciplined by costs inflicted
by en mass withdrawals of deposits from the risky institutions or just a threat of a run on
them (p.9).
The above argument is supported by Beverly (2007). He explained the ex-ante effect of
risk disclosure is such that the cost of capital for risky institutions becomes higher than
for less risky institutions. However, banks are inherently risky ventures and less risk
disclosure may generate ambiguity for potential stakeholders. Deposit concentration
should therefore be higher with banks that provide high levels of risk disclosure since
disclosure reduces uncertainty for depositors. Therefore, the next Hypothesis is;
H10: Deposit concentration is positively associated with the extent of risk
disclosure.
5.5.4 Financial performance
Extant studies have found that financial disclosure has a positive impact on bank
performance. For example, Verrecchia (2001) examined extant literature on disclosure
and found greater disclosure practices benefit the firm by high market liquidity.
Botosan (1997) argued increased financial disclosure benefits manufacturing firms
(industrial and commercial machinery) by decreasing the cost of capital. Callahan and
Smith (2004) found that financial disclosure is positively associated with current and
future performance in the banking industry. While these studies do not focus on risk
disclosure, especially not on risk disclosure in a banking institution setting, this study

112
expects to find an association between the extent of risk disclosure and financial
performance. Therefore, the next Hypothesis is;
H11: Financial performance is positively associated with the extent of risk
disclosure.
5.5.5 Risk disclosure and bank valuation
As discussed in the previous section, extant research has found a positive association
between financial disclosure and operating performance. Botosan (1997) suggests that
financial disclosure has the potential to change bank valuations by reducing the cost of
capital. Nier and Baumann (2006) examined banks from 32 countries (729 individual
banks) around the world and found higher disclosure results in lower bank stock price
volatility. Foerster, Sapp and Shi (2013) found that disclosure of earnings by
management by Canadian firms is positively associated with firm value in two aspects;
reduced firm risk and change in investors’ perceptions about future cash flows. Healy
and Palepu (2001) argued financial disclosure increases bank transparency, reduces
uncertainty and help investors’ correct firm valuations. The logical extension to these
arguments is that rational market participants would appreciate greater disclosure.
Therefore, the next hypothesis is;
H12: Bank value is positively associated with the extent of risk disclosure.
5.6 Conceptual framework
The underpinning theories discussed in this Chapter (sections 5.3 and 5.4) depict the
conceptual framework for this study as shown in Figure 5.3. The Figure depicts that
agency theory and institutional isomorphism assist in explaining the motivation of
managers to provide corporate risk disclosure.

113
A larger proportion of independent directors on the board is positively associated with a
higher level of disclosure and therefore, is effective as a monitoring process (Beretta &
Bozzolan 2004; Cheng & Courtenay 2006; Lajili 2009; Lopes & Rodrigues 2007).
These directors have incentives to demand greater risk disclosure to balance the level of
risk in the business and thereby attain or retain their personal reputation (Amran, Bin &
Mohd 2008; Beasley, Clune & Hermanson 2005; Oliveira, Rodrigues & Craig 2011). In
addition, audit committees review the risk management, internal control and compliance
processes of business. Independent directors on the audit committee increase the
effectiveness and reliability of the audit committee (Turley & Zaman 2004). Therefore,
banks with a higher ratio of independent directors on the audit committee can be
17 Figure 5.3: Conceptual framework for this study
Coercive
isomorphism
Normative
isomorphism
Mimetic
isomorphism
Bank value
Extent of
risk
disclosure
Agency
Theory
Institutional
Isomorphism
Board
Independence
Audit Committee
Independence
Risk Committees
H2
H3
H4
H5
H6
H7
H12
H1
Employee
efficiency
Solvency
efficiency
Financial
Performance
Deposit
concentration
H9
H8
H10
H11
Bank
Performance
114
expected to place greater attention on reporting risk disclosure than those with a lower
proportion (Oliveira, Rodrigues & Craig 2011).
Figure 5.3 also infers that risk committees assist by measuring, monitoring and
maintaining an acceptable level of risk. Dedicated risk committees monitor risk
exposure, policies and procedures affecting loans, non-performing loans, market, and
operational areas efficiently within risk strategy and risk appetite established by the
board of directors. Under the institutional isomorphism concept, this study hypotheses
that coercive and institutional isomorphism processes influence bank’s risk reporting.
This research will further examine the association of risk disclosure with bank
performance (financial performance, employee productivity, solvency efficiency, and
depositors’ concentration and bank valuation).
5.7 Chapter conclusion
This Chapter discusses the underpinning theories for this study in relation to achieving
its objectives. The discussion of agency theory and institutional isomorphism suggests
risk disclosure motivations. The underlying theoretical foundation within this Chapter
suggests that banks can be seen to provide corporate risk disclosure for accountability to
wider stakeholder groups. Having discussed the relevant theoretical perspectives, a
conceptual framework is developed. The specific application of these theories is
investigated in Part Four (Analysis) of this thesis. Prior to that, the next Chapter
describes the research method employed to conduct the three Phases of this study.

115

116
PART THREE
METHODOLOGY
Chapter 6: Research Methodology

117
Part Three of this thesis illustrates the methods and methodology used in this research.
Chapter 6 presents a detailed discussion of the methodological approach adopted in this
research. This study is designed using a mixed method approach, employing both
qualitative and quantitative data collection and analysis. Secondary data is used for the
quantitative analysis while interviews are conducted using a semi-structured protocol
for the qualitative analysis. It is argued in this thesis that detailed investigation using
both the qualitative and quantitative methods applied enhances understanding of the
research problem surrounding risk reporting behaviour in the banking industry and
results of testing in a way superior to either approach alone.

118
CHAPTER 6: Research Methodology
6.1 Introduction
The previous Chapters discussed the literature, research questions, the theoretical
framework and the Hypotheses for this study. Research design is a significant part of
any research project as the quality of the research depends on the adoption of
appropriate methodologies, collection of data with integrity and the research paradigm.
The purpose of this Chapter is to describe the research design and methodological
assumptions adopted in this study.
This Chapter provides a detailed discussion of the quantitative and qualitative methods
adopted, including of the research instrument, sampling design, data collection and
analysis process procedures. The ethical issues surrounding confidentiality of
qualitative interview data considerations is discussed at the end of this Chapter. Figure
6.1 provides an overview of this Chapter.
The remainder of this Chapter proceeds as follows. The ontological and
epistemological assumptions are discussed in section 6.2. Following this discussion of
the philosophical assumptions, a discussion of descriptive, exploratory and explanatory
types of research appears in section 6.3. A rationale for the theoretical perspective
18 Figure 6.1 Roadmap of Chapter
Introduction (6.1) Philosophical
assumptions (6.2)
Research type
(6.3)
Theoretical
perspective (6.4)
Methodology (6.5)
Chapter conclusion
(6.9) Ethical clearance
(6.8)
The qualitative
method (6.7)
The quantitative
method (6.6)

119
adopted is discussed in section 6.4. Followed by research methodology, the
triangulation process and research paradigm in sections 6.5, 6.6 and 6.7 establish the
quantitative and qualitative methods adopted, including justification for the population
identification, the sampling approach, the research instrument, and the analysis
framework employed. Ethical issues of confidentiality surrounding the interview data
are discussed in section 6.8 and the Chapter concludes in section 6.9.
6.2 Philosophical assumption
A philosophical assumption is associated with every research approach. The research
paradigm provides the foundation of the research methodology and methods used in the
study. Veal (2005) argued a research paradigm as a shared framework of assumptions
that reflect a basic set of philosophical beliefs about the nature of the world and
provides guidelines and principles concerning the way of research. Different research
paradigms are used in the literature. The most commonly used research paradigmatic
dichotomies are described in Appendix 6.1. The selection of the research paradigm
depends on ontological assumptions (the basic belief) and epistemological assumptions
(valid knowledge).
A research paradigm is a linking of ‘ontology’, ‘epistemology’ and ‘methodology’.
(Tashakkori & Teddlie 2010). The research strategy is guided by understanding and the
nature of reality (ontology) and the knowledge achieved within the paradigm
(epistemology) (Newholm & Shaw 2007). Ryan, Scapens and Theobald (2002)
explained;
…the assumptions that the researcher holds regarding the nature of the phenomenon’s
reality (ontology), will affect the way in which knowledge can be gained about the
phenomenon (epistemology), and this in turn affects the process through which research
can be conducted (methodology). Consequently, the selection of an appropriate research
methodology cannot be done in isolation of a consideration of the ontological and
epistemological assumptions, which underpin the research in question (p.35).

120
The following sections discuss ontological, epistemological and methodological
assumptions and the relevance of these to this study.
6.2.1 Ontological assumption
An ontological assumption is the belief about the way ‘reality’ is perceived. Morgan
and Smircich (1980) provided a continuum of basic ontological assumptions. Figure 6.2
shows the scale;
Source: Adapted from Morgan and Smircich (1980), p. 492.
The ‘Continuum of Ontological Assumptions’ is explained by Ryan, Scapens and
Theobald (2002). They illustrate ‘reality’ as characterised by external objective ‘facts’
about the world defining a set of variables and laws. In addition, evaluation and human
beings’ activities (e.g. continuous process, learning and adoption of new environments)
increase social interaction, norms and behaviour. The role of accounting also provides
norms and structure for day-to-day behaviour and practices within organisations and
society. As a result, concrete reality moves to an open system for individuals and
society. Individuals and society make sense of accounting information and explore the
depth of information. Thus, the social world is recreated and confronted with the
complexity of societal reaction to information.
The ontological assumptions in this research are between the two extremes of this
continuum. Consistent with the aim of this research, this study analyses ‘objectively’
the annual reports of banking institutions in Bangladesh. Additionally, using in-depth
interviews, this study analyses the perceptions of managers and regulators within the
banking industry ‘subjectively’ to better understand the issues associated with risk
19 Figure 6.2: Continuum of ontological assumptions
Objectivist Subjectivist
Reality as a
concrete
structure
Reality as a
concrete
process
Reality is a
contextual
field of
information
Reality as a
realism of
symbolic
disclosure
Reality as a
social
construction
Reality as a
projection of
human
imagination

121
reporting and provide evidence-based solutions. Therefore pragmatic post-constructivist
ontology is used to understand the real practices of risk reporting, the underlying factors
of risk reporting and the effect of risk reporting on bank performance.
6.2.2 Epistemological assumption
‘Epistemology’ is the way knowledge is to be acquired in connection with truth, belief
and justification. Ryan, Scapens and Theobald (2002, p.11) explain that ‘knowledge
creates three substantive issues: the nature of belief, the basis of truth and the problem
of justification’. This section discusses epistemological perspectives including
‘constructivism’ and ‘objectivism’ in the context of this research. Crotty (1998)
explained a constructivism epistemological position as:
...all knowledge, and therefore all meaningful reality as such, is contingent upon human
practices, being constructed in and out of interaction between human beings and their
world, and developed and transmitted within an essentially social context (p.42).
Therefore, human attitudes, beliefs and values construct perceptions of the event
(Tashakkori & Teddlie 2010). Constructivism is relevant in this research as the ‘Risk
Disclosure Index’ (RDI) developed in this research can change according to the
attitudes and behaviour of key stakeholders. As a result, constructivism proves to be a
valuable research framework for this study.
Objectivism epistemology deals with ‘things exist as meaningful entities independently
of conciseness and experience that have truth and meaning residing in them as objects
and that careful research can attain that objective truth and meaning’ (Crotty 1998, pp.5-
6). As mentioned earlier, the Risk Disclosure Index developed in this research is based
on international standards (IFRS 7 Financial Instruments: Disclosures and BASEL II:
Market Discipline) and is used to examine the risk reporting practices of banking
institutions. Additionally, the theoretical framework adopted and the Hypotheses
developed in this study aim to achieve the research objectives. Therefore, both
constructivism and objectivism constitute the epistemological perspectives of this study.

122
6.3 Research type
The philosophical assumption adopted for research directs choosing appropriate
methods for its conduct. The philosophical stance establishes the ontological and
epistemological assumptions for this study. According to Collis and Hussey (2003) the
choice of research paradigm has implications for selecting the research methodology
(research approaches) and methods (e.g. data collection technique). Research can be
seen from three different perspectives, being application, objective and mode of inquiry
(Kumar 2011). The research types are discussed as ‘Exploratory’, ‘Descriptive’,
‘Analytical’ or ‘Explanatory’ and ‘Predictive’ (Collis & Hussey 2003); ‘Exploratory’
and ‘Evaluative’ (Veal 2005). The definitions for these different research types can be
found in Appendix 6.2. The rationale for selecting the research type is based on the
research aim(s) and purpose (Veal 2005).
To attain the research objectives, this study is in part descriptive, observing and
informing the reader of the level of risk reporting practices in annual reports issued by
banks. Additionally, to seek further explanation and exploration of antecedent factors of
risk reporting, this study includes interviews with managers and regulators within the
banking industry and analysis of the determinants of risk reporting and. That is, this
study employs a mix of descriptive, analytical/explanatory and exploratory types of
applied research, using both qualitative and quantitative data.
6.4 Theoretical perspective
The theoretical perspective relates to the underlying philosophical assumptions behind
the researcher’s view of the human world and the social life within that world (Crotty
1998). The two broad theoretical perspectives of research are positivism and
interpretivism. Reflecting objectivism epistemology, positivism discovers scientific
laws to explain causes and consequences of the phenomena being investigated.
However, based on constructivism epistemology, interpretivism suggests understanding
inherent differences as people interpret the social world in various ways (Marsh et al.
2009).

123
The philosophical assumption adopted by this researcher has served to encourage
employing a mixed method of research. The theoretical perspectives adopted in this
study require objectively viewing the positivism paradigm using a quantitative approach
and assessing subjectively the interpretivism paradigm using a qualitative approach.
Mixed method research works with both narrative and numeric data for their analysis
and when data are of mixed natures, a more accurate picture emerges (Teddlie &
Tashakkori 2009). However, mixed method research is less well known than
quantitative or qualitative research (Creswell 2003; Teddlie & Tashakkori 2009).
6.5 Methodology
This section presents the overall approaches used in this research. As mentioned above
this study employs a mixed method strategy to validate the research objectives (Crotty
1998). According to Bryman and Bell (2007), the quantitative and qualitative
approaches comprising the mixed method should be explained separately.
6.5.1 Quantitative research approach
Quantitative research is dominant in social, psychological, behavioural sciences and
business (Veal 2005). Quantitative research involves collection of numerical data and
exhibits the relationship between theory and research in a deductive and positivist
approach (Bryman 2012; Collis & Hussey 2003; Veal 2005). The advantage of
quantitative research is that findings can be generalised beyond the confines of a
particular context in which the research was conducted. However, quantitative research
is criticised as the approach fails to understand people and social institutions from ‘the
world of nature’ (Bryman 2012, p.178). Common methods applied to collect
quantitative data are surveys, observations, experimental studies, and secondary data
(Veal 2005).

124
6.5.2 Qualitative research approach
Qualitative research is defined as naturalistic, ethnographic, anthropological and social
observer, emphasising the natural settings of variables using interpretivist and
constructivist paradigms. Bryman (2012) explains qualitative research as an inductive
approach with a ‘view of the relationship between theory and research’ using
‘interpretivist’ (epistemological) and ‘constructionist’ (ontological) stances. Qualitative
research enables researchers to reach an in-depth understanding of the phenomena.
However, the criticism of this type of research is that it is ‘too impressionistic and
subjective’ (Bryman 2012, p.405). Qualitative data can be obtained from interviews,
case studies, narrative inquiry or participant observation (Patton 2002; Veal 2005).
6.5.3 Mixed method approach
A mixed method research combines quantitative and qualitative research within a single
project (Bryman 2012; Tashakkori & Creswell 2007; Veal 2005). More specifically,
mixed method has been defined by Tashakkori and Creswell (2007) as;
..research in which the investigator collects and analyses data, integrates the findings,
and draws inferences both qualitative and quantitative approaches in a single study or
program of inquiry (p.4).
This approach is relatively new and has been used increasingly in social research since
the early 1980s. Mixed method research involves collecting both quantitative and
qualitative data either simultaneously or sequentially to best understand the research
problems (Creswell & Clarke 2011; Tashakkori & Creswell 2007). A mixed method
approach enhances understanding of the research problem in-depth and confirms the
findings from different sources of data (Creswell & Clarke 2011). Hence, a mixed
method approach provides a detailed view of individual phenomena; the researcher can
capture an in-depth picture of the context using secondary quantitative data and follow
up the meaning of insights to the phenomena using semi-structured interviews
(qualitative data).

125
6.5.4 Paradigm adopted in this study
The choice of research methodology depends on the purpose of a particular type of
research (Veal 2005). Recognising the limitations of both qualitative and quantitative
methods, researchers felt that the inherent bias of any single method could neutralise or
cancel the bias of other methods (Creswell & Clarke 2011). Additionally, the findings
using multiple research methods provide broader insights into the research problem
(Veal 2005). The qualitative and quantitative approaches address a range of
confirmatory and exploratory questions using better inferences and greater assortment
of divergent views (Tashakkori & Teddlie 2010; Teddlie & Tashakkori 2009). Hence,
the researcher prefers choosing suitable tools for data collection and analysis involving
both qualitative and quantitative methodologies rather than restricting to one
methodology. Therefore, this study employs mixed method strategies to achieve the
research objectives. The paradigmatic concerns and the research approaches are
summarised in Table 6.1.
As this research investigates the current level of risk disclosure practices in Bangladesh,
this study employs secondary data for its quantitative approach. Secondary data for this
research is easily accessible and uniformity of data can be achieved. Additionally, the
qualitative approach in this research is conducted using semi-structured interviews to
gain insights to factors underlying risk disclosure. Thus, interviews conducted with the
banking regulatory experts and senior managers in the risk reporting sections of banks
9 Table 6.1 Paradigmatic concerns and research approaches
Paradigmatic concerns Approach adopted
Ontological Perspective Post-constructivist
Epistemology Both constructivism and objectivism
Theoretical Perspective Positivism and interpretivism
Methodology Quantitative and qualitative
Method Content analysis and in-depth interviews

126
potentially provide a deep understanding of risk disclosure practices in the banking
sector in Bangladesh. Therefore, a mixed method method is appropriate to answer the
research questions and it is suitable for investigating risk disclosure antecedents and
their effects.
6.5.5 Designing triangulation in mixed method research
The best-known and commonly used approach in mixed method research is
triangulation (Creswell & Clarke 2011). It has been said that: ‘triangulation is worthy in
mixed method as congruent results from more than one method afford greater
confidence in the inferences to be made’ (Tashakkori & Teddlie 2010, p.125). Thus
triangulation involves more than one research approach in a single study to reach a
complete understanding of the research problem and enhance confidence in the ensuing
findings (Bryman 2012; Veal 2005). Hence, the associated limitations of one method
can be complemented by the prospects of another method.
Designing research for a mixed method approach triangulation is a challenging process
in identifying approaches to use in determining objectives of the study and in finding
the proper reasoning for the mixed method study. Creswell and Clarke (2011) defined
six types of design in the mixed method approach. Appendix 6.3 summarises the
prototypical characteristics of mixed method designs including convergent, explanatory,
exploratory, embedded, transformative, multiphase, concurrent, sequential and
transformative designs.
To achieve the research objectives of this study the qualitative and quantitative data
were collected concurrently and the results are converged by comparing and validating,
confirming or corroborating quantitative with qualitative findings (Bryman 2012;
Creswell & Clarke 2011; Tashakkori & Teddlie 2010). Therefore, the convergence
model of triangulation was used to collect and analyse quantitative and qualitative data
in this research. The next section presents the convergence model developed for this
study.

127
6.5.6 The convergence model of triangulation
The convergence model is most common, well validated and provides substantiated
findings in mixed method approaches (Creswell & Clarke 2011). Additionally, Creswell
& Clarke (2011) mentioned that the advantage of using a convergence model is that
separating quantitative and qualitative data concurrently offsets the inherent weakness
in one method with the strength of the other method. Thus, the weakness in generalising
from the qualitative interviews is complemented by the strength of accessible, accurate
quantitative data (secondary data). Further, it is important to note that a rich and
dynamic understanding of the insights are gained from additional findings from
interviews, which offset the weaknesses of analysing quantitative data. Figure 6.3
presents the convergence triangulation design used in this study
Source: Creswell and Clarke (2011).
Figure 6.3 shows how both the qualitative and quantitative data were collected
concurrently and then compared and contrasted to determine the convergence,
difference or combination (Creswell & Clarke 2011). As mentioned earlier, quantitative
data were collected from published annual reports of banks (secondary sources); and
interviews were conducted with senior managers (from banks’ Risk Reporting Units)
from listed banks and regulatory experts from the Central Bank and Bangladesh
Securities and Exchange Commission. The data from these two approaches were
collected concurrently and the results are compared, contrasted or combined to explore
the research questions in more detail.
20 Figure 6.3: The convergence model used in this study
Qualitative
data Analysis
Quantitative
data
collection
Quantitative
data Analysis
Qualitative
data
collection
Results
compared
and
contrasted
Interpretation
Quantitative +
Qualitative

128
The convergence model is appropriate in this study as secondary data were collected
and interviews were conducted in parallel to understand the extent of risk disclosure
practices, the factors underlying risk reporting and the association of risk reporting with
bank performance. The insights arising from the combination of methods are usually
found in an interpretation or discussion section (Creswell & Clarke 2011).
A summary of the research methodology design, data collection and analysis
procedures using the convergence model are presented in Figure 6.4.
21 Figure 6.4: Summary of the research design
Research Problem (ONTOLOGY)
Research
Objectives
Research Question
Theory
Research Approach
Q
ua
lit
ati
ve
Q
ua
nt
ita
tiv
e
Content Analysis
using secondary
data
Quantitative
Positivism
Narrative
Analysis using in
depth interviews
Qualitative
Interpretivism
Constructivism Objectivism
Literature
Review
Epistemology
Theoretical
Perspective Methodology
Method/Research
technique
Analytic Method
Results
Inductive
approach using
thematic analysis
Deductive
approach using
statistical
analysis
Both qualitative and quantitative data integration, analysis and discussion of the overall Results
Research
hypothesis

129
6.6 The quantitative method
As mentioned earlier, this study involves use of a mixed methods research design. This
section describes the quantitative techniques and procedures used to collect data and test
the Hypotheses in detail.
The unit of analysis involved in the quantitative method in this study is individual listed
banks in Bangladesh. The annual reports of these banks were sought, collected and
analysed to measure their risk reporting practices. Annual reports are the most
appropriate communication source between stakeholders and companies (Abraham &
Cox 2007). In other words, the annual report makes publicly available risk information
about the company and ‘enables the reader to obtain a coherent risk picture without
difficulty’ (Linsley & Shrives 2005a, p.211). Therefore, this study investigates annual
reports as the best source of risk information. In order to capture this information
systematically a ‘Risk Disclosure Index’ (RDI) checklist is developed as one of the
major contributions of this study. This checklist includes qualitative and quantitative
information. This section outlines the sample selection, research instrument, and model
specification for analysis using multiple regression.
6.6.1 Research instrument
In determining the extent of risk disclosure in listed banks, this study uses a content
analysis approach; a technique used by observing and analysing documents; such as
annual reports. The content analysis approach was chosen as this study focuses on the
extent and nature of risk disclosure in banks’ annual reports. As explained, this
approach is conducted in this research by creating a Risk Disclosure Index checklist.
6.6.1.1 Content analysis approach
The narratives in annual reports are examined using ‘subjective’ and ‘semi-objective’
analysis; a subjective approach is based on perception of the users and the semi-
objective approach is used commonly in disclosure studies (Beattie, McInnes &
Fearnley 2004). The semi-objective approach is used through content analysis (e.g.

130
disclosure index studies) and textual analysis (e.g. thematic content analysis, readability
studies or linguistic analysis) (Linsley & Lawrence 2007; Linsley, Shrives & Crumpton
2006). Figure 6.5 shows the narratives in annual reports.
Source: Adapted from Beattie, McInnes and Fearnley (2004), p.32.
Figure 6.5 illustrates the types of disclosure index studies specifying the items with
code in binary, ordinal, weighted unweighted or nested / un-nested form. Thematic
content analysis focuses on the topic or the theme disclosed in annual reports.
Readability studies provides a discussion of cognitive understanging of text and
linguistic analysis is study of the words used in the text. This study implements a
content analysis approach using a disclosure index checklist to capture banks’ risk
management disclosure.
22 Figure 6.5: Narratives in annual reports
Narratives in annual reports
Subjective-
usually analysts’
ratings
Characteristics of indices
Linguistic
analysis
Thematic content
analysis- a holistic
form of content
analysis where the
whole text is
analysed
Disclosure Index studies- A
partial form of content
analysis where the items to be
studied are specified ex ante
Textual analyses
Binary/
Ordinal
measure-
ment of
item
Weighted/
unweighted
Index
Readability
studies
Semi-objective
Nested/un nested
items (i.e.
grouping of items
into hierarchical
categories

131
Content analysis is a commonly used method in most of the previous disclosure
literature (e.g. Abraham & Cox 2007; Amran, Bin & Mohd 2008; Kajuter & Winkler,
2003; Linsley & Shrives 2006). Veal (2005) states that,
Content analysis involves detailed analysis of the content of a certain body of literature,
or other documentary sources which are viewed as texts ….. (and) examples are
company reports, the speeches of CEO and policy statements (p.84).
The limitations of content analysis are twofold (Beattie, McInnes & Fearnley 2004).
First, content analysis studies can be one dimensional, classifying only the presence or
absence of a feature. Second, they tend to be partial as they do not analyse the entire
content of an annual report. Moreover, content analysis is subjective. To overcome the
limitations of content analysis, this study uses a Risk Disclosure Index to screen for the
presence of risk disclosure items. Additionally, the Risk Disclosure Index was
developed in this study using a systematic approach to minimise subjectivity in the
analysis of narratives about risk included in annual reports. This systematic risk
disclosure framework is developed based on international standards and previous
literature.
6.6.1.2 Risk Disclosure Index
The Risk Disclosure Index used in this research is constructed based on a thorough and
rigorous study of International Financial Reporting Standards (IFRS) including IFRS 7:
Financial Instruments: Disclosures, the Basel recommendation of Pillar 3 for Market
Discipline and the risk disclosure literature. This index was applied to annual reports of
the sample banking institutions published over a 7-year period from 2006-2012.
Previous studies (Abraham & Cox 2007; Hassan 2009; Hernandez-Madrigal, Blanco-
Dopico & Aibar-Guzman 2012; Lajili 2009; Lajili & Zéghal 2005; Linsley & Shrives
2006; Nier & Baumann 2006; Uddin & Hassan 2011) use a risk disclosure index for
their content analysis. All these previous studies used an index based on subjectively
assembling the data from sample companies’ disclosures rather than an independent
source.

132
The inclusive Risk Disclosure Index in this study is based on international standards
(IFRS 7: Financial Instruments: Disclosures and Basel II: Market Discipline) and is
developed following two Phases. In the first Phase, an extensive review of prior studies
(e.g. Abraham and Cox 2007; Beretta and Bozzolan 2004; Cabedo and Miguel Tirado
2004; Lajili and Zéghal 2005; Linsley and Shrives 2006; Uddin and Hassan 2011)
provided the common items across the studies and identified the items for an initial
benchmark Risk Disclosure Index (49 items). These items were then categorised under
regulatory requirements (IFRS 7, Basel II: Market discipline). In the second Phase,
items (140 items including 42 common items, which were previously identified in
literature) from the regulatory framework requirements were included within the
benchmark Risk Disclosure Index. Thus, 14734
items in total constituted the Risk
Disclosure Index for this thesis. The Risk Disclosure Index includes seven key
categories; namely i) Risk types (Market, Credit, Solvency, Operational, and Equities);
ii) Capital disclosure; iii) Internal corporate governance ; iv) Information and
communication risks; v) Strategic decision risks; vi) General risk information; and vii)
Government regulation.
The Risk Disclosure Index consists of both qualitative and quantitative information.
Equal scores are allocated for each item; with ‘1’ point being assigned for disclosure
and ‘0’ for non-disclosure. The points are added to get a absolute score for each year.
The maximum score can differ for each bank according to its disclosures in the annual
report. The formula is;
Risk Disclosure Index by = MAXby
1
n
i
SCORE1
iby
Where: Risk Disclosure Index by = the risk disclosure score for bank (b) in the
year (y)
MAXby = The maximum possible score
i = Each item in the risk disclosure index
SCORE iby = The score for item i, bank b in year y.
34
147 items are calculated as 98(140-42)+49

133
This formula calculates the disclosure score for risk information for each bank by
dividing the total scores of all items of bank b by the maximum score bank b could
score. The result will be a score between 0 and 1. The scores thus scaled in this formula
can be compared with scores for other sample banks. Table 6.2 presents the Risk
Disclosure Index.
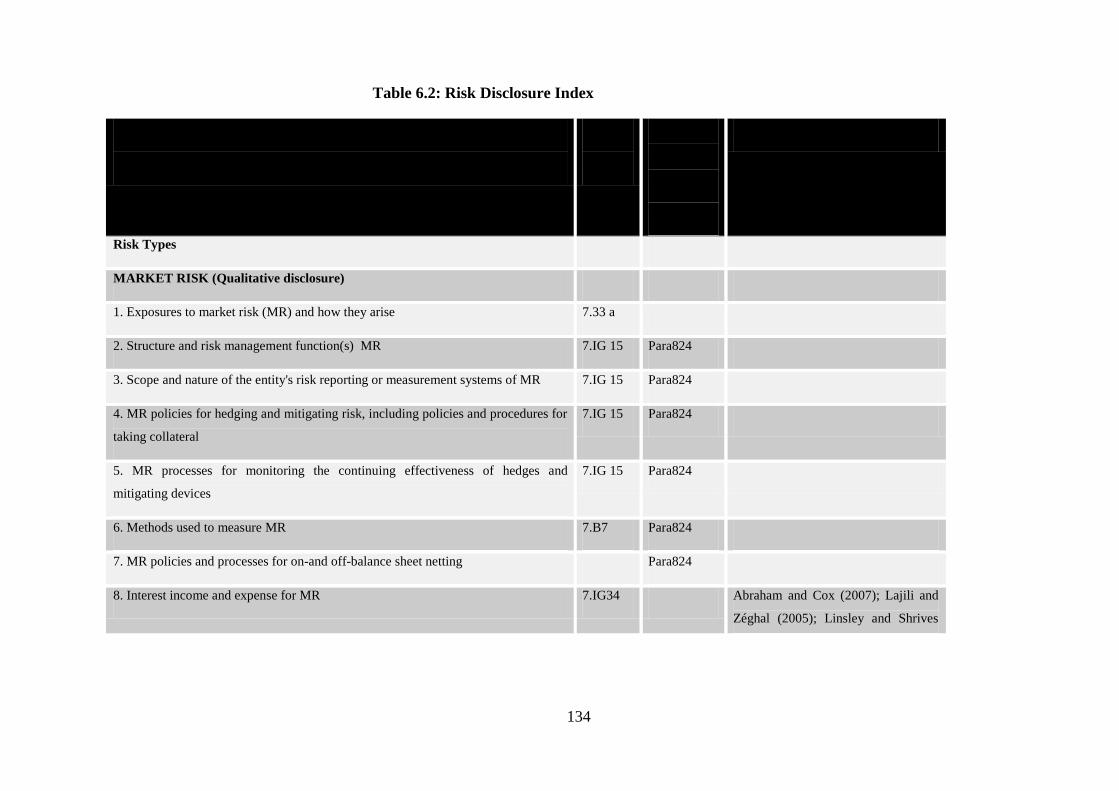
134
Disclosure Items
IFRS 7
Ref.
Basel II
(Market
Discipline)
Ref.
Previous literature Ref.
A. Risk Types
MARKET RISK (Qualitative disclosure)
1. Exposures to market risk (MR) and how they arise 7.33 a
2. Structure and risk management function(s) MR 7.IG 15 Para824
3. Scope and nature of the entity's risk reporting or measurement systems of MR 7.IG 15 Para824
4. MR policies for hedging and mitigating risk, including policies and procedures for
taking collateral
7.IG 15 Para824
5. MR processes for monitoring the continuing effectiveness of hedges and
mitigating devices
7.IG 15 Para824
6. Methods used to measure MR 7.B7 Para824
7. MR policies and processes for on-and off-balance sheet netting Para824
8. Interest income and expense for MR 7.IG34 Abraham and Cox (2007); Lajili and
Zéghal (2005); Linsley and Shrives
10Table 6.2: Risk Disclosure Index
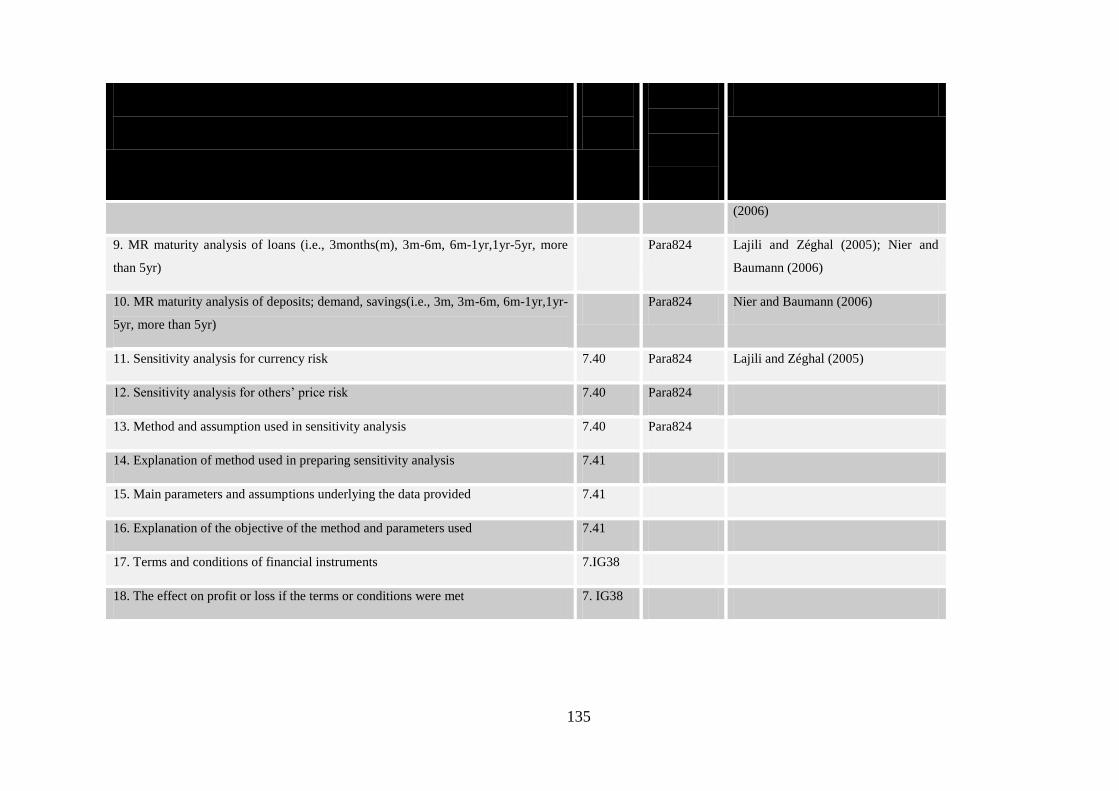
135
Disclosure Items
IFRS 7
Ref.
Basel II
(Market
Discipline)
Ref.
Previous literature Ref.
(2006)
9. MR maturity analysis of loans (i.e., 3months(m), 3m-6m, 6m-1yr,1yr-5yr, more
than 5yr)
Para824 Lajili and Zéghal (2005); Nier and
Baumann (2006)
10. MR maturity analysis of deposits; demand, savings(i.e., 3m, 3m-6m, 6m-1yr,1yr-
5yr, more than 5yr)
Para824 Nier and Baumann (2006)
11. Sensitivity analysis for currency risk 7.40 Para824 Lajili and Zéghal (2005)
12. Sensitivity analysis for others’ price risk 7.40 Para824
13. Method and assumption used in sensitivity analysis 7.40 Para824
14. Explanation of method used in preparing sensitivity analysis 7.41
15. Main parameters and assumptions underlying the data provided 7.41
16. Explanation of the objective of the method and parameters used 7.41
17. Terms and conditions of financial instruments 7.IG38
18. The effect on profit or loss if the terms or conditions were met 7. IG38

136
Disclosure Items
IFRS 7
Ref.
Basel II
(Market
Discipline)
Ref.
Previous literature Ref.
19. A description of how the risk is hedged 7. IG38
20. Information about trading financial and non-trading financial instruments 7.B17 (2)
21. Economic environment (hyperinflation or low inflation) 7.B17
22. Foreign exchange rates 7.IG32
23. Prices of equity instruments 7.IG32
24. Market prices of commodities 7.IG32
25. Prevailing market interest rate 7.IG33
26. Currency rates and interest rates for foreign currency financial instruments such
as foreign currency bonds
7.IG33
27.A description of how management determines concentrations 7.B8
28. If concentrated in one or more Industry sector (such as retail or wholesale) IG18 Para 825
29. If an entity concentrated on one or more credit quality (such as secured and
unsecured loans) and (investment grade or speculative grade)
IG18

137
Disclosure Items
IFRS 7
Ref.
Basel II
(Market
Discipline)
Ref.
Previous literature Ref.
30. Geographical distribution (such as Asia or Europe) IG18
31. A limited number of counterparties or group of closely related counterparties IG18
32. Key assumptions regarding loan prepayments and behaviour of no maturity
deposits
Para 824
33. Long term funding; convertible bonds, mortgage bonds, other bonds,
subordinated debt, hybrid capital
Para 824
34. Total money market funding
Para 824
MARKET RISK (Quantitative disclosure)
35.Summary quantitative data about exposure to MR at the reporting date (gross
market risk exposure, average gross exposure and major types of market exposure)
7.34 Para 825
36.Sensitivity analysis for interest risk 7.40
37.Sensitivity analysis for currency risk 7.40
38. Sensitivity analysis for other price risk 7.40

138
Disclosure Items
IFRS 7
Ref.
Basel II
(Market
Discipline)
Ref.
Previous literature Ref.
39. Amount of concentration of MR with shared characteristics (i.e. geographical,
region or country)
7.34,7.B
8 , IG19
Para 825
CREDIT RISK (Qualitative disclosure) Para 825
40. Exposures to credit risk (CR) and how they arise 7.33 Para 825
41. Structure and risk management function(s) 7.IG 15 Para 825
42. CR scope and nature of the entity's risk reporting or measurement systems 7.IG 15 Para 825
43. CR policies for hedging and mitigating risk, including policies and procedures
for taking collateral
7.IG 15 Para 825 Uddin and Hassan (2011)
44. Processes for monitoring the continuing effectiveness of hedges and mitigating
devices for CR
7.IG 15 Para 825
45. Methods used to measure CR 34, 7.B7 Para 825
46. CR policies and processes for on-and off-balance sheet netting Para 825
47. Loans by type (government, mortgage, lease, and other loans Nier and Baumann (2006)

139
Disclosure Items
IFRS 7
Ref.
Basel II
(Market
Discipline)
Ref.
Previous literature Ref.
48. Policies and processes for valuing and managing collateral and other credit
enhancements obtained
7.IG22 Lajili and Zéghal (2005); Nier and
Baumann (2006)
49. Description of main types of collateral and other credit enhancements 7.IG22 Para 824
50. Main types of counterparties to collateral and other credit enhancements and their
creditworthiness
7.IG22 Uddin and Hassan (2011)
51. Information about CR concentrations within the collateral or other credit
enhancements
7.IG22 Para 824
52. Nature and carrying amount of assets obtained by taking possession of collateral
held as security or called on other credit enhancements
7.38
53. Definitions of past due and impaired 7.12 (1) Para 824 Lopes and Rodrigues (2007)
54. The nature of the counter party 7.IG23 Para 824
55. Any other information used to assess credit quality 7.IG23 Para 824
56. Rating agencies used for external ratings when managing or monitoring credit
quality
7.IG24 Para 824

140
Disclosure Items
IFRS 7
Ref.
Basel II
(Market
Discipline)
Ref.
Previous literature Ref.
57.A description of how management determines concentrations for CR 7.B8
58. If concentrated in one or more Industry sector (such as retail or wholesale) IG18 Para 825
59. If an entity concentrated on one or more credit quality (such as secured and
unsecured loans) and (investment grade or speculative grade)
IG18
60. Geographical distribution of CR (Asia or Europe) IG18 Nier and Baumann (2006)
61. A limited number of counterparties or group of closely related counterparties of
CR
IG18
62. The bank’s objectives in relation to securitisation activity, including the extent to
which these activities transfer CR of the underlying securitised exposures away from
the bank to other entities
Para824
63. Summary of accounting policies for securitisation activities, including: whether
the transactions are treated as sales or financings; recognition of gain on sale key
assumptions for valuing retained interests, including any significant changes since
the last reporting period and the impact of such changes
Para824

141
Disclosure Items
IFRS 7
Ref.
Basel II
(Market
Discipline)
Ref.
Previous literature Ref.
CREDIT RISK (Quantitative disclosure)
64. Summary quantitative data about exposure to CR at reporting date (gross credit
risk exposure, average gross exposure and major types of credit exposure)
7.34 Para 825
65. Amount of maximum exposure to CR (before deducting value collateral) 7.36
66. Granting financial liabilities, grantees should be significantly greater than
liability
7.B9
67. For loan commitment (irrecoverable over the life of the facility or recoverable
only in response to a material adverse change) the maximum credit exposure is the
full amount of the commitment
7.B10
68. Amount of concentration of CR with shared characteristics (i.e. geographical,
region or country)
7.B10
69.By class of financial assets, an analysis of the age of financial assets that are past
due as at the reporting date but not impaired. For example, time brands may be not
more than 3m, 3m to 6m, 6m to 1yr; and more than 1yr.
7.B10,7.
12
(1)
Para 825 Lopes and Rodrigues (2007)
70. Amount of credit exposures for each external credit grade 7.34,7.B Para 825

142
Disclosure Items
IFRS 7
Ref.
Basel II
(Market
Discipline)
Ref.
Previous literature Ref.
8 , IG19
71. Amount of an entity's rated and unrated credit exposures 7.35,
IG20
72. The total outstanding exposures securitised by the bank and subject to the
securitisation framework (broken down into traditional/synthetic), by exposure type
7.12 (1) Para 824
73. Aggregate amount of securitisation exposures retained or purchased, broken
down by exposure type
7.12 (1) Para 824
74. Loan loss reserves Para 824 Uddin and Hassan (2011)
75. Contingent liability Para 824 Uddin and Hassan (2011)
76. Off-balance sheet item Para 824 Uddin and Hassan (2011)
77. Loan loss provision
Para 824 Uddin and Hassan (2011)
LIQUIDITY RISK (Qualitative disclosure)
78. Exposures to liquidity risk (LR) and how they arise 7.33

143
Disclosure Items
IFRS 7
Ref.
Basel II
(Market
Discipline)
Ref.
Previous literature Ref.
79. Structure and risk management function(s), including a discussion of
independence and accountability for LR
7.IG 15 Para824 Lajili and Zéghal (2005); Lopes and
Rodrigues (2007)
80. Scope and nature of the entity's LR reporting or measurement systems 7.IG 15 Para824
81. LR policies for hedging and mitigating risk, including policies and procedures
for taking collateral
7.IG 15 Para824
82. LR processes for monitoring the continuing effectiveness of hedges and
mitigating devices
7.IG 15 Para824
83. Methods used to measure LR 34, 7.B7 Para824
84. LR policies and processes for on-and off-balance sheet netting Para824
85. judgement to determine an appropriate number of time bands (i.e. 0-1m, 1-3m,
3m-1yr, 1yr-5yrs)
7.B11 Lopes and Rodrigues (2007);Uddin
and Hassan (2011)
86. A maturity analysis of the expected maturity dates of both financial liabilities and
financial assets
7.IG30
87. Undrawn loan commitments 7.IG31

144
Disclosure Items
IFRS 7
Ref.
Basel II
(Market
Discipline)
Ref.
Previous literature Ref.
88. Readily available financial assets in liquid market to meet liquidity needs 7.IG31
89. Committed borrowing facilities (e.g., commercial paper) or other line of credit
(stand-by credit facility)
7.IG31
90. Financial assets for which there is no liquid market, but which are expected to
generate cash flows (principal or interest)
7.IG31
91. Deposits at central banks to meet liquidity needs 7.IG31
92. Diverse funding sources 7.IG31
93. Significant concentrations of liquidity risk (assets or funding source) 7.IG31
94. A description of how management determines concentrations of LR 7.B8
95. If concentrated in one or more Industry sector (such as retail or wholesale) IG18 Para 825
96. If entity concentrated on one or more credit quality (such as secured and
unsecured loans) and (investment grade or speculative grade)
IG18
97. Geographical distribution of LR (Asia or Europe) IG18 Cabedo and Miguel Tirado (2004);
Lajili and Zéghal (2005)

145
Disclosure Items
IFRS 7
Ref.
Basel II
(Market
Discipline)
Ref.
Previous literature Ref.
98. A limited number of counterparties or group of closely related counterparties
IG18
LIQUIDITY RISK (Quantitative disclosure)
99. Summary quantitative data about exposure to LR at reporting date (gross market
risk exposure, average gross exposure and major types of market exposure)
7.34 Para 825
100. Gross finance lease obligations (before deducting finance charges) 7.B 14
101. Amount of concentration of LR with shared characteristics (i.e. geographical,
region or country)
7.34,7.B
8 , IG19
Para 825
102. Detailed breakdown: treasury bills, other bills, bonds, equity investments, other
investments
Para 825 Nier and Baumann (2006)
103. Coarse breakdown: Government securities, other listed securities, non-listed
securities
Para 825 Nier and Baumann (2006)
104. Investment securities or trading securities Para 825 Nier and Baumann (2006)
105. Deposits by type of customer; Bank deposits, municipal, government Para 825 Nier and Baumann (2006)

146
Disclosure Items
IFRS 7
Ref.
Basel II
(Market
Discipline)
Ref.
Previous literature Ref.
106. Long term funding; Convertible bonds, mortgage bonds, other bonds,
subordinated debt, hybrid capital
Para 825 Nier and Baumann (2006)
107. Maturity analysis of deposits; demand, savings (i.e., 3m, 3m-6m, 6m-1yr,1yr-
5yr, more than 5yr)
Para 825 Nier and Baumann (2006)
108. Total money market funding
Para 825 Nier and Baumann (2006)
Operational Risk (Qualitative disclosure)
109.A discussion of relevant internal and external factors considered in
measurement approach and scope and coverage of different approaches used
Para 825 Lajili and Zéghal (2005); Oliveira,
Rodrigues and Craig (2011)
110. A description of use of insurance for the purpose of mitigating operational risk Para 825 Lajili and Zéghal (2005); Oliveira,
Rodrigues and Craig (2011)
111. Customer satisfaction Para 825 Lajili and Zéghal (2005); Oliveira,
Rodrigues and Craig (2011)
112. Product development Para 825 Lajili and Zéghal (2005); Oliveira,
Rodrigues and Craig (2011)

147
Disclosure Items
IFRS 7
Ref.
Basel II
(Market
Discipline)
Ref.
Previous literature Ref.
113. Efficiency and performance Para 825 Lajili and Zéghal (2005); Oliveira,
Rodrigues and Craig (2011)
114. Environmental Para 825 Linsley and Shrives (2006)
115. Health and safety
Para 825
Equities Risk (Qualitative Disclosure) Para 825
116. Differentiation between holdings on which capital gains are expected and those
taken under other objectives, including for relationship or strategic reasons
Para 825
117. Discussion of important policies covering the valuation of and accounting for
equity holdings in the banking book
Para 825
Equities Risk (Quantitative Disclosure) Para 825
118. Fair value of investment and comparison to publicly quoted share values where
the share price is materially different
7.12 (1) Para 825

148
Disclosure Items
IFRS 7
Ref.
Basel II
(Market
Discipline)
Ref.
Previous literature Ref.
119. The type and nature of investments, including the amount, classified as publicly
traded and privately held
Para 825
120. The cumulative realised gain or loss arising from sales and liquidations at
reporting date
Para 825
121. Total unrealised gain or loss
Para 825
B. Capital Disclosure
122. Capital structure Para 825 Lajili and Zéghal (2005); Oliveira,
Rodrigues and Craig (2011)
123. Amount of Tier 1 capital (including disclosure of paid up share capital,
reserves, minority interests, capital instruments, other amounts deducted from
goodwill and investments
Para 825 Lajili and Zéghal (2005); Oliveira,
Rodrigues and Craig (2011)
124. Total amount of Tier 2 and Tier 3 capital Para 825 Lajili and Zéghal (2005); Oliveira,
Rodrigues and Craig (2011)
125. Other deductions from capital Para 825 Lajili and Zéghal (2005); Oliveira,

149
Disclosure Items
IFRS 7
Ref.
Basel II
(Market
Discipline)
Ref.
Previous literature Ref.
Rodrigues and Craig (2011)
C. Internal corporate governance
126. Reporting frequency (yearly, quarterly, semi-annually) Para 825
127. Accounting policies ( income recognition, provisioning plan, valuation policy) Para 825 Uddin and Hassan (2011)
128. Ownership structure Para 825
129.Remuneration policies for directors and senior management Para 825
130. Audit fee breakdown Para 825
131. Interbank borrowing costs Para 825
132. Authority and responsibility assignment Para 825 Hernandez-Madrigal, Blanco-Dopico
and Aibar-Guzman (2012)
133.Access Para 825
134.Availability of information processing and technology Para 825
135.Infrastructure Para 825

150
Disclosure Items
IFRS 7
Ref.
Basel II
(Market
Discipline)
Ref.
Previous literature Ref.
D. Strategic Decision Risk Para 825
136.Strategic, operational, information and compliance objectives Para 825 Hernandez-Madrigal, Blanco-Dopico
and Aibar-Guzman (2012)
137.Risk management philosophy Hernandez-Madrigal, Blanco-Dopico
and Aibar-Guzman (2012)
138. Competition in product markets Para 825 Uddin and Hassan (2011)
139. Financial Performance measurement Para 825
140. Sovereign and political Para 825 Uddin and Hassan (2011); (Linsley &
Shrives 2006)
141. Permanent monitoring activities and independent assessments
Hernandez-Madrigal, Blanco-Dopico
and Aibar-Guzman (2012)
E. General Risk Information
142. Relationship to Government development plan Abraham and Cox (2007); Beretta and
Bozzolan (2004); Cabedo and Miguel

151
Disclosure Items
IFRS 7
Ref.
Basel II
(Market
Discipline)
Ref.
Previous literature Ref.
Tirado (2004); Lajili and Zéghal
(2005); Uddin and Hassan (2011)
143. Customer acquisition process Abraham and Cox (2007); Beretta and
Bozzolan (2004); Cabedo and Miguel
Tirado (2004); Lajili and Zéghal
(2005); Linsley and Shrives (2006);
Uddin and Hassan (2011)
144. Recruitment of qualified and skilled professionals Abraham and Cox (2007); Beretta and
Bozzolan (2004); Cabedo and Miguel
Tirado (2004); Lajili and Zéghal
(2005); Linsley and Shrives (2006);
Uddin and Hassan (2011)
145. Natural disasters
Abraham and Cox (2007); Beretta and
Bozzolan (2004); Cabedo and Miguel
Tirado (2004); Lajili and Zéghal
(2005); Linsley and Shrives (2006);
Uddin and Hassan (2011)

152
Disclosure Items
IFRS 7
Ref.
Basel II
(Market
Discipline)
Ref.
Previous literature Ref.
F. Government Regulation Abraham and Cox (2007); Beretta and
Bozzolan (2004); Cabedo and Miguel
Tirado (2004); Lajili and Zéghal
(2005); Linsley and Shrives (2006);
Uddin and Hassan (2011)
146. Adverse changes in government regulation, control and taxation Abraham and Cox (2007); Beretta and
Bozzolan (2004); Cabedo and Miguel
Tirado (2004); Lajili and Zéghal
(2005); Linsley and Shrives (2006);
Uddin and Hassan (2011)
147. High degree of government regulation Abraham and Cox (2007); Beretta and
Bozzolan (2004); Cabedo and Miguel
Tirado (2004); Lajili and Zéghal
(2005); Linsley and Shrives (2006);
Uddin and Hassan (2011)
(1) Reclassification of Financial Assets (Amendments to IFRS 7) issued, effective 1 July 2008. (2) Improving Disclosures about Financial
Instruments (Amendments to IFRS 7) issued, effective for annual periods beginning on or after 1 January 2009.

153
6.6.2 Reliability of Risk Disclosure Index score
As mentioned earlier, the Risk Disclosure Index developed in this research is based on
two international standards (IFRS 7: Financial Instruments: Disclosures and Basel II:
Market Discipline). Two academics in accounting with financial reporting expertise and
five research associates acting as independent evaluators coded the data set to ensure the
reliability scale. Krippendroff (1980) considered it important that at least two
researchers do this type of analysis independently and compare results for reliability
checking.
The independent evaluators reviewed in the pilot study a total of 24 (11.42 per cent)
from the total of 210 annual reports. The researcher reviewed all 24 reports. The
unweighted Risk Disclosure Index coded by these independent evaluators was then
compared to ascertain if there were any statistically significant differences between
them. A t-test for differences in the means from each coders’ Risk Disclosure Index
(RDI) scoring was applied. The results are shown in Table 6.3.
Legend: N= 24; comparing the mean Risk Disclosure Index scores of both
researcher and evaluators.
Table 6.3 indicates the results are not statistically different (p>0.10) between the
researcher and the evaluators. This demonstrates a closeness in scoring between the
researcher and the evaluators in the pilot study. Hence, the scores for the Risk
Disclosure Index can be considered reliable.
11Table 6.3: Reliability tests of Risk Disclosure Index comparability
Mean t-tests Sig.(2 tailed)
Researcher 0.425 1.231 0.213
Evaluator 0.415

154
6.6.3 Sample design
This research conducts analysis using data from the period 2006 to 2012. There are
three reasons for choosing this period. First, this seven-year period provides a full
snapshot of risk reporting including a time dimension from pre-recession (2006),
recession (2007-2008) and post-recession (2009-2012). The study thus examines a
range of economic circumstances, from pre-recession (2006) to the post-recession
(2009-2012) period and the seven-year time frame provides valuable understandings of
the risk disclosure differentials in each period. Second, this study also investigates the
voluntary adoption status of IFRS 7 and Basel II: Market Discipline and in Bangladesh
over these periods. The seven-year period thus assesses whether the development of
international standards is associated with risk reporting. Therefore examining what is
effectively voluntary risk disclosure in annual reports provided over this time, due to the
nature of the institutional setting in Bangladesh, will make a contribution to the
literature. Third, the latest year, 2012, is the most recent period that enables reasonable
access to banks’ corporate reports.
6.6.4 Data collection
The study uses as its sample the population of all 30 listed banks on the Dhaka Stock
Exchange (DSE) in Bangladesh. The annual reports were downloaded from either the
Stock Exchange website or company websites. Unavailable reports were collected from
respective banks’ head offices, and the Bangladesh Securities and Exchange
Commission. Thus, 30 banks’ annual reports for years 2006 to 2012 were collected and
analysed, resulting in 210 observations. The annual reports from 2006-2008 are mostly
hand collected however, 2009 to 2012 reports were mostly available from banks’
websites. Thus, 210 annual reports were collected from November 2012 to June 2013.
6.6.5 The dependent variable
The Risk Disclosure Index score is used as the dependent variable in the analysis when
investigating the determinants of risk disclosure in Phase Two of the broader study. In

155
the third Phase of this study, testing of the association of risk disclosure with banks’
performance is conducted. Performance is measured using operating performance
(financial, employee efficiency, operating efficiency, deposit concentration) and bank
value (Tobin’s q and the book-to market ratio) aspects. Performance measures are the
dependent variables (separately) used to model the association of risk disclosure and
bank performance.
6.6.6 Independent and control variables
As discussed in Chapter 5, the underpinning theories for this study, institutional
isomorphism (i.e. coercive, mimetic and normative) and agency theory (board
independence, audit committee independence, risk committees) are measured as
independent variables in Phase Two (while investigating the underlying determinants of
risk disclosure). Additionally, board size, multinational linked audit firm, and age are
included as control variables. These factors are used commonly in the accounting risk
disclosure literature (Aebi, Sabato & Schmid 2012; Khan, Muttakin & Siddiqui 2012;
Lajili 2009; Linsley & Shrives 2006; Michael, Kaouthar & Daniel 2011; Oliveira,
Rodrigues & Craig 2011). In Phase Three, the lagged Risk Disclosure Index is used as
an independent variable with other control variables (board size, bank size, board
independence, GDP growth, inflation, leverage and lagged performance). For
convenience, the inclusion of all of these independent and control variables is justified
with the relevant regression models later in section 6.6.7.4.
6.6.7 Statistical data analysis techniques
This section presents the statistical data analysis technique employed in this research.
The statistical data analysis tools and techniques were selected as being appropriate to
the nature and objective of the study (Creswell & Clarke 2011). This thesis reports
descriptive statistics, other univariate statistics, bivariate correlations and multivariate
analyses. Stata version 13 and the Statistics Package for Social sciences (SPSS) version
21 were used for such analysis. Before proceeding with regression analysis, the

156
assumptions underlying (i.e. normality, multicollinearity) it were tested. The statistical
techniques used in this study are explained in detail in the following sub-sections.
6.6.7.1 Descriptive statistics
Descriptive statistics are used in this research to describe the Risk Disclosure Index and
other variables included in the testing of Hypotheses in detail. In particular, descriptive
analyses are provided to describe the five categories of risk disclosure (i.e. Liquidity,
Market, Operational, Equities and Credit) in terms of their individual component scores.
Descriptive statistics are used to represent the types of risk disclosure graphically, to
measure frequency distributions, central tendency and explore whether the assumptions
are met in relation to further statistical analysis.
6.6.7.2 Univariate statistics (Chi-Square tests, t tests, paired sample t tests, and
ANOVA)
Chi- Square tests are used in this thesis to determine first, whether differences in the
Risk Disclosure Index exist between big four and non-big four audited banks; and
second, whether differences in the Risk Disclosure Index exist between banks with or
without risk management units.
Independent sample t tests are used to compare the mean scores of two different groups
of conditions. The assumptions behind independent sample t tests are: a) the scores for
two groups are independent of each other, b) the scores for each group have equal
variances, and c) the distribution of the scores is normal.
The repeated measures paired sample t tests measure the changes in score at different
times. This thesis employs paired sample t tests to explore the significance of
differences in the score based on implemented international standards in respect of risk
disclosure across different periods.
157
Analysis of Variance (ANOVA) is a procedure to test the differences between two or
more population means and analyse the variance of the data to infer whether population
means differ (Hair et al. 2010). ANOVA involves comparing the mean score of more
than two groups. ANOVA employs one independent variable with a number of different
levels corresponding to different groups (Pallant 2010). As this study is conducted over
a seven-year period (2006-2012), ANOVA is used to compare the RDI over the period.
A large F ratio indicates more variability between the groups than within each group.
The significance of F indicates whether the null hypothesis can be rejected and the
population mean is equal.
6.6.7.3 Bivariate analysis (Correlation)
A series of correlations is conducted to explore the strength of the linear association
between two continuous variables. The effects of outliers, restriction of range and
multicollinearity concerns can be associated with coefficient correlations. The
coefficients take values from -1 to +1 (Hair et al. 2010; Pallant 2010).
Histograms, box plots, and z score values for each variable will be identified to check
for univariate outliers. Z score values exceeding a magnitude of 3.29 (p<0.001) will be
used to determine univariate outliers and the 5 per cent trimmed mean of variables will
be scrutinised to specify how much of a problem extreme values are likely to be (Pallant
2010).
Normality of variables is assessed by skewness and kurtosis. Skewness reflects the
symmetry of distribution and kurtosis refers to the peakiness of distribution (either too
peaked or too flat). The critical ratio from skewness and kurtosis indices provide an
assessment of univariate normality.
6.6.7.4 Multiple regression model
Multiple regression is performed to explore the predictive ability of a set of independent
variables on a continuous dependent variable. Multiple regression provides information

158
as a whole as to the contribution of each variable making up the model, whether
additional variables can contribute more predictability to the model, and whether control
variables enhance the predictive ability of the model.
The regression analysis used in second Phase of the study models the way in which the
possible explanatory variables explain the Risk Disclosure Index score. Additionally,
multivariate regression models are developed in the third Phase of the study to test the
association between the Risk Disclosure Index and bank performance. Thus, this thesis
employs Ordinary Least Squares (OLS) regression analysis models. A multivariate
regression model is developed to explain the simultaneous effects of the independent
and control variables on the dependent variable. The dataset in this study is a cross-
sectional time series or strongly balanced panel, however, the Hausman test statistics
failed to reject the null of no systematic differences in coefficients between pooled OLS
and panel fixed effects. Hence, the study estimated the regressions using the following
pooled OLS model. To determine the underlying determinants of the Risk Disclosure
Index, the study examined the following regression model in Phase Two.
+ + + + + +
+ YEARit + (Model 1)
Where, for Model 1, the dependent variable = is the corporate Risk Disclosure
Index score for bank i in year t and is estimated in the Phase One of the study using data
from annual reports. The independent and control variables in Model 1, are derived
from previous studies. Based on agency theory arguments, extant studies (Amran, Bin
& Mohd 2008; Beasley, Clune & Hermanson 2005; Oliveira, Rodrigues & Craig 2011)
have found an independent board to be a risk governance factor in explaining the extent
of risk disclosure. Consistent with previous studies, the researcher expects the
proportion of independent directors on the board, (board Independence for bank i in
year t), to have a positive relation with the Risk Disclosure Index. is measured as
159
the proportion of independent directors on the board. As discussed in Chapter 5, a
higher percentage of independent directors on the audit committee are more likely to
monitor the internal control risk management and risk reporting process more
effectively (Fraser & Henry 2007; Oliveira, Rodrigues & Craig 2011). Therefore, this
study expects a positive direction between the proportion of independent directors on
the audit committee, (audit committee independence for bank i in year t) and the
Risk Disclosure Index. is measured as proportion of independent directors on the
audit committee. Following Aebi, Sabato and Schmid (2012), it is expected that the
more a bank acknowledges its risk reporting concerns through establishing a larger
rather than smaller number of risk committees, (number of risk committees for
banki in yeart), the more likely it is to provide risk disclosures in its annual report. The
preference for effectiveness of risk committee measure (e.g. number of meeting) but this
being precluded by an absence of data. is measured as the total number of risk
committees established by a bank.
Model 1 includes the debt to equity ratio, , using debt to equity for bank i in year t.
Based on the coercive isomorphism concept, the more the bank depends on debt
financing, the more likely the creditors’ power is exercised in risk reporting (Barth &
Landsman 2010; Barth & McNichols 1994; Cormier, Gordon & Magnan 2004).
Following Abraham and Cox (2007); Aebi, Sabato and Schmid (2012); Oliveira,
Rodrigues and Craig (2011), Model 1 includes log transformed total assets,
(total assets for bank i in year t) based on the posited mimetic isomorphism Proposition
that mimetic isomorphism of larger banks has an influence on the degree of risk
reporting by smaller banks. As discussed in Chapter 5, normative isomorphism forces
professional influences and employee organisational practices such as, financial
reporting disclosure (Hassan 2009). Therefore, Model 1 includes the presence or

160
absence of a risk management unit35
, (risk management unit for bank i in year t,)
and it is expected that stronger risk communication in the annual reports of these banks
compared to banks that do not have a risk management unit.
Following Beltratti and Stulz (2012) and Aebi, Sabato and Schmid (2012), this study
also examines log transformed board size ( board size for banki in yeart,), the
presence of a multinational linked audit firm ( Multinational linked audit firm for
banki in yeart,) and log transformed age of bank ( Age of bank i in year t,) as control
variables. These control variables are consistently used in extant information disclosure
studies. For example, board size in Aebi, Sabato and Schmid (2012); Beltratti and Stulz
(2012)), multinational linked audit firm in Kleffner, Lee and McGannon (2003); Wang,
Zhu and Shen (2009) and age of business in Hill and Short (2009). Moreover, referring
to Chapter 4, Abraham and Cox (2007) found risk disclosure is negatively associated
with share ownership. The present study omits this variable in the regression model
because of the lack of data in the sample companies’ annual reports.
Table 6.4 defines the variable measurement in detail
35
Risk Management Unit is not included amongst the 147 items in the Risk Disclosure Index

161
Dependent Variable
Construct Variable Code Hypothesis Expected
sign
Measurement Type of
data
Source*
Risk Disclosure
Area
Risk Disclosure
Index
RDI H1 Risk Disclosure Index score for
bank (b) in year (y)
Continuous 3
Independent variables
Agency Theory Board Independence BI H2 + Proportion of independent
directors on the board
Continuous 1
Audit Committee
Independence
ACI H3 + Proportion of independent
directors on the audit committee
Continuous 1
Number of Risk
Committees
RC H4 + Total number of risk committees Continuous 1
Institutional
Isomorphism
Leverage - Debt to
Equity ratio
DE H5 + Total debt divided by total equity Continuous 1
Size - Total Assets LnTA H6 + Natural logarithm of total assets Continuous 1
Risk Management
Unit presence
RMU H7 + Indicator variable, 1= Risk
Management Unit (RMU), 0= No
RMU
Categorical 1
Control Variables
Bank
Characteristics
Board Size LnBS + Log of number of directors on the
board
Continuous 1
Multinational linked
Audit Firm
ML + Indicator variable, 1= if big four
auditor, 0= if non big four auditor
Categorical 1
Age LnAG + Log number of years from
incorporation
Continuous 1
*1=Annual Reports, 2= Bangladesh Securities and Exchange Commission, 3= Author Constructed measure = Stochastic error term
12Table 6.4: Variable definitions (Model 1)

162
As discussed in earlier sections, the third Phase of this study investigates whether any
potential association exists in relation to risk disclosure and banks’ performance.
Therefore, Chapter 5 of this study discusses the Hypotheses in relation to the
association of risk disclosure with bank performance. Bank performance is measured
using two broad aspects; bank operating performance (such as, financial performance,
employee efficiency, solvency efficiency, deposit concentration) and bank valuation
(hereafter, bank market performance). Bank market performance is measured using
Tobin’s q and the book to market ratio. The empirical model used in this study is based
on previous literature relating to information disclosure and performance.
Models 2-5 Bank operating performance = (Risk Disclosure Index score, Control
variables)
+ + + + + + +
+ + + + +
Year it + it (Models 2-5)
Models 6-7: Bank market performance = (Risk Disclosure Index score, Control
variables)
= + + + + + + +
+ Year it + it (Models 6-7)
Where OPERF (Operating Performance) represents the respective dependent variable
performance measures. For Models 2-5, the dependent variables modelled are financial
performance (ROA), employee efficiency (EEF), solvency efficiency (SEF) and deposit
concentration (DP) respectively. For Models 6 and 7, MPERF (Bank market
performance ) represents bank valuation; the dependent variables modelled are Tobin’s
q (TOBQ) and book to market (BTM).

163
In general, prior research uses return on assets (ROA) as the financial measure of
profitability. ROA reflects the ability of banks’ management to generate profit from
assets. Following Aebi, Sabato and Schmid (2012) and Hwang et al. (2009), this study
uses ROA as a proxy for measuring financial performance. The Employee efficiency
(EEF) measure quantifies the degree to which a banking organisation has grown in
capacity due to increased learning. This study follows Wang (2005) in measuring
employee efficiency, calculated as the natural logarithm of total operating income
divided by the number of employees. Solvency efficiency (SEF) is measured as capital
divided by total assets (Demirgüç-Kunt, Detragiache & Tressel 2008).
In measuring bank market performance, extant studies use Tobin’s q and the book-to
market ratio (Caprio, Laeven & Levine 2007; La Porta, Lopez-De-Silanes & Shleifer
1999). This study follows prior studies in controlling for specific factors deemed
significant in explaining variation in bank performance. For example, Aebi, Sabato and
Schmid (2012), Levine (2004) and Laeven and Levine (2009) found a significant
positive relation between bank governance factors (board size, board independence) and
bank operating and market performance. Additionally, bank specific characteristics,
such as bank size, is an important determinant of bank performance due to increasing
returns to scale in banking (Demirgüç-Kunt, Detragiache & Tressel 2008). The present
study controls for bank size by using the natural logarithm of total assets (Ben Naceur &
Kandil 2009; Demirgüç-Kunt, Detragiache & Tressel 2008) and expects its coefficient
to have a positive sign. Leverage is controlled for in this study following La Porta,
Lopez-De-Silanes and Shleifer (1999). They found leverage is negatively associated
with firm value.
This study also controls for GDP growth, considering that banks would benefit from
upward economic activity level. The economy in Bangladesh suffered from relatively
high inflation over the study period, which might have negative effect on bank
performance. Therefore, this study controls for the annual Consumer Price Index
(announced by the Ministry of Finance, Bangladesh) and expects a negative relation
with bank performance. Berger et al. (2005) argue that banks’ profitability has a
tendency to persist over time due to macroeconomic factors, market competition and/or

164
informational opacity. Therefore, operating performance models (2-5) in this study
control for lagged variables (LAG_ROA, LAG_EEF, LAG_SEF, LAG_DP). Table 6.5
defines the performance variable measurement in detail.

165
Dependent Variables
Construct Variable Code Hypothesis Measurement Type of data Source
Organisational
performance in different
aspects
Employee
Efficiency
EEF H8 Profit per employee (EEF) is measured as log of
(operating income/ no. of employee)
Continuous 1
Solvency
Efficiency
SEF H9 Solvency efficiency (SEF) is capital divided by total
asset
Continuous 1
Deposit
Concentration
DP H10 Deposit (DP) is measured as bank deposits divided
total deposits of all banks
Continuous 1
Financial
Performance
ROA H11 Return on asset (ROA) is calculated as net profit after
tax divided by total assets.
Continuous 1
Bank market
performance
TOBQ H12 Total assets – book value of equity + market value of
equity
Continuous 1
BTM Book value of assets divided by market value of
assets
Continuous 1
Independent variables
Risk Disclosure Index Lag_RDI Prior year Risk Disclosure Index score 2
Control Variables
Bank Characteristics
LnBS Log of number of directors on the board 1
SIZE Natural logarithm of total assets 1
BI Proportion of independent directors on the board 1
LEV Total debt divided by total equity 1
Macroeconomic Factors
GDPGR GDP growth (official annual real GDP growth Figures in per cent) 3
CPI Official annual Consumer Price Index in per cent 3
Lagged Performance measures
Lag_ROA Prior year return on assets 1
Lag_EEF Prior year profit per employee 1
Lag_SEF Prior year capital adequacy ratio 1
Lag_DP Prior year bank deposits divided total deposits of all banks 1
*1=Annual Reports, 2= Author Constructed measure, 3= Ministry of Finance, Bangladesh (2013); = Stochastic error term
13Table 6.5: Variable definitions (Models 2-7)

166
6.6.8 Sensitivity and supplemental analysis
Sensitivity analyses are reported in Chapter 10 in order to provide further explanation of
variables and explore the rigour of the major findings. The sensitivity analyses provide
additional insights into the dependent variables. This study examines different proxy
measures for variables to measure whether these change the statistical analyses.
Alternative proxies are used for institutional isomorphism (mimetic isomorphism
measured as Return on Assets (ROA), coercive isomorphism measured as total assets to
total deposits) and corporate governance (board independence remeasured as the
number of board meetings) constructs.
Supplemental analysis is reported in Chapter 11 to explore the association of five
categories of risk disclosure (Liquidity, Market, Operational, Equities and Credit) with
bank performance. Analysis of these categories is expected to provide further insights
into risk disclosure phenomena. Additional multivariate regression modelling in
Chapter 10 examines the association between the change in Risk Disclosure Index and
the change in predictor variables between sample sub-periods.
The regression model is as follows and Table 6.5 presents the variable definitions.
+ + + +
+ + + +
+ +

167
s (Change in variables)
Variables Code Measurement
Dependent variable
Change in Risk disclosure Index for bank
i year t and t-i,
Independent variables
Change in Board Independence
(proportion of independent directors) for
bank i in year t,
Change in Audit committee
independence (proportion of independent
members) for bank i in year t,
Change in Number of risk committees
for bank i between year t and t-i,
Change in Debt to equity ratio for bank i
between year t and t-i,
Change in Log of Total Assets for bank i
in year t,
Change in Indicator for Risk
Management Unit for bank i in year t,
Control variables
Change in Log of Board Size for bank i
in year t,
Change in Indicator for multinational
linked audit firm for bank i in year t,
Change in Log of Age of bank since
incorporation i in year t,
Stochastic error
6.7 The qualitative method
The aim of qualitative research includes gaining an understanding about the
significance, the consequences, or the outcome in diversified thinking of the context
(Bryman 2012; Wertz et al. 2011). Qualitative research allows the researcher to narrow
down the broad outline of the research concept with different social contexts entering
into the respondent’s perspective (Bryman 2012; Patton 2002). Therefore, qualitative
research yields a holistic overview and deep understanding of the insights of the
phenomena with direct communication between experts and related respondents.
Qualitative research in this study is used to validate the quantitative results from
secondary data providing deep understanding of the Risk Disclosure Index’s antecedent
factors and the effects thereafter by risk management and risk reporting experts.
Statistical techniques are used to analyse the quantitative data, in addition, qualitative
14Table 6.6: Variable definition

168
knowledge about the subject matter and its real world complexity provides the
necessary foundation and complement to quantitative research (Wertz et al. 2011). Thus
the interview technique used in this research provides practical information from those
at the ‘coalface’ and allows sharing of the experiences of experts (Bryman 2012;
Creswell & Clarke 2011). However, one limitation of qualitative research is that
interviewers may introduce bias into the data. Therefore, this research is conducted
using a mixed method approach to overcome the limitations of a single method
(quantitative or qualitative). The following sections illustrate the sampling technique,
interview design, data collection and analysis procedure for the qualitative analysis.
6.7.1 Justification of sampling procedure
The key informant approach was employed to obtain reliable interview data for this
study. This approach considers the ‘key participants’ from amongst knowledgeable
respondents about the research concern. Fourteen (14) interviews were conducted in
total.
The respondents were selected from amongst chief risk officers in risk management
units of listed banks, risk reporting managers from listed banks (where Risk
Management Units were not available), experts from the Bangladesh Securities and
Exchange Commission and experts in the policy development department from
Bangladesh Bank. The sample bank representatives were selected from these
organisations based on their availability.
The chief risk officer or the responsible head from the risk management unit was chosen
to be invited for interview. The invited interviewees were chosen both from
conventional (Non-Islamic) and non-conventional (Islamic) banking institutions to
better understand whether differences exist in their banking practices in relation to the
research topic in this study. The experts from the Bangladesh Securities and Exchange
Commission were chosen to approach for interviews as they monitor the capital market.
The experts from Bangladesh Bank were chosen to be invited, as they are involved
directly in developing risk management guidelines for banks.
169
6.7.2 Designing the interview protocol
Semi-structured questions were designed for the conduct of interviews in this study. The
interviews focused on the respondents’ opinions. Additionally, the researcher was able
to clarify respondents’ understandings about the interview questions since vague or
inadequate responses were able to be probed (e.g. ‘could you explain in detail?’) to
understand perspectives and experiences. Thus the researcher was able to control the
context of the interviews, exploring the range of complexity and depth of information
and potential sensitive issues (Bryman 2012).
In order to understand the level of risk disclosure, respondents were first asked to
discuss the current level of risk disclosure practices in the banking sector in Bangladesh.
The respondents were asked then to clarify (in their opinion) the underlying factors of
Risk Disclosure Index and the association of risk disclosure with bank performance.
Pre-testing the questions with four senior managers enabled assessment of the validity
of the questions in terms of the research objectives and revealed the time needed,
ranging from 45 to 60 minutes, for each interview. The researcher’s interview skills
were developed during this pre-testing phase of the interview process (Patton 2002;
Veal 2005).
6.7.3 Designing the interview protocol
The interview protocol was designed in two sections. In section A, four questions were
designed to understand the background information of respondents relating to
demographic (e.g. age, gender), educational and expertise level relating to this study.
Section B was designed to explore the dimensions of risk disclosure and the perceived
effect on performance from the various interviewees’ perspectives. Eight questions were
included in section B. Appendix 6.4 presents the interview protocol.

170
6.7.4 Data collection technique
To collect the qualitative data, the researcher initially contacted, using email and
telephone, the Bangladesh Securities and Exchange Commission, the research division
of the Bangladesh Bank and the risk management and reporting units of different listed
banks. The correspondence addresses were recorded from the Yellow Pages and
websites. The participants were contacted via telephone to arrange an interview
schedule. Interview times were selected based on the preference of interviewees and the
venue was either a meeting room in the organisation or the participants’ workstations. A
consent information statement and consent form were provided before the interview
took place. All respondents were guaranteed confidentiality and the interviewees were
asked to sign the consent form prior to interview. Participation was on a voluntary basis.
Interviewees agreed to be recorded in all cases and the researcher’s written notes added
further clarification of the interviewees’ responses. Each interview was given a random
code and only the researcher knows the name or organisation of the interviewee. The
signed consent forms are stored separately from the interview transcripts. Any list
connecting codes with names is not stored together. In the write-up stage of the thesis
where interviews and evidence of identity are used, neither participants nor their
organisations are identified. Code pseudonyms are used where direct quotes are reported
and other identifiable information is removed when reporting results.
The study protocol was maintained strictly through recording interviews, signing of
consent forms, writing hand notes and maintaining a register of dates of interview for all
interviews. A project overview was developed and revised continuously throughout the
data collection stage. Thus reliability was enhanced through maintaining the study’s
protocol and database (Yin 2009). Additionally construct validity is ensured through
multiple and different sources of information (recorded interviews, written notes and
secondary data) to form themes or categories for study (Creswell & Clarke 2011).

171
6.7.5 Data analysis
The most prevalent approach in qualitative research is narrative analysis involving
exploration of underlying themes (Bryman 2012; Tashakkori & Teddlie 2010).
Narrative analysis is a process of extracting qualitative information from narrated
experience in a systematic and objective approach with hermeneutic analysis of
meaning. According to Wertz et al. (2011) the narrative analysis approach can be
described as:
..Grounded in hermeneutics, phenomenology, ethnography, and literary analysis,
narrative research eschews methodological orthodoxy in favour of doing what is
necessary to capture the lived experience of people in terms of their own meaning
making and to theorize about it in insightful ways (p.225).
This study employs narrative analysis using in-depth interviews. Content analysis is a
common technique to interpret text interviews and reveal the structural forms
emphasising the content and its meaning (Hair 2007; Wertz et al. 2011). The interviews
were analysed thematically to understand the context of research problem. According to
Hair (2007), through systematic analysis the researcher examines the frequency of
words and main themes that occur and identifies the information content. Themes were
identified through similarities, dissimilarities, and recurrent words (Denzen & Linkon
1994).
The data analysis process begins with transcribing interviews and field notes. After
carefully reviewing the transcription, the researcher categorises the themes that were
established in the quantitative research relating to the Hypotheses. This procedure was
conducted within cases and between cases. Similar themes were drawn from different
interviews and then categorised as research constructs.
Beyond identifying the common patterns in quantitative and qualitative research,
additionally this study discusses the findings from interviews. Additional findings from
the qualitative research are discussed in Chapter 8 in detail.

172
The qualitative data analysis technique employed in this study is depicted in Figure 6.6.
Source: Creswell and Clarke (2011).
6.7.6 Reliability and validity
Achievement of reliability and validity are the strengths of qualitative research. The
validation process occurs throughout the steps presented in Figure 6.6 above. The
validity of qualitative findings in this study is ensured by triangulating quantitative
findings. Multiple strategies enhance research findings more accurately and build a
coherent justification (Creswell & Clarke 2011). The detailed descriptions by
interviewees provide realistic and richer understanding and different perspectives about
the research issue than would be possible with quantitative techniques alone. The
transcripts were sent to interviewees to ensure the reliability of transcription. During the
transcription process, the researcher communicated with the interviewees ensuring
reliability of the transcription process.
23 Figure 6.6: Qualitative data analysis technique
Raw data (audio tape, transcripts,
field notes)
Organising and preparing data
for analysis
Validating the
accuracy of
information
Interpreting the meaning of
theme
Interrelated themes
Themes
Reading through all data

173
6.8. Ethical clearance
Ethical issues were anticipated while conducting interviews in this study. The project
meets the requirement of ‘National Statement on Ethical Conduct in Human Research
(2007)’ by ‘Human Research Ethics Committee, Swinburne University of Technology’
with approval number 2012/270. The confidentiality conditions were explained to each
interviewee at the beginning of the interview process and the consent form was signed
(refer Appendix 6.5). As mentioned earlier, respondents were assigned a pseudonym
and their comments were described in general terms in the thesis. Data are stored in a
locked cabinet. The electronic data are stored on a password protected computer and
portable hard drive with access granted only to the researcher and the research
supervisors. This process was followed in accordance with Swinburne University’s
Code of Research Practices.
6.9 Chapter conclusion
This Chapter justifies and provides a detailed outline of the research design consistent
with the methodological assumptions, outlines the use of methods in accordance with
these assumptions, describes the population, samples and various approaches used in
this study. This Chapter also describes the mixed method approach employed in this
study to attain the research objectives. Both qualitative and quantitative data collection
and analysis techniques are outlined in detail. The quantitative data are to be analysed
using content analysis and statistical techniques also. In addition, content analysis is to
be used for qualitative data. Thus, the mixed approach allows the researcher to achieve
the research objectives in more detail than a single approach. The Chapter concludes
with explanation of the privacy issues relevant to the interview respondents. The results
of qualitative and quantitative approaches are presented in the next five Chapters of this
thesis.

174
PART FOUR
ANALYSIS
Chapter 7: Corporate Risk Disclosure Practices in Bangladesh: Content
Analysis of Annual Reports
Chapter 8: An Exploration of the Risk Disclosure Practices and their
Determinants by Banks in Bangladesh: Qualitative Analysis of
Interview Data
Chapter 9: Factors Underlying Risk Disclosure: Descriptive, Univariate and
Bivariate Analysis
Chapter 10: Factors Underlying Risk Disclosure: Multivariate Statistics
Chapter 11: The Association between Risk Disclosure and Bank
Performance

175
Part Four provides a detailed analysis of the results from both quantitative and
qualitative data. Chapter 7 presents Phase One results of the broader study by
investigating the extent of risk disclosure that banking companies in Bangladesh make
as compared with the Risk Disclosure Index. This Chapter employs a content analysis
research method (using annual reports as the source) to investigate risk disclosure
practices.
Chapters 8, 9, and 10 provide Phase Two results of the broader study by investigating
the relationship between the Risk Disclosure Index and bank specific characteristics
such as board independence, audit committee independence, the number of risk
committees, debt to equity ratio, total assets, and the presence of a risk management
unit. Chapter 8 aims to explore the perceptions of interview participants’ in relation to
corporate risk disclosure practices and their determinants. This study provides
qualitative data from in-depth interviews with senior executives of the Bangladesh
Securities and Exchange Commission, the Bangladesh Bank (Central Bank) and risk
management and reporting units from different listed banks within the sample for this
study. The interview questions were semi-structured and were guided primarily by the
research objectives. Appropriate statistical tests are performed to assist in understanding
these relationships in Chapters 9 and 10. Chapter 9 seeks to examine the Hypothesised
relationships on a univariate basis, whilst Chapter 10 reports the multivariate testing of
Hypotheses (developed in Chapter 5).
Chapter 11 presents Phase Three of the broader study that aims to examine the
association between risk disclosure and bank performance. In the present research, bank
performance is measured using two broad aspects: bank operating performance and
bank market performance. Bank operating performance is measured as financial
performance, employee efficiency, solvency efficiency, deposit concentration and bank
market performance is measured using Tobin’s q and the book to market ratio. This
Chapter adopts an econometric approach to test the Hypothesised relationships for 30
listed banks in Bangladesh across the period 2006-2012. In this Chapter, both bivariate
and multivariate analyses are performed to test the research Hypotheses (developed in
Chapter 5)

176
CHAPTER 7: Corporate Risk Disclosure Practices in Bangladesh-
Content Analysis of Annual Reports
7.1 Introduction
This Chapter presents results from Phase One of the broader study that aims to
investigate corporate risk disclosure practices evidenced in annual reports of listed
Bangladesh banking companies’ from an international standards’ best practice
perspective. The purpose of the present Chapter is to investigate the extent of risk
disclosure that listed banking companies in Bangladesh make in relation to corporate
risk disclosure practices compared with the Risk Disclosure Index developed in Chapter
6. The Risk Disclosure Index is applied to investigate the risk disclosures of all 30 listed
banks in Bangladesh. This Phase of the research investigates whether the sample banks
provide publicly available information about the existence or non-existence of particular
best practices under international standards as captured in the Risk Disclosure Index.
Failure to provide such information publicly may impede the ability of stakeholders to
assess the risks of investing in or depositing with the respective organisations.
The findings reported in this Phase provide background for further research in later
Phases that addresses issues such as investigation of the underlying factors explaining
risk disclosure. International standards on and corporate responses to risk disclosure
requirements have evolved over the years that comprise the period of analysis (2006-
2012) involved in this Phase. Earlier in Chapter 2, it was proposed that given increasing
stakeholder concern relating to risk reporting, it is expected that across the period of
investigation (2006-2012) there will be evidence of increasing disclosure pertaining to
risk as per Hypothesis 136
.
The Risk Disclosure Index score obtained from analysis in this Chapter is used in
Chapters 9 and 10 to test empirically the relationship between banks’ risk disclosure and
36
H1: There are significant differences in risk disclosure over the period under examination (2006-2012).

177
its underlying determinants and in Chapter 11 to test between the extent of risk
disclosure and bank performance.
This Chapter is structured as follows. First, the Chapter presents the results after
examining risk disclosure practices and establishes the overall trends in risk disclosure
over the seven-year period. Then the results for categories of disclosure are presented.
Next, descriptive statistics summarise the sample observations and univariate statistics
are used to analyse any difference in risk disclosure across the different targeted time-
periods and any differences in risk disclosure between conventional (Non-Islamic) and
non-conventional (Islamic) banks. Subsequently, the results are discussed and
commented upon. A summary of the Chapter is given in the final section. Figure 7.1
provides an overview of this Chapter.
7.2 Trends in total corporate risk disclosure
Table 7.1 presents the trends in average Risk Disclosure Index score across the period
2006-2012. The Table shows the mean Risk Disclosure Index as a percentage of the
maximum possible 147 items for pooled (210 observations) and each year’s (30 banks)
data. The findings show that at the beginning of the period of analysis, sample banks
made minimal risk disclosure within their annual reports. In general, banks’ mean risk
disclosure has increased across time, supporting Hypothesis 137
.
37
H1: There are significant differences in risk disclosure over the period under examination (2006-2012).
24Figure 7.1: Roadmap of Chapter
Introduction (7.1) Trends in total risk
disclosure (7.2) Descriptive statistics
(7.3)
Univariate
analysis (7.4)
Discussion of
results (7.5) Chapter conclusion
(7.6)

178
Table 7.1 shows the growing trend in mean risk disclosure. The average risk disclosure
index score increased steadily across the period (2006-2012), rising from 43 per cent in
2006, to 50 per cent in 2007, to 53 per cent in 2008, to 62 per cent in 2009, to 71 per
cent in 2010, to 76 per cent in 2011 and 77 per cent in 2012. This analysis provides
evidence that there is an increasing trend in the mean risk disclosures reported by
sample banks in their annual reports over the seven-year period from 2006-2012,
supporting the growing importance of such disclosure and Hypothesis 138
.
The changing level of corporate risk disclosure is consistent with the increasing
relevance of risk reporting to various stakeholders and the implementation by
government and industry of various risk reporting initiatives, all of which increased
across the period of analysis. As predicted, the results provide clear evidence of the
impact of international standards (IFRS 7 and Basel II: Market Discipline) changes and
developments that lead sample banks to respond with an increased number of risk
information items disclosed in their annual reports in what is an effectively voluntary
disclosure setting. Table 7.2 presents the average Risk Disclosure Index score across the
various risk elements. This Table is analysed in the following sections.
38
H1: There are significant differences in risk disclosure over the period under examination (2006-2012).
15Table 7.1: Average Risk Disclosure Index (RDI) score, in each year (N=30) and pooled
(N=210)
Numbers represent % of Mean RDI with 147 (maximum possible score) as
denominator
Year Pooled (N=210)
2006 (N=30)
2007 (N=30)
2008 (N=30)
2009 (N=30)
2010 (N=30)
2011 (N=30)
2012 (N=30)
Mean
RDI
62 43 50 53 62 71 76 77

179
Risk Disclosure Items
Pooled
%
N=210
2006
%
N=30
2007
%
N=30
2008
%
N=30
2009
%
N=30
2010
%
N=30
2011
%
N=30
2012
%
N=30
Trend
MARKET RISK (Qualitative disclosure)
Exposures to market risk (MR) and how they arise 73 40 60 63 83 86 88 90 Rises
Structure and risk management function(s) MR 62 20 43 43 60 87 90 93 Rises
Scope and nature of the entity's risk reporting or measurement systems of MR 66 35 50 47 63 87 90 93 Varies
MR policies for hedging and mitigating risk, including policies and procedures for
taking collateral 61 30 47 43 57 77 87 90
Varies
MR processes for monitoring the continuing effectiveness of hedges and mitigating
devices 63 30 43 40 60 80 91 93
Varies
Methods used to measure MR 53 12 27 27 50 77 87 90 Rises
MR policies and processes for on-and off-balance sheet netting 53 18 30 37 47 73 80 83 Rises
Interest income and expense for MR 51 12 27 37 50 73 79 80 Rises
MR maturity analysis of loans (i.e., 3months(m), 3m-6m, 6m-1yr,1yr-5yr, more
than 5yr) 60 40 93 97 100 100 100 100
Rises
MR maturity analysis of deposits; demand, savings(i.e., 3m, 3m-6m, 6m-1yr,1yr- 60 40 97 100 100 100 100 100 Rises
16Table 7.2: Mean Risk Disclosure Index score (per cent of max. possible [147]) by Index Item annually (N=30) and pooled (N=210)

180
Risk Disclosure Items
Pooled
%
N=210
2006
%
N=30
2007
%
N=30
2008
%
N=30
2009
%
N=30
2010
%
N=30
2011
%
N=30
2012
%
N=30
Trend
5yr, more than 5yr)
Sensitivity analysis for currency risk 56 21 33 43 57 77 80 83 Rises
Sensitivity analysis for others’ price risk 31 12 10 17 27 47 50 53 Varies
Method and assumption used in sensitivity analysis 34 11 20 13 40 43 51 57 Rises
Explanation of method used in preparing sensitivity analysis 24 9 17 13 17 27 40 43 Varies
Main parameters and assumptions underlying the data provided 27 1 7 13 27 40 51 50 Rises
Explanation of the objective of the method and parameters used 22 1 7 10 17 33 40 43 Rises
Terms and conditions of financial instruments 38 6 20 27 47 50 53 63 Rises
The effect on profit or loss if the terms or conditions were met 21 6 13 13 23 23 30 40 Rises
A description of how the risk is hedged 32 11 20 20 33 40 46 57 Rises
Information about trading financial and non-trading financial instruments 81 56 77 80 90 87 87 90 Rises
Economic environment (hyperinflation or low inflation) 81 56 70 80 87 90 91 93 Rises
Foreign exchange rates 68 35 47 50 77 83 91 90 Rises
Prices of equity instruments 49 12 23 27 40 77 82 83 Rises
Market prices of commodities 36 5 13 17 30 57 57 70 Rises

181
Risk Disclosure Items
Pooled
%
N=210
2006
%
N=30
2007
%
N=30
2008
%
N=30
2009
%
N=30
2010
%
N=30
2011
%
N=30
2012
%
N=30
Trend
Prevailing market interest rate 37 12 23 23 27 50 60 63 Rises
Currency rates and interest rates for foreign currency financial instruments such as
foreign currency bonds 39 11 27 27 40 60 53 57
Rises
A description of how management determines concentrations 49 13 37 37 47 63 71 73 Rises
If concentrated in one or more Industry sector (such as retail or wholesale) 47 26 87 90 90 97 97 97 Rises
If an entity concentrated on one or more credit quality (such as secured and
unsecured loans) and (investment grade or speculative grade) 59 26 57 60 63 67 67 70
Rises
Geographical distribution (such as Asia or Europe) 85 36 87 90 90 97 98 97 Varies
A limited number of counterparties or group of closely related counterparties 46 12 27 27 40 67 71 77 Varies
Key assumptions regarding loan prepayments and behaviour of no maturity deposits 27 2 10 10 17 43 53 57 Rises
Long term funding; convertible bonds, mortgage bonds, other bonds, subordinated
debt, hybrid capital 45 16 80 80 87 93 91 90
Varies
Total money market funding 71 36 67 70 80 87 79 80 Varies
MARKET RISK (Quantitative disclosure)
Summary quantitative data about exposure to MR at the reporting date (gross
market risk exposure, average gross exposure and major types of market exposure) 46 0 13 17 37 73 91 93
Rises

182
Risk Disclosure Items
Pooled
%
N=210
2006
%
N=30
2007
%
N=30
2008
%
N=30
2009
%
N=30
2010
%
N=30
2011
%
N=30
2012
%
N=30
Trend
Sensitivity analysis for interest risk 37 0 10 13 30 60 71 73 Rises
Sensitivity analysis for currency risk 37 2 17 20 37 60 61 63 Rises
Sensitivity analysis for other price risk 23 6 3 7 13 37 42 50 Rises
Amount of concentration of MR with shared characteristics (i.e. geographical,
region or country) 75 34 73 77 80 87 87 90
Rises
CREDIT RISK (Qualitative disclosure)
Exposures to credit risk (CR) and how they arise 58 34 90 93 97 97 98 97 Varies
Structure and risk management function(s) 89 60 87 90 93 97 97 100 Rises
CR scope and nature of the entity's risk reporting or measurement systems 73 35 63 63 77 90 91 93 Rises
CR policies for hedging and mitigating risk, including policies and procedures for
taking collateral 72 26 63 67 83 87 87 93
Rises
Processes for monitoring the continuing effectiveness of hedges and mitigating
devices for CR 74 27 70 73 80 83 91 93
Rises
Methods used to measure CR 71 24 57 67 80 87 91 93 Rises
CR policies and processes for on-and off-balance sheet netting 66 35 50 53 67 83 87 87 Rises

183
Risk Disclosure Items
Pooled
%
N=210
2006
%
N=30
2007
%
N=30
2008
%
N=30
2009
%
N=30
2010
%
N=30
2011
%
N=30
2012
%
N=30
Trend
Loans by type (government, mortgage, lease, and other loans 56 36 87 90 97 97 93 97 Varies
Policies and processes for valuing and managing collateral and other credit
enhancements obtained 26 0 10 10 23 40 42 57
Rises
Description of main types of collateral and other credit enhancements 36 12 27 27 33 47 52 53 Rises
Main types of counterparties to collateral and other credit enhancements and their
creditworthiness 33 5 13 13 23 47 63 67
Rises
Information about CR concentrations within the collateral or other credit
enhancements 40 6 20 23 40 50 72 70
Rises
Nature and carrying amount of assets obtained by taking possession of collateral
held as security or called on other credit enhancements 41 7 30 27 47 50 63 63
Varies
Definitions of past due and impaired 23 9 0 3 7 40 50 50 Varies
The nature of the counter party 30 0 10 10 13 50 60 70 Rises
Any other information used to assess credit quality 24 0 0 10 13 43 50 53 Rises
Rating agencies used for external ratings when managing or monitoring credit
quality 69 34 70 73 70 73 79 80
Varies
A description of how management determines concentrations for CR 47 12 27 27 40 67 80 80 Rises

184
Risk Disclosure Items
Pooled
%
N=210
2006
%
N=30
2007
%
N=30
2008
%
N=30
2009
%
N=30
2010
%
N=30
2011
%
N=30
2012
%
N=30
Trend
If concentrated in one or more Industry sector (such as retail or wholesale) 76 26 87 83 93 97 98 97 Varies
If an entity concentrated on one or more credit quality (such as secured and
unsecured loans) and (investment grade or speculative grade) 57 26 47 47 63 67 70 80
Varies
Geographical distribution of CR (Asia or Europe) 87 54 77 83 97 97 100 100 Rises
A limited number of counterparties or group of closely related counterparties of CR 45 12 27 30 47 50 70 80 Rises
The bank’s objectives in relation to securitisation activity, including the extent to
which these activities transfer CR of the underlying securitised exposures away
from the bank to other entities
54 14 37 40 73 67 72 77
Varies
Summary of accounting policies for securitisation activities, including: whether the
transactions are treated as sales or financings; recognition of gain on sale key
assumptions for valuing retained interests, including any significant changes since
the last reporting period and the impact of such changes
58 27 47 50 70 70 71 73
Rises
CREDIT RISK (Quantitative disclosure)
Summary quantitative data about exposure to CR at reporting date (gross credit risk
exposure, average gross exposure and major types of credit exposure) 54 13 33 40 57 73 76 87
Rises
Amount of maximum exposure to CR (before deducting value collateral) 46 8 17 27 47 67 71 87 Rises
Granting financial liabilities, grantees should be significantly greater than liability 30 12 27 27 30 40 36 37 Rises

185
Risk Disclosure Items
Pooled
%
N=210
2006
%
N=30
2007
%
N=30
2008
%
N=30
2009
%
N=30
2010
%
N=30
2011
%
N=30
2012
%
N=30
Trend
For loan commitment (irrecoverable over the life of the facility or recoverable only
in response to a material adverse change) the maximum credit exposure is the full
amount of the commitment
31 0 3 13 27 53 57 67
Rises
Amount of concentration of CR with shared characteristics (i.e. geographical, region
or country) 79 34 67 73 87 93 100 100
Rises
By class of financial assets, an analysis of the age of financial assets that are past
due as at the reporting date but not impaired. For example, time brands may be not
more than 3m, 3m to 6m, 6m to 1yr; and more than 1yr.
38 14 23 27 33 53 55 60
Rises
Amount of credit exposures for each external credit grade 34 11 13 13 33 53 57 57 Rises
Amount of an entity's rated and unrated credit exposures 28 0 10 10 20 50 55 50 Rises
The total outstanding exposures securitised by the bank and subject to the
securitisation framework (broken down into traditional/synthetic), by exposure type 53 12 40 50 53 63 73 77
Rises
Aggregate amount of securitisation exposures retained or purchased, broken down
by exposure type 37 13 23 37 33 47 50 57
Varies
Loan loss reserves 26 7 17 23 30 33 38 37 Rises
Contingent liability 94 56 100 100 100 100 100 100 Rises
Off-balance sheet item 93 54 100 100 100 100 100 100 Rises

186
Risk Disclosure Items
Pooled
%
N=210
2006
%
N=30
2007
%
N=30
2008
%
N=30
2009
%
N=30
2010
%
N=30
2011
%
N=30
2012
%
N=30
Trend
Loan loss provision 80 50 80 80 83 90 88 89 Varies
Liquidity RISK (Qualitative disclosure)
Exposures to solvency risk (LR) and how they arise 74 35 70 73 77 83 87 89 Varies
Structure and risk management function(s), including a discussion of independence
and accountability for LR 74 53 67 70 73 80 85 87
Rises
Scope and nature of the entity's LR reporting or measurement systems 60 34 50 53 53 73 75 80 Rises
LR policies for hedging and mitigating risk, including policies and procedures for
taking collateral 64 46 60 57 60 70 75 80
Varies
LR processes for monitoring the continuing effectiveness of hedges and mitigating
devices 65 50 60 60 60 73 75 80
Rises
Methods used to measure LR 54 26 40 40 53 70 73 77 Rises
LR policies and processes for on-and off-balance sheet netting 51 23 43 40 47 67 70 70 Rises
judgement to determine an appropriate number of time bands (i.e. 0-1m, 1-3m, 3m-
1yr, 1yr-5yrs) 48 12 27 30 40 67 78 83
Rises
A maturity analysis of the expected maturity dates of both financial liabilities and
financial assets 69 36 50 57 70 87 88 97
Rises

187
Risk Disclosure Items
Pooled
%
N=210
2006
%
N=30
2007
%
N=30
2008
%
N=30
2009
%
N=30
2010
%
N=30
2011
%
N=30
2012
%
N=30
Trend
Undrawn loan commitments 49 26 40 43 50 53 63 63 Rises
Readily available financial assets in liquid market to meet solvency needs 43 13 27 33 37 57 67 67 Rises
Committed borrowing facilities (e.g., commercial paper) or other line of credit
(stand-by credit facility) 58 26 40 50 63 70 75 80
Rises
Financial assets for which there is no liquid market, but which are expected to
generate cash flows (principal or interest) 29 13 23 23 27 37 47 37
Varies
Deposits at central banks to meet solvency needs 71 46 73 73 73 73 75 80 Rises
Diverse funding sources 51 24 40 40 47 60 75 70 Varies
Significant concentrations of solvency risk (assets or funding source) 48 20 40 40 43 57 65 73 Rises
A description of how management determines concentrations of LR 47 17 33 40 43 60 65 70 Rises
If concentrated in one or more Industry sector (such as retail or wholesale) 86 56 80 80 93 97 98 97 Varies
If entity concentrated on one or more credit quality (such as secured and unsecured
loans) and (investment grade or speculative grade) 63 30 63 60 67 73 75 73
Varies
Geographical distribution of LR (Asia or Europe) 83 41 77 73 97 97 98 97 Varies
A limited number of counterparties or group of closely related counterparties 41 12 23 27 40 50 65 67 Rises

188
Risk Disclosure Items
Pooled
%
N=210
2006
%
N=30
2007
%
N=30
2008
%
N=30
2009
%
N=30
2010
%
N=30
2011
%
N=30
2012
%
N=30
Trend
Liquidity RISK (Quantitative disclosure)
Summary quantitative data about exposure to LR at reporting date (gross market
risk exposure, average gross exposure and major types of market exposure) 38 0 10 17 37 63 65 73
Rises
Gross finance lease obligations (before deducting finance charges) 33 12 27 30 33 40 44 47 Rises
Amount of concentration of LR with shared characteristics (i.e. geographical, region
or country) 80 53 77 80 87 90 86 87
Varies
Detailed breakdown: treasury bills, other bills, bonds, equity investments, other
investments 90 56 90 90 97 100 100 100
Varies
Coarse breakdown: Government securities, other listed securities, non-listed
securities 84 56 83 87 90 90 91 92
Rises
Investment securities or trading securities 91 57 93 93 97 100 100 100 Rises
Deposits by type of customer; Bank deposits, municipal, government 70 59 100 100 100 100 100 100 Steady
Long term funding; Convertible bonds, mortgage bonds, other bonds, subordinated
debt, hybrid capital 91 57 97 97 97 97 98 99
Varies
Maturity analysis of deposits; demand, savings (i.e., 3m, 3m-6m, 6m-1yr,1yr-5yr,
more than 5yr) 62 46 100 100 100 100 100 100
Steady

189
Risk Disclosure Items
Pooled
%
N=210
2006
%
N=30
2007
%
N=30
2008
%
N=30
2009
%
N=30
2010
%
N=30
2011
%
N=30
2012
%
N=30
Trend
Total money market funding 73 46 70 70 80 80 82 83 Rises
Operational Risk (Qualitative disclosure)
A discussion of relevant internal and external factors considered in measurement
approach and scope and coverage of different approaches used 78 36 67 70 87 93 98 97
Varies
A description of use of insurance for the purpose of mitigating operational risk 27 0 17 17 20 43 45 50 Rises
Customer satisfaction 74 35 53 63 83 93 96 97 Rises
Product development 72 36 57 63 80 87 90 93 Varies
Efficiency and performance 83 56 70 73 90 97 97 100 Rises
Environmental 73 23 53 63 87 93 95 93 Rises
Health and safety 66 23 43 50 73 87 87 100 Rises
Equities Risk (Qualitative Disclosure)
Differentiation between holdings on which capital gains are expected and those
taken under other objectives, including for relationship or strategic reasons 42 11 20 27 27 57 74 77
Rises
Discussion of important policies covering the valuation of and accounting for equity
holdings in the banking book 57 12 33 40 57 80 90 90
Rises

190
Risk Disclosure Items
Pooled
%
N=210
2006
%
N=30
2007
%
N=30
2008
%
N=30
2009
%
N=30
2010
%
N=30
2011
%
N=30
2012
%
N=30
Trend
Equities Risk (Quantitative Disclosure)
Fair value of investment and comparison to publicly quoted share values where the
share price is materially different 70 37 63 73 73 77 83 83
Rises
The type and nature of investments, including the amount, classified as publicly
traded and privately held 87 56 87 90 93 93 96 97
Rises
The cumulative realised gain or loss arising from sales and liquidations at reporting
date 44 12 37 40 40 53 57 67
Rises
Total unrealised gain or loss 39 11 27 33 33 53 57 60 Rises
Capital Disclosure
Capital structure 92 69 87 90 100 100 100 100 Rises
Amount of Tier 1 capital (including disclosure of paid up share capital, reserves,
minority interests, capital instruments, other amounts deducted from goodwill and
investments
48 5 87 90 100 100 100 100
Rises
Total amount of Tier 2 and Tier 3 capital 83 3 87 90 100 100 100 100 Rises
Other deductions from capital 35 5 23 30 33 43 55 56 Rises
Internal corporate governance

191
Risk Disclosure Items
Pooled
%
N=210
2006
%
N=30
2007
%
N=30
2008
%
N=30
2009
%
N=30
2010
%
N=30
2011
%
N=30
2012
%
N=30
Trend
Reporting frequency (yearly, quarterly, semi-annually) 98 83 100 100 100 100 100 100 Steady
Accounting policies ( income recognition, provisioning plan, valuation policy) 77 63 90 90 100 100 100 100 Rises
Ownership structure 56 35 90 90 100 100 100 100 Rises
Remuneration policies for directors and senior management 69 39 70 70 73 77 78 79 Varies
Audit fee breakdown 53 37 53 53 53 57 57 58 Rises
Interbank borrowing costs 55 36 60 53 53 57 60 63 Varies
Authority and responsibility assignment 85 50 83 83 93 93 95 97 Rises
Access 50 40 83 83 97 97 100 100 Rises
Availability of information processing and technology 58 46 83 83 97 97 100 100 Rises
Infrastructure 85 50 80 80 93 93 100 100 Rises
Strategic Decision Risk
Strategic, operational, information and compliance objectives 59 36 87 87 97 97 98 99 Rises
Risk management philosophy 42 26 73 77 90 90 98 99 Rises
Competition in product markets 79 43 67 70 90 93 94 95 Rises
Financial Performance measurement 84 50 73 80 93 97 97 97 Rises

192
Risk Disclosure Items
Pooled
%
N=210
2006
%
N=30
2007
%
N=30
2008
%
N=30
2009
%
N=30
2010
%
N=30
2011
%
N=30
2012
%
N=30
Trend
Sovereign and political 36 12 27 33 43 43 46 47 Rises
Permanent monitoring activities and independent assessments 41 25 73 80 90 92 92 93 Rises
General Risk Information
Relationship to Government development plan 51 21 47 47 60 60 62 60 Varies
Customer acquisition process 62 26 57 57 73 73 74 75 Rises
Recruitment of qualified and skilled professionals 67 23 63 63 77 80 82 83 Rises
Natural disasters 52 36 50 50 63 53 57 58 Varies
Government Regulation
Adverse changes in government regulation, control and taxation 28 12 23 23 30 30 37 38 Varies
High degree of government regulation 50 25 47 50 57 57 57 58 Varies

193
7.2.1 Risk disclosure by key categories
Content analysis was further conducted to classify the data into sub-categories and gain
a sense of the types of risk information disclosed. The risk disclosure text was classified
and calculated into seven key categories as discussed in Chapter 6, namely i) Risk
Types (Market, Credit, Liquidity, Operational and Equities); ii) Capital Disclosure; iii)
Internal Corporate Governance; iv) Information and Communication risks; v) Strategic
Decision risks; vi) General Risk Information; and vii) Government Regulation. Table
7.3 presents the differences in Risk Disclosure Index score (in terms of average) for
these seven broad categories across the period 2006 to 2012.
Risk Disclosure Categories Pooled
N=210
2006
N=30
2007
N=30
2008
N=30
2009
N=30
2010
N=30
2011
N=30
2012
N=30
Risk Type 63 39 47 51 61 73 80 87
Capital Disclosure 79 60 71 75 83 85 88 90
Internal Corporate Governance 78 60 78 77 82 83 84 83
Information and Communication
risks 86 56 69 82 96 96 100 100
Strategic Decision risks 77 56 67 71 84 85 87 88
General Risk Information 64 52 68 54 68 67 68 70
Government Regulation 40 20 35 37 43 43 47 57
Legend: Numbers represent % of RDI with 147 (maximum possible score) as
denominator in each risk category
Table 7.3 shows an growing trend in disclosure for each of the seven broad categories
over the period. The mean percentage of risk item disclosures in each key risk category
shows a sharp increase. The Table reveals that there is an upward trend in Risk Types,
Capital Disclosure, Internal Corporate Governance, Strategic Decision risks and
Government Regulation categories. The Table shows that the average number of risk
disclosure items differs among the categories, and that there is more risk disclosure
17Table 7.3: Mean Risk Disclosure Index (RDI) score (%) by category annually (N=30) and
pooled (N=210)

194
made by banks in the Information and Communication categories in comparison to
other key categories. The minimum Risk Disclosure Index scores are in the Government
Regulation category (20 per cent in 2006 and 57 per cent in 2012). Table 7.3 further
reveals that Internal Corporate Governance and General Risk Information reduce in
2008; however these two categories increase gradually in subsequent years.
7.2.2 Risk disclosure by Risk Types
A breakdown of the data by Risk Type is described in this section. The broad Risk
Types consist of Market risk (MR), Credit risk (CR), Liquidity risk (LR), Operational
risk (OR) and Equities risk (ER) disclosures. Table 7.4 reveals the disclosure trends for
the five (MR, CR, LR, OR, ER) sub-categories under Risk Types.
Risk
Type
Year Trend
Pooled
N=210
2006
N=30
2007
N=30
2008
N=30
2009
N=30
2010
N=30
2011
N=30
2012
N=30
Market risk 56 32 39 41 53 68 76 83 Rises
Credit risk 59 36 43 47 57 68 76 84 Rises
Liquidity risk 68 51 57 59 65 75 80 87 Rises
Operational risk 70 38 51 57 74 85 90 93 Rises
Equities risk 60 38 44 51 54 69 79 87 Rises
Legend: Numbers represent % of Mean RDI with 147 (maximum possible score) as
denominator
Table 7.4 reveals the trend in the mean Risk Disclosure Index score items in each sub-
category is upward over the period from 2006-2012. The lowest mean scores for all
Risk Disclosure Index sub-categories are in 2006. The Table further reveals that mean
Market risk disclosure ranges from 32 to 83 per cent and Market risk disclosure is lower
18Table 7.4: Mean Risk Disclosure Index (RDI) score (%) by Risk Type
annually (N=30) and pooled (N=210)
195
compared to other categories based on the pooled data, followed by Credit risk, Equities
risk, Liquidity risk and Operational risk. Credit risk means range between 36-84 per
cent, Liquidity risk between 51-87 per cent, Operational risk between 38-93 per cent
and Equities risk between 38-87 per cent.
Table 7.4 further reveals a significant change in mean risk disclosure items in year
2010. The percentage growth rates, such as Market risk 16 per cent, Credit risk 11 per
cent, Liquidity risk 9 per cent and Equities risk 15 per cent (the numbers represent
changes between each year) is highest in 2010 for all categories except for operational
risk (highest 17 per cent in 2009) across the period. A further breakdown of disclosure
of Market, Credit, Liquidity, Operational and Equities risk is presented below according
to whether disclosures are qualitative or quantitative in nature.
7.2.3 Qualitative and quantitative disclosure
Table 7.5 show the qualitative (QL) and quantitative (QN) risk disclosure for each year
and pooled. Table 7.5 indicate the qualitative or quantitative nature of Market, Credit,
Liquidity, Operational and Equities mean Risk Disclosure Index scores across the
period (2006-2012). In terms of qualitative risk disclosure, Credit risk (23-79 per cent),
Market risks (19-76 per cent), Liquidity (20-77 per cent) are by far the highest sub-
categories of risk disclosed over time. Interestingly Equities risk disclosure is zero in
2006 while 83 per cent in 2012. The quantitative disclosure of Market risk ranges from
a mean of 9 per cent to 74 per cent, Credit risks range from 22 to 71 per cent, Liquidity
risk from 45 to 88 per cent, and Equities risk from 12 to 78 per cent.

196
Market risk Credit risk Liquidity risk Operational risk Equities risk
QL QN QL QN QL QN QL QN QL QN
Pooled (N=210)
54 44 58 52 57 77 68 0 48 60
2006 (N=30)
19 9 23 22 20 45 28 0 0 12
2007 (N=30)
41 77 46 40 49 75 51 0 27 62
2008 (N=30)
43 27 48 44 51 76 57 0 33 67
2009 (N=30)
41 77 46 40 49 75 51 0 27 62
2010 (N=30)
69 37 70 65 69 86 85 0 68 78
2011 (N=30)
76 74 79 71 76 88 90 0 83 78
2012 (N=30)
76 74 79 71 76 88 90 0 83 78
Legend: QL= Qualitative risk disclosure; QN= Quantitative risk disclosure. Numbers
represent % of Mean RDI with 147 (maximum possible score) as denominator.
The mean statistics for these disclosures reveal that the extent of each of qualitative and
quantitative disclosures is increasing each year. The lowest score for all risk disclosure
sub-categories is in 2006, the earliest year of GFC and the highest score is witnessed in
2012.
7.3 Descriptive statistics for the Risk Disclosure Index
This section presents the descriptive statistics for the seven key categories of the Risk
Disclosure Index. Table 7.6 presents descriptive statistics for the categorical risk
disclosures and Table 7.7 presents descriptive statistics for categories of risk disclosure
that are assessed individually in each category and aggregately in the total Risk
Disclosure Index.
19Table 7.5: Mean Qualitative and Quantitative Risk Disclosure Index
(RDI) score for each Risk Type annually (N=30) and
pooled (N=210)

197
Key Risk Categories N Min. Max. Mean Std. Deviation
Risk Type 210 25 117 77 24
Capital disclosure 210 0 4 3 1
Internal corporate governance 210 3 7 6 1
Information and communication risks 210 0 3 3 1
Strategic decision risks 210 0 6 5 1
General risk information 210 0 4 3 1
Government regulation 210 0 2 1 1
Legend: Numbers represent counts of actual disclosures
Table 7.6 shows descriptive statistics for the seven key categories of risk disclosure.
Each category represents a part of the total Risk Disclosure Index. The maximum risk
disclosure is in the Risk Types category (77 with 117 maximum) and the minimum risk
disclosure is in the Government Regulation category (2 with 0 minimum). As the Risk
Types category contains the maximum number of items, the average risk disclosures are
highest in the Risk Types. Further, it is necessary to mention that Table 7.6 represents
only the disclosed items in each category of Risk Disclosure Index.
The Table 7.7 presents the percentage of disclosed items in each category individually
(Risk Type [121 items], Capital Disclosure [4 items], Internal Corporate Governance [7
items], Information and Communication [3 items], Strategic Decision [6 items], General
Risks Information [4 items], Government Regulation [2 items]) and categorical
disclosures in the Risk Disclosure Index (147 items) aggregately. The Table shows the
maximum score is achieved in disclosures about Government Regulation and the
minimum score achieved in Risk Types. The Table indicates the highest score occurs in
the Information and Communication group (92) and the lowest average is in General
Risk Information disclosure (42). As the maximum number of items is contained in the
Risk Types group, columns 1 and 3 show the maximum disclosure is in the Risk Types
group.
20Table 7.6: Descriptive statistics for seven key categories of Risk Disclosure Index

198
N Min. Max. Mean Std.
Dev.
Risk Type in total Risk Type (121 items)
210 21 97 63 20
Risk Type (121 items) in Risk Disclosure Index
(147 items)
210 17 80 52 17
Capital Disclosure in total Capital Disclosure (4
items)
210 0 100 82 20
Capital Disclosure (4 items) in Risk Disclosure
Index (147 items)
210 0 0 0 0
Internal corporate governance in total Internal
corporate governance (7 items)
210 43 100 81 15
Internal corporate governance (7 items) in Risk
Disclosure Index (147 items)
210 0 0 0 0
Information and Communication in total
Information and Communication (3 items)
210 0 100 93 25
Information and Communication (3 items) in Risk
Disclosure Index (147 items)
210 0 0 0 0
Strategic decision in total Strategic decision (6
items)
210 0 100 80 24
Strategic decision (6 items) in Risk Disclosure
Index (147 items)
210 0 0 0 0
General risk information in total General risk
information (4 items)
210 0 100 63 36
General risk information (4 items) in Risk
Disclosure Index (147 items)
210 0 0 0 0
Government regulation in total Government
regulation (2 items)
210 0 100 42 38
Government regulation (2 items) in Risk
Disclosure Index (147 items)
210 0 0 0 0
21Table 7.7: Descriptive statistics for seven key categories individually in each category
and aggregately in the total Risk Disclosure Index

199
The Table further reveals that the Risk Types dominates the other groupings within the
Risk Disclosure Index, as the highest number of items is included in this category. The
highest mean (52 with 80 maximum) is under the Risk Types group and the lowest is in
the Government Regulation (1 with 0 minimum) group.
7.4 Comparison of Risk Disclosure Index over the period: Univariate
analysis (t-tests and ANOVA)
An earlier section (section 7.2) of this Chapter shows that the mean overall Risk
Disclosure Index score as a percentage of the total possible items (147) increased from
43 per cent in 2006 to 77 per cent in 2012. This section examines statistically the
differences between disclosures over the seven-year period in order to test whether
significant differences exist in the level of risk disclosure across the period (2006-2012).
7.4.1 Significance of Risk Disclosure Index over the period: ANOVA
To compare the mean score from different periods (2006-2012), one-way analysis of
variance (ANOVA) is performed. Table 7.8 shows the mean Risk Disclosure Index
score by year ANOVA.
Year 2006 2007 2008 2009 2010 2011 2012 F Sig.(2-
tailed)
Mean 0.430 0.500 0.527 0.621 0.710 0.764 0.773 23.155 0.000
N 30 30 30 30 30 30 30
Table 7.8 highlights that the Risk Disclosure Index mean percentage increases in each
sample year and that there is a statistically significant difference at the p < .01 level in
the Index for the period from 2006-2012. Appendix 7.1 indicates analysis of post hoc
22Table 7.8: Risk Disclosure Index (%) by year ANOVA

200
Tukey statistics by year that reveals the level of the Risk Disclosure Index score is
significant mostly at the 5% level with some at the 10% level. The Tukey statistic also
suggests that the Risk Disclosure Index mean percentage is lower in 2006 to 2008
compared to that in 2009-2012.
7.4.2 Conventional (Non-Islamic) and non-conventional banks (Islamic)
Table 7.9 reports the average Risk Disclosure Index and their differences between
conventional (23 banks: 23*7=161) and non-conventional (7 banks: 7*7=49) banks.
Legend: RDI as a mean percentage score compared to maximum possible score (147)
*49 non-conventional banks represent 23% of total observations
Table 7.9 shows that conventional banks on average disclose more risk items compared
to their non-conventional counterparts and the differences are statistically significant.
The difference implies that shareholders of non-conventional banks do not demand of
their invested banks that they follow international disclosure standards or that non-
conventional banks prefer not to disclose their potential risk information, or a
combination of both.
23Table 7.9: Mean difference in Risk Disclosure Index (RDI) between conventional
and non-conventional (Islamic) banks (2006-2012)
Banks Mean RDI
Numbers represent % of Mean RDI
Conventional (n=161) 0.69
Non-conventional (n=49)* 0.56
Difference 0.13
t-statistic 4.25
p-value 0.000

201
7.4.3 Comparisons of pre- and post GFC periods
Both parametric tests (paired sample t-tests) and non-parametric (e.g., Wilcoxon signed-
rank tests) are conducted to test whether the differences among the years examined are
significant. In a global context, three different periods are observed in Table 7.9, the
GFC (2007-2008), transition (2009-2010) and post-GFC (2011-2012) periods.
Wilcoxon signed rank tests are designed for repeated measures. The Wilcoxon signed-
rank test is a non-parametric test and involves comparisons of differences between two
populations (Pallant 2010). Table 7.10 shows that there are significant differences in the
Risk Disclosure Index between years 2007-2008, 2009-2010 and 2011-2012. Thus, it
can be concluded that the three sets of risk disclosure scores are significantly different
from each other. The results are reported in Table 7.10.
Test Statisticsa
RDI_2007 - 2008 RDI_2009-2010 RDI_2011 -2012
Z -3.731b -4.465
b -4.796
b
Asymp. Sig. (2-tailed) .000 .000 .000
a. Wilcoxon Signed Rank Test
b. Based on negative ranks
Legend: RDI as a mean percentage score compared to maximum possible score (147)
The Wilcoxon Signed Rank Test in Table 7.10 reveals a statistically significant level of
risk disclosure in the three periods, Z= -3.73(2007-2008), -4.465 (2019-2010) and -
4.796 (2011-2012) with p <.001.
A paired sample t test was also performed to determine if there are any significant
differences between the mean percentage levels of Risk Disclosure Index score across
the periods. The results are presented in Table 7.11. The Table indicates results for the
24Table 7.10: Wilcoxon Signed Rank tests

202
paired sample t tests. There is a significant increase in mean Risk Disclosure Index
score from 2007-2008 to 2009-2010 by 6.16 with p <.001 (2 tailed).
Legend: RDI as a mean percentage score compared to maximum possible score (147)
Moreover, in comparison to 2009-2010 in 2011-2012 the Risk Disclosure Index
increases with a p value < 0.01. The Eta squared statistic (refer Appendix 7.2) indicates
a large effect size in each of the three periods. The largest effect occurs with a
substantial difference in Risk Disclosure Index score in the transitional period (2009-
2010).
Table 7.12 presents a paired sample t-test to examine if there is a significant difference
between the average level of risk disclosure in year 2006 (pre-GFC period) and year
2007 (GFC period). There is a significant increase in the mean percentage Risk
Disclosure Index score from 2006 to 2007 with p <.001 (2 tailed). The mean difference
in the two scores is 0.068, with a 95 per cent confidence interval stretching from a lower
bound of 0.05 to 0.09.
39
The guideline proposed by Cohen (1988, pp. 284-7) for interpreting the values is .01= small effect,
.06= moderate effect, .14= large effect
25Table: 7.11 Paired sample t tests of mean RDI (%) across discrete periods
Period Mean t df Sig.(2-
tailed)
Eta
squared
Effect 39
RDI_2007 –
RDI_2008
0.027 2.706 29 .011 0.201 Large
effect
RDI_2009–
RDI_2010
0.088 5.732 29 .000 0.531 Large
effect
RDI_2011–
RDI_2012
0.010 2.921 29 .007 0.227 Large
effect

203
Period Mean t df Sig. (2-tailed)
RDI_2006 - RDI_2007 .068 8.609 29 0.000
Legend: RDI as a mean change score compared to maximum possible score (147)
Thus, the evidence presented here suggests that there is a significant increase in risk
disclosure over the period under examination, 2006-2012. This result supports
Hypothesis 1 (H1: There are significant differences in risk disclosure over the period
under examination, 2006-2012).
7.5 Discussion of results
Risk disclosure information is useful to investors who need such information to aid
them in making informed decisions (Linsley & Lawrence 2007; Solomon et al. 2000).
Following the comparisons made over the period 2006-2012, the general observation is
that there is an aggregate trend of an increasing score for corporate risk disclosure in the
banking industry in Bangladesh in an effectively voluntary institutional setting. The
increase in the upward trend is consistent with the increased importance of disclosure of
risks and uncertainties as well as the increased attention given to the topic by
international standard setters. The increase is also statistically significant between the
periods examined. Overall, the findings reported in this Chapter are consistent with the
predictions of theory, accounting regulatory developments and increased calls for
improved disclosure.
The content analysis in this Chapter provides an interesting insight into the nature and
quality of risk information disclosed (e.g. qualitative versus quantitative) by sample
banks in this study. This Chapter reveals that each category of risk disclosure is
increasing; however, Information and Communication risks dominate the upward trend
compared to the other six categories. Risk Types, Capital Disclosure, Strategic
Decisions and Government Regulation showed only slight change. Changes in the
26Table 7.12: Paired sample t-tests

204
Internal Corporate Governance and General Risk Information categories vary (both
upward and downward) throughout the period.
The sub-category risk categories under Risk Types suggests a significant upward trend
in Credit, Market and Liquidity risk disclosure categories from 2006 to 2010 whilst the
increasing rate decreases in the following years (2011-2012) for these categories. The
other two sub categories (Operational and Equities) also rise, though the increasing rate
varies over the period.
The qualitative and quantitative natures of risk disclosure show different trends in
changes between different years. Market and Equities risk disclosure suggest that
qualitative risk disclosure increases clearly across the period. Qualitative risk disclosure
also increases for Credit, Liquidity and Operational risk disclosure except for the year
2008. Only Equities risk shows a clear upward trend for quantitative disclosure.
Additionally, quantitative risk disclosures were lowest in year 2008 for all types (except
Equities). This is also validated when quantitative disclosure of Market risk was highest
in 2007.
The statistical tests reported in this Chapter demonstrate significant differences in risk
disclosure scores across the years. Moreover, on average, Non-Islamic banks disclose
more items compared to Islamic banks. This Chapter compares the total seven-year
period in three distinct periods (GFC, transition and post-GFC). Both parametric and
non-parametric statistical tests suggest the significance and large size effect of
disclosure changes across these three periods. The eta squared suggests the highest
effect (53.11 per cent) occurs during the transition time.
7.6 Chapter conclusion
This Phase of the broader study provides a contribution to the financial reporting
literature as it offers an overview of the risk reporting practices of all listed banks in
Bangladesh across the seven-years, encompassing pre- and post the GFC. This Phase
employs a content analysis research methodology to investigate risk disclosure

205
practices. A disclosure category taxonomy was developed to classify the types of risk
disclosure by all banks. The findings from this exploratory research suggest an
increasing trend in banks’ risk reporting disclosure as predicted.
The analysis reveals significant changes in risk information disclosed by sample banks
over the period. The results also show a general increase in all types of risk disclosure
including Risk Types, Capital Disclosure, Internal Corporate Governance, Information
and Communication risks, Strategic Decision risks, General Risk Information and
Government Regulation categories. Tests of statistical analysis were carried out and
there are significant differences in risk disclosure scores across the period. In addition,
Non-Islamic banks disclose more risk items compared to Islamic banks.
The increase in risk disclosure could be because of increasing international regulation
through international standards that suggest disclosing information related to risks,
although there is no effective, enforced mandate in Bangladesh. Previous studies also
suggest that accounting regulations and market discipline are important factors driving
improvement in voluntary disclosure (Aebi, Sabato & Schmid 2012; Samad 2008).
Banks increase their voluntary disclosure to avoid additional requirements that are
detailed and perhaps costly requirements by regulators and accounting standards.
The results presented in this Chapter will be utilised in the following Chapters in order
to conduct further analysis in order to investigate the link between risk disclosure and
companies’ characteristics and sample banks’ performance. It is important to note that
the relation between the Risk Disclosure Index and the predictors is further analysed
through direct communications with regulators and banks’ representatives. The next
Chapter examines this qualitative interview data in order to enhance insights to the
findings from the quantitative risk disclosure data collected from annual reports.

206
CHAPTER 8: An Exploration of Banks’ Risk Disclosure Practices and
their Determinants in Bangladesh: Qualitative Analysis
of Interview Data
8.1 Introduction
Results from Phase One of this study (Chapter 7) found that although there was an
increasing risk disclosure trend over the period of analysis (from 2006 to 2012),
consistent with Hypothesis 140
, there was still minimal risk disclosure practices
exercised by banks in Bangladesh compared with an optimal level compiled from
international standards. Previous research also evidenced that although there is an
increasing trend in risk disclosure in annual reports, it remains at disappointing levels.
For example, Oliveira, Rodrigues and Craig (2011, p.818) argued that ‘prior studies
have found that risk disclosures are vague, generic, qualitative, backward looking, and
inadequate for the information needs of stakeholders’. Given that, it does seem
reasonable that corporate representatives’ opinions will be particularly important in
better understanding the current practices of corporate risk disclosure and their key
determinants.
The systematic presentation of qualitative data results in greater depth and richness of
data than would be attained from purely quantitative data within the context of
corporate risk disclosure by listed banks in Bangladesh. Therefore, this Chapter aims to
explore the perceptions of corporate representatives in relation to corporate risk
disclosure practices and their determinants. To achieve this objective, this study
provides qualitative data from in-depth interviews with senior executives of the
Bangladesh Securities and Exchange Commission, the Bangladesh Bank (Central Bank)
and risk management and reporting units from different listed banks within the sample
for this study.
40
H1: There are significant differences in risk disclosure over the period under examination (2006-2012).
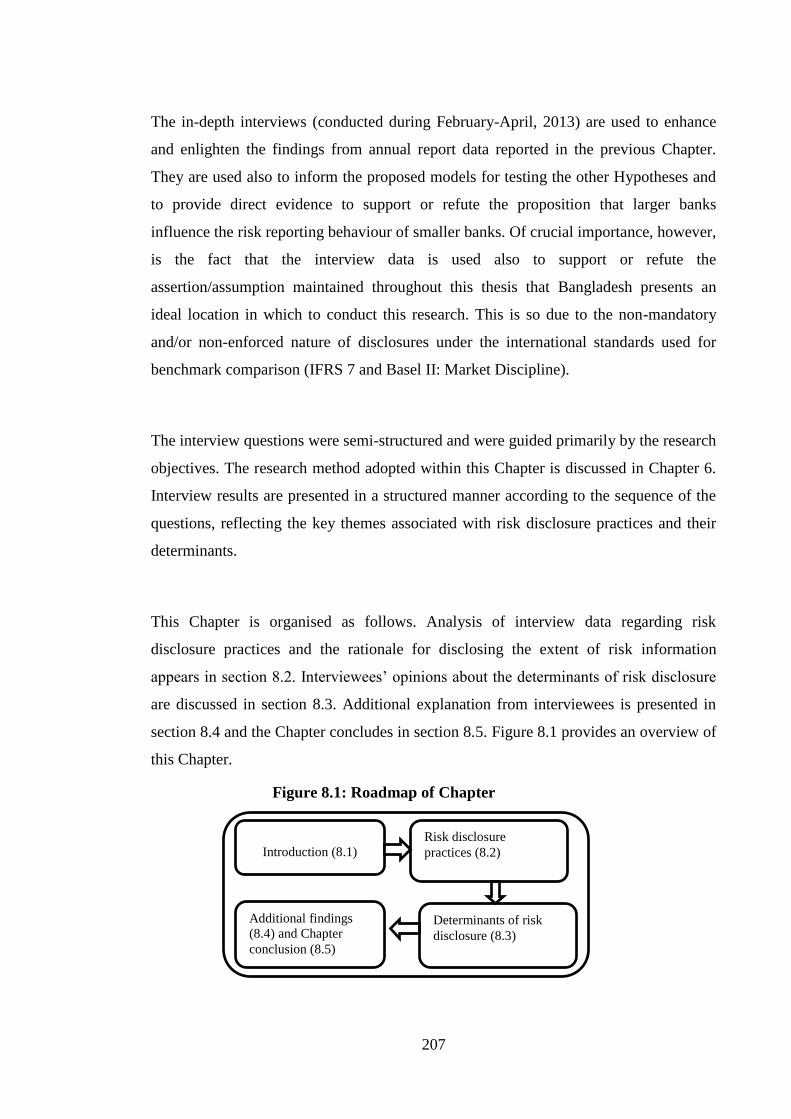
207
The in-depth interviews (conducted during February-April, 2013) are used to enhance
and enlighten the findings from annual report data reported in the previous Chapter.
They are used also to inform the proposed models for testing the other Hypotheses and
to provide direct evidence to support or refute the proposition that larger banks
influence the risk reporting behaviour of smaller banks. Of crucial importance, however,
is the fact that the interview data is used also to support or refute the
assertion/assumption maintained throughout this thesis that Bangladesh presents an
ideal location in which to conduct this research. This is so due to the non-mandatory
and/or non-enforced nature of disclosures under the international standards used for
benchmark comparison (IFRS 7 and Basel II: Market Discipline).
The interview questions were semi-structured and were guided primarily by the research
objectives. The research method adopted within this Chapter is discussed in Chapter 6.
Interview results are presented in a structured manner according to the sequence of the
questions, reflecting the key themes associated with risk disclosure practices and their
determinants.
This Chapter is organised as follows. Analysis of interview data regarding risk
disclosure practices and the rationale for disclosing the extent of risk information
appears in section 8.2. Interviewees’ opinions about the determinants of risk disclosure
are discussed in section 8.3. Additional explanation from interviewees is presented in
section 8.4 and the Chapter concludes in section 8.5. Figure 8.1 provides an overview of
this Chapter.
25Figure 8.1: Roadmap of Chapter
Introduction (8.1)
Risk disclosure
practices (8.2)
Determinants of risk
disclosure (8.3)
Additional findings
(8.4) and Chapter
conclusion (8.5)

208
8.2 Risk disclosure practices and rationale for disclosure
The interviews began by seeking a general understanding of the bank’s risk disclosure
practices and rationale for disclosing the level of information currently being provided.
The initial review of interview transcripts reveals a significant degree of consistency
among the respondents. Consistent with the maintained assertion throughout this thesis
alluded to in the introduction, respondents indicated that their risk disclosure practices
are voluntary. In relation to their perceptions of change in risk disclosure over time,
some of the respondents stated that:
Professionalism in risk reporting is yet to develop in (the) Bangladesh market. Till now
risk disclosure is voluntary exercise and often not used as business tool. (Interviewee #
12)
…..certainly, there is an increased interest of risk reporting from stakeholders. If you go
back to the early 2000s, we did not receive any guidelines (about risk disclosure) from
Bangladesh Bank (Central Bank). But certainly, the last few years have seen an
increase in stakeholders’ interest, not just about what our risk management structure(s)
are, but what risk governance policies we use internally to manage our risk profile.
Therefore, there is a lot more interest from the regulatory bodies about how we are
managing our assets and liabilities and those sorts of things. (Interviewee #3)
I think we are seeing an increase in interest from the Central Bank for risk disclosure
about how we assess risk, how do we monitor risk and how do we manage our risk
appetite. I think what you have probably found in our annual reports is that the change
in reporting is based on the increasing reform of International Financial Reporting
Standards. (Interviewee #5)
The above quotes identify managers’ perceptions about the changing expectations of
stakeholders regarding provision of risk information. The quotes also reveal a perceived
change in stakeholders’ interest that has moved to demanding information about how
companies manage their risk profile via their governance policies. However, the current
risk disclosure in annual reports is still at a low level. Corporate bank representatives’

209
responses in relation to current risk disclosure by banking institutions are illustrated as
follows:
…..better assessment of risk required timely, accurate and reliable
information…..however, most of the bank(s) does (do) not use sophisticated risk
analysis or assessment software, tools or technique(s). Therefore, in absence of timely,
accurate and reliable information, corporate risk management practices is(are) partially
effective at assessing risk but not appropriate for proper risk management and reporting.
(Interviewee #13)
Another interviewee provided a similar view.
The credit risk computation of expected loss is not yet a practice in banks in
Bangladesh. The quantification of market, liquidity, operational and equities are
stipulated by Central Bank limitation (little guidance on quantification). (Interviewee
#7)
The above quotes identify managers’ perceptions about the lack of risk reporting
practices by banking institutions in Bangladesh. The quote immediately above also
supports the earlier discussion in this study (Chapter 3 Bangladesh: The Context of the
Study) in relation to institutional weaknesses. Under the prevailing regulatory
frameworks in Bangladesh, there is a lack of appropriate monitoring for implementation
of International Financial Reporting Standards (Sobhani, Amran & Zainuddin 2012).
Apart from this, non-compliance with the standards is often not reported and
disciplinary action is seldom instituted in Bangladesh (Chowdhury 2012).
At this stage of the interviews, the participants were advised about the ‘Risk Disclosure
Index’ (RDI), prepared in Phase One of the broader study, which includes different
types of risk disclosure comprising 147 specific risk-related items (refer Chapter 6,
Table 6.2). The researcher provided the interviewees with a copy of the Index
containing the list of information items. The objective was to find out whether the
respective bank representatives were aware of the item of risk disclosure with respect to
the international standards. Responses tended to show that despite the expectations of
the stakeholders, much of the information within the Index was missing from their own
annual reports. Typical responses included:
210
I am sure that there are(is) some information missing. This is because there is a
conceptual gap between rules and practices. Bangladesh Bank did not provide us any
circular or directives on International Financial Reporting Standards. Currently,
Bangladesh Bank and Institute of Chartered Accountants of Bangladesh are working on
this and it does mean that we will consider this in the process. (Interviewee #5)
Information regarding market discipline (Basel II) and the responsibilities/duties of the
risk management division/unit need to be clear. (Interviewee #14)
The above quote identifies less disclosure with respect to Risk Disclosure Index items.
However, the Index is developed based on International Financial Reporting Standard 7
(IFRS 7) [Financial Instruments: Disclosures] and Basel II (Market discipline). Refer
to previous Chapters (Chapter 1, 2) IFRS 7 was issued in 2005 to become effective in
January 2007 and Basel II (Market discipline) in 2004, though; the interviewees were
conducted in 2013.
8.3 Determinants of risk disclosure
Based on the responses discussed in Section 8.2 about the current practices of corporate
risk disclosure, corporate representatives were asked to explain the motivations for such
disclosure. At this stage, the interviewee participants were advised about the underlying
factors, which were identified using agency and institutional isomorphism concepts (see
Chapter 5 Theoretical Perspective Underpinning the Research: Conceptual Framework
and Hypotheses) within this study. In addition to that, as the interview was conducted
with semi-structured questions, respondents were left to provide their opinion
voluntarily. The interviewees were asked whether, in their opinion, an independent
board, an independent audit committee, the number of risk committees, the debt to
equity ratio, total assets and the presence of a risk management unit are associated with
the risk disclosure practices of banking institutions in Bangladesh. The initial interview
transcripts indicated that interviewees’ opinions about the determinants of risk
disclosure were aligned with the model proposed in Chapter 5 to test Hypotheses 2-741
.
41
H2: The number of independent directors on the board is associated positively with the extent of risk
disclosure. H3: The number of independent directors on the audit committee is associated positively with
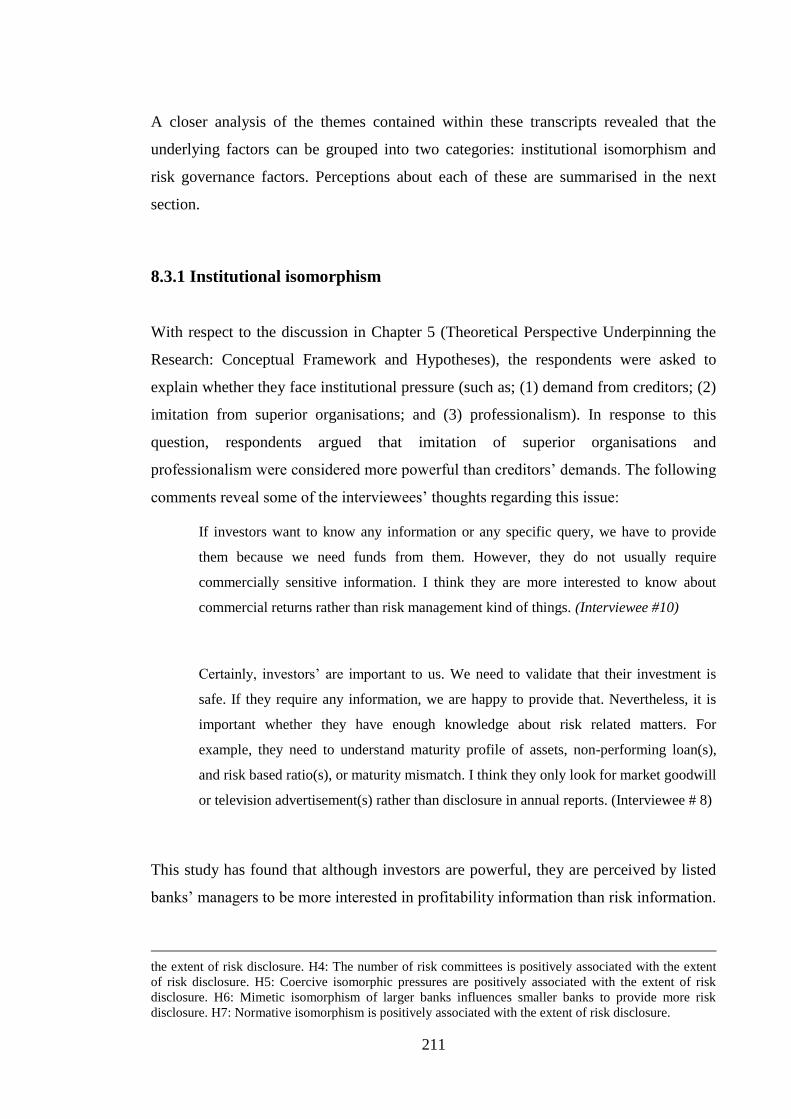
211
A closer analysis of the themes contained within these transcripts revealed that the
underlying factors can be grouped into two categories: institutional isomorphism and
risk governance factors. Perceptions about each of these are summarised in the next
section.
8.3.1 Institutional isomorphism
With respect to the discussion in Chapter 5 (Theoretical Perspective Underpinning the
Research: Conceptual Framework and Hypotheses), the respondents were asked to
explain whether they face institutional pressure (such as; (1) demand from creditors; (2)
imitation from superior organisations; and (3) professionalism). In response to this
question, respondents argued that imitation of superior organisations and
professionalism were considered more powerful than creditors’ demands. The following
comments reveal some of the interviewees’ thoughts regarding this issue:
If investors want to know any information or any specific query, we have to provide
them because we need funds from them. However, they do not usually require
commercially sensitive information. I think they are more interested to know about
commercial returns rather than risk management kind of things. (Interviewee #10)
Certainly, investors’ are important to us. We need to validate that their investment is
safe. If they require any information, we are happy to provide that. Nevertheless, it is
important whether they have enough knowledge about risk related matters. For
example, they need to understand maturity profile of assets, non-performing loan(s),
and risk based ratio(s), or maturity mismatch. I think they only look for market goodwill
or television advertisement(s) rather than disclosure in annual reports. (Interviewee # 8)
This study has found that although investors are powerful, they are perceived by listed
banks’ managers to be more interested in profitability information than risk information.
the extent of risk disclosure. H4: The number of risk committees is positively associated with the extent
of risk disclosure. H5: Coercive isomorphic pressures are positively associated with the extent of risk
disclosure. H6: Mimetic isomorphism of larger banks influences smaller banks to provide more risk
disclosure. H7: Normative isomorphism is positively associated with the extent of risk disclosure.

212
The corporate representatives further revealed their perception that lack of knowledge
limits investors’ understanding of risk assessment.
Another institutional isomorphism concept concerning risk disclosure is mimetic
isomorphism. Earlier discussion about mimetic isomorphism in Chapter 5 (Theoretical
Perspective Underpinning the Research: Conceptual Framework and Hypotheses) is
based on the Hypothesis that larger banks influence smaller banks to provide more
information. Responses include:
Definitely, we do follow better reporting format from others. Usually, big banks publish
better reports and communicate much information. We do follow their annual reports,
as they are successful and visible to stakeholders. (Interviewee #6)
Institute of Chartered Accountants of Bangladesh declares national awards for the best-
published annual report. It is our practice to look at best-awarded report as a
sample..........to my knowledge basically, large market share banks receive those awards.
It seems to me that larger banks disclose better. (Interviewee # 4)
The answers provided by the corporate representatives reveal smaller banks follow
larger banks’ reporting, consistent with the Hypothesis (H5: Mimetic isomorphism of
larger banks influences smaller banks to provide more risk disclosure.) posited in
Chapter 5. It is not possible to provide empirically derived evidence in relation to this
Hypothesis because it is not possible from secondary data to discern motivations for
actions by smaller banks in relation to their disclosures. Extant studies find that
disclosure of risk information assists companies in managing their reputation and public
visibility (Abraham & Cox 2007; Oliveira, Rodrigues & Craig 2011). This could
encourage smaller banks to disclose greater risk information. However, costs are
associated with disclosing information, which bigger banks can manage more easily.
One respondent though argued that cost of disclosure is not that material as it is a part of
a ‘business as usual’ approach:
There are costs associated with reporting, but it is not significant in relation to all other
costs. For example, it can reduce monitoring costs and information gap between the
shareholders and managers. (Interviewee # 1)

213
Regarding normative isomorphism, respondents indicated that professionalism is a
crucial influence in explaining risk disclosure: banks seem to execute their specialised
knowledge and expertise through professionalisation. In the context of the theoretical
aspects (see Chapter 5 Theoretical Perspective Underpinning the Research: Conceptual
Framework and Hypotheses) of normative isomorphism, the respondents contended that
banks exercise professionalism by establishing a risk management unit. They further
argued that the risk management unit not only conducts stress testing for examining the
banks’ capacity in handling future shocks, but also deals with all potential risks that
might occur in future. The following comments reveal some of the interviewees’
thoughts regarding this issue:
We adopted policies that deal with managing different operational risk, internal control
and compliance-division in conjunction with the Risk Management Unit (RMU). RMU
has been performing the supervisory and monitoring works to manage operational risk.
(Interviewee # 10)
A similar view is provided by interviewees 8 and 11.
Certainly, (the) Risk Management Unit is putting its best effort roles and
responsibilities of individuals involved in risk taking as well as managing it. We formed
a separate Risk Management Unit to formulate of overall risk assessment and
management policies, methodologies, guidelines, and procedures for risk identification,
risk measurement, and risk monitoring. (Interviewee # 8)
(The) Risk Management Unit in our bank is arranging monthly meeting on various
issues to determine strategies in consistency with risk management policy, which can
measure, monitor and maintain acceptable risk level of the bank and plays an advisory
role for risk reporting. (Interviewee #11)
The above statements emphasise that risk management units address different areas of
risk and risk mitigation management tools and techniques guided by experienced and
knowledgeable members. The respondents claimed that risk management units prepare
quarterly minutes addressing different areas of risk and also develop a procedure for
measuring inclusive capital adequacy in relation to bank risk summary and policy to

214
maintain the bank capital at an adequate level following the Risk Based Capital
Adequacy guideline from Bangladesh Bank (Bangladesh Bank 2013b).
8.3.2 Risk governance factors
Discussion in Chapter 5 argued that an effective monitoring system could reduce
information asymmetry between shareholders and managers that depends on an
independent board, independent audit committee and number of risk committees.
Corporate respondents were asked whether, in their opinion, these factors are associated
with risk disclosure. Based on responses by the corporate representatives, the risk
committee is an important determinant in explaining corporate risk disclosure.
Additionally, most of the interviewees mentioned that board independence is a partially
effective determinant. However, none of the respondents pointed to audit committee
independence as a crucial factor for risk disclosure. The following comments reveal
some of the interviewees’ thoughts regarding this issue:
Our initiatives for corporate risk disclosure come from internal risk governance factor,
such as risk committee. The members in risk committee come from very distinguished
educational backgrounds and they are responsible for managing all risks types across
the bank. By identifying, monitoring and managing the banks’ current and potential
operational risks exposure, risk committees inform internal audit and executive board of
issues affecting operational risks. (Interviewee #09)
We established risk committees to support effective risk governance throughout the
organisation. They are responsible for determining general principles for measuring,
managing and reporting the bank’s risks. They also develop risks policies for business
units and determine the overall investment strategy. (Interviewee # 06)
The above quotes emphasise the importance of risk committees in risk identification and
risk communication. The quotes also reveal that by establishing risk committees, banks
are more likely to create a risk management framework and follow up on reports
prepared by internal audit and inform the executive board of issues. A previous study
found the effectiveness of risk committees in overseeing all relevant risks within the

215
organisation (Aebi, Sabato & Schmid 2012). However, the effectiveness of risk
committees depends on whether members of risk committees are knowledgeable
members.
Regarding board independence, most respondents indicated that an independent board is
a crucial determinant for risk disclosure. They emphasised independent boards, and
members’ educational background and personal attributes in making corporate risk
disclosure decisions. For example, independent directors on the board are more highly
educated and are more aware of risk related issues, and the market demand for such
disclosure. Responses include:
I think independent member(s) in(on) the board is considered as one of the important
for governance mechanisms. We believe (a) higher proportion in the independent
directors in the board develop(s) our relationship with stakeholders. (Interviewee # 02)
Our driving force for corporate risk disclosure is that we have adequate independent
members in(on) the board. They provide our management with their better advice due to
their experience, expertise and network. (Interviewee #01)
The answers provided by corporate representatives reveal that a higher proportion of
board independence leads to higher monitoring. Using their experience, independent
directors monitor the opportunistic behaviour of management independently and
provide a larger number of risk disclosures. Previous studies found inconclusive results
in relation to board independence and voluntary disclosure. For example, some studies
found that higher percentage of independent directors leads to higher quality
management decisions (Chen & Jaggi 2000; Pearce & Zahra 1992). Other studies found
that a large percentage of independent directors lead to excessive monitoring (Baysinger
& Butler 1985; Eng & Mak 2003). Typical responses included:
Well…. to me it is not possible to make (the) board independent. Most of the members
in(on the) board are either politically influenced and/or corrupted. For example, when

216
the central bank sent an observer to a weak bank (according to CAMELS42
rating) and if
the observer asks for any suggestion that needs to be acted upon, board has a tendency
to avoid the situation using political power. (Interviewee #12)
8.4 Additional findings from interviewee
This section presents the additional and alternative explanations that might emerge from
the interview data. Section 8.2 revealed the existence of an expectation gap in relation to
corporate risk disclosure. With this issue in mind, corporate representatives were asked
to explain ‘why banks are not providing more information’. In response to these
questions, the rest of this Chapter provides a discussion in relation to corporate risk
disclosure practices by banking institutions in Bangladesh.
8.4.1 Institutional weakness
The corporate representatives in this study revealed that legal and institutional weakness
exists in corporate risk reporting by banking institutions in Bangladesh. Previous study
also identified this impediment towards adoption of a Western-style corporate
governance model. For example, Siddiqui (2010) identifies institutional weaknesses in
Bangladesh as, ‘highly concentrated ownership structure, lack of shareholder activism,
presence of a weak capital market, absence of second-order institutions and poor legal
structure’ (p. 209). One respondent shared his experience as:
Certainly corporate governance issues exist in overall system. Recently we faced
‘Hallmark loan Scandal43
’. I think this is not only the one. If proper and through
investigations and comprehensive audit are conducted many more Hallmarks may come
into light, which may put the entire banking sector in an embarrassing situation and the
confidence of the depositors may go shattered. (Interviewee #11)
42
CAMELS is an international bank rating system based on capital adequacy (C), Asset quality (A),
Management quality (M), Earnings (E), Solvency (L), Sensitivity to market (S). Central bank assigns
scores to each bank to identify whether banks need attention (refer. Chapter 3) 43
In the country’s biggest banking scam, the Hallmark Group embezzled around Tk 1,492 crore.
According to the Anti-Corruption Commission findings, the ‘Hallmark Group’ in liaison with bank
officials opened 2.3 Letter of Credits (LC) a minute, whilst usually this needs a minimum of 1.3 to 2
hours for creating one new LC. The Commission said that it was a lone example in the country’s history
that so many LCs were opened in a day (Progress Bangladesh 2014).

217
Several studies have identified that boards of directors in Bangladesh are dominated by
family members (Hopper et al. 2003; Siddiqui 2010; Uddin & Choudhury 2008b). They
keep the majority of the shareholding within their family connections, which means that
a small number of shareholders control the majority of shares and attain major
decision-making status (Bangladesh Enterprise Institute 2003). For example, Hopper et
al. (2003) observed that if a father who became chairperson then other family members
became chief executive officer, executive director and marketing director. Thus, the
whole family became members of the board of directors. However, minority
stakeholders need to be included in making economic decisions in relation to allocation
of economic resources (Darmadi & Sodikin 2013). A corporate representative in this
study noted:
….in reality, this family (showing directors’ pictures from annual report) is managing
our business affairs. I should say they play the advisory role even they don’t have
specialised knowledge. In fact, independent directors often follow sponsor directors’
advice. (Interviewee #13)
The quote above reveals that in practice, banks are virtually controlled and managed by
a few sponsors. Uddin and Choudhury (2008b) observed that owners of banks in
Bangladesh completely control management activities. Additionally, family members
(hence directors) could instruct their financial reporting devision to make favourable
annual reports and are hardly monitored by the Bangladesh Securities and Exchange
Commission or by the Registrar of Joint Stock Companies (Khan 2004; Uddin &
Hopper 2003; Ali, Ahmed and Henry 2004).
According to the Companies Act 1994 (Section 213), auditors are required to provide
their view on the truth and fairness of the state of accounts. However, the responses
from corporate representatives in this study reveal that their (audit) report is
questionable. Typical responses include:
Well, who wants to lose client when audit fees are very poor? They (auditor) sign
whatever we produce. The true and fair view statements are nice words in annual report
only rather in real practice. (Interviewee #3)

218
Another interviewee provided a similar view.
Theoretically, external auditors are independent. But unfortunately, external auditors do
not have power. They just sign the internal auditors’ report. (Interviewee #11)
The quote above reveals perceived auditors’ non-compliance with the true and fair
declaration. Previous study also found incompetence in external audit firms (Hopper et
al. 2003; Uddin & Choudhury 2008b) and lack of adequate disclosure (Ahmed &
Courtis 1999; Ahmed & Islam 2004). Furthermore, Uddin and Choudhury (2008b,
p.101) provided evidence that ‘banks are very lucrative clients and in most cases the
audit firms are also linked with the personal businesses of the bank owners. As a result,
the auditors tend to give in to the demands of the bank owners and prepare audit reports
in the way the banks want them to’. Besides, Uddin and Choudhury (2008b) further
revealed that majority of the banks’ internal audit reports demonstrated fraud
information. One respondent commented as:
For true and value representation of information and to maintain auditors’
independence, we need transparent internal control system…also external auditor need
to be appointed externally (such as Government) as third party…and finally we need to
think about audit fee. (Interviewee #9)
8.4.2 Political interference
Discussion in Chapter 2 (Risk Reporting is an Issue of Concern) revealed that the
political economy in Bangladesh is distinguishable by a number of economic,
traditional, and political relationships that make it distinct from general Anglo-
American context. The political environment in Bangladesh is based on patron-client
relationships (Sobhan & Ahmad 1980). This suggests that colonial heritage, the
economic policies of the British colonial government and the economic position of
different ethnic groups before and after independence, have all influenced the growth
and development of political and business relationships in Bangladesh. Bliss and Gul
(2012) also revealed that politically patronage firms are positively associated with debt
financing.
219
It emerged from the responses that political interference implements undue influence on
board governance. This was raised as:
It is impossible for us to take into account the information needs of too many
stakeholders. If we do so, we would not be able to fulfil our main obligations. We
disclose relevant level of information and decide what should be included in order to
meet reporting requirements. (Interviewee #1)
The Central Bank sends observers to weak banks. However, what can Central Bank
does when the board itself has a motive to implement their decision using political
influence? …law exists literally but in reality, it is difficult to exercise Central Bank’s
power to those banks. (Interviewee #13)
We don’t mind providing disclosure but this depends on how the board perceives what
the implication will be. Audit committee would like to be transparent but when it comes
to the board decisions, they may choose not to disclose them because of political
implications of some of the information. I think political interference and government
pressure assist the board to exercise this sort of unethical power. (Interviewee #10)
Evidence from this last interviewee reveals that politics does influence disclosure
decisions, especially in companies that have politicians on their board. These types of
banks felt somewhat protected against external threats (such as pressure groups) which
could impair their economic interest because of their connections with government. The
politicians on boards of directors (as representatives of the government) influence the
board as to what and how much to disclose.
Additionally, a severe agency problem may occur when there is political influence by
government and/or when politicians are board members. The accounting system of a
bank could be affected when there is such political influence. Politicians influence
managers to report selective information or to present annual reports in their best
interests (Watts & Zimmerman 1978). Extant studies also find that political influence is
negatively associated with financial reporting quality (Agrawal & Knoeber 2001;
Belkaoui 2004).

220
8.4.3 Lack of central bank autonomy
High attention was given to Central Bank autonomy by all the interviewees. As a
government organisation, the Central Bank performs the entire core monetary and
financial stability function as well as regulating and supervising financial institutions in
the country. Central Bank autonomy refers to the extent to which the Central Bank
executes the functions independently and has legislative control (Boylan 2001). The
degree of autonomy delegated to the Central Bank affects the structure of accountability
to ensure the intended delegated authority (Mehrling 2005).
The Central Bank in any country governs monetary policy, acts as a financial agent for
government and exercises supervisory and regulatory duties to establish banking sector
stability. Therefore, the Central Bank should have political and financial autonomy
(Lybek 2004). The International Monetary Fund (IMF) also supports Central Bank
autonomy and accountability for sustainable economic growth and good governance
(IMF 2012).
In the context of Bangladesh, all the interviewees perceived that the Central Bank
cannot exercise its full autonomy. Responses include:
We cannot control the corruption made by board. Additionally, the Ministry of Finance
has excessive power on banks. If Central Bank enjoys autonomy without the
intervention of the Ministry of Finance….board could not manipulate the decision of
the Central Bank. Now it is a question if the Central Bank can operate independently.
(Interviewee #14)
The above quote highlights the importance of exercising Central Bank autonomy over
banking institutions. The response above reveals also the institutional weakness of the
Central Bank in Bangladesh. This is supported by another cross country study
conducted by Ahsan, Skully and Wickramanayake (2009). Using the sample of
Bangladesh and Australia this study examined Central Bank independence and
governance. By using an index to assess the association between governance and

221
Central Bank independence in 1991-2008, they found that these two are significantly
weaker in Bangladesh than Australia.
8.4.4 Lack of accountability
Another potential reason for banks not disclosing risk information is that the primary
aim of banks is to maximise profit for the benefit of their shareholders, rather than
accept a broader accountability to other stakeholders. The interview responses suggest
that disclosing commercially sensitive information has a potential impact on the
profitability of banks. Thus, interviewees indicated a shareholder-oriented view by
focusing on the commercial return of banks. The following comment reveals the
interviewees’ thoughts regarding the issues:
We used to balance commercial sensitivity. We only report what is in the best interests
of the stakeholders and we have commercial information that needs to be protected.
When we disclose information, we make sure that shareholders’ interests are not
compromised. We cannot disclose the information that has a negative impact on our
commercial return. (Interviewee #3)
The statement emphasises that managers’ decisions to disclose or not to disclose
information are based on an ‘economic’ rationale rather than on the basis of a duty of
accountability towards a wider stakeholder audience. Avoiding the disclosure of
commercially sensitive information might protect the interests of shareholders,
however, it is very difficult to envisage stakeholder accountability being established in a
situation where managers have such a concern for maximising shareholder value
(Cooper & Owen 2007). From the views expressed here, it can be concluded that
economic motivation plays a dominant role relative to the broader issues associated with
accountability.
8.4.5 Lack of demand from governments
Most of the interviewees argued that banks do not disclose due to lack of demand from
government. If it is a particular government requirement, then banks feel a need for

222
compliance. The responses suggest that, consistent with the maintained assertion in this
thesis, at present banks do not perceive a great deal of pressure from the government
due to a lack of current regulatory requirements pertaining to corporate risk disclosure.
Additionally, several interviewees are concerned about the effectiveness of existing
laws in relation to the internal control system. Responses include:
If government wants any information, we provide it. However, I don’t see government
pressures us for such information. There is no legal obligation for us to report on
disclosure. (Interviewee #2)
The interview responses indicated that stakeholders perceived as powerful do not
demand more information; therefore, they are not exercising influence on companies to
motivate them to disclose corporate risk information. Due to the lack of demand from
powerful stakeholders, it is unlikely that banks would be motivated to disclose more
rather than less information.
8.4.6 Lack of education
Corporate risk disclosure and the benefits of disclosure are new concepts to the
corporate bank representatives in Bangladesh. Besides, stakeholders also have lack of
knowledge about risk disclosure. Interviewees suggested that there is a need for
education and awareness of corporate representatives, regulators and stakeholders in
relation to corporate risk disclosure. They emphasised that corporate risk disclosure
benefits the internal control system and enhances external stakeholders in understanding
of the risk profile, risk appetite and future investment possibility. The following
comments reveal the interviewees’ thoughts regarding the issues:
…..important is whether shareholders and other stakeholders are educated. For example,
they need to understand the quality of asset, non-performing loan structure, risk based
ratio and maturity profile of assets. (Interviewee #4)
I think enterprise owners need to be educated to implement standards and good
accounting practices. (Interviewee #6)

223
The responses above indicate the need for education and awareness to enhance
corporate risk disclosure as Bangladeshi banks are still at an infancy stage in this
respect.
8.4.7 Brief and concise reports
The respondents also emphasised that they need to keep the annual reports as brief and
concise as possible, the implication being that they elect not to disclose all the
information in annual reports. As stated by one respondent:
We do not seek to make our annual reports very long and difficult to read, however, we
aim to provide fully comprehensive documents for investors to find the relevant
information. (Interviewee #9)
Another respondent (Interviewee No. 7) emphasised that there are ways to communicate
with stakeholders other than in annual reports. They put importance and potentiality of
reporting via other media such as online or websites as an alternative means of
communication. These can benefit in several ways. For example, they can facilitate
speedy, two way interaction between potentially many participants, providing much
readily accessible information so that people can become more informed. Therefore, it
is possible to make concise and brief reports and make the website disclosure more
comprehensive, which might lead banks to elect not to disclose all the information in
their annual reports.
8.5 Chapter conclusion
The discussion within this Chapter explores corporate and regulators representatives’
observations about risks disclosure practices and their determinants. The Chapter also
explores the potential reasons for the lack of disclosure pertaining to corporate risk from
a company perspective. Having provided an insight into risk disclosure practices,
interviews were utilised to understand the factors responsible for current low level
disclosure practices. The interview responses in this study suggest that institutional

224
isomorphism (mimetic and normative), risk committees and board independence are key
contributing factors to corporate risk disclosure.
Additionally, perceptions of political interference, Central Bank autonomy, limited
perception of accountability, demand from powerful stakeholders, lack of education of
users of financial information, keeping annual reports brief and concise, appear to
contribute to the apparent lack of corporate risk disclosure.
The corporate and regulator representatives argued that the reporting format used by
larger banks encourages smaller banks to provide better reporting. That is, the risk
profile of larger banks assists in managing accountability, transparency, reputation and
public visibility. This evidence supports the mimetic isomorphism Hypothesis posited in
Chapter 5. The respondents argued also that experienced and knowledgeable members
in the risk management unit assists banks to identify and monitor risks well. Besides,
interview responses suggest that risk committees in banks work for risk identification,
inform internal audit and executive members of the board about banks’ current and
potential risks exposures. The respondents also emphasised the importance of an
independent board in making sound decisions in relation to corporate risk disclosure.
The interview data reveal that corporate risk disclosure practices are still at a low level.
The reasons for non-disclosure can be identified from interview data. The interviews in
this study revealed that because of institutional weaknesses, lack of disciplinary action,
and political interference, banks are not motivated to disclose a great deal of corporate
risk information. That is, undue political power is exercised on the governance structure
when politicians are board members.
The interviewee data also emphasised the importance of Central Bank autonomy. The
interviewee data reveals that the Central Bank in Bangladesh cannot use full autonomy
to execute its functions independently. There was a particular concern about powerful
stakeholders requiring disclosure. This study found that banks are not motivated to
disclose a great deal of information if particular concern is not raised by powerful

225
stakeholders. Hence the thrust of the qualitative evidence is to support the maintained
assumption or assertion made very early in thesis, that Bangladesh creates an ideal
institutional setting in which to investigate risk disclosure and its determinants because
of both the lack of mandate and lack of enforcement over what mandate does exist.
Examining risk disclosure in a setting with highly regulated disclosure of risk issues
would not provide insights as to disclosure determinants because there would be little
variation between actual disclosures and those required by international standards.
Apart from the low mean actual percentage compliance with the international standards
at 62 per cent, as reported in the previous Chapter (Table 7.1), demonstrating wide non-
compliance with the international standards of relevance to this thesis, the qualitative
evidence presented in this Chapter from regulators and bank representatives is difficult
to dispute.
Interview data further reveal that emerging legislative requirements associated with risk
disclosure would influence banks’ disclosure to avoid regulation such as market
penalties. This assists accounting regulators and legislators in developing reporting
requirements by understanding motives for encouraging banks to provide risk disclosure
information. The idea behind mandatory disclosure is that ‘if all companies are
disclosing there can be no competitive advantages by non-disclosure’ (Solomon &
Lewis 2002, p.166). Therefore, this study suggests that introducing new legislation and
standards for disclosure of corporate risk disclosure may be able to narrow the apparent
lack of disclosure in Bangladesh.
The qualitative findings from this Chapter are referred to further in the following
Chapters when conducting further analysis of quantitative data gathered from annual
reports in order to examine the link between risk disclosure and bank characteristics.

226
CHAPTER 9: Factors Underlying Risk Disclosure-Descriptive,
Univariate and Bivariate Analyses
9.1 Introduction
Chapter 7 reported the results of the risk disclosure content analysis and for
convenience and completeness within this Chapter, some of the statistics reported in
Chapter 7 are repeated here. Those results showed that there exists variation in the
extent of risk disclosure practices in Bangladeshi banking institutions. Phase Two of
this broader study seeks to identify the factors behind such variation. Chapter 5
explained the theoretical background for several hypothesised factors thought to explain
risk disclosure variation. Based on the discussion in Chapter 5, the present Chapter
seeks to examine on a univariate basis the relationship between the Risk Disclosure
Index and bank specific characteristics, such as board independence, audit committee
independence, the number of risk committees, debt to equity ratio, total assets, and the
presence of a risk management unit. Appropriate statistical tests are performed to assist
in understanding these relationships.
This Chapter reports results from descriptive and inferential analysis. Descriptive
statistics summarise data quantitatively without employing a probabilistic formulation
about the phenomena under consideration of each relevant variable (Field 2009).
However, inferential statistics such as Pearson correlations, t-statistics and chi square
statistics enable inferences from secondary data in order to make inferences that are
more general. The Chapter begins with descriptive statistics, univariate analysis using t-
tests and analysis of variance (ANOVA) results that describe the hypothesis and control
variables included in this study.
This Chapter is organised as follows: section 9.2 presents information about the sample
companies, section 9.3 presents the descriptive statistics for the predictor variables
(board independence, audit committee independence, number of risk committees, debt
to equity ratio, total assets, and the presence of a risk management unit) and control
variables (board size, auditor type and age of company). Section 9.4 compares the

227
significance of mean values across the period using ANOVA, section 9.5 reports the
bivariate correlation analysis and section 9.6 summarises the Chapter’s findings and
provides a conclusion. Figure 9.1 provides an overview of this Chapter.
9.2 Sample and source of data
The procedures used to make the sample choice and selection of the sample are
explained in the research method Chapter (Chapter 6). The sample is based on 210
bank-year observations consisting of the population of 30 banks listed on the Dhaka
Stock Exchange of Bangladesh over each of seven-years from 2006 to 2012.
9.3 Descriptive statistics
This section reports descriptive statistics for key variables. Table 9.1 presents the
descriptive statistics for dependent, independent and control variables. The table
presented descriptive statistics for Full sample (210 bank-year observation) and sub
sample (Non-Islamic and Islamic). There are two categorical variables in the model
described in Chapter 6: the presence of a risk management unit (independent variable)
and the presence of a multinational linked auditor (control variable). The Risk
management Unit (RMU) variable is dichotomous and coded as 1 if bank has a risk
management unit and 0 if not.
The presence of a multinational linked auditor (ML) is coded as 1 if a big four
international audit firm is present and 0 if not. As discussed in Chapter 6, the five
continuous variables employed in this study are board independence (BI), audit
26Figure 9.1: Roadmap of Chapter
Introduction (9.1) Sample and source
of data (9.2) Descriptive
statistics (9.3)
Univariate
analysis (9.4)
Bivariate analysis
(9.5)
Chapter conclusion
(9.6)

228
committee independence (ACI), number of risk committees (RC), debt to equity ratio
(DE) and total assets (TA). BI is measured as the proportion of independent members
compared to total board members. ACI is measured as the proportion of independent
members compared to total audit committee members. RC is measured as the total
number of risk committees, DE is total debt divided by total equity. There are also two
continuous control variables: board size and age. Tables 9.1 and 9.2 present descriptive
data for the pooled sample of 210 firm-years and for 30 banks for each year
respectively.
As shown in Table 9.1 and as reported in greater detail in Chapter 7, all sample banks
provide some extent of risk disclosure in their annual reports. Table 9.2 reports
descriptive statistics for each year. Table 9.1 reports that the average Risk Disclosure
Index score is 62 per cent (for the pooled data) across the period (2006-2012) with a
minimum of 18 and maximum 87 per cent. Table 9.2 (panels A to G) presents results
showing that the Risk Disclosure Index for sample banks ranges from a mean of 43 per
cent to 77 per cent over 2006-2012.

229
Legend: Where, RDI denotes Risk Disclosure Index, BI denotes board independence measured as proportion of independent directors on the board. ACI
denotes Audit Committee Independence measured as proportion of independent directors on the audit committee, RC denotes number of risk committees, DE
denotes the debt equity ratio. TA denotes total assets, BS denotes the number of board members, AG denotes age measured as numbers of years from
incorporation, RMU denotes presence of a risk management unit, ML denotes the presence of a multinational linked auditor.
44 TA is in billion BDT. Exchange rate taka (BDT) per U.S.A dollar - 81.863 (2014 est.);74.152 (2013 est.) .
27Table 9.1: Descriptive statistics by complete sample (bank years N= 210) and sub-sample (Islamic N=49, Non-Islamic N=161)
Full sample (N=210) Non-Islamic banks (N=161[77%]) Islamic banks (N=49[23%])
Dependent and continuous independent variables
Mean Median Std. Dev. Mean Median Min. Max. Std. Dev. Mean Median Min. Max. Std. Dev.
RDI 0.62 0.64 0.19 0.65 0.67 0.20 0.87 0.17 0.52 0.53 0.18 0.83 0.19
BI 0.05 0.05 0.04 0.05 0.06 0.00 0.25 0.04 0.03 0.00 0.00 0.20 0.04
ACI 0.15 0.20 0.14 0.16 0.20 0.00 0.33 0.14 0.10 0.00 0.00 0.33 0.13
RC 1.83 1.00 1.37 1.98 2.00 0.00 6.00 1.45 1.37 1.00 0.00 3.00 0.91
DE 0.10 0.10 0.14 0.11 0.10 0.13 0.71 0.09 0.06 0.10 1.43 0.21 0.22
TA44 84.18 68.00 82.27 82.88 71.00 15.00 824.00 70.90 88.45 47.00 15.00 502.00 112.64
BS 13.86 14.00 4.40 13.54 14.00 6.00 23.00 4.14 14.90 14.00 5.00 23.00 5.07
AG 17.72 14.00 9.70 18.32 14.00 7.00 53.00 10.28 15.75 13.00 5.00 31.00 7.24
Categorical
independent
variables
Proportion (%) of banks
coded 1
Proportion (%) of banks coded 1 Proportion (%) of banks coded 1
RMU (presence) 59.5 62.1 51.0
ML (Big 4auditor) 78.6 82.2 67.3

230
Table 9.2 presents average board independence, audit committee independence and
board size, which increases each year from 2006 to 2012 (BI 2 to 7 per cent, ACI 9 to
20 per cent; and BS 12.20 to 14.77), while the pooled data shows in Table 9.1 that the
average BI is 5 per cent and ACI is 15 per cent. The average number of risk committees
and the presence of a risk management unit increase respectively from 2006 to 2012.
Consistent with good governance principles, the increasing attention to risk
management indicates a positive approach by banks to the two international standards of
most relevance to this study (IFRS 7 Financial Instruments: Disclosures and Basel II
Market Discipline).
The average debt to equity ratio (DE) is 10 per cent and ranges from 7 per cent to 11 per
cent (see Table 9.2) across the years. The trend in DE decreases from 2006 to 2009-
2010 and rises in 2011 and 2012. DE falls in 2009-2010, indicating that debt-holders
have lower debt in that period. This is consistent with banks expending less in capital
expenditure as a safety measure after the GFC (2007-2008). The average total assets for
the pooled data is 84.18 billion BDT (see Table 9.1). Table 9.2 (Panel A-G) shows that
total assets is increasing over the period from 2006 to 2012, ranging from 43.67 to
118.27 billion BDT. The proportion of banks with risk management units (RMU) and a
big four auditor are 59 and 77 per cent respectively. These proportions suggest that over
half of the banks run risk management units while one-fifth of banks are not affiliated
with the presence of a big four-audit firm.
The means for the other two control variables, age and board size, also change over
time. Further, it is important to mention that to measure total assets, board size and age
for inclusion in the regressions, the natural logarithm of the numbers is calculated.

231
Full sample (N=30) Non-Islamic banks (N=23) Islamic banks (N=7)
Dependent and continuous independent variables
Mean Median Std.
Dev.
Mean Median Min. Max. Std.
Dev.
Mean Median Min. Max. Std.
Dev.
RDI 0.43 0.47 0.15 0.46 0.52 0.20 0.70 0.15 0.35 0.29 0.18 0.56 0.14
BI 0.02 0 0.03 0.02 0.00 0.00 0.09 0.03 0.02 0.00 0.00 0.06 0.03
ACI 0.09 0 0.12 0.08 0.00 0.00 0.33 0.12 0.13 0.11 0.00 0.33 0.14
RC 0.93 1 0.83 1.09 1.00 0.00 3.00 1.00 0.71 1.00 0.00 1.00 0.49
DE 0.11 0.11 0.07 0.11 0.11 0.06 0.38 0.08 0.10 0.10 0.03 0.19 0.07
TA45
43.67 35.5 38.41 41.00 42.00 21.00 76.00 15.43 52.43 24.00 16.00 230.00 78.37
BS 12.2 12.5 3.8 11.74 12.00 6.00 20.00 3.39 13.71 14.00 5.00 22.00 4.92
AG 13.77 7 6.63 15.00 11.00 7.00 47.00 10.14 13.00 11.00 5.00 25.00 7.59
Categorical independent variables
Proportion of banks
coded 1
Proportion of banks coded 1 Proportion of banks coded 1
RMU (presence) 20 17.4 28.6
ML (Big
4auditor)
77 82.6 57.1
Legend: Where, RDI denotes Risk Disclosure Index, BI denotes board independence measured as proportion of independent directors on the board. ACI denotes Audit Committee Independence
measured as proportion of independent directors on the audit committee, RC denotes number of risk committees, DE denotes the debt equity ratio. TA denotes total assets, BS denotes the number of
board members, AG denotes age measured as numbers of years from incorporation, RMU denotes presence of a risk management unit, ML denotes the presence of a multinational linked auditor.
45 TA is in billion BDT. Exchange rate taka (BDT) per U.S dollar - 81.863 (2014 est .);74.152 (2013 est .)
28 Table 9.2 (Panel A): Descriptive statistics year 2006 (N=30)

232
Full sample (N=30) Non-Islamic banks (N=23) Islamic banks (N=7)
Dependent and continuous independent variables
Mean Median Std.
Dev.
Mean Median Min. Max. Std.
Dev.
Mean Median Min. Max. Std.
Dev.
RDI 0.5 0.52 0.17 0.55 0.56 0.28 0.80 0.15 0.39 0.40 0.19 0.61 0.15
BI 0.03 0 0.05 0.04 0.00 0.00 0.17 0.05 0.02 0.00 0.00 0.07 0.03
ACI 0.1 0 0.13 0.09 0.00 0.00 0.33 0.13 0.14 0.20 0.00 0.33 0.14
RC 0.93 1 0.94 1.05 1.00 0.00 3.00 1.05 0.71 1.00 0.00 1.00 0.49
DE 0.12 0.12 0.07 0.12 0.12 0.07 0.40 0.08 0.11 0.11 0.02 0.21 0.07
TA46 50.47 43 41.25 48.23 47.00 22.00 81.00 16.14 57.29 26.00 17.00 250.00 85.08
BS 12.47 13.5 3.75 11.95 12.00 6.00 20.00 3.37 13.71 14.00 5.00 22.00 4.92
AG 15.77 12 9.63 15.95 12.00 8.00 48.00 10.29 13.71 12.00 6.00 26.00 7.43
Categorical independent variables
Proportion of banks coded
1
Proportion of banks coded 1 Proportion of banks coded 1
RMU (presence) 17 13.6 28.6
ML (Big
4auditor)
77 86.4 57.1
Legend: Where, RDI denotes Risk Disclosure Index, BI denotes board independence measured as proportion of independent directors on the board. ACI denotes Audit
Committee Independence measured as proportion of independent directors on the audit committee, RC denotes number of risk committees, DE denotes the debt equity ratio.
TA denotes total assets, BS denotes the number of board members, AG denotes age measured as numbers of years from incorporation, RMU denotes presence of a risk
management unit, ML denotes the presence of a multinational linked auditor.
46 TA is in billion BDT. Exchange rate taka (BDT) per U.S.A dollar - 81.863 (2014 est .);74.152 (2013 est .)
29Table 9.2(Panel B): Descriptive statistics year 2007 (N=30)

233
Full sample (N=30) Non-Islamic banks (N=23) Islamic banks (N=7)
Dependent and continuous independent variables Mean Median Std. Dev. Mean Median Min. Max. Std. Dev. Mean Median Min. Max. Std. Dev.
RDI 0.53 0.57 0.16 0.56 0.58 0.23 0.80 0.14 0.40 0.41 0.19 0.61 0.15
BI 0.05 0.06 0.04 0.05 0.07 0.00 0.10 0.04 0.02 0.00 0.00 0.07 0.03
ACI 0.09 0 0.15 0.11 0.00 0.00 0.33 0.16 0.04 0.00 0.00 0.25 0.09
RC 1.23 1 1.07 1.17 1.00 0.00 3.00 1.15 1.43 1.00 1.00 3.00 0.79
DE 0.11 0.11 0.08 0.12 0.11 0.09 0.45 0.09 0.09 0.10 0.04 0.13 0.06
TA47 85.77 56 144.56 93.61 58.00 31.00 824.00 160.38 60.00 31.00 19.00 230.00 75.34
BS 13.27 14 3.45 13.13 14.00 6.00 20.00 2.87 13.71 14.00 5.00 23.00 5.22
AG 16.77 13 9.63 17.39 13.00 9.00 49.00 10.27 14.71 13.00 7.00 27.00 7.43
Categorical independent variables
Proportion of banks coded 1 Proportion of banks coded 1 Proportion of banks coded 1
RMU (presence) 30 30.4 28.6
ML (Big 4auditor) 80 87 57.1
Legend: Where, RDI denotes Risk Disclosure Index, BI denotes board independence measured as proportion of independent directors on the board. ACI denotes Audit
Committee Independence measured as proportion of independent directors on the audit committee, RC denotes number of risk committees, DE denotes the debt equity
ratio. TA denotes total assets, BS denotes the number of board members, AG denotes age measured as numbers of years from incorporation, RMU denotes presence of a risk
management unit, ML denotes the presence of a multinational linked auditor.
47 TA is in billion BDT. Exchange rate taka (BDT) per U.S.A dollar - 81.863 (2014 est .);74.152 (2013 est .) .
30Table 9.2(Panel C): Descriptive statistics year 2008 (N=30)

234
Full sample (N=30) Non-Islamic banks (N=23) Islamic banks (N=7)
Dependent and continuous independent variables
Mean Median Std. Dev. Mean Median Min. Max. Std. Dev. Mean Median Min. Max. Std. Dev.
RDI 0.62 0.64 0.19 0.65 0.67 0.20 0.87 0.17 0.52 0.53 0.18 0.83 0.19
BI 0.05 0.05 0.04 0.05 0.06 0.00 0.25 0.04 0.03 0.00 0.00 0.20 0.04
ACI 0.15 0.20 0.14 0.16 0.20 0.00 0.33 0.14 0.10 0.00 0.00 0.33 0.13
RC 1.83 1.00 1.37 1.98 2.00 0.00 6.00 1.45 1.37 1.00 0.00 3.00 0.91
DE 0.10 0.10 0.14 0.11 0.10 0.13 0.71 0.09 0.06 0.10 1.43 0.21 0.22
TA48 84.18 68.00 82.27 82.88 71.00 15.00 824.00 70.90 88.45 47.00 15.00 502.00 112.64
BS 13.86 14.00 4.40 13.54 14.00 6.00 23.00 4.14 14.90 14.00 5.00 23.00 5.07
AG 17.72 14.00 9.70 18.32 14.00 7.00 53.00 10.28 15.75 13.00 5.00 31.00 7.24
Categorical independent variables
Proportion of banks coded 1 Proportion of banks coded 1 Proportion of banks coded 1
RMU (presence) 59.5 62.1 51
ML (Big 4auditor) 78.6 82.2 67.3
Legend: Where, RDI denotes Risk Disclosure Index, BI denotes board independence measured as proportion of independent directors on the board. ACI denotes Audit Committee Independence
measured as proportion of independent directors on the audit committee, RC denotes number of risk committees, DE denotes the debt equity ratio. TA denotes total assets, BS denotes the number of
board members, AG denotes age measured as numbers of years from incorporation, RMU denotes presence of a risk management unit, ML denotes the presence of a multinational linked auditor.
48 TA is in billion BDT. Exchange rate taka (BDT) per U.S.A dollar - 81.863 (2014 est .);74.152 (2013 est .)
31Table 9.2(Panel D): Descriptive statistics year 2009 (N=30)

235
Full sample (N=30) Non-Islamic banks (N=23) Islamic banks (N=7)
Dependent and continuous independent variables
Mean Median Std. Dev. Mean Median Min. Max. Std. Dev. Mean Median Min. Max. Std. Dev.
RDI 0.71 0.75 0.14 0.74 0.77 0.38 0.87 0.13 0.62 0.66 0.37 0.79 0.14
BI 0.05 0.05 0.04 0.06 0.07 0.00 0.13 0.04 0.03 0.05 0.00 0.07 0.03
ACI 0.19 0.23 0.15 0.22 0.33 0.00 0.33 0.14 0.08 0.00 0.00 0.33 0.14
RC 2.37 2 1.3 2.61 2.00 1.00 6.00 1.31 1.57 1.00 1.00 3.00 0.98
DE 0.09 0.09 0.04 0.09 0.09 0.01 0.20 0.04 0.08 0.09 0.02 0.14 0.05
TA49 93.5 82.5 54.62 92.04 90.00 15.00 132.00 31.09 98.29 70.00 18.00 330.00 104.13
BS 15.27 15 4.78 15.00 14.00 6.00 23.00 4.66 16.14 17.00 5.00 21.00 5.43
AG 18.7 15 9.69 19.30 15.00 10.00 51.00 10.34 16.71 15.00 9.00 29.00 7.43
Categorical independent variables Proportion of banks coded 1 Proportion of banks coded 1 Proportion of banks coded 1
RMU (presence) 80 95.7 71.4
ML (Big 4auditor) 77 82.6 71.4
Legend: Where, RDI denotes Risk Disclosure Index, BI denotes board independence measured as proportion of independent directors on the board. ACI denotes Audit Committee Independence
measured as proportion of independent directors on the audit committee, RC denotes number of risk committees, DE denotes the debt equity ratio. TA denotes total assets, BS denotes the
number of board members, AG denotes age measured as numbers of years from incorporation, RMU denotes presence of a risk management unit, ML denotes the presence of a multinational
linked auditor.
49 TA is in billion BDT. Exchange rate taka (BDT) per U.S.A dollar - 81.863 (2014 est .);74.152 (2013 est .)
32Table 9.2(Panel E): Descriptive statistics year 2010 (N=30)

236
Full sample (N=30) Non-Islamic banks (N=23) Islamic banks (N=7)
Dependent and continuous independent variables Mean Median Std.
Dev.
Mean Median Min. Max. Std.
Dev.
Mean Median Min. Max. Std.
Dev.
RDI 0.76 0.8 0.11 0.79 0.81 0.60 0.87 0.08 0.67 0.70 0.37 0.81 0.15
BI 0.05 0.05 0.04 0.06 0.06 0.00 0.13 0.04 0.03 0.05 0.00 0.08 0.03
ACI 0.19 0.2 0.13 0.22 0.20 0.00 0.33 0.12 0.11 0.00 0.00 0.33 0.14
RC 2.67 3 1.35 2.96 3.00 1.00 6.00 1.33 1.71 1.00 1.00 3.00 0.95
DE 0.11 0.09 0.12 0.11 0.09 0.05 0.71 0.13 0.08 0.10 0.02 0.17 0.06
TA50 120.37 106.5 82.61 113.74 116.00 15.00 199.00 41.07 142.14 91.00 18.00 502.00 161.50
BS 14.77 14.5 4.88 14.48 14.00 6.00 23.00 4.83 15.71 17.00 5.00 20.00 5.28
AG 19.77 16 9.63 20.39 16.00 12.00 52.00 10.27 17.71 16.00 10.00 30.00 7.43
Categorical independent variables Proportion of banks coded 1 Proportion of banks coded 1 Proportion of banks coded 1
RMU (presence) 90 95.7 71.4
ML (Big 4auditor) 80 78.3 85.7
Legend: Where, RDI denotes Risk Disclosure Index, BI denotes board independence measured as proportion of independent directors on the board. ACI denotes Audit Committee
Independence measured as proportion of independent directors on the audit committee, RC denotes number of risk committees, DE denotes the debt equity ratio. TA denotes total assets, BS
denotes the number of board members, AG denotes age measured as numbers of years from incorporation, RMU denotes presence of a risk management unit, ML denotes the presence of a
multinational linked auditor.
50 TA is in billion BDT. Exchange rate taka (BDT) per U.S.A dollar - 81.863 (2014 est .);74.152 (2013 est .)
33Table 9.2(Panel F): Descriptive statistics year 2011 (N=30)

237
Full sample (N=30) Non-Islamic banks (N=23) Islamic banks (N=7)
Dependent and continuous independent variables
Mean Median Std.
Dev.
Mean Median Min. Max. Std.
Dev.
Mean Median Min. Max. Std.
Dev.
RDI 0.77 0.81 0.11 0.80 0.83 0.65 0.87 0.07 0.69 0.72 0.37 0.83 0.16
BI 0.07 0.06 0.06 0.07 0.07 0.00 0.25 0.05 0.06 0.06 0.00 0.20 0.07
ACI 0.2 0.2 0.13 0.22 0.20 0.00 0.33 0.12 0.16 0.20 0.00 0.33 0.16
RC 2.77 3 1.38 3.04 3.00 1.00 6.00 1.36 1.86 1.00 1.00 3.00 1.07
DE 0.07 0.09 0.3 0.12 0.09 0.05 0.71 0.13 0.11 0.10 1.43 0.18 0.58
TA51 118.27 106.5 85.43 114.00 116.00 15.00 199.00 43.52 132.29 91.00 15.00 502.00 167.43
BS 14.77 14.5 4.88 14.48 14.00 6.00 23.00 4.83 15.71 17.00 5.00 20.00 5.28
AG 20.77 17 9.63 21.39 17.00 13.00 53.00 10.27 18.71 17.00 11.00 31.00 7.43
Categorical independent variables Proportion of banks coded
1
Proportion of banks coded 1 Proportion of banks coded 1
RMU (presence) 90 95.7 71.4
ML (Big 4auditor) 80 78.3 85.7
Legend: Where, RDI denotes Risk Disclosure Index, BI denotes board independence measured as proportion of independent directors on the board. ACI denotes Audit Committee Independence
measured as proportion of independent directors on the audit committee, RC denotes number of risk committees, DE denotes the debt equity ratio. TA denotes total assets, BS denotes the
number of board members, AG denotes age measured as numbers of years from incorporation, RMU denotes presence of a risk management unit, ML denotes the presence of a multinational
linked auditor.
51 TA is in billion BDT. Exchange rate taka (BDT) per U.S.A dollar - 81.863 (2014 est .);74.152 (2013 est .)
34Table 9.2(Panel G): Descriptive statistics year 2012 (N=30)

238
9.4 Univariate statistics: ANOVA and Chi-Square tests
9.4.1 Significance of mean over time: ANOVA
To compare the significance of mean values across the period 2006-2012, Table 9.3
provides the results of an ANOVA analysis.
Predictor Variables
BI ACI RC DE TA RMU BS ML AG
F 2.047 .533 .533 .535 .366 .675 1.724 .052 2.091
Sig .074* .587 .587 .750 .694 .510 .132 .998 .169
Legend: Where, BI denotes board independence measured as proportion of independent
directors on the board. ACI denotes Audit Committee Independence measured as
proportion of independent directors on the audit committee, RC denotes number of risk
committees, DE denotes the debt equity ratio. TA denotes total assets, RMU denotes
presence of a risk management unit, BS denotes the number of board members, ML
denotes the presence of a multinational linked auditor, AG denotes age measured as
numbers of years from incorporation. ***highly significant at 1% level,**significant at
5% level* moderately significant at 10%
Table 9.3 compares the mean values for bank characteristic variables. Table 9.3 reveals
that none differs significantly from the mean value (p>0.100) except BI (p=.074).
Appendix 9.1 presents the post hoc Tukey p values for each year. The significance level
varies in sample years over the sample period for the predictor variables.
9.4.2 Islamic versus Non-Islamic banks-Continuous variables
To compare the characteristics of Islamic versus Non-Islamic banks, t tests were
performed. Table 9.4 reveals that the mean values of all continuous dependent and
independent variables [Risk Disclosure Index (RDI), board independence (BI), audit
committee independence (ACI), risk committee (RC), debt to equity ratio (DE)] are
significantly different between the two types of banks (at p<0.05 level). However, the
control variables, board size (LnBS) and age (LnAG) are not significantly different.
35Table 9.3: ANOVA by year (2006-2012)

239
t-statistic p-value Mean
Difference
Std. Error
Difference
RDI 4.30 0.00 0.13 -0.02
BI 3.09 0.00 0.02 0
ACI 2.79 0.01 0.06 0.01
RC 2.76 0.01 0.61 0.54
DE 2.20 0.03 0.05 -0.13
LnTA 2.12 0.00 -5.57 -41.74
LnBS 1.08 0.28 -1.36 -0.93
LnAG 1.44 0.15 2.57 3.04
Legend: t tests of difference in means for continuous variables (Non-Islamic [N=161 or
77%] and Islamic [N=49 or 23%]) as reported in Table 9.3.
Where, RDI denotes Risk Disclosure Index, BI denotes board independence measured as
proportion of independent directors on the board. ACI denotes Audit Committee Independence
measured as proportion of independent directors on the audit committee, RC denotes number of
risk committees, DE denotes the debt equity ratio. TA denotes total assets, BS denotes the
number of board members, AG denotes age measured as numbers of years from incorporation,
RMU denotes presence of a risk management unit, ML denotes the presence of a multinational
linked auditor.
9.4.3 Islamic versus Non-Islamic banks - Categorical variables
Both parametric and non-parametric tests were performed for categorical variables
reported in Table 9.3 to identify whether the presence of a multinational linked auditor
and a risk management unit have an association with the overall Risk Disclosure Index.
t-tests were conducted to compare the Risk Disclosure Index for banks with and without
a multinational linked auditor (ML) and banks with and without risk management units
(RMU). Table 9.5 presents the RMU and ML matrix for further analysis.
Table 9.4: t tests for continuous variables

240
Full observation (N=210) Non-Islamic
(N=161)
Islamic (N=49)
Pearson
Chi-
Square
Sig.
(2tailed)
Eta Squared
and Effect
size52
*
Pearson
Chi-
Square
Sig.
(2tailed)
Pearson
Chi-
Square
Sig.
(2tailed)
RMU 112.466 .000 0.314 and
Large effect
96.30 .000 43.99 .06
ML 98.566 .000 0.038 and
Small effect
72.34 .000 42.17 .08
Legend: Where, RMU denotes presence of a risk management unit, ML denotes the
presence of a multinational linked auditor
Table 9.5 and Appendix 9.2 show the univariate statistics for categorical variables
across the sample period for pooled data and the effect size of differences in categorical
variables (RMU and ML). The Chi-square (112.466) for RMU is significant (p<0.05)
with a large size effect (eta squared=0.314). This goes with predicted expectation that
banks with a risk management unit score higher in the Risk Disclosure Index than banks
without. The Chi-square (98.566) for ML is significant (at p<0.001 level) and the
magnitude of the difference is small (eta squared=0.038). That is, multinational linked
auditors have an association with the Risk Disclosure Index, but with a small size effect.
Additionally, the Chi-square for Non-Islamic banks are highly significant (at p<0.001
level) for both RMU and ML however, for Islamic banks these two variables (RMU and
ML) are moderately significant (at p<0.10 level).
9.5 Bivariate analysis
In this section, various tests are used to measure the relationship among the variables.
These include Pearson product –moment correlation coefficients, and t tests. Firstly, the
Pearson product-moment correlation coefficients are calculated to test the correlations
between the dependent variable (Risk Disclosure Index) and the predictors and between
the predictors (board independence, audit committee independence, number of risk
52
*Appendix 9.2
36Table 9.5: Pearson Chi-Square test for categorical variables

241
committees, debt to equity ratio, total assets, presence of risk management unit, board
size, multinational linked auditor, age), transformed as appropriate.
Multicollinearity as a statistical problem is one of the potential issues in multivariate
analysis. Multicollinearity occurs when there are a high correlations between the
independent variables. Multicollinear variables can create misleading results.
Correlation coefficients between independent variables of 0.8 or 0.9 are often the
benchmark for multicollinearity concerns (Hair et al 1998, Tabachnik & Fidell (2001).
Table 9.6 shows the results for the tests of correlation.

242
RDI BI ACI RC DE LnTA RMU LnBS ML LnAG Islamic
BI .335**
1.00
ACI .299**
.308**
1
RC .385**
.305**
.349**
1
DE .033 -.107 -.117 .079 1
LnTA .540**
.152* .203
** .215
** .120 1.00
RMU .562**
.257**
.423**
.478**
-.091 .310**
1
LnBS .157* -.078 .076 .037 .150
* .267
** .104 1
ML .226**
.147* .068 -.096 -.127 .096 .113 -.300
** 1
LnAG .195**
.053 -.094 -.002 -.131 .347**
-.019 -.012 .175* 1
Islamic -.285**
-.212**
-.190**
-.190**
-.151* -.145
* -.096 .075 -.151
* -.099 1
Legend: Where, BI denotes board independence measured as proportion of independent directors on the board. ACI denotes Audit Committee
Independence measured as proportion of independent directors on the audit committee, RC denotes number of risk committees, DE denotes the
debt equity ratio. TA denotes total assets, RMU denotes presence of a risk management unit, BS denotes the number of board members, ML
denotes the presence of a multinational linked auditor, AG denotes age measured as numbers of years from incorporation. Islamic and Non-
Islamic are indicator variables measured as 1 for Non-Islamic and 0 for Islamic banks. *highly significant at 1% level**significant at 5%
level*** moderately significant at 10%
37Table 9.6: Pearson’s Correlations Pooled Data (2006-2012) (N=210)

243
Table 9.6 reports that the highest coefficient correlation is 0.562 for the presence of a
risk management unit (RMU)53
with the dependent variable Risk Disclosure Index.
Therefore, Table 9.6 provides no indication that an unacceptable level of
multicollinearity concerns is present.
Board independence (BI), number of risk committees (RC) and audit committee
independence (ACI) as proxies for risk governance are correlated positively and are
statistically significant at p<0.05 level. The direction of this correlation is consistent
with Hypotheses H2, H3 and H454
.The correlation coefficients for BI and RC with RDI
are below 0.4.
The debt to equity ratio (DE) and RDI are positively related, however there is no
statistical significance across the period (2006-2012). The predicted direction of the
correlation is not in accordance with that hypothesised for DE, given the a priori
expectation from neo-institutional theory. Similar results were found in previous studies
(Abraham & Cox 2007; Linsley & Shrives 2005a; Mohobbot 2005).
Log of total assets (LnTA) and presence of a risk management unit (RMU) are
positively and statistically significantly correlated with RDI at p<0.05 level. The values
of correlation coefficients are higher for LnTA (0.540) and RMU (0.562) compared to
other predictors. The directionality of these correlations is consistent with Hypotheses
53
Risk Management Unit is not included amongst the 147 items in the Risk Disclosure Index.
54
H2: The number of independent directors on the board is associated positively with the extent of risk
disclosure. H3: The number of independent directors on the audit committee is associated positively with
the extent of risk disclosure. H4: The number of risk committees is positively associated with the extent of
risk disclosure.

244
H655
and H756
. The strength of correlation between control variables (LnBS, ML and
LnAG) and RDI is below 0.3.
9.6 Chapter conclusion
This Chapter presents a discussion of descriptive statistics, t- tests, ANOVA and post
hoc Tukey analysis relating to the dependent variable and possible determinant and
control variables of full sample and sub-sample (Islamic and Non-Islamic). The study
provides evidence that non-conventional banks provide less risk-related disclosures
compared with conventional or Islamic banks. The ANOVA and Chi-square tests
compare the mean value over time and the significance of categorical variables
respectively. The correlation coefficients suggest the association between the predictor
variables is not at a level that causes multicollinearity concerns. The next Chapter
reports the statistical analysis and the testing of the Hypotheses using multiple
regression analysis.
55
H6: Mimetic isomorphism of larger banks influences smaller banks to provide more risk disclosure 56
H7: Normative isomorphism is positively associated with the extent of risk disclosure.

245

246
CHAPTER 10: Factors Underlying Risk Disclosure: Multivariate
Statistics
10.1 Introduction
To examine the association between potential determinants and the Risk Disclosure
Index, this Chapter reports the multivariate testing of the Hypotheses developed in
Chapter 5. The statistical analysis focuses on the independent and control variables
hypothesised to be associated with risk disclosure patterns. The tests involve use of
Ordinary Least Square (OLS) regression modelling with the Risk Disclosure Index as
the dependent variable in relation to the possible predictor variables.
As explained in Chapter 6, the present study examines the relationship between six
independent variables (board independence, audit committee independence, number of
risk committees, debt to equity ratio, log of total assets and presence of a risk
management unit), control variables (log of board size, presence of a multinational
linked auditor, and log of age since incorporation), and the dependent variable (Risk
Disclosure Index), across the period 2006-2012. The bivariate statistics for the
dependent, independent and control variables reported in the previous Chapter (Chapter
9) discussed the correlations between these variables in detail. This Chapter reports the
outcome of examination of interrelationships between the variables. Thus, this Chapter
discusses how well the theoretical discussion in Chapter 5 fits with the outcomes of
modelling the hypothesised Risk Disclosure Index determinants.
This Chapter is organised as follows: section 10.2 presents the multivariate regression
model to examine the association of the predictors with the Risk Disclosure Index,
section 10.3 presents normality and multicollinearity checks for regression assumptions.
Section 10.4 presents the robustness of findings in relation to the empirical tests.
Section 10.5 reports the sensitivity findings and section 10.6 presents the robustness of
findings in relation to the empirical tests. Section 10.7 provides results for analysis of
the association between the change in Risk Disclosure Index and the change in predictor
variables between sample periods. Section 10.8 discusses the findings and section 10.9
concludes the Chapter. A follow up table concludes the triangulation of the results from
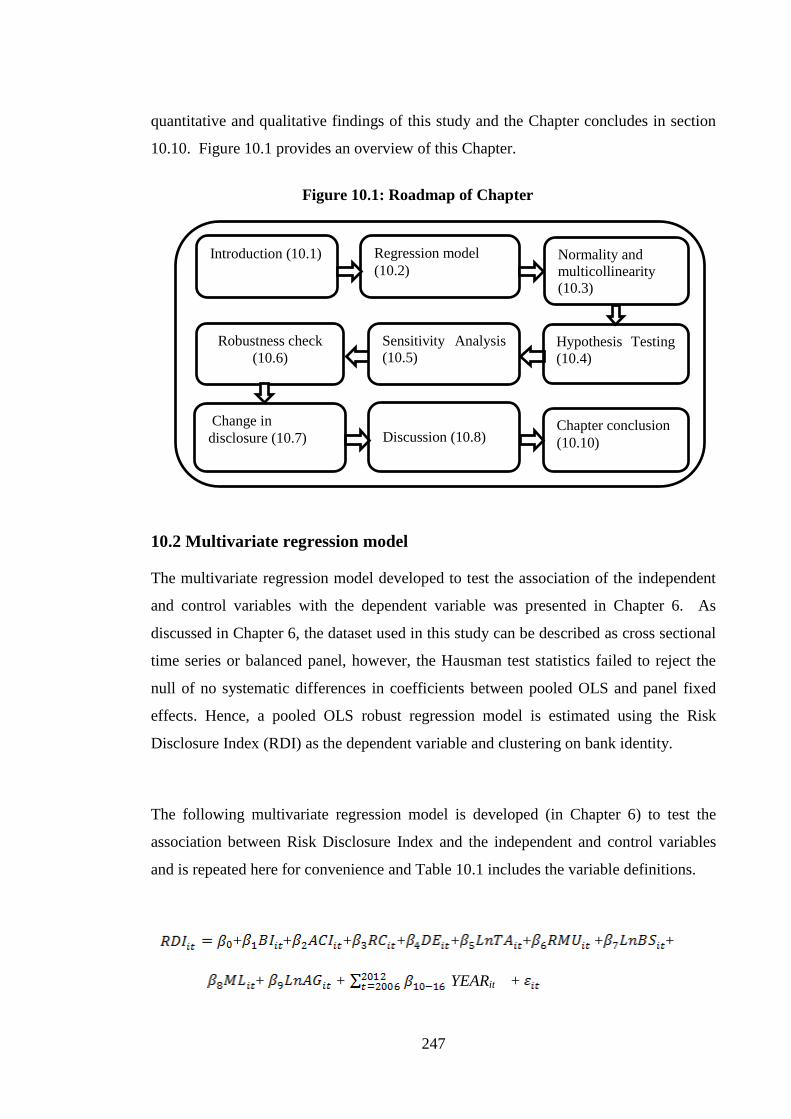
247
quantitative and qualitative findings of this study and the Chapter concludes in section
10.10. Figure 10.1 provides an overview of this Chapter.
10.2 Multivariate regression model
The multivariate regression model developed to test the association of the independent
and control variables with the dependent variable was presented in Chapter 6. As
discussed in Chapter 6, the dataset used in this study can be described as cross sectional
time series or balanced panel, however, the Hausman test statistics failed to reject the
null of no systematic differences in coefficients between pooled OLS and panel fixed
effects. Hence, a pooled OLS robust regression model is estimated using the Risk
Disclosure Index (RDI) as the dependent variable and clustering on bank identity.
The following multivariate regression model is developed (in Chapter 6) to test the
association between Risk Disclosure Index and the independent and control variables
and is repeated here for convenience and Table 10.1 includes the variable definitions.
+ + + + + + + +
+ + YEARit +
27Figure 10.1: Roadmap of Chapter
Introduction (10.1) Regression model
(10.2) Normality and
multicollinearity
(10.3)
Hypothesis Testing
(10.4)
Change in
disclosure (10.7)
Robustness check
(10.6) Sensitivity Analysis
(10.5)
Chapter conclusion
(10.10)
Discussion (10.8)
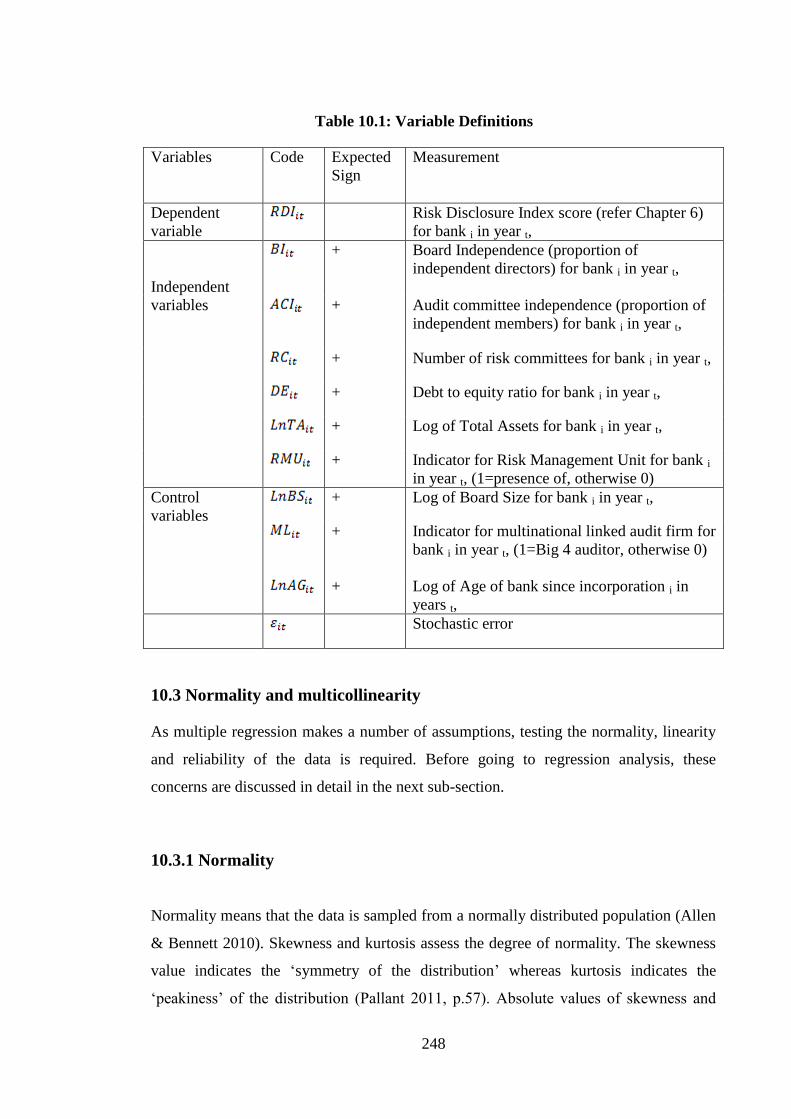
248
Variables Code Expected
Sign
Measurement
Dependent
variable
Risk Disclosure Index score (refer Chapter 6)
for bank i in year t,
Independent
variables
+ Board Independence (proportion of
independent directors) for bank i in year t,
+ Audit committee independence (proportion of
independent members) for bank i in year t,
+ Number of risk committees for bank i in year t,
+ Debt to equity ratio for bank i in year t,
+ Log of Total Assets for bank i in year t,
+ Indicator for Risk Management Unit for bank i
in year t, (1=presence of, otherwise 0)
Control
variables
+ Log of Board Size for bank i in year t,
+ Indicator for multinational linked audit firm for
bank i in year t, (1=Big 4 auditor, otherwise 0)
+ Log of Age of bank since incorporation i in
years t,
Stochastic error
10.3 Normality and multicollinearity
As multiple regression makes a number of assumptions, testing the normality, linearity
and reliability of the data is required. Before going to regression analysis, these
concerns are discussed in detail in the next sub-section.
10.3.1 Normality
Normality means that the data is sampled from a normally distributed population (Allen
& Bennett 2010). Skewness and kurtosis assess the degree of normality. The skewness
value indicates the ‘symmetry of the distribution’ whereas kurtosis indicates the
‘peakiness’ of the distribution (Pallant 2011, p.57). Absolute values of skewness and
38Table 10.1: Variable Definitions

249
kurtosis exceeding 2 and 7 respectively are considered moderately non-normal
distribution (West, Finch & Curran 1995). In addition, Kline (2005) recommended an
absolute kurtosis value greater than 10.0 is indicative of problematic non-normality and
values greater than 20.0 may suggest a serious deviation from normality. Morgan et al.
(2007) suggested skewness and kurtosis statistics between -1.0 to 1.0 are acceptable.
Table 10.2 presents the skewness and kurtosis statistics for the pooled data for the
dependent, control and independent variables.
Table 10.2 indicates the standard error of skewness is 0.181. Hence, twice the standard
error of skewness is (2*.181) 0.362. The range is +0.362 to -0.362 to check whether the
value for skewness falls within this range. As the values in Table 10.2 are within this
range, it can be considered that the distribution is normal. As total assets, board size and
age are skewed to the left, the natural log of these three items is computed. The standard
error of kurtosis is 0.36. Hence, twice the standard error of kurtosis is (2*0.36). The
normality range is therefore +0.72 to -0.72. Table 10.2 indicates that the values of
kurtosis are within this range.

250
Dependent, Independent and Control variables
RDI BI ACI RC DE TA RMU BS ML AG
Skewness -0.266 0.352 -0.026 0.336 -0.336 0.153 -0.331 -0.316 -0.316 0.315
Std. Error 0.181 0.181 0.181 0.181 0.181 0.181 0.181 0.181 0.181 0.181
Kurtosis 0.606 0.716 0 .255 0.684 0.651 0.098 0.463 0 .716 0.004 -0.649
Std. Error 0.360 0.360 0.360 0.360 0.360 0.360 0.360 0.360 0.360 0.360
Legend: Where, RDI denotes Risk Disclosure Index, BI denotes board independence measured as proportion of independent directors on
the board. ACI denotes Audit Committee Independence measured as proportion of independent directors on the audit committee, RC
denotes number of risk committees; DE denotes the debt equity ratio. TA denotes total assets, BS denotes the number of board members,
ML denotes the presence of a multinational linked auditor, AG denotes age measured as numbers of years from incorporation, RMU
denotes presence of a risk management unit.
39Table 10.2: Normality analysis for pooled data (2006-2012) (N=210)

251
10.3.2 Multicollinearity
A lack of multicollinearity concerns is one of the assumptions of multiple regression
models. Problematic levels of multicollinearity affect the behaviour of individual
predictors and coefficient estimates vary in calculation. The Pearson’s correlations
provided in the bivariate statistics in Chapter 9 (Table 9.6) shows no problematic
multicollinearity concern (all correlations are below 0.7) (Hair et al. 2010; Pallant
2010). A collinearity diagnostic table is presented in Table 10.3 and further explains
that multicollinearity is not a concern. The Tolerance statistic in Table 10.3 shows that
the variability for each independent variable exceeds the cut-off point (less than .10).
Table 10.3 further reveals that that the Variance Inflation Factor (VIF) is well below the
cut-off point (above 10). Hence, multicollinearity is not at levels likely to cause
concern. However, for transparency the highest VIF is disclosed for each regression.

252
Legend: VIF* denotes Variance Inflation Factor. BI denotes board independence measured as proportion of independent directors
on the board. ACI denotes Audit Committee Independence measured as proportion of independent directors on the audit committee,
RC denotes number of risk committees; DE denotes the debt equity ratio. LnTA denotes log number of total assets, RMU denotes
presence of a risk management unit, LnBS denotes the log number of board members, ML denotes the presence of a multinational
linked auditor, LnAG denotes log age measured as numbers of years from incorporation.
40Table 10.3: Collinearity statistics for pooled data (2006-2012) (N=210)
Independent and Control variables
BI ACI RC DE LnTA RMU LnBS ML LnAG
Tolerance 0.820 0.730 0.652 0.868 0.669 0.621 0.793 0.799 0.780
VIF* 1.221 1.371 1.534 1.152 1.495 1.611 1.261 1.252 1.282

253
10.4 Multiple regression results: Hypothesis testing
As discussed in the previous section, prior to running the regression, the
multicollinearity of the explanatory variables is tested. In addition, the White (1980)
heteroscedasticity test statistics are reported for the regressions. Table 10.4 reports the
regression results estimating the factors associated with the Risk Disclosure Index for
30 banks per year over a period of seven years from 2006 to 2012. The regression
specification reported in column 1 includes Hypothesis and control variables included in
this study. Additionally, column 2 takes account of Non-Islamic (banks) as a control
variable with other Hypothesis and control variables.
The adjusted coefficient of determination (adjusted R2) indicates that 55 per cent (both
columns) of the variation of the dependent variable is explained by the variation in the
independent variables and the model is highly significant (at p<0.001 level). The first
column in Table 10.4 reveals that the presence of a risk management unit (RMU)57
makes the highest contribution to the dependent variable and age (LnAG) makes the
least unique contribution to the dependent variable. In addition, the regression provides
evidence for acceptance of Hypotheses H2, H4, and H7. That is, a higher number of
independent directors on the board are expected to be associated positively with a
higher extent of risk disclosure (H2) and this result is supported, the number of risk
committees is positively associated with the extent of risk disclosure (H4) and risk
management unit (H7) is positively associated with the extent of risk disclosure (H6).
However, H3: there is a positive association between the proportion of independent
directors on the audit committee and the extent of risk disclosure and H5: coercive
isomorphic pressures are positively associated with the extent of risk disclosure, are not
supported from the empirical findings in this study. The second column in the Table
10.4 reveals that the presence of risk management unit (RMU) and Non-Islamic banks
make the strongest contribution to explaining the dependent variable. In addition, higher
numbers of independent directors on the board are positively associated with a higher
extent of risk disclosure. The number of risk committees is positively associated with
extent of risk disclosure in column one, however, not in column
57
The presence of a Risk Management Unit is not included amongst the 147 items in the Risk Disclosure
Index.

254
Legend: RDI is dependent variable and denotes Risk Disclosure Index. The predictors
BI denotes board independence measured as proportion of independent directors on the
board. ACI denotes Audit Committee Independence measured as proportion of
independent directors on the audit committee, RC denotes number of risk committees.
DE denotes the debt equity ratio, LnTA denotes log of total assets, RMU denotes
presence of a risk management unit, LnBS denotes log number of board members, ML
denotes the presence of a multinational linked auditor and LnAG denotes age measured
as log numbers of years from incorporation. White (1980) heteroscedasticity consistent
coefficients are reported. ***, **, and * denote the level of significance at 1%, 5% and
10%, respectively. t-statistics are reported in brackets.
41Table 10.4: Pooled OLS robust regression results for Risk Disclosure
Index with a sample of 210 bank- years 2006-2012
Variables (1)
(2)
Constant -0.113 -1.913***
(-1.452) (-3.650)
BI 0.630*** 0.554**
(2.834) (2.464)
ACI 0.002 -0.035
(0.034) (-0.461)
RC 0.116** 0.013
(1.974) (1.641)
DE 0.067 0.027
(0.816) (0.312)
LnTA 0.079*** 0.085***
(3.451) (3.553)
RMU 0.135*** 0.135***
(5.487) (5.516)
LnBS 0.048* 0.050**
(1.902) (1.983)
ML 0.078*** 0.067***
(3.015) (2.721)
LnAG 0.024 0.0173
(1.203) (0.815)
Non-Islamic
Year Dummies
-
Yes
0.062***
(3.004)
Yes
R-squared 0.585 0.593
Adj. R-squared
F-Stat.
0.553
27***
0.551
27***
White Stat.(p-value)
No. of Observations
Highest VIF
0.145
210
1.66
0.114
210
1.96

255
10.4.1 Agency theory and Risk Disclosure Index Determinants: Board
independence (BI) and number of risk committees (RC) are significant
As argued in Chapter 5, which discusses the theoretical perspective underpinning the
research, it is argued that the monitoring mechanisms for risk governance through board
independence, audit committee independence and the presence of a risk committee, can
efficiently use risk information in the organisation to minimise information asymmetry
and risk bearing cost. Of the three monitoring mechanisms for risk governance
discussed in Chapter 5, board independence and the number of risk committees reveal
significance (at the 1 per cent and 5 per cent levels respectively) in column one, while
audit committee independence reveals the expected sign (a positive coefficient) but is
not significant in the regression model.
It was envisaged that a higher percentage of independent board members would
positively influence risk disclosure. Consistent with Aebi, Sabato and Schmid (2012);
Baek, Johnson and Kim (2009); Beretta and Bozzolan (2004); Cheng and Courtenay
(2006), Table 10.4 reports that board independence (BI) is a significant predictor of the
Risk Disclosure Index. Board independence is statistically positively significant in
regression model, leading to acceptance of Hypothesis H258
(consistent with agency
theory tenets). A higher percentage of independent board members seem to influence
risk disclosure positively.
The coefficient for the number of risk committees (RC) is statistically significant in
modelling the Risk Disclosure Index. Providing support for agency theory doctrines,
H459
is accepted, indicating that the greater the number of risk committees that banks
has, the more banks disclose their risk information. Consistent with Mongiardino and
Plath (2010), this finding suggests implicitly that risk committees are able to assess the
risk profile through their involvement in monitoring assets and liabilities. Aebi, Sabato
and Schmid (2012) also found the presence of risk committees to be associated with
banks’ performance during the financial crisis period of 2007-2008. Table 10.4 further
58
H2: The number of independent directors on the board is associated positively with the extent of risk
disclosure 59
H4: The number of risk committees is positively associated with the extent of risk disclosure.
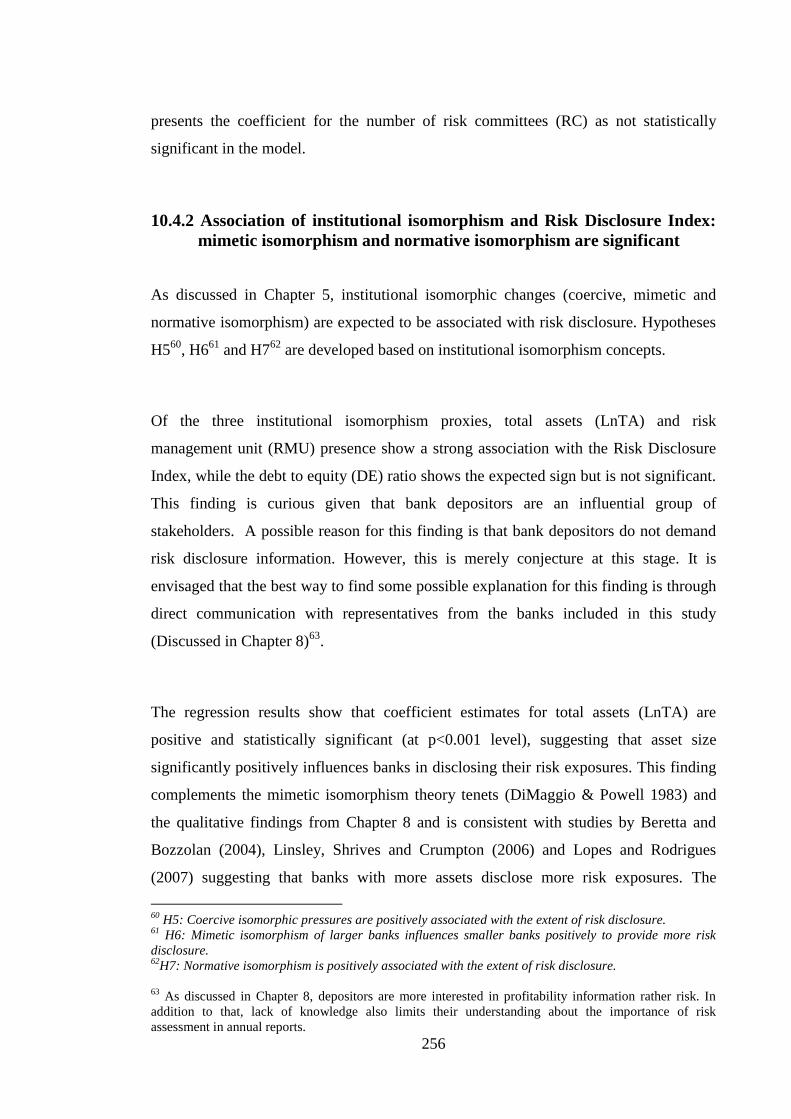
256
presents the coefficient for the number of risk committees (RC) as not statistically
significant in the model.
10.4.2 Association of institutional isomorphism and Risk Disclosure Index:
mimetic isomorphism and normative isomorphism are significant
As discussed in Chapter 5, institutional isomorphic changes (coercive, mimetic and
normative isomorphism) are expected to be associated with risk disclosure. Hypotheses
H560
, H661
and H762
are developed based on institutional isomorphism concepts.
Of the three institutional isomorphism proxies, total assets (LnTA) and risk
management unit (RMU) presence show a strong association with the Risk Disclosure
Index, while the debt to equity (DE) ratio shows the expected sign but is not significant.
This finding is curious given that bank depositors are an influential group of
stakeholders. A possible reason for this finding is that bank depositors do not demand
risk disclosure information. However, this is merely conjecture at this stage. It is
envisaged that the best way to find some possible explanation for this finding is through
direct communication with representatives from the banks included in this study
(Discussed in Chapter 8)63
.
The regression results show that coefficient estimates for total assets (LnTA) are
positive and statistically significant (at p<0.001 level), suggesting that asset size
significantly positively influences banks in disclosing their risk exposures. This finding
complements the mimetic isomorphism theory tenets (DiMaggio & Powell 1983) and
the qualitative findings from Chapter 8 and is consistent with studies by Beretta and
Bozzolan (2004), Linsley, Shrives and Crumpton (2006) and Lopes and Rodrigues
(2007) suggesting that banks with more assets disclose more risk exposures. The
60
H5: Coercive isomorphic pressures are positively associated with the extent of risk disclosure. 61
H6: Mimetic isomorphism of larger banks influences smaller banks positively to provide more risk
disclosure. 62
H7: Normative isomorphism is positively associated with the extent of risk disclosure.
63
As discussed in Chapter 8, depositors are more interested in profitability information rather risk. In
addition to that, lack of knowledge also limits their understanding about the importance of risk
assessment in annual reports.

257
theoretical discussion leads to the Hypothesis in Chapter 5 that mimetic isomorphism in
larger banks has an influence on the extent of risk reporting by smaller banks. However,
the influence of larger banks on smaller banks is not testable empirically, therefore, the
discussion within Chapter 8 (An Exploration of Banks’ Risk Disclosure Practices and
their Determinants in Bangladesh: Qualitative Analysis of Interview Data) provides
support for the mimetic isomorphism (using qualitative data).
The coefficient estimate for the presence of a risk management unit (RMU) is positive
and makes the strongest contribution of the predictor variables to explaining the
dependent variable. The level of statistical significance indicates that the presence of a
risk management unit (RMU) in banks can play a vital role in improving the level of
risk disclosure in financial reporting.
10.4.3 Control variables: multinational linked audit firm (ML) and board
size (LnBS) are significant
The coefficients for the control variables have the expected signs. Of the three control
variables, the presence of a multinational linked audit firm (ML) and board size (LnBS)
are significant at one per cent and 10 per cent respectively. ML has a strong association
with the Risk Disclosure Index in this multivariate analysis. The finding suggests that
banks having multinational linked audit firms communicate more risk information than
those without such auditors. The bivariate and multivariate statistics show that board
size (LnBS) is weakly significant at the 10 per cent level. Another control variable age
(LnAG) is significant in bivariate statistics however insignificant in the multivariate
regression model.
10.5 Sensitivity analysis
Sensitivity analysis is conducted to check the robustness of the main findings from
analysis of the model presented in section 10.5 (see Table 10.5). Sensitivity analysis is
applied to determine the extent to which the independent variables used in the main
multiple regression analysis is sensitive to different measures of the same variables. The
regression specification reported in column 1 includes Hypothesis and control variables

258
included in this study. Additionally, column 2 takes account of Non-Islamic (banks) as a
control variable with other Hypothesis and control variables.
First, in the main regression model (see Table 10.4), coercive isomorphism (CI) is
measured as the debt to equity ratio. CI is not significant in the main regression model.
For sensitivity analysis, CI is measured as the ratio of total assets to total deposits (AD).
Table 10.5 shows the regression model results for sensitivity analysis using total assets
to total deposits as a proxy to recalculate coercive isomorphism. The main regression
model shows the debt to equity ratio is insignificant with a positive coefficient (see
Table 10.4). In sensitivity analysis, assets to deposits (AD) is marginally significant at
the 1 per cent level. The findings show assets to deposits (AD) is weakly significant
despite the insignificance of debt to equity (DE) in the main regression model.
However, the adjusted R2 (51 per cent) falls compared to the main regression (55 per
cent).
Second, board independence is calculated as a proxy to measure risk governance in the
main analysis (see Table 10.6). In sensitivity analysis, board independence is
remeasured with the number of board meetings. Table 10.6 reveals that the number of
board meetings is positively significant as was board independence in the main
regression, apart from the level of significance (board meeting is significant at 5% level
however, board independence is significant at 1% level). The adjusted R2 (49.2 per cent)
goes down compared to the main regression (55%). In conclusion, a different measure
of risk governance does seem to make a difference in hypothesis testing.

259
(Coercive isomorphism= Total assets/total deposits)
Variables (1) (2)
Constant -0.122
(-1.572)
-0.115
(-1.351)
BI 0.583***
(2.604)
0.341***
(1.504)
ACI -0.037
(-0.510)
-0.148
(-0.317)
RC 0.016*
(1.935)
0.116*
(1.334)
AD 0.105*
(1.696)
0.144**
(2.096)
LnTA
0.025*
(1.837)
0.035*
(1.337)
RMU 0.122***
(4.960)
0.112***
(3.860)
LnBS 0.032
(1.184)
0.122
(1.144)
ML 0.080***
(3.349)
0.070***
(2.699)
LnAG -0.001
(-0.087)
-0.071
(-0.481)
Non-Islamic
- 0.152***
(2.691)
Year Dummies Yes
Yes
R-squared
Adj. R-squared
0.533
0.518
0.582
0.537
F-Stat. 22*** 26***
White Stat.(p-value)
Number of observation
Highest VIF
0.134
210
1.67
0.121
210
1.86
Legend: RDI is dependent variable and denotes Risk Disclosure Index. The predictors BI
denotes board independence measured as proportion of independent directors on the board. ACI
denotes Audit Committee Independence measured as proportion of independent directors on the
audit committee, RC denotes number of risk committees, AD denotes total assets to total
deposits, LnTA denotes log number of total assets. RMU denotes presence of a risk
management unit, LnBS denotes log number of board members, ML denotes the presence of a
multinational linked auditor and LnAG denotes age measured as log numbers of years from
incorporation. White (1980) heteroscedasticity consistent coefficients are reported. ***, **, and
* denote the level of significance at 1%, 5% and 10%, respectively. t-statistics are reported in
brackets.
42Table 10.5: Pooled OLS regression results for the Risk Disclosure Index
with a sample of 210 bank years 2006-2012

260
(Board Independence= Board Meeting)
Variables (1) (2)
Constant 0.139
1.821
0.091
0.711
BM 0.128
1.539**
0.105
1.411**
ACI 0.058
0.835
0.138
0.714
RC 0.087
1.858**
0.181
1.947**
DE 0.123
1.142
0.011
1.171
LnTA 0.510
4.526*
0.480
3.221*
RMU 0.145
2.412**
0.114
1.312
LnBS 0.156
2.762***
0.142
1.762*
ML 0.164
2.517***
0.171
1.411
LnAG 0.163
2.562**
0.153
1.682*
Non-Islamic
- 0.121***
(2.701)
Year Dummies Yes
Yes
R-squared
Adj. R-squared
0.519
0.492
0.431
0.412
F-Stat. 23*** 21***
White Stat.(p-value)
Number of
observation
Highest VIF
0.134
210
1.54
0.112
210
1.31
Legend: RDI is dependent variable and denotes Risk Disclosure Index. The predictors
BM denotes board meeting measured number of board meetings. ACI denotes Audit
Committee Independence measured as proportion of independent directors on the audit
committee, RC denotes number of risk committees; DE denotes the debt equity ratio.
LnTA denotes the log number of total assets, LnBS denotes log number of board
members, LnAG denotes log number of age measured as numbers of years from
incorporation, RMU denotes presence of a risk management unit, and ML denotes the
presence of a multinational linked auditor. White (1980) heteroscedasticity consistent
coefficients are reported. ***, **, and * denote the level of significance at 1%, 5% and
10%, respectively. t-statistics are reported in brackets.
43Table 10.6: Pooled OLS regression results for Risk Disclosure Index with a
sample of 210 bank years 2006-2012

261
10.6 Robustness check
This section provides robustness checks of the results reported in Chapters 7 and 9 and
the multiple regression analyses reported in the previous section in this Chapter. This
section provides and discusses further analysis of the predictor and control variables
including use of profitability as a control variable, In addition, this section discusses
predictors and control variables hypothesised to be associated with the five major risk
types (Market, Credit, Liquidity, Operational and Equities). Robustness checks in this
section examine also the association of the Risk Disclosure Index with changes in the
predictors and control variables across the period from 2006-2012.
10.6.1 Association of Risk Disclosure Index with profitability
This section examines return on assets (ROA) as a measure for profitability in the main
regression model. Previous studies (Linsley & Shrives 2005a; Mohobbot 2005) argued
risk and return are related and better risk management companies disclose their risk
management ability to the market. Therefore, the robustness check in this section
investigates the association of the Risk Disclosure Index as the dependent variable in
relation to the independent variables (board independence, audit committee
independence, number of risk committees, debt to equity ratio, log of total assets, risk
management unit) and control variables (log of board size, multinational linked audit
firm, age and return on assets). Table 10.7 presents the regression results using return on
assets as a proxy for profitability (control variable) in the main regression model. Table
10.7 shows the adjusted R2
(51.4 per cent) falls compared to the main regression (55 per
cent). Apart from the level of significance (1, 5 or 10 per cent) this model shows the
same significant predictors (BI, RC, LnTA, RMU, LnBS, and ML). However, no
association is found between Risk Disclosure Index and profitability. Next Chapter
examines in detail the relationship between Risk Disclosure and bank performance.

262
(Profitability= ROA)
Variables (1) (2)
Constant 0.115
(1.370)
0.195
(0.113)
BI 0.636***
(2.831)
0.636*
(1.680)
ACI 0.026
(0.014)
0.001
(0.014)
RC 1.920*
(1.690)
1.020
(0.169)
DE 0.065
(0.800)
0.012
(0.710)
LnTA 0.079***
(3.311)
0.135***
(2.681)
RMU 0.136***
(5.321)
0.136
(1.170)
LnBS 0.047**
(1.990)
0.135**
(1.981)
ML 0.077***
(2.981)
0.124***
(2.681)
LnAG 0.025
(1.224)
0.214
(1.114)
ROA 0.005
(0.090)
0.112
(0.181)
Year Dummies Yes
Yes
R-squared
Adj. R-squared
0.547
0.514
0.477
0.403
F-Stat. 24*** 21***
White Stat.(p-value)
Number of observation
Highest VIF
0.127
210
1.53
0.114
210
1.21
Legend: RDI is dependent variable and denotes Risk Disclosure Index. The predictors BI
denotes board independence measured as proportion of independent directors on the board.
ACI denotes Audit Committee Independence measured as proportion of independent
directors on the audit committee, RC denotes number of risk committees; DE denotes the
debt equity ratio. LnTA denotes log number of total assets, LnBS denotes log number of
board members, LnAG denotes log number of age measured as numbers of years from
incorporation, RMU denotes presence of a risk management unit, and ML denotes the
presence of a multinational linked auditor. ROA denotes return on assets measured as net
profit after tax divided by total assets. White (1980) heteroscedasticity consistent coefficients
are reported. ***, **, and * denote the level of significance at 1%, 5% and 10%,
respectively. t-statistics are reported in brackets.
44Table 10.7: Pooled OLS regression results for Risk Disclosure
Index with a sample of 210 bank years 2006-2012

263
10.6.2 Five types of Risk Disclosure
This section presents regression analyses of the Risk Disclosure Index broken down into
each of the five risk types (separately) with the predictors and control variables
hypothesised in this research. The multiple regression models for these five types of
Risk Disclosure Index are as follows:
+ + + + + + +
+ + + YEARit +
Where:
Dependent variable:
= Market, Credit, Liquidity, Operational and Equities Risk Disclosure Index
scores (separately) for bank i in year t, and the independent variables are as previously
used in the main regression model (discussed in section 10.2).
The regression models in this section explain the variance in each of the five types of
Risk Disclosure comprising the Index. These are Market Risk Disclosure Index
(MRDI), Credit Risk Disclosure Index (CRDI), Liquidity Risk Disclosure Index
(LRDI), Operational Risk Disclosure Index (ORDI), and Equities Risk Disclosure Index
(ERDI) of risk disclosure.
The highest correlations for Market Risk Disclosure Index, Credit Risk Disclosure
Index, Liquidity Risk Disclosure Index, Operational Risk Disclosure Index and Equities
Risk Disclosure Index are below 0.5 (Appendix 10.1 A-E). There is again no
problematic concern with multicollinearity between the independent variables in these
models.
Table 10.8 reports the predictive power of the model from the regression in the pooled
data. The Table presents the relationship between the independent variables (board

264
independence, audit committee independence, number of risk committees, debt to
equity ratio, total assets, presence of a risk management unit) and control variables
(board size, multinational linked audit firm, age) separately with each of the five types
of dependent variable (Liquidity Risk Disclosure Index, Market Risk Disclosure Index,
Operational Risk Disclosure Index, Equities Risk Disclosure Index and Credit Risk
Disclosure Index).
The variable board independence (BI) is statistically significant for Liquidity risk
(LRDI) and Equities risk (ERDI). However, audit committee independence (ACI) is not
significant for any of these regression models. These findings are consistent with the
main regression model discussed in section 10.4.
The coefficient for the number of risk committees (RC) is statistically significant only
in the specification for Liquidity risk (LRDI). This indicates that the greater the number
of risk committees, the more a bank discloses its Liquidity risk. Consistent with
Mongiardino and Plath (2010), this result suggests implicitly that risk committees are
able to assess the level of Liquidity risks through their involvement in monitoring assets
and liabilities.

265
Risks Type
Variables Liquidity
Risk Index
Market
Risk Index
Operational
Risk Index
Equities
Risk Index
Credit
Risk Index
Constant 0.242* 0.311*** -0.051 -0.220 0.097*
(1.691) (4.492) (-0.191) (-1.641) (1.930)
BI 0.226*** 0.041 0.038 0.160*** 0.043
(3.398) (0.639) (0.459) (2.688) (0.692)
ACI 0.098 0.069 0.096 0.117 0.037
(1.383) (0.984) (1.094) (1.594) (0.567)
RC 0.017*** 0.008 -0.007 0.020 -0.003
(2.681) (0.712) (-0.971) (1.342) (-0.461)
DE -0.031 -0.114*** 0.223*** 0.286*** -0.037
(-0.462) (-4.471) (3.244) (3.101) (-0.834)
LnTA 0.038** 0.041*** 0.093*** 0.115*** 0.059***
(1.995) (4.297) (4.508) (5.470) (9.053)
RMU 0.015 0.175*** 0.016 0.126*** 0.156***
(0.633) (4.542) (1.203) (2.364) (5.624)
LnBS 0.033* 0.020 -0.020 -0.025 0.039**
(1.945) (1.016) (-0.327) (-0.748) (2.589)
ML 0.105*** 0.066*** 0.144*** 0.065 0.086***
(3.321) (7.563) (2.687) (1.479) (3.589)
LnAG 0.271 0.016 .006 0.069 0.036
(4.130)*** (0.248) (0.075) (0.987) (0.556)
Adj R2 0.35 0.42 0.34 0.27 0.48
F-Stat. 11.91*** 12.63*** 9.36*** 8.12*** 15.80***
Year Dummies Yes Yes Yes Yes Yes
White Stat. (p-value) 16.40
0.82
12.23
0.76
31.95
0.19
6.31
0.38
31.54
0.20
45Table 10.8: Pooled OLS regression results for five types of risks with a sample of 210 bank years 2006-2012

266
No. of Observations (N)
Highest VIF
210
1.53
210
1.68
210
1.78
210
2.10
210
1.84
Legend: RDI is dependent variable and denotes Risk Disclosure Index. The predictor BI denotes board independence measured as proportion of
independent directors on the board. ACI denotes Audit Committee Independence measured as proportion of independent directors on the audit
committee, RC denotes number of risk committees; DE denotes the debt equity ratio. LnTA denotes log total assets, RMU denotes presence of a risk
management unit, LnBS denotes log number of board members, ML denotes the presence of a multinational linked auditor and LnAG denotes age
measured as log numbers of years from incorporation. White (1980) heteroscedasticity consistent coefficients are reported. ***, **, and * denote the
level of significance at 1%, 5% and 10%, respectively. t-statistics are reported in brackets.

267
The coefficient for the debt to equity ratio is highly significant (at p<0.001 level) in
specifications for Market, Operational and Equities risk. However, its negative sign in
the specification for Market risk indicates that banks with higher debt to equity ratios
are less likely to disclose Market risk exposures, while its positive sign in specifications
for Operational and Equities risk indicates that banks depending on higher debt
financing are more likely to disclose more Operational and Equities risks. This reflects
implicitly the power of creditors in encouraging disclosure of operational and equities
risks. This finding complements the mimetic isomorphism theory tenets (DiMaggio &
Powell 1983) and is consistent with empirical evidence by Beretta & Bozzolan (2004);
Linsley, Shrives & Crumpton (2006) and Lopes & Rodrigues (2007).
The regression results show that the coefficient estimates of the natural logarithm of
total assets (LnTA) are positive and statistically significant in all regressions, suggesting
that asset size is significantly positively associated with banks disclosing their various
types of risk exposures. Specifically, this result is consistent with Beretta and Bozzolan
(2004), Linsley, Shrives and Crumpton (2006) and Lopes and Rodrigues (2007) and
suggests that banks with more assets disclose more types of risk exposures; however,
larger banks disclose more Equities risk items, followed by Operational risk items,
Credit risk items, Market risk items and lastly Liquidity risk items.
The coefficient estimates for the presence of a risk management unit (RMU) for all
types of risk are positive but significant only in specifications for Market risk, Equities
and Credit risk. The lack of statistical significance for Liquidity and Operational risk
disclosure is consistent with empirical evidence provided by Aebi, Sabato and Schmid
(2012). The direction of the coefficients implies that banks with a RMU are likely to
disclose all types of risk because of normative pressures applied through
professionalisation of international disclosure standards. However, the levels of
statistical significance indicate that banks with RMUs are more likely to disclose
Market, Equities and Credit risks in that order.
The regressions results report that the coefficient for the control variable, the presence
of a multinational linked auditor (ML), is positively associated with all risk disclosure

268
types except Equities risk, while the number of board members (BS) is significantly and
positively associated with Liquidity and Credit risk. Age is significant only for
Liquidity risk disclosure.
10.7 Change in Risk Disclosure Index across the sample periods
This section examines the association between the change in Risk Disclosure Index and
the change of predictor variables between sample sub-periods. The regression model is
developed in methodology Chapter and repeated here for convenience.
The multiple regression results based on this new model are used to predict the
association between the change in the Risk Disclosure Index ( ) and change in the
value of the independent (board independence, audit committee independence, risk
committee, debt to equity ratio, total assets, risk management unit presence) and control
(board size, multinational linked audit firm and age) variables between the chosen
groups of years.
The regression model is as follows and Table 10.9 includes the variable definitions.
+ + + +
+ + + +
+ +

269
Variables Code Measurement
Dependent variable
Change in Risk disclosure Index for bank
i year t and t-i,
Independent variables
Change in Board Independence
(proportion of independent directors) for
bank i in year t,
Change in Audit committee
independence (proportion of independent
members) for bank i in year t,
Change in Number of risk committees
for bank i between year t and t-i,
Change in Debt to equity ratio for bank i
between year t and t-i,
Change in Log of Total Assets for bank i
in year t,
Change in Indicator for Risk
Management Unit for bank i in year t,
Control variables
Change in Log of Board Size for bank i
in year t,
Change in Indicator for multinational
linked audit firm for bank i in year t,
Change in Log of Age of bank since
incorporation i in year t,
Stochastic error
Appendices 10.2 to 10.5 reveal that the highest correlation for regressions
remains at less than 0.6. Multicollinearity problems between the independent and
control variables is thus deemed minimal in these change models (change in year 2006
and 2008, 2006 and 2010, 2006 and 2012, and 2010 and 2012). As mentioned in
previous Chapters, this study examined seven years (2006-2012). These periods
included GFC of 2007-2008 that raised significant concern to financial institutions. As a
result, users of financial statements acknowledged that the enhanced disclosures about
financial information could better enable the stakeholders to understand the extent of
46Table 10.9: Variable definitions

270
risk of financial instruments (IASB 2009). This study examines the association between
changes in risk disclosure as the period incorporates one of the first risk disclosures as
required by IFRS 7 since 2007. Banks in Bangladesh voluntarily adopted64
international
standards (IFRS 7 and Basel II: Market Discipline) after GFC 2007-2008 (refer Chapter
3). This study therefore examines the change in risk disclosure among pre, transition
and post reform periods. For example, pre-reform to end of GFC (2006-2008), pre-
reform to end of transition (2006-2010), pre-reform to stability (2006-2012), and post
reform (2010-2012).
The association between change in the Risk Disclosure Index and change in predictor
variables is reported in Table 10.10 with a summary of significance levels reported in
Table 10.11. These two Tables show that the intercept is significant for each change
between years. The intercept is moderately significant (at the 10 per cent level) between
years 2006 and 2008 and at the end of the transitional period (2006 and 2010), the
significance level changes to 5 per cent. This is highly significant in following the year
2006 and 2012. Table 10.12 presents the mean difference in Risk Disclosure Index
between the periods (∆2006-2008, ∆2006-2010, ∆2006-2012, and ∆2010-2012) and
there is a statistically significant differences at p<0.01 level for all these years.
The association between the Risk Disclosure Index and audit committee independence
(ACI) is significant in years 2010 and 2012. The difference implies that after the global
financial crisis, banks put more attention on audit committee independence as a higher
percentage of independent directors on the audit committee has a significant association
with the Risk Disclosure Index (see Tables 10.10 and 10.11).
Tables 10.10 and 10.11 also reveal that the predictor variable, the number of risk
committees (RC), is significant (at p<0.01 level) during GFC and after the GFC period
(2006 and 2010). The debt to equity ratio and log of total assets (LnTA) is significant
(at p<0.001 and p<0.05 level) before the GFC and during the GFC (2006 and 2008).
64
Institute of Chartered Accountants in Bangladesh adopted IFRS 7 as BFRS 7 in January 2010 and
Bangladesh Bank provided Risk Based Capital Adequacy guideline in 2010.

271
Board size (2006 and 2012) is significant at p<0.001 level and other control variables
(ML and LnAG) are insignificant throughout the models.

272
Legend: ∆2006-2008 is change in variables in year 2006 and 2008, ∆2006-2010 is change in variables in year 2006 and 2010, ∆2006-2012 is
change in variables in year 2006 and 2012, and ∆2010-2012 is change in variables in year 2010 and 2012. Change in Risk Disclosure Index
(RDI) is dependent variable. The predictors are ∆BI denotes board independence measured as proportion of independent directors on the board
47Table 10.10 Change in Risk Disclosure Index and change in predictors in pre and post GFC periods
VARIABLES ∆2006_2008 ∆2006_2010 ∆2006_2012 ∆2010_2012
∆BI -0.040 0.204* 0.758* 0.513*
(-0.070) (1.746) (1.684) (1.821)
∆ACI 0.054 -0.072 -0.016 0.313**
(0.517) (-0.392) (-0.081) (1.961)
∆RC 0.001 0.152* 0.011 0.116
(0.132) (1.681) (0.397) (-0.160)
∆DE 0.461* 0.104 0.011 0.014
(1.815) (0.146) (0.062) (-0.261)
∆LnTA 0.113*** 0.179** 0.144** -0.025
(2.813) (2.464) (2.115) (-0.212)
∆RMU 0.057** 0.003* 0.059* 0.201*
(2.050) (1.753) (1.806) (1.750)
∆LnBS -0.017 0.319*** 0.053 0.011
(-0.188) (2.803) (0.592) (-0.225)
∆ML -0.047 -0.077 0.063 -0.017
(-1.358) (-1.184) (0.656) (-0.212)
∆LnAG 0.137** 0.117 0.092 0.122
(2.131) (0.739) (0.579) (-0.721)
Constant 0.006* 0.014* 0.020** 0.241**
(1.773) (1.875) (2.197) (-1.151)
R-squared 0.576 0.665 0.691 0.553
Adj. R-squared
F-Stat.
No. of Observations
Highest VIF
0.499
17.77
60
1.36
0.664
18.79
60
1.58
0.635
17.77
60
1.35
0.493
16.17
60
1.16

273
in ∆ year. ∆ACI denotes Audit Committee Independence measured as proportion of independent directors on the audit committee in ∆ year,
∆RC denotes number of risk committees in ∆ year. ∆DE denotes the debt equity ratio in ∆ year, ∆LnTA denotes log total assets in ∆ year,
∆RMU denotes presence of a risk management unit in ∆year, ∆LnBS denotes log number of board members in ∆ year, and ∆ML denotes the
presence of a multinational linked auditor in ∆ year. ∆LnAG denotes age measured as log numbers of years from incorporation in ∆year. White
(1980) heteroscedasticity consistent coefficients are reported. ***, **, and *denote the level of significance at 1%, 5% and 10%, respectively. t-
statistics are reported in brackets.

274
∆BI ∆ACI ∆RC ∆DE ∆LnTA ∆RMU ∆LnBS ∆ML ∆LnAG
∆2006-2008 S* × × × S* HS*** MS** × × MS**
∆2006-2010 S* S* × S* × MS** S* HS*** × ×
∆2006-2012 MS** S* × × × MS** S* × × ×
∆2010-2012 MS** S* MS** × × × S* × × ×
Legend: Where ∆2006-2008 is change in variables in year 2006 and 2008, ∆2006-2010 is change in variables in year 2006 and 2010,
∆2006-2012 is change in variables in year 2006 and 2012, and ∆2010-2012 is change in variables in year 2010 and 2012. Change in
Risk Disclosure Index (RDI) is dependent variable. The predictors are ∆BI denotes board independence measured as proportion of
independent directors on the board in ∆ year. ∆ACI denotes Audit Committee Independence measured as proportion of independent
directors on the audit committee in ∆ year, ∆RC denotes number of risk committees in ∆ year. ∆DE denotes the debt equity ratio in ∆
year, ∆LnTA denotes log total assets in ∆ year, ∆RMU denotes presence of a risk management unit in ∆year, ∆LnBS denotes log
number of board members in ∆ year, and ∆ML denotes the presence of a multinational linked auditor in ∆ year. ∆LnAG denotes age
measured as log numbers of years from incorporation in ∆year. White (1980) heteroscedasticity consistent coefficients are reported.
***HS denotes highly significant at 1%; **MS denotes moderately significant 5%; *S denotes weak significance at 10%
48Table 10.11: Summary of significant variables from Table 10.10
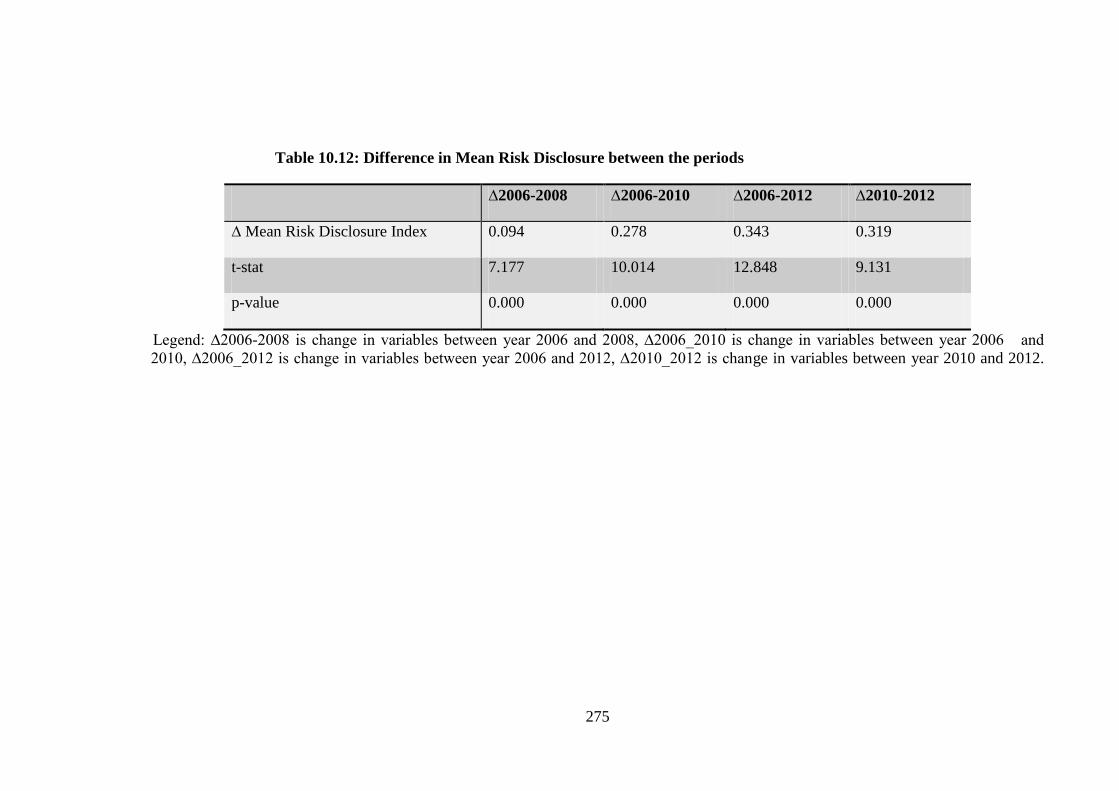
275
∆2006-2008 ∆2006-2010 ∆2006-2012 ∆2010-2012
∆ Mean Risk Disclosure Index 0.094 0.278 0.343 0.319
t-stat 7.177 10.014 12.848 9.131
p-value 0.000 0.000 0.000 0.000
Legend: ∆2006-2008 is change in variables between year 2006 and 2008, ∆2006_2010 is change in variables between year 2006 and
2010, ∆2006_2012 is change in variables between year 2006 and 2012, ∆2010_2012 is change in variables between year 2010 and 2012.
49Table 10.12: Difference in Mean Risk Disclosure between the periods

276
10.8 Discussion of results
This Chapter provides evidence of the predictors of the Risk Disclosure Index across the
period from 2006-2012. The five main Hypotheses are tested in this Chapter. The Table
10.4 main regression model provides evidence for accepting three Hypotheses: H2: The
number of independent directors on the board is associated positively with the extent of
risk disclosure, H4. The number of risk committees is positively associated with the
extent of risk disclosure, and H7: Normative isomorphism is positively associated with
the extent of risk disclosure. Table 10.4 also reveal the significance of Non-Islamic
indicator in regression model.
The regression results (presented in Table 10.4) show that coefficient estimates of total
assets (LnTA) are positive and statistically significant at the 1 per cent level, suggesting
that asset size significantly positively influences banks in disclosing their risk
exposures. This finding complements the qualitative evidence presented in Chapter 8 in
relation to the Hypothesis developed in Chapter 5 (Mimetic isomorphism of larger
banks influences smaller banks to provide more risk disclosure). This Hypothesis is
based on mimetic isomorphism theory tenets (DiMaggio & Powell 1983) and is
consistent with studies by Beretta and Bozzolan (2004), Linsley, Shrives and Crumpton
(2006) and Lopes and Rodrigues (2007), suggesting that banks with more assets
disclose more risk exposures.
The findings also support the theoretical tenets of agency and neo institutional
isomorphism (discussed in Chapter 5). The finding is consistent with results from
previous studies (Abraham & Cox 2007; Dobler, Lajili & Zéghal 2011; Hassan 2009;
Helbok & Wagner 2006; Taylor, Tower & Neilson 2010). The findings also suggest that
banks having larger board size and a multinational linked audit firm communicate more
about risk.
In sensitivity analysis, coercive isomorphism is measured as the ratio of total assets to
total deposits (AD) and the proxy for board independence is remeasured using number
of board meetings (BM) respectively, and both are revealed as statistically significant

277
predictors. In a robustness check, (see Table 10.8) additional regressions are estimated
to explain the variation in the five types of risk disclosure (Liquidity, Market,
Operational, Equities and Credit risk disclosure). The findings suggest that a higher
percentage of independent directors on the board are more important for disclosing
Liquidity and Equities risk. The more risk committees banks have, the more they
disclose Liquidity risks. This suggests implicitly that risk committees are able to assess
the level of Liquidity risks through their involvement in monitoring assets and
liabilities. This finding is consistent with that of Mongiardino and Plath (2010). The
debt to equity ratio is highly significant in Market, Operational and Equities risk
disclosure. This implicitly reflects the power of creditors in their invested companies
disclosing Market, Operational and Equities risks. This finding is consistent with
empirical evidence of Beretta and Bozzolan (2004); Linsley, Shrives and Crumpton
(2006); Lopes and Rodrigues (2007).
Consistent with previous studies (Beretta & Bozzolan 2004; Linsley, Shrives &
Crumpton 2006; Lopes & Rodrigues 2007) total assets (LnTA) is highly significant in
all regressions, suggesting that asset size (LnTA) positively influences banks’ risk
disclosure. However, larger banks tend to disclose more Equities risk, followed by
Operational risk, Credit risk, Market risk and Liquidity risk, in order. In addition, Table
10.8 reveals that banks with a risk management unit disclose more Market, Equities and
Credit risks than other risks.
The Chapter also details analysis that examines the association in risk disclosure
changes over time with the change in independent and control variables (see Tables
10.10-10.11). The mean difference in Risk Disclosure Index is significant in the post
GFC period. This implicitly suggests that the GFC triggered increasing demand for risk
reporting to govern accounting practices and risk disclosure. At the same time, the GFC
created significant concern over risk reporting in banking institutions.

278
10.9 Chapter conclusion
This Chapter sought to investigate the factors underlying the extent of risk disclosure in
banks’ annual reports. Drawing from the literature reviewed in Chapter 4 and theoretical
discussion in Chapter 5, Hypotheses (H2, H4 and H6) have been found to be supported
as determinants of the Risk Disclosure Index together with complementary evidence in
addition to that reported in Chapter 8 regarding mimetic isomorphism. The association
between Risk Disclosure and bank performance is examined in Chapter 11.

279
CHAPTER 11: The Association between Risk Disclosure and Bank
Performance
11.1 Introduction
This Chapter presents the third Phase of a broader study that aims to investigate the
relationship between risk disclosure and bank performance. The relationship between
corporate risk disclosure and bank performance has been a major concern to the global
accounting and financial community in recent times. More specifically, the failure of a
large number of financial institutions (Lehman Brothers, Bear Stearns, Citigroup,
Merrill Lynch, HBOS) during the GFC of 2007-2008 resulted in significant impact on
the global credit market and many of the risk disclosure reforms examined in this study.
Further, it provided motivation to provide a framework for testing the value of risk
governance within financial institutions and led public policy makers to rethink the
rationale for risk governance (Aebi, Sabato & Schmid 2012; Erkens, Hung & Matos
2012; Fahlenbrach & Stulz 2011).
Previous literature argues that greater disclosure benefits investors by providing
financial data and assists them in making profitable investment opportunities (Abraham
& Cox 2007; Lajili 2009). On the contrary, some argue that greater disclosure involves
significant preparation and dissemination costs (Botosan 2004; Healy & Palepu 2001).
Additionally, banks are opaque in nature, which precludes the benefits from increased
risk disclosure (Nier & Baumann 2006).
Despite this, developing countries are characterised by corruption and gaps in
legislation and regulation (Belal, Cooper & Roberts 2013; Siddiqui 2010; Uddin &
Choudhury 2008a). Additionally, institutional pressure might create doubts about the
effectiveness of the Anglo Saxon model of corporate governance in developing
countries (Khan, Muttakin & Siddiqui 2013). This provides a research opportunity to
examine whether the doctrines of risk governance for banks that initiated in developed
countries are appropriate in developing countries.

280
As discussed in Chapter 6, bank performance is measured using two broad aspects:
bank operating performance and bank market performance. Bank operating performance
is measured as financial performance, employee efficiency, solvency efficiency and
deposit concentration. Bank market performance is measured using Tobin’s q and the
book to market ratio. This Chapter uses bank performance variables as dependent
variables (separately) (return on assets, employee efficiency, operating efficiency,
deposit concentration, Tobin’s q, and book to market ratio) and the Risk Disclosure
Index as the independent variable of interest. The extent of risk disclosure is measured
in the first Phases of this study using the Risk Disclosure Index (Chapter 7) and data for
the bank performance measures are derived from sample banks’ annual reports. This
Chapter adopts an econometric approach to testing the hypothesised relationships for 30
listed banks in each year in Bangladesh across the period 2006-2012. In the econometric
analysis, this study also controls for a number of variables (board size, board
independence, bank size, lagged performance measures, leverage, real GDP growth,
inflation rate, year effects). Following Lang and Lundholm (1996) this study uses a
lagged measure of the Risk Disclosure Index in its association with the various
measures of bank performance in order to support arguments about causal relationships.
The multivariate regression model was developed to estimate the association of the
independent and control variables with the dependent variable. Six Pooled OLS robust
regression models are estimated using the performance measures (separately) as the
dependent variable with clustering on bank identity using the White (1980) adjustment.
As discussed in Chapter 6 (Methodology), the following multivariate regression models
are developed to test the association between Risk Disclosure Index and bank
performance. The regression models are repeated here for convenience.
Models 2-5: Operating Performance = (Risk Disclosure Index score, Control variables)
Models 6-7: Bank Market Performance = (Risk Disclosure Index score, Control
variables)

281
+ + + + + +
+ + + + + +
Year it + it … (Models 2-5)
= + + + + + +
+ + Year it + … (Models 6-7)
Where: OPERF represents the respective dependent variable performance measure. For
Models 2-5, the dependent variables modelled are financial performance (ROA),
employee efficiency (EEF), solvency efficiency (SEF) and deposit concentration (DP)
respectively. For Models 6 and 7, MPERF represents bank market performance; the
dependent variables modelled are Tobin’s q (TOBQ) and book to market (BTM).
Coefficient in all models represents the coefficient estimate for the lagged Risk
Disclosure Index for testing the hypothesised relationship. The coefficients
within Models 2-5 and the coefficients within Models 6-7 represent year effects
to control for macroeconomic influences for each year of the analysis period 2006-2012.
is the stochastic Error term in Models 2-7. The variables and the measurement of the
variables are presented in Table 11.1.

282
Variables Code Measurement
Dependent ROA Return on asset (ROA) is calculated as net profit
after tax divided by total assets.
EEF Profit per employee (EEF) is measured as log of
(operating income/ no. of employee)
SEF Solvency efficiency (SEF) is capital divided by
total asset
DP Deposit (DP) is measured as bank deposits
divided total deposits of all banks
TOBQ Total assets – book value of equity + market value
of equity
BTM Book value of assets divided by market value of
assets
Independent variables Lag_RDI Prior year Risk Disclosure Index score
Control Variables LnBS Log of number of directors on the board
LnTA Natural logarithm of total assets
BI Proportion of independent directors on the board
DE Total debt divided by total equity
GDPGR GDP growth (official annual real GDP growth
Figures in per cent)
CPI Official annual Consumer Price Index in per cent
Lag_ROA Prior year return on assets
Lag_EEF Prior year profit per employee
Lag_SEF Prior year capital adequacy ratio
Lag_DP Prior year bank deposits divided total deposits of
all banks
The remainder of the Chapter is organised as follows. First descriptive statistics and
correlations for dependent, independent and control variables appear in section 11.2.
Section 11.3 presents the results of multivariate analysis in relation to examining the
association between risk disclosure and bank performance. Various performance
measures using High and Low disclosure groups are discussed in supplemental analysis
in section 11.4. Discussion of the results is presented in section 11.5 and a Chapter
summary is given in section 11.6. Figure 11.1 provides an overview of this Chapter.
50Table 11.1: Variable definitions
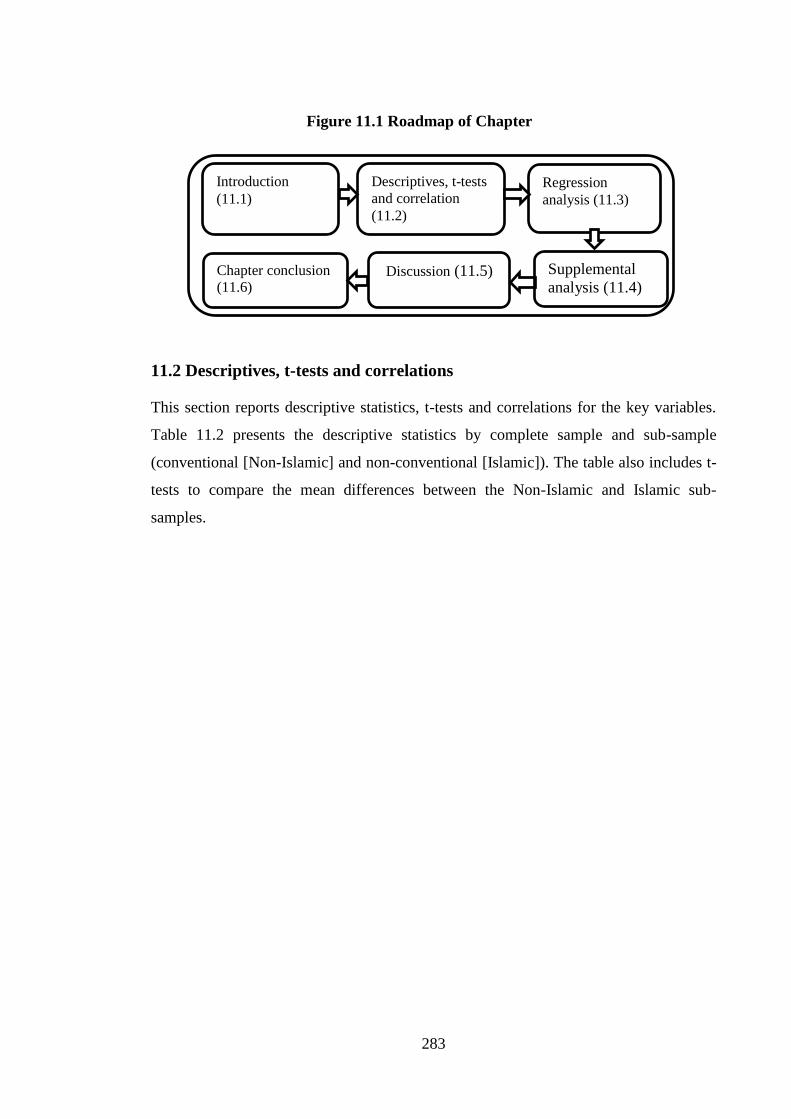
283
Figure 11.1 Roadmap of Chapter
11.2 Descriptives, t-tests and correlations
This section reports descriptive statistics, t-tests and correlations for the key variables.
Table 11.2 presents the descriptive statistics by complete sample and sub-sample
(conventional [Non-Islamic] and non-conventional [Islamic]). The table also includes t-
tests to compare the mean differences between the Non-Islamic and Islamic sub-
samples.
Introduction
(11.1)
Descriptives, t-tests
and correlation
(11.2)
Regression
analysis (11.3)
Supplemental
analysis (11.4)
Discussion (11.5) Chapter conclusion
(11.6)

284
Full sample (N=210) Conventional (Non-Islamic) banks (N=161 or
77%)
Non-Conventional (Islamic) banks (N=49 or 23%) t-test Sig.(2 tailed)
Mean Median Std.Dev. Mean Median Min. Max. Std.Dev. Mean Median Min. Max. Std.Dev.
ROA 1.17 1.3 1.8 1.51 1.42 -1.35 5.18 0.93 0.04 1.03 -10.85 2.65 3.07 5.35 .000
EEF 0.69 0.68 0.74 0.84 0.72 -0.40 2.49 0.54 0.19 0.44 -3.89 1.36 1.05 5.76 .000
DP 0.9 0.81 0.86 0.93 0.81 0.09 8.14 0.98 0.79 0.80 0.58 0.98 0.08 .95 .340
SEF 0.13 0.68 0.67 0.10 0.11 -0.09 0.15 0.03 -0.15 0.11 -4.68 0.18 0.98 3.35 .001
TOBQ 0.85 0.85 0.21 0.84 0.84 0.05 2.01 0.23 0.90 0.89 0.72 1.13 0.10 -1.72 .086
BTM 0.79 0.73 0.98 0.82 0.73 -0.39 10.39 1.10 0.71 0.75 0.01 2.83 0.37 .66 .509
RDI 0.62 0.64 0.19 0.65 0.67 0.20 0.87 0.17 0.52 0.53 0.18 0.83 0.19 4.29 .000
BS 13.86 14 4.4 13.54 14.00 6.00 23.00 4.14 14.90 14.00 5.00 23.00 5.08 -1.90 .059
TA 84.18 68 82.27 82.88 71.00 15.00 824.00 70.91 88.45 47.00 15.00 502.00 112.64 -.41 .679
BI 0.05 0.05 0.04 0.05 0.06 0.00 0.25 0.04 0.03 0.00 0.00 0.20 0.04 4.12 .000
GDPGR 6.25 6.19 0.33 6.25 6.19 5.74 6.71 0.33 6.25 6.19 5.74 6.71 0.33 - -
CPI 7.89 8.1 1.72 7.89 8.10 5.40 10.70 1.72 7.89 8.10 5.40 10.70 1.74 - -
DE 0.93 0.81 0.95 0.97 0.81 0.09 7.88 1.08 0.80 0.80 0.66 0.98 0.07 1.13 .258
Legend: This Table shows the descriptive statistics for the study variables in this Chapter for full sample (210 bank-years). ROA denotes Return on assets (calculated as net
profit after tax divided by total assets), EEF denotes employee efficiency (measured as log of operating income/number of employees), DP denotes bank deposit concentration
calculated as bank deposits divided by total deposits for all banks, SEF denotes solvency efficiency (measured as capital divided by total assets). TOBQ denotes Tobin’s q and
is calculated as total assets-book value of equity + market value of equity and BTM denotes book to market value of assets (calculated as book value of assets divided by
market value of assets). RDI denotes Risk Disclosure Index score (measured as per Chapter 5), BS denotes board size (number of directors on the board), TA denotes bank
size measured as total assets, BI denotes Board Independence (proportion of independent directors on the board). GDP denotes GDP growth (official annual real GDP growth
Figures in percentage terms), CPI denotes inflation rate (official annual consumer price index in percentage terms) and DE denotes leverage, measured as debt to equity ratio.
51Table 11.2: Descriptive and t- statistics by complete sample (bank years N= 210) and sub-sample (Islamic N=49, Non-Islamic N=161)

285
Table 11.2 reports descriptive statistics for the measurement of bank performance
included in this study. The Table includes descriptive statistics for full sample (210
bank-year) and sub-sample (Islamic and Non-Islamic). The mean return on assets
(ROA) for full sample is 1.17 (Non-Islamic mean is 1.51 and Islamic mean is 0.04). A t-
test shows that the mean difference between the Islamic and Non-Islamic banks is
highly significant, indicating that Non-Islamic banks have higher return on assets. The
average employee efficiency (EEF) of 0.84 is higher for Non-Islamic banks compared
to the mean of 0.19 for the Islamic banks with a t- test showing a significant difference
(at p <0.001 level) between these two groups. The solvency efficiency, SEF, (mean
0.10) and board independence, TOBQ (mean 0.82), Risk Disclosure Index, RDI (mean
0.65), BI (mean 0.05) are higher in Non-Islamic banks compare to Islamic banks and
significantly different (at p <0.001 level).
Table 11.2 further reveals that Non-Islamic banks have higher deposit concentration,
DP, (mean 0.93), higher book to market value of asset, BTM, (mean 0.82), higher total
asset, TA, (mean 82.88), debt to equity ratio, DE (mean 0.97) compared to Islamic
banks, however, the mean differences are not statistically significant. The average board
size, BS, (mean 14.90) is higher in Islamic banks compared to Non-Islamic banks and
the mean difference is significant (at p <0.01 level).
Table 11.3 reports the Pearson correlation coefficients and their significance levels for
the variables. Table 11.3 reports that the highest coefficient correlation is 0.565 between
employee efficiency (EEF) and financial performance (ROA). Therefore, Table 11.3
provides no indication that an unacceptably high level of multicollinearity concerns
exist amongst the independent variables.

286
ROA EEF SEF DP TOBQ BTM LnBS BI LnTA Lag_RDI CPI GDPGR DE
ROA 1.000
EEF 0.565**
1.000
SEF 0.340**
0.322**
1.000
DP 0.092 0.023 0.001 1.000
TOBQ 0.022 0.121 -0.048 0.048 1.000
BTM -0.014 -0.033 -0.037 -0.031 0.014 1.000
LnBS 0.500**
0.439**
0.313**
0.100 0.150* -.224
** 1.000
BI 0.111 0.116 0.118 0.051 0.081 0.092 -0.078 1.000
LnTA 0.341**
0.393**
0.151**
-.267**
-0.080 0.026 0.267**
0.152* 1.000
Lag_RDI 0.206**
0.357**
0.248**
0.096 0.150**
0.012 0.157* 0.335
** 0.540
** 1.000
CPI -0.081 -0.040 0.053 0.002 0.037 -0.036 0.040 0.194**
0.232**
0.204**
1.000
GDPGR -0.082 -0.085 -0.046 -0.022 0.028 0.027 -0.049 0.082 0.015 -0.019 0.670**
1.000
DE 0.035 0.171 0.553 0.325 0.256 .021 0.151 0.161 0.154 0.163 0.215 0.021 1.000
Legend: This Table shows the correlation coefficient of study variables used in this Chapter. ROA denotes Return on assets (calculated as net profit
after tax divided by total assets), EEF denotes employee efficiency (measured as log of operating income/number of employees), DP denotes bank
deposit concentration calculated as bank deposits divided by total deposits for all banks, SEF denotes solvency efficiency (measured as capital divided
by total assets). TOBQ is calculated as total assets-book value of equity + market value of equity and BTM denotes book to market value of assets
(calculated as book value of assets divided by market value of assets). Lag_RDI denotes prior year Risk Disclosure Index score (measured as per
Chapter five), BS denotes board size measured as log number of directors on the board, LnTA denotes bank size measured as log of total assets, BI
denotes Board Independence measured as proportion of independent directors on the board). GDP denotes GDP growth (official annual real GDP
growth Figures in percentage terms), CPI denotes inflation rate (official annual consumer price index in percentage terms) and DE denotes leverage,
measured as debt to equity ratio. ***, **, and * denote the level of significance at 1%, 5% and 10%, respectively.
52Table 11.3: Pearson’s Correlations Pooled Data (2006-2012) for Models 2-7 (N=210)

287
Table 11.3 shows the Pearson’s correlations between performance variables including
financial performance (ROA), employee efficiency (EEF), solvency efficiency (SEF),
deposit concentration (DP), Tobin’s q (TOBQ), book to market ratio (BTM) and
Lag_Risk Disclosure Index (Lag_RDI). Of all six-performance variables, ROA, EEF,
and SEF are moderately and positively significantly correlated with the lagged Risk
Disclosure Index (0.206, 0.357, and 0.238 respectively). TOBQ is marginally
significantly correlated (0.150) with the lagged Risk Disclosure Index (Lag_RDI).
Other significant correlations include log board size (LnBS) with ROA, EEF, SEF,
TOBQ and BTM. Further, log of bank size (LnSIZE) is correlated with ROA, EEF,
SEF, DP, TOBQ and LnBS. Together, these significant correlations point to an
association between the Risk Disclosure Index and bank performance on a bivariate
basis.
11.3 Regression analysis
Table 11.4 presents the results of regressing the lagged Risk Disclosure Index
(Lag_RDI) and the control variables on return on assets (ROA: Model 2), employee
efficiency (EEF: Model 3), solvency efficiency (SEF: Model 4) and deposit
concentration (DP: Model 5). The model specification statistics point towards the
models being well specified. The F-statistics for all models are significant (at p<0.001
level) and indicate that all models explain a high proportion of the variation in the
dependent variables except for book to market (Model 7). The models explain 55 per
cent, 68 per cent, 65 per cent, 52 per cent, 43 per cent and 23 per cent of the variation in
the respective dependent variables (return on assets, employee efficiency, operating
efficiency, deposit concentration, Tobin’s q and book to market).
The independent hypothesis variable for all models is the lagged Risk Disclosure Index,
Lag_RDI in order to support arguments about causal relationships in relation to the
various measures of bank performance. Results indicate that the coefficient of Lag_RDI
in Model 3 is highly significant (at p<0.001 level) with a standardised coefficient of
1.271, indicating that including Lag_RDI in the model makes a highly significant
difference in explaining employee efficiency (EEF). Within Model 3, the variables
board size (LnBS), bank size (SIZE), board independence (BI), consumer price index

288
(CPI), and prior year performance proxies (lag_EEF, lag_SEF, Lag_DP) also have
significant relationships with employee efficiency (EEF).
Table 11.4 also reveals that Lag_RDI is moderately significant (at p<0.05 level) in
explaining financial performance (ROA). In this model, coefficients for LnBS, LnTA,
BI, lag_ROA, lag_SEF are highly positively significant predictors in explaining
financial performance.
289
Variables ROA
(Model 2)
EEF
(Model 3)
SEF
(Model 4)
DP
(Model 5)
TOBQ
(Model 6)
BTM
(Model 7)
Constant
-27.832
(-2.901)***
-8.824
(-2.642)**
-2.512
(.052)
14.715
(2.130)**
2.815
(2.861)***
-2.740
(-0.927)
Lag_RDI
1.734
(2.090)**
1.271
(3.651)***
0.440
(1.698)*
0.783
(1.141)
-0.056
(-1.687)*
0.015
(0.085)
LnBS
2.458
(4.031)***
0.861
(3.885)***
0.125
(1.984)**
0.439
(2.085)**
0.083
(2.064)**
-0.426
(1.965)**
LnTA
0.909
(2.684)***
0.282
(2.255)**
0.154
(2.512)**
-0.619
(-2.094)**
-0.085
(-1.937)*
0.177
(-1.685)*
BI
7.621
(2.004)**
2.241
(1.684)*
1.116
(1.552)
0.482
(0.672)
0.077
(0.282)
3.170
(1.059)
GDPGR
0.210
(0.115)
0.213
(1.223)
0.141
(1.224)
0.313
(1.553)
0.572
(0.572)
0.522
(0.572)
CPI
-0.258
(-3.716)
-0.084
(-2.541)**
-.013
(-1.336)
-0.027
(-0.360)
0.005
(1.461)
0.015
(-0.568)
DE
0.222
(1.259)
-0.043
(-0.492)
0.018
(1.524)
0.436
(2.503)**
-0.021
(-3.585)***
0.018
(0.591)
Lag_ROA
0.805
(3.459)***
0.008
(0.416 )
0.021
(1.986 )**
0.080
(1.580 )*
Lag_EEF
0.013
(0.410 )
0.779
(7.505 ***)
-0.008
(-0.549 )
0.038
(0.538)
53Table 11.4: Regression model (Models 2-7) with a sample of 210 bank years 2006-2012

290
Lag_SEF
0.332
(1.568)*
0.143
(1.935)**
0.237
(2.538)**
-.025
(-0.537)
Lag_DP
0.010
(0.373)
0.033
(2.035)**
-.191
(-0.121)
0.227
(1.301)
Year Dummies
Yes Yes Yes Yes Yes Yes
Adj.R-squared
0.55 0.68 0.65 0.52 0.43 0.23
F-Stat.
13.90*** 25.08*** 25.08*** 10.23*** 12.23*** 10.23***
White Stat.(p-value)
0.132 0.153 0.154 0.145 0.126 0.143
No. of Observations 210 210 210 210 210 210
Highest VIF
2.09
2.16
1.15
2.02
1.98
1.65
Legend: The Table shows standardized coefficients, t-statistics in brackets and model specification statistics from pooled OLS regression models
regressing lagged Risk Disclosure Index (RDI) on banks’ operating performances such as financial (ROA), employee efficiency (EEF), solvency
efficiency (SEF), deposit concentration (DP) and bank market performances such as Tobin’s q (TOBQ) and book to market (BTM). Where, the
dependent variable is OPERF proxied as ROA, EEF, SEF and DP (Models 2-5). For Models 6 and 7, dependent variable is MPERF, proxied as TOBQ
and book to market (BTM). The independent variable for Models 2-7 is Lag_RDI. ROA denotes Return on assets (calculated as net profit after tax
divided by total assets), EEF denotes employee efficiency (measured as log of operating income/number of employees), DP denotes bank deposit
concentration calculated as bank deposits divided by total deposits for all banks, SEF denotes solvency efficiency (measured as capital divided by total
assets). TOBQ is calculated as total assets-book value of equity + market value of equity and BTM denotes book to market value of assets (calculated as
book value of assets divided by market value of assets). RDI denotes Risk Disclosure Index score (measured as per Chapter five), BS denotes board size
(log number of directors on the board), LnTA denotes bank size measured as log of total assets, BI denotes Board Independence (proportion of
independent directors on the board). GDP denotes GDP growth (official annual real GDP growth Figures in percentage terms), CPI denotes inflation
rate (official annual consumer price index in percentage terms) and DE denotes leverage, measured as debt to equity ratio. ***, **, and * denote the
level of significance at 1%, 5% and 10%, respectively.

291
Results in Table 11.4 also indicate that solvency efficiency, proxied by SEF, is
marginally significantly (at p<0.10 level) associated with Lag_RDI. Within Model 4,
the control variables LnBS, LnTA, Lag_ROA, Lag_SEF are significant (at p<0.05
level), respectively.
Furthermore, Pearson’s correlation coefficients (Table 11.3) show bank market
performance, proxied by TOBQ, is positively significant with Lag_RDI (at p<0.05
level). However, TOBQ is found to have a marginally negative significant relationship
with Lag_RDI, possibly indicating a market penalty for above average disclosure.
TOBQ also has a significant negative relationship with bank size (LnTA) (at p<0.10
level) and leverage (DE) (at P<0.01 level) and a positive relation with board size
(LnBS) (at p<0.05 level).
However, the other market performance metric, book to market (BTM) shows no
significant relationship with Lag_RDI but has a negative relationship with LnTA( at
p<0.10 level) and a positive relationship with LnBS (at p<0.05 level).
11.4 Supplemental analysis
This section provides supplemental analysis of Models 2-5 (financial performance,
employee efficiency, solvency efficiency, deposit concentration) by examining (1)
whether the association between the Risk Disclosure Index and various performance
measures differs across High and Low Risk Disclosure groups; (2) whether the relation
between the Risk Disclosure Index and various performance measures differs across
Non-Islamic and Islamic banks; and 3) the specific types of Risk Disclosure that have
an association with the measures of bank performances.
11.4.1 Bank performance in risk disclosure groups (High and Low)
Table 11.5 shows the descriptive statistics for the study broken down by Risk
Disclosure Index items into High Risk Disclosers and Low Risk Disclosers. The High
Risk Disclosure group consists of banks for which the Risk Disclosure Index score
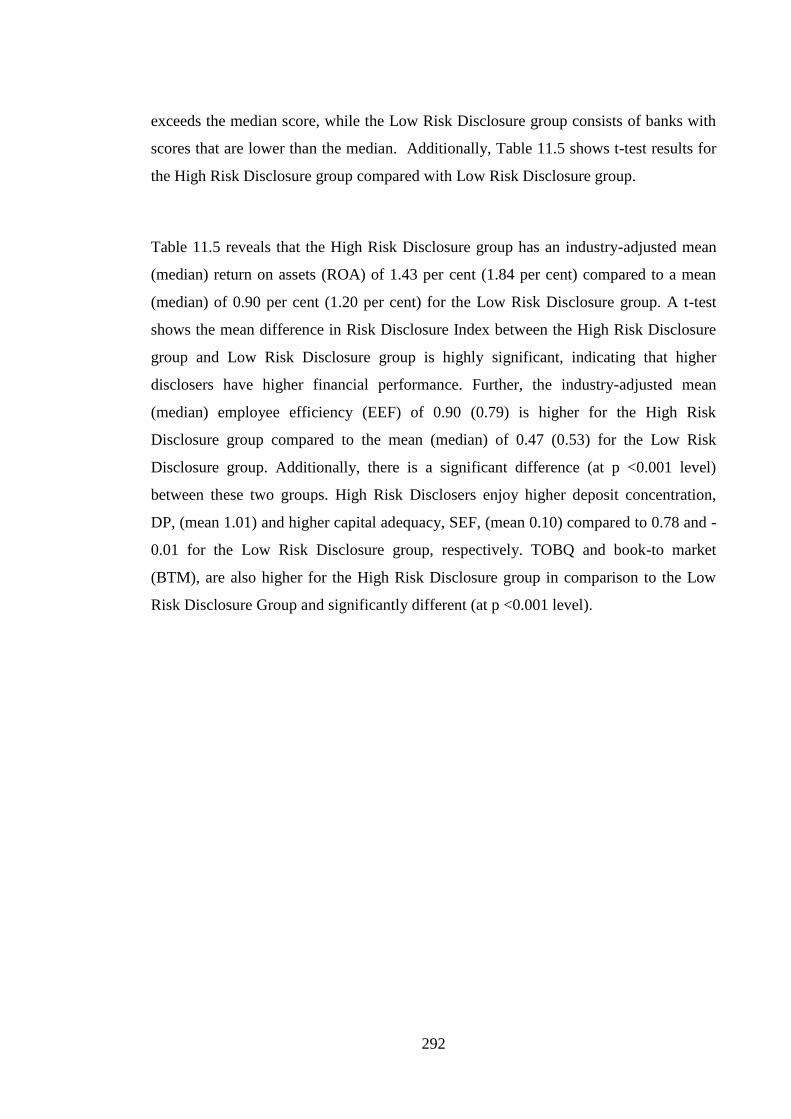
292
exceeds the median score, while the Low Risk Disclosure group consists of banks with
scores that are lower than the median. Additionally, Table 11.5 shows t-test results for
the High Risk Disclosure group compared with Low Risk Disclosure group.
Table 11.5 reveals that the High Risk Disclosure group has an industry-adjusted mean
(median) return on assets (ROA) of 1.43 per cent (1.84 per cent) compared to a mean
(median) of 0.90 per cent (1.20 per cent) for the Low Risk Disclosure group. A t-test
shows the mean difference in Risk Disclosure Index between the High Risk Disclosure
group and Low Risk Disclosure group is highly significant, indicating that higher
disclosers have higher financial performance. Further, the industry-adjusted mean
(median) employee efficiency (EEF) of 0.90 (0.79) is higher for the High Risk
Disclosure group compared to the mean (median) of 0.47 (0.53) for the Low Risk
Disclosure group. Additionally, there is a significant difference (at p <0.001 level)
between these two groups. High Risk Disclosers enjoy higher deposit concentration,
DP, (mean 1.01) and higher capital adequacy, SEF, (mean 0.10) compared to 0.78 and -
0.01 for the Low Risk Disclosure group, respectively. TOBQ and book-to market
(BTM), are also higher for the High Risk Disclosure group in comparison to the Low
Risk Disclosure Group and significantly different (at p <0.001 level).

293
Legend: This Table shows the descriptive statistics for the study variables in this Chapter for full sample (210 bank-years) and classified by disclosure group (Lo: Low
Disclosure group, HI: High Disclosure group). These groups are split at the median. ROA denotes Return on assets (calculated as net profit after tax divided by total
assets), EEF denotes employee efficiency (measured as log of operating income/number of employees), DP denotes bank deposit concentration calculated as bank
deposits divided by total deposits for all banks, SEF denotes solvency efficiency (measured as capital divided by total assets). TOBQ denotes Tobin’s q and is
calculated as total assets-book value of equity + market value of equity and BTM denotes book to market value of assets (calculated as book value of assets divided by
market value of assets). RDI denotes Risk Disclosure Index score (measured as per Chapter 5), BS denotes board size (number of directors on the board), LnTA
denotes bank size measured as total assets, BI denotes Board Independence (proportion of independent directors on the board) and DE denotes leverage, measured as
debt to equity ratio.
54Table 11.5: Descriptive Statistics and t-tests for variables by Risk Disclosure groups (High and Low) (210 bank-years)
Variables Discl.
Group
Mean Median Std.
Deviation
Minimum Maximum t-test Sig.
(2 tailed)
ROA
HI 1.43 1.52 1.68 -9.97 5.18
3.04
0.000 LO 0.90 1.20 1.88 -10.85 3.91
EEF HI 0.90 0.79 0.69 -2.62 2.49
4.34
0.000 LO 0.47 0.53 0.74 -3.89 1.84
DP HI 1.01 0.81 1.20 0.63 8.14
1.94
0.050 LO 0.78 0.81 0.11 0.09 0.98
SEF HI 0.40 0.96 1.21 0.52 7.16
1.58
0.114 LO -0.14 0.41 0.14 -0.11 0.53
TOBQ HI 0.85 0.86 0.12 0.07 1.13
2.96
0.000 LO 0.86 0.84 0.27 0.05 2.01
BTM HI 0.79 0.73 0.97 -0.39 10.39
2.90
0.040 LO 0.80 0.72 0.99 -0.03 10.39
RDI HI 0.77 0.78 0.07 0.64 0.87
8.65
0.000 LO 0.47 0.49 0.13 0.18 0.63
BS HI 14.43 14.00 4.72 5.00 23.00
2.17
0.020 LO 13.29 14.00 4.00 5.00 23.00
LnTA HI 103.90 91 72.57 15 502
3.58
0.000 LO 64.46 48 86.89 16 824
BI HI 0.06 0.06 0.04 0.00 0.25
3.64
0.000 LO 0.04 0.03 0.04 0.00 0.17
DE HI 1.06 0.81 1.33 0.49 7.88
1.14
0.250 LO 0.81 0.81 0.10 0.09 0.98

294
Table 11.5 also reveals that the High Risk Disclosure group, on average has larger
boards, more independent boards and higher debt to equity ratios. Mean bank size
(LnTA) points toward the High Risk Disclosure group being on average of higher size
compared to the Low Risk Disclosure group. The mean difference is highly significant
for bank size (LnTA) and board independence (BI). Taken together, the t-tests in this
study suggest that High Risk Discloser banks are larger in size, have an independent
board, are extensively leveraged, have higher solvency and return on asset ratios, are
better governed with high employee efficiency and generate higher bank valuation.
Table 11.6 shows the results of regression analysis for the models with various
measures of performance as the dependent variables and the lagged Risk Disclosure
Index for each of the High and Low Risk Disclosure groups as the Hypothesis variables.
In general, the Low Risk Disclosure group has much lower variation in performances
compared to the High Risk Disclosure group. Lag_RDI is significantly (at p<.001 level)
positively related to ROA for the High Risk Disclosure group, indicating that for high
risk disclosers, lagged disclosure is strongly associated with financial performance.
Table 11.6 further reveals that the adjusted R2 for the deposit concentration (DP) model
is 0.57. This indicates that High Risk Disclosers are associated with higher deposit
concentration in the market. This possibly encourages bank management to provide a
consistent impression in the market with a self-projected image of a transparent,
straightforward bank. Additionally, the adjusted R2 for all Models is high and the F-
statistics for all four Models are significant at the 1 per cent level and explain a high
proportion of variation in the dependent variable. Further, the significant results for
variables Year 2007 and Year 2008 indicate that the period of the GFC had a significantly
negative impact on financial performance (ROA), employee efficiency (EEF) and
deposit concentration (DP) for the High Risk Disclosure group.

295
55Table 11.6: Regression results for High and Low Risk Disclosure groups with a sample of 210 bank years 2006-2012
Variables ROA EEF OEF DP
HI LO HI LO HI LO HI LO
Constant -12.937** -21.141 -4.328 -6.183 -0.221 5.7719* 20.7453** 0.245
(-2.27) (-1.078) (-1.563) (-0.790) (-0.328) (-1.844) (-2.152) (-0.378)
Lag_RDI 1.755*** 0.330 -0.7141* 0.249 -0.014 0.094 0.695 0.1713**
-2.720 -0.498 (-1.807) (-0.876) (-0.110) (-0.607) (-0.576) (-2.131)
LnBS 0.220 0.868 0.052 0.254 0.020 -0.074 0.328 -0.020
(-1.171) (-1.191) (-0.474) (-0.896) (-0.123) (-0.934) (-1.486) (-1.036)
LnTA 0.039 0.301 0.051 0.051 0.019 -0.145 -1.1982** -0.027
(-0.345) (-0.891) (-0.834) (-0.389) (-1.122) (-1.632) (-2.449) (-1.476)
BI 2.951 2.928 0.389 0.706 -0.101* -0.718 -0.296 -0.240
(-1.200) (-0.900) (-0.413) (-0.548) (-1.122) (-1.269) (-0.244) (-1.191)
GDPGR 2.7824*** 2.540 0.8347* 0.994 -0.117 -0.246 1.8142* 0.086
(-3.003) (-1.264) (-1.737) (-1.154) (-0.511) (-1.100) (-1.756) (-0.834)
CPI -0.6052*** -0.582 -0.1969** -0.221 0.017 0.053 -0.335 -0.014
(-3.427) (-1.399) (-2.175) (-1.225) (-0.211) (-1.240) (-1.615) (-0.664)
DE 0.0529* 0.670 -0.024 -0.023 0.021 -0.989 0.3380** 0.7545***
(-1.726) (-0.442) (-1.520) (-0.037) (-0.211) (-1.428) (-2.121) (-4.920)
Lag_ROA 0.5475*** 0.6485*** -0.038 -0.022 0.0150* 0.036 0.1975** 0.007
(-5.067) (-4.380) (-0.362) (-0.304) (-1.665) (-1.553) (-2.579) (-0.861)
Lag_EEF 0.034 0.278 0.7767*** 0.8052*** -0.010 -0.008 0.100 -0.011
(-0.200) (-1.000) (-4.786) (-5.637) (-1.022) (-0.196) (-0.661) (-0.540)
Lag_SEF 7.8386*** 0.235 1.620 0.123 0.9701*** 0.6546*** -1.446 0.010
(-2.769) (-1.134) (-1.142) (-1.411) (-5.109) (-2.786) (-1.318) (-0.870)
ROA EEF OEF DP

296
Legend: The Table shows standardised coefficients, t statistics in the parentheses and model specification statistics from pooled OLS
regression models regressing bank’s financial performance (ROA), employee efficiency (EEF), solvency efficiency (SEF), and deposit
concentration (DP) on lagged High and Low Risk Disclosure Index groups. The High Risk Disclosure group consists of banks where the
Risk Disclosure Index (RDI) score exceeds the median score 0.64 (calculated in Table 8.1, Chapter 8: Descriptive statistics), while the Low
Risk Disclosure group consists of banks with RDI scores that are lower than the median.
ROA denotes return on assets (calculated as net profit after tax divided by total assets), EEF denotes employee efficiency (measured as log
of operating income/number of employees), DP denotes bank deposit concentration calculated as bank deposits divided by total deposits
for all banks, SEF denotes solvency efficiency (measured as capital divided by total assets). TOBQ is calculated as total assets-book value
of equity + market value of equity and BTM denotes book to market value of assets (calculated as book value of assets divided by market
value of assets). RDI denotes Risk Disclosure Index score (measured as per Chapter 8), BS denotes board size (log number of directors on
the board), LnTA denotes bank size measured as log of total assets, BI denotes Board Independence (proportion of independent directors
on the board). GDP denotes GDP growth (official annual real GDP growth Figures in percentage terms), CPI denotes inflation rate (official
annual consumer price index in percentage terms) and DE denotes leverage, measured as debt to equity ratio. Year 2007 and Year 2008 are
year dummies for year 2007 and year 2008.
***, **, and * denote the level of significance at 1%, 5% and 10%, respectively.
Lag_DP 0.028 -0.122 0.0359* -0.011 -0.001 -0.077 0.184 0.229
(-1.162) (-0.172) (-1.958) (-0.035) (-1.105) (-0.585) (-1.469) (-1.313)
Year 2007 -1.8756*** -1.661 -0.6777* -0.718 0.028 0.027 -1.9267** -0.055
(-2.821) (-1.393) (-1.951) (-1.294) (-0.739) (-0.170) (-2.014) (-0.702)
Year 2008 -0.329 0.101 -0.139 -0.078 0.005 0.023 -0.5998** -0.033
(-1.487) (-0.389) (-1.416) (-0.718) (-0.631) (-0.475) (-2.015) (-1.642)
Observations 103 77 103 77 103 77 103 77
Adj. R-
squared
0.797 0.777 0.691 0.730 0.914 0.772 0.573 0.624
F-Stat. 10.21*** 11.64*** 28.86*** 15.54*** 24.48*** 4.54*** 5.95*** 22.54***
Highest VIF 2.130 1.230 1.990 1.960 2.130 1.240 1.780 1.450

297
11.4.2 Bank performance and risk disclosure in Non-Islamic and Islamic
banks
This section reports the regression results estimating the factors associated with bank
performance for 30 banks (23 Non-Islamic and 7 Islamic) over a period of seven-years
from 2006-2012. Table 11.7 presents the results of regressing the lagged Risk disclosure
Index (Lag_RDI) and the control variables on return on assets (ROA:Model 2),
employee efficiency (EEF: Model 3), solvency efficiency (SEF: Model 4), deposit
concentration (DP: Model 5), Tobin’s q (Model 6) and book-to market (BTM: Model
7).
The adjusted coefficient of determination (adjusted R2) indicates that the models explain
77 per cent, 74 per cent, 76 per cent, 31 per cent, 44 per cent, and 43 per cent of the
variation of the respective dependent variables (ROA, EEF, SEF, DP, Tobin’s q and
BTM) and the models are highly significant (at p<0.001 level). Table 11.7 reveals that
Lag_RDI, is significant in explaining financial performance (ROA), employee
efficiency (EEF), solvency efficiency (SEF) (at p<0.1 level) and deposit concentration
(DP) at p<0.05 level. The indicator variable Non-Islamic bank is moderately significant
(at p<0.05 level) in the models with ROA, EEF and Tobin’s q as the dependent
variables. Further relationships exist with control variables board size (LnBS), bank size
(LnTA), (at p< 0.1 level) and lag ROA (at p<0.1) Model 2. Additionally, in Model 3,
bank size (LnTA), lag solvency efficiency (Lag_SEF) are significant (at p< 0.01 level).
GDP growth (GDPGR), consumer price Index (CPI) (at p< 0.05 level), and lag
efficiency (Lag_EEF) are also significant (at p< 0.001 level) in this Model.

298
VARIABLES ROA
(Model 2)
EEF
(Model 3)
SEF
(Model 4)
DP
(Model 5)
TOBQ
(Model 6)
BTM
(Model 7)
Constant 0.486 0.593 0.341 19.344** 2.602** -2.932
(0.129)
(0.398) (1.041) (2.189) (2.443) (-1.349)
Lag_RDI 0.596* 0.119* 0.011* 1.412** 0.001 0.225
(1.696)
(1.804) (1.769) (1.978) (0.010) (0.770)
LnBS 0.435* 0.100 0.018* 0.263* 0.060* -0.397
(1.685)
(0.792) (1.678) (1.755) (1.682) (-1.285)
LnTA 0.058 0.043* 0.003* 0.751** 0.074* 0.129*
(1.689)*
(1.697) (0.594) (2.211) (1.765) (1.843)
BI 1.029 -0.310 0.248* 0.082 0.193 3.428
(0.607)
(-0.465) (1.835) (0.095) (0.525) (1.299)
GDPGR -0.269 -0.214** -0.020 0.208 -0.015 0.184
(-1.212)
(-2.169) (-0.893) (0.980) (-0.362) (1.012)
CPI -0.087 -0.033 -0.006 -0.020 0.009 0.029
(-1.617)
(-1.544) (-1.462) (-0.578) (0.110) (1.053)
DE -0.396 -0.429** 0.130** 0.345 0.014 0.238
(-0.671)
(-2.119) (2.221) (1.325) (0.167) (1.117)
Lag_ROA 0.852*** 0.032 0.011 0.187* -0.013 0.029
(7.171)
(0.582) (1.315) (1.778) (-0.818) (0.465)
Lag_EEF -0.127 0.733*** 0.005 -0.273 0.089*** -0.021
56Table 11.7 :Regression results for High and Low Risk Disclosure groups with a sample of 210 bank years 2006-2012
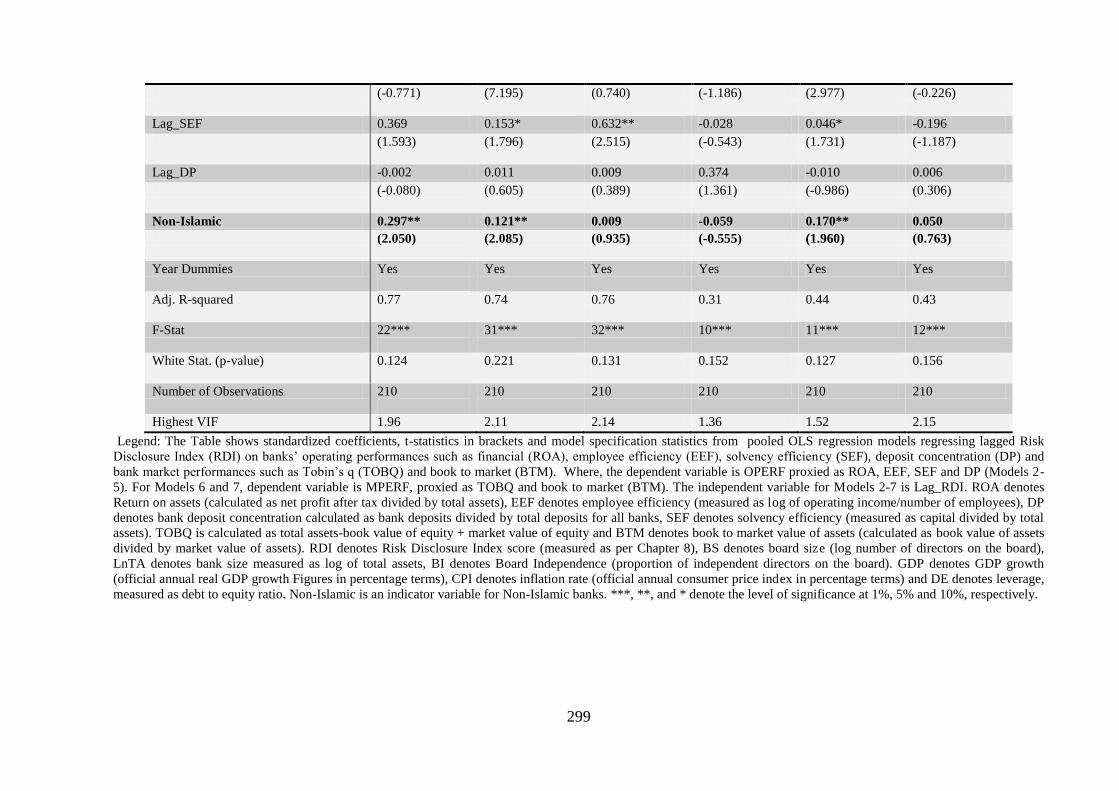
299
(-0.771)
(7.195) (0.740) (-1.186) (2.977) (-0.226)
Lag_SEF 0.369 0.153* 0.632** -0.028 0.046* -0.196
(1.593)
(1.796) (2.515) (-0.543) (1.731) (-1.187)
Lag_DP -0.002 0.011 0.009 0.374 -0.010 0.006
(-0.080)
(0.605) (0.389) (1.361) (-0.986) (0.306)
Non-Islamic 0.297** 0.121** 0.009 -0.059 0.170** 0.050
(2.050)
(2.085) (0.935) (-0.555) (1.960) (0.763)
Year Dummies Yes
Yes Yes Yes Yes Yes
Adj. R-squared 0.77
0.74 0.76 0.31 0.44 0.43
F-Stat 22***
31*** 32*** 10*** 11*** 12***
White Stat. (p-value) 0.124
0.221 0.131 0.152 0.127 0.156
Number of Observations 210
210 210 210 210 210
Highest VIF 1.96 2.11 2.14 1.36 1.52 2.15
Legend: The Table shows standardized coefficients, t-statistics in brackets and model specification statistics from pooled OLS regression models regressing lagged Risk
Disclosure Index (RDI) on banks’ operating performances such as financial (ROA), employee efficiency (EEF), solvency efficiency (SEF), deposit concentration (DP) and
bank market performances such as Tobin’s q (TOBQ) and book to market (BTM). Where, the dependent variable is OPERF proxied as ROA, EEF, SEF and DP (Models 2-
5). For Models 6 and 7, dependent variable is MPERF, proxied as TOBQ and book to market (BTM). The independent variable for Models 2-7 is Lag_RDI. ROA denotes
Return on assets (calculated as net profit after tax divided by total assets), EEF denotes employee efficiency (measured as log of operating income/number of employees), DP
denotes bank deposit concentration calculated as bank deposits divided by total deposits for all banks, SEF denotes solvency efficiency (measured as capital divided by total
assets). TOBQ is calculated as total assets-book value of equity + market value of equity and BTM denotes book to market value of assets (calculated as book value of assets
divided by market value of assets). RDI denotes Risk Disclosure Index score (measured as per Chapter 8), BS denotes board size (log number of directors on the board),
LnTA denotes bank size measured as log of total assets, BI denotes Board Independence (proportion of independent directors on the board). GDP denotes GDP growth
(official annual real GDP growth Figures in percentage terms), CPI denotes inflation rate (official annual consumer price index in percentage terms) and DE denotes leverage,
measured as debt to equity ratio. Non-Islamic is an indicator variable for Non-Islamic banks. ***, **, and * denote the level of significance at 1%, 5% and 10%, respectively.

300
Table 11.7 further reports that no significant relationship exist with the indicator
variable Non-Islamic in solvency efficiency (SEF), deposit concentration (DP) and
book-to-market (BTM). However, the control variable, board size (LnBS), is explaining
the association with SEF and Tobin’s q (at p<0.01 level), bank size (LnTA) with all
Models at p<0.01 level except DP at p<0.05 level. The debt to equity ratio is
significantly (at 0.05 level) associated with EEF and SEF.
11.4.3 Bank performance and Risk Types
As discussed in Chapter 7, the composite Risk Disclosure Index includes five types of
Risk Disclosure, comprised of Market, Credit, Liquidity, Operational and Equities.
Tables 11.8 to 11.12 show the results of regressing the lagged Market Risk Disclosure
Index (Lag_MRDI), lagged Credit Risk Disclosure Index (Lag_CRDI), lagged Liquidity
Risk Disclosure Index (Lag_LRDI), lagged Operational Risk Disclosure Index
(Lag_ORDI) and lagged Equities Risk Disclosure Index (Lag_ERDI) on bank
performance. Performance measures are the dependent variables following Models 2-7
as explained in section 11.3. The definitions for control variables are the same as for
Models 2-7.
The analysis examines the variation in the performance proxies for types of Risk
Disclosure Index for the full sample (210 bank years). Tables 11.8 to 11.12 suggest
lagged Market Risk Disclosure Index (Lag_MRDI) and lagged Equities Risk Disclosure
Index (Lag_ERDI) are highly (at p<.001 level) significantly related to ROA. Further,
significant relationships exist with control variables board size (LnBS), bank size (Size),
board independence (BI), consumer price index (CPI) and lag ROA. The F-statistic is
significant and the adjusted R2
is reasonable for all models presented in Table 11.5 to
11.9.
Tables 11.8 to 11.12 also reveal that employee efficiency (EEF) is significantly (at
p<.01) positively related to the lagged Market Risk Disclosure Index (Lag_MRDI) and
lagged Equities Risk Disclosure Index (Lag_ERDI). Most control variables are
significantly related to EEF. The F-statistic is significant at the p<.01 level however, the

301
adjusted R2s are 36 per cent, 29 per cent, 14 per cent, and 42 per cent for the lagged
Credit Risk Disclosure Index (Lag_CRDI) in models 2-5 respectively. Additionally, the
adjusted R2s for lagged Liquidity Risk Disclosure Index (Lag_LRDI) are 0.40, 0.33,
0.28, and 0.45. Of the five types of Risk Disclosure included in the Index, only
Lag_MRDI is marginally significantly (at p<0.1 level) in its association with solvency
efficiency (SEF).
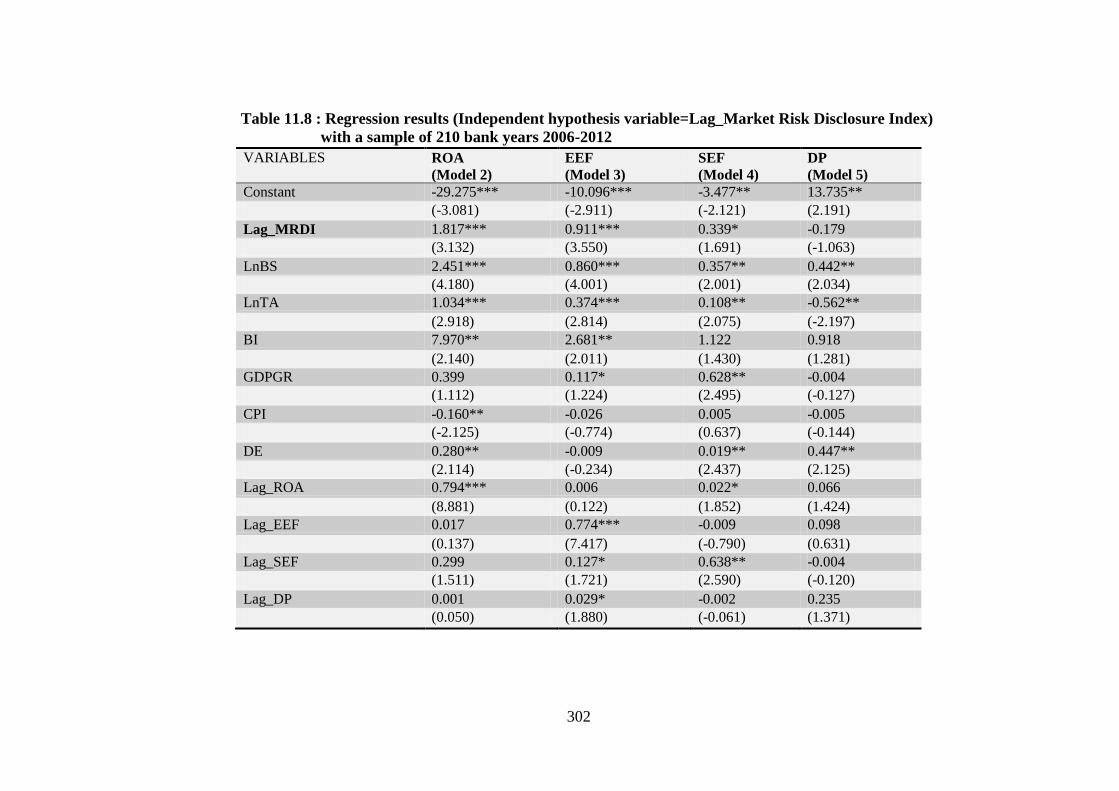
302
VARIABLES ROA
(Model 2)
EEF
(Model 3)
SEF
(Model 4)
DP
(Model 5)
Constant -29.275*** -10.096*** -3.477** 13.735**
(-3.081) (-2.911) (-2.121) (2.191)
Lag_MRDI 1.817*** 0.911*** 0.339* -0.179
(3.132) (3.550) (1.691) (-1.063)
LnBS 2.451*** 0.860*** 0.357** 0.442**
(4.180) (4.001) (2.001) (2.034)
LnTA 1.034*** 0.374*** 0.108** -0.562**
(2.918) (2.814) (2.075) (-2.197)
BI 7.970** 2.681** 1.122 0.918
(2.140) (2.011) (1.430) (1.281)
GDPGR 0.399 0.117* 0.628** -0.004
(1.112) (1.224) (2.495) (-0.127)
CPI -0.160** -0.026 0.005 -0.005
(-2.125) (-0.774) (0.637) (-0.144)
DE 0.280** -0.009 0.019** 0.447**
(2.114) (-0.234) (2.437) (2.125)
Lag_ROA 0.794*** 0.006 0.022* 0.066
(8.881) (0.122) (1.852) (1.424)
Lag_EEF 0.017 0.774*** -0.009 0.098
(0.137) (7.417) (-0.790) (0.631)
Lag_SEF 0.299 0.127* 0.638** -0.004
(1.511) (1.721) (2.590) (-0.120)
Lag_DP 0.001 0.029* -0.002 0.235
(0.050) (1.880) (-0.061) (1.371)
57Table 11.8 : Regression results (Independent hypothesis variable=Lag_Market Risk Disclosure Index)
with a sample of 210 bank years 2006-2012

303
Year Dummies Yes Yes Yes Yes
Adj. R-squared
0.410 0.563 0.471 0.475
F-Stat.
11.69*** 23.18*** 15.23*** 10.16***
Highest VIF 1.96 2.10 1.10 1.85
Legend: The Table shows standardised coefficients, t statistics in brackets and model specification statistics from main pooled OLS regression
models regressing lagged Market Risk Disclosure Index (MRDI) on bank’s financial (ROA), employee efficiency (EEF), solvency efficiency
(SEF), and deposit concentration (DP). The regression Model in Table 11.5 is as follows.
+ + + + + + + + + +
+ + + it
Where, the dependent variable is OPERF proxied as ROA, EEF, SEF or DP and the independent variable is Lag_MRDI. ROA denotes Return on
assets (calculated as net profit after tax divided by total assets), EEF denotes employee efficiency (measured as log of operating income/number
of employees), DP denotes bank deposit concentration calculated as bank deposits divided by total deposits for all banks, SEF denotes solvency
efficiency (measured as capital divided by total assets). TOBQ is calculated as total assets-book value of equity + market value of equity and
BTM denotes book to market value of assets (calculated as book value of assets divided by market value of assets). Lag_MRDI denotes prior
year Market Risk Disclosure Index score (measured in Chapter 5), BS denotes board size (number of directors on the board), LnTA denotes bank
size measured as total assets, BI denotes board independence (proportion of independent directors on the board). GDP denotes GDP growth
(official annual real GDP growth Figures in percentage terms), CPI denotes inflation rate (official annual consumer price index in percentage
terms) and DE denotes leverage, measured as debt to equity ratio. Lag_ROA, Lag_EEF, Lag_OEF and Lag_DP are prior year lagged
performance. ***, **, and * denote the level of significance at 1%, 5% and 10%, respectively.

304
VARIABLES ROA
(Model 2)
EEF
(Model 3)
SEF
(Model 4)
DP
(Model 5)
Constant -30.130*** -10.449*** -3.542** 13.679**
(-2.960) (-2.761) (-2.101) (2.184)
Lag_CRDI -0.172 -0.271 -0.263 -0.084
(-0.275) (-0.975) (-1.295) (-0.364)
LnBS 2.460*** 0.855*** 0.347** 0.440**
(3.882) (3.592) (1.994) (2.044)
LnTA 1.035*** 0.376*** 0.110** -0.561**
(2.765) (2.635) (2.015) (-2.197)
BI 8.803** 3.145** 1.337 1.017
(2.177) (2.107) (1.448) (1.329)
GDPGR 0.115 0.25* 0.637** -0.01
(1.301) (1.755) (2.594) (-0.265)
CPI -0.219*** -0.051 0.004 -0.009
(-2.724) (-1.446) (0.026) (-0.274)
DE 0.242* -0.024 0.017* 0.445**
(1.767) (-0.526) (1.927) (2.106)
Lag_ROA 0.794*** 0.008 0.022* 0.066
(8.977) (0.156) (1.846) (1.466)
Lag_EEF 0.048 0.789*** -0.010 0.094
(0.367) (7.566) (-0.887) (0.607)
Lag_SEF 0.325 0.135* 0.637** -0.010
(1.604) (1.757) (2.597) (-0.268)
58Table 11.9: Regression results (Independent hypothesis variable=Lag Credit Risk Disclosure Index)
with a sample of 210 bank years 2006-2012
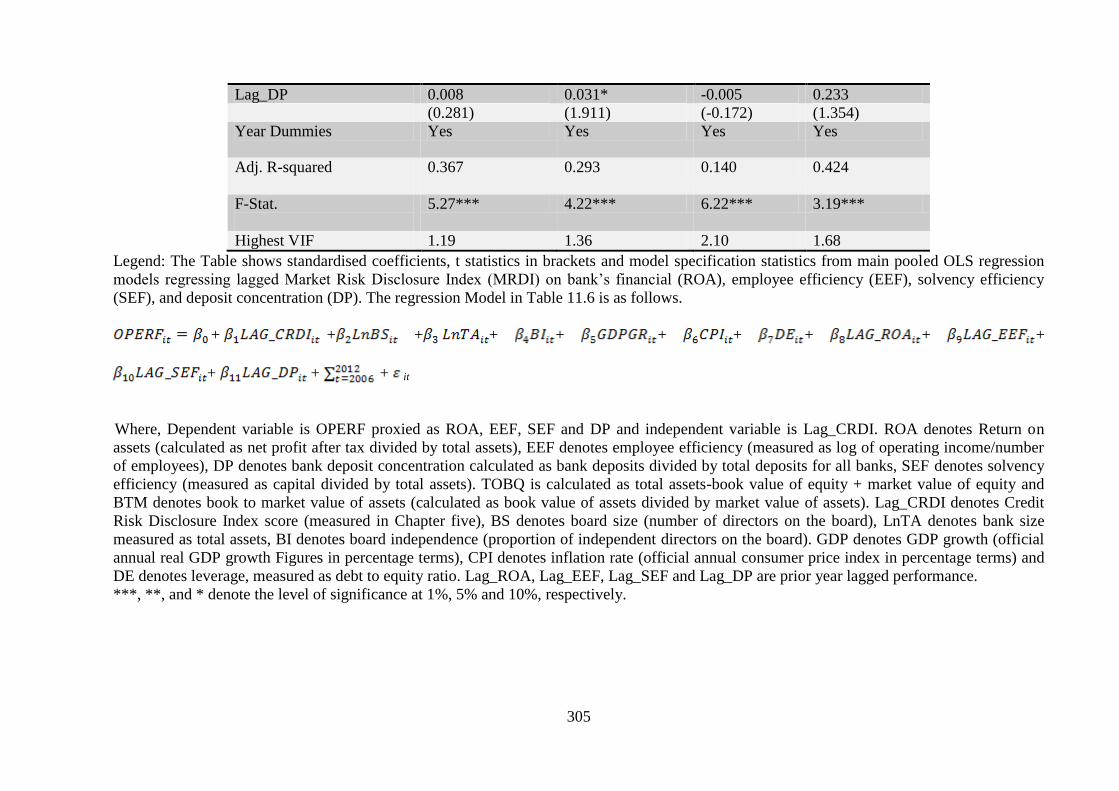
305
Lag_DP 0.008 0.031* -0.005 0.233
(0.281) (1.911) (-0.172) (1.354)
Year Dummies Yes Yes Yes Yes
Adj. R-squared
0.367 0.293 0.140 0.424
F-Stat.
5.27*** 4.22*** 6.22*** 3.19***
Highest VIF 1.19 1.36 2.10 1.68
Legend: The Table shows standardised coefficients, t statistics in brackets and model specification statistics from main pooled OLS regression
models regressing lagged Market Risk Disclosure Index (MRDI) on bank’s financial (ROA), employee efficiency (EEF), solvency efficiency
(SEF), and deposit concentration (DP). The regression Model in Table 11.6 is as follows.
+ + + + + + + + + +
+ + + it
Where, Dependent variable is OPERF proxied as ROA, EEF, SEF and DP and independent variable is Lag_CRDI. ROA denotes Return on
assets (calculated as net profit after tax divided by total assets), EEF denotes employee efficiency (measured as log of operating income/number
of employees), DP denotes bank deposit concentration calculated as bank deposits divided by total deposits for all banks, SEF denotes solvency
efficiency (measured as capital divided by total assets). TOBQ is calculated as total assets-book value of equity + market value of equity and
BTM denotes book to market value of assets (calculated as book value of assets divided by market value of assets). Lag_CRDI denotes Credit
Risk Disclosure Index score (measured in Chapter five), BS denotes board size (number of directors on the board), LnTA denotes bank size
measured as total assets, BI denotes board independence (proportion of independent directors on the board). GDP denotes GDP growth (official
annual real GDP growth Figures in percentage terms), CPI denotes inflation rate (official annual consumer price index in percentage terms) and
DE denotes leverage, measured as debt to equity ratio. Lag_ROA, Lag_EEF, Lag_SEF and Lag_DP are prior year lagged performance.
***, **, and * denote the level of significance at 1%, 5% and 10%, respectively.
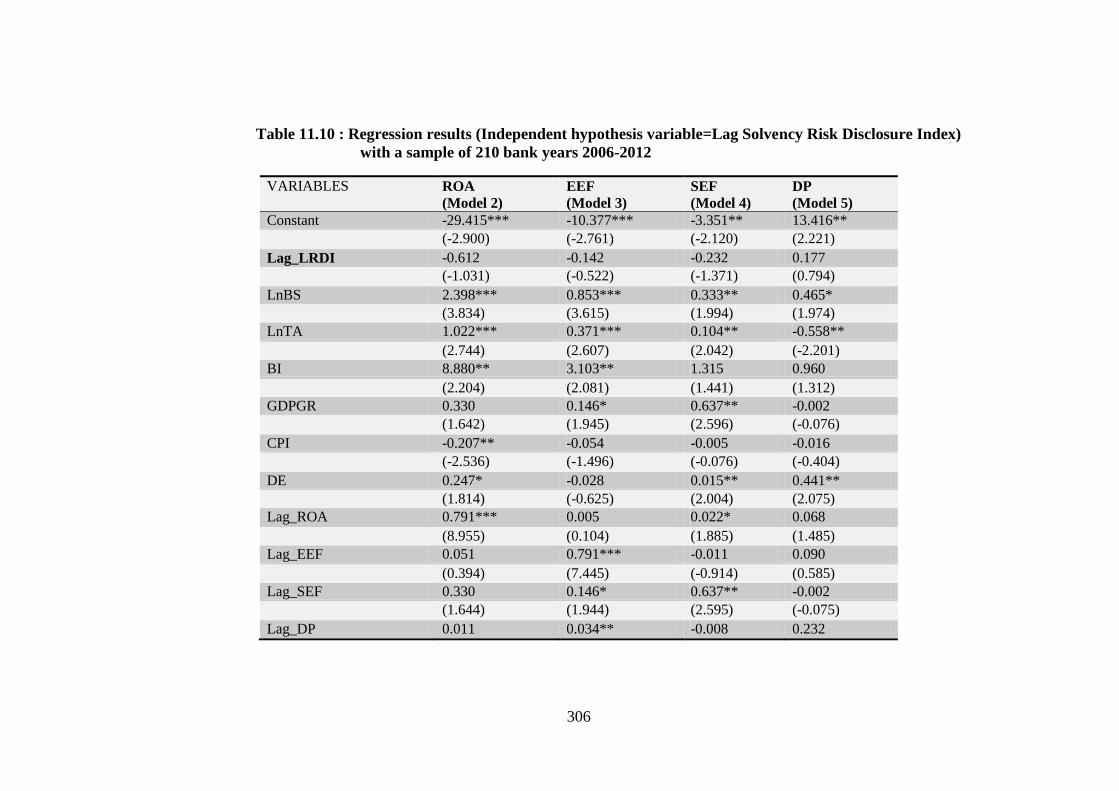
306
VARIABLES ROA
(Model 2)
EEF
(Model 3)
SEF
(Model 4)
DP
(Model 5)
Constant -29.415*** -10.377*** -3.351** 13.416**
(-2.900) (-2.761) (-2.120) (2.221)
Lag_LRDI -0.612 -0.142 -0.232 0.177
(-1.031) (-0.522) (-1.371) (0.794)
LnBS 2.398*** 0.853*** 0.333** 0.465*
(3.834) (3.615) (1.994) (1.974)
LnTA 1.022*** 0.371*** 0.104** -0.558**
(2.744) (2.607) (2.042) (-2.201)
BI 8.880** 3.103** 1.315 0.960
(2.204) (2.081) (1.441) (1.312)
GDPGR 0.330 0.146* 0.637** -0.002
(1.642) (1.945) (2.596) (-0.076)
CPI -0.207** -0.054 -0.005 -0.016
(-2.536) (-1.496) (-0.076) (-0.404)
DE 0.247* -0.028 0.015** 0.441**
(1.814) (-0.625) (2.004) (2.075)
Lag_ROA 0.791*** 0.005 0.022* 0.068
(8.955) (0.104) (1.885) (1.485)
Lag_EEF 0.051 0.791*** -0.011 0.090
(0.394) (7.445) (-0.914) (0.585)
Lag_SEF 0.330 0.146* 0.637** -0.002
(1.644) (1.944) (2.595) (-0.075)
Lag_DP 0.011 0.034** -0.008 0.232
59Table 11.10 : Regression results (Independent hypothesis variable=Lag Solvency Risk Disclosure Index)
with a sample of 210 bank years 2006-2012

307
(0.404) (2.055) (-0.305) (1.355)
Year Dummies Yes Yes Yes Yes
Adj. R-squared
0.405 0.330 0.284 0.457
F-Stat.
3.33*** 4.35*** 5.36*** 3.65
Highest VIF 1.25 1.96 2.1 1.65
Legend: The Table shows standardised coefficients, t statistics in brackets and model specification statistics from main pooled OLS regression models
regressing lagged Market Risk Disclosure Index (MRDI) on bank’s financial (ROA), employee efficiency (EEF), solvency efficiency (SEF), and deposit
concentration (DP). The regression Model in Table 11.7 is as follows.
+ + + + + + + + + +
+ + + it
Where, Dependent variable is OPERF proxied as ROA, EEF, OEF and DP and independent variable is Lag_LRDI. ROA denotes Return on assets (calculated
as net profit after tax divided by total assets), EEF denotes employee efficiency (measured as log of operating income/number of employees), DP denotes bank
deposit concentration calculated as bank deposits divided by total deposits for all banks, SEF denotes solvency efficiency (measured as capital divided by total
assets). TOBQ is calculated as total assets-book value of equity + market value of equity and BTM denotes book to market value of assets (calculated as book
value of assets divided by market value of assets). Lag_LRDI denotes Liquidity Risk Disclosure Index score (measured in Chapter five), BS denotes board
size (number of directors on the board), LnTA denotes bank size measured as total assets, BI denotes board independence (proportion of independent directors
on the board). GDP denotes GDP growth (official annual real GDP growth Figures in percentage terms), CPI denotes inflation rate (official annual consumer
price index in percentage terms) and DE denotes leverage, measured as debt to equity ratio. Lag_ROA, Lag_EEF, Lag_SEF and Lag_DP are prior year lagged
performance. ***, **, and * denote the level of significance at 1%, 5% and 10%, respectively.

308
VARIABLES ROA
(Model 2)
EEF
(Model 3)
SEF
(Model 4)
DP
(Model 5)
Constant -30.049*** -10.504*** -3.693** 13.781**
(-2.980) (-2.781) (-2.041) (2.221)
Lag_ORDI 0.280 0.104 -0.078 0.253*
(0.741) (0.702) (-0.854) (1.935)
LnBS 2.526*** 0.890*** 0.344** 0.495**
(3.830) (3.634) (2.032) (2.095)
LnTA 1.016*** 0.367** 0.114* -0.579**
(2.774) (2.602) (1.952) (-2.224)
BI 8.557** 3.000** 1.325 0.814
(2.154) (2.042) (1.404) (1.154)
GDPGR 0.338* 0.148* 0.637** 0.005
(1.674) (1.955) (2.604) (0.155)
CPI -0.229*** -0.061* -0.005 -0.016
(-2.877) (-1.735) (-0.702) (-0.452)
DE 0.234* -0.032 0.013 0.439**
(1.762) (-0.732) (1.657) (2.107)
Lag_ROA 0.791*** 0.005 0.022* 0.064
(9.027) (0.102) (1.862) (1.352)
Lag_EEF 0.048 0.791*** -0.011 0.091
(0.370) (7.360) (-0.920) (0.574)
Lag_SEF 0.338* 0.148* 0.637** 0.005
(1.674) (1.954) (2.600) (0.154)
Lag_DP 0.011 0.034** -0.007 0.234
60Table 11.11 : Regression results (Independent hypothesis variable=Lag Operational Risk Disclosure Index)
with a sample of 210 bank years 2006-2012

309
(0.394) (2.044) (-0.244) (1.384)
Year Dummies
Yes Yes Yes Yes
Adj. R-squared
0.369 0.291 0.130 0.429
F-Stat.
5.36*** 4.56*** 5.66** 6.21***
Highest VIF 1.56 1.25 1.26 1.63
Legend: The Table shows standardized coefficient , t stat. in the parentheses and model specification statistics from main pooled OLS regression models
regressing bank’s financial (ROA), employee efficiency (EEF), Solvency efficiency (SEF), and deposit concentration (DP) on lagged Operational Risk
Disclosure Index (LRDI). The regression Model in Table 11.8 is as follows.
+ + + + + + + + + +
+ + + it
Where, Dependent variable is OPERF proxied as ROA, EEF, SEF and DP and independent variable is Lag_ORDI. ROA denotes Return on assets (calculated
as net profit after tax divided by total assets), EEF denotes employee efficiency (measured as log of operating income/number of employees), DP denotes bank
deposit concentration calculated as bank deposits divided by total deposits for all banks, SEF denotes solvency efficiency (measured as capital divided by total
assets). TOBQ is calculated as total assets-book value of equity + market value of equity and BTM denotes book to market value of assets (calculated as book
value of assets divided by market value of assets). Lag_ORDI denotes Operational Risk Disclosure Index score (measured in Chapter 5), BS denotes board
size (number of directors in the board), BS denotes board size (number of directors on the board), LnTA denotes bank size measured as total assets, BI denotes
board independence (proportion of independent directors on the board). GDP denotes GDP growth (official annual real GDP growth Figures in percentage
terms), CPI denotes inflation rate (official annual consumer price index in percentage terms) and DE denotes leverage, measured as debt to equity ratio.
Lag_ROA, Lag_EEF, Lag_SEF and Lag_DP are prior year lagged performance. ***, **, and * denote the level of significance at 1%, 5% and 10%,
respectively.

310
VARIABLES ROA
(Model 2)
EEF
(Model 3)
SEF
(Model 4)
DP
(Model 5)
Constant -28.576*** -9.940*** -3.516** 14.046**
(-2.930) (-2.694) (-2.050) (2.180)
Lag_ERDI 0.899** 0.343** 0.074 0.222
(2.424) (2.090) (1.434) (1.104)
LnBS 2.591*** 0.916*** 0.370* 0.474**
(4.024) (3.804) (1.944) (1.984)
LnTA 0.947*** 0.341** 0.101** -0.583**
(2.645) (2.442) (2.000) (-2.161)
BI 7.568* 2.620* 1.170 0.701
(1.944) (1.815) (1.385) (1.054)
GDPGR 0.046 0.790*** -0.011 0.092
(0.367) (7.245) (-0.904) (0.595)
CPI -0.254*** -0.070** -0.009 -0.019
(-3.114) (-2.004) (-1.075) (-0.465)
DE 0.205 -0.043 0.009 0.435**
(1.555) (-0.965) (1.364) (2.054)
Lag_ROA 0.786*** 0.003 0.022* 0.063
(9.025) (0.067) (1.847) (1.317)
Lag_EEF 0.046 0.790*** -0.011 0.092
(0.367) (7.248) (-0.907) (0.597)
Lag_SEF 0.332 0.146* 0.636** -0.010
(1.644) (1.973) (2.577) (-0.305)
Lag_DP 0.013 0.035** -0.006 0.231
61Table 11.12: Regression results (Independent variable=Lag Equities Risk Disclosure Index) with a sample of 210
bank years 2006-2012

311
(0.494) (2.1835) (-0.234) (1.365)
Year Dummies Yes Yes Yes Yes
Adj. R-squared
0.408 0.559 0.571 0.475
F-Stat.
5.56*** 6.34*** 6.35*** 7.65***
Highest VIF 1.26 2.21 2.31 1.98
Legend: The Table shows standardized coefficient , t stat. in the parentheses and model specification statistics from main pooled OLS regression models
regressing bank’s financial (ROA), employee efficiency (EEF), Solvency efficiency (SEF), and deposit concentration (DP) on lagged Operational Risk
Disclosure Index (LRDI). The regression Model in Table 11.9 is as follows.
+ + + + + + + + + +
+ + + it
Where, Dependent variable is OPERF proxied as ROA, EEF, OEF and DP and independent variable is Lag_ERDI. ROA denotes Return on assets (calculated
as net profit after tax divided by total assets), EEF denotes employee efficiency (measured as log of operating income/number of employees), DP denotes bank
deposit concentration calculated as bank deposits divided by total deposits for all banks, SEF denotes solvency efficiency (measured as capital divided by total
assets). TOBQ is calculated as total assets-book value of equity + market value of equity and BTM denotes book to market value of assets (calculated as book
value of assets divided by market value of assets). Lag_ERDI denotes Equity Risk Disclosure Index score (measured in Chapter five), BS denotes board size
(number of directors in the board), BS denotes board size (number of directors on the board), LnTA denotes bank size measured as total assets, BI denotes
board independence (proportion of independent directors on the board). GDP denotes GDP growth (official annual real GDP growth Figures in percentage
terms), CPI denotes inflation rate (official annual consumer price index in percentage terms) and DE denotes leverage, measured as debt to equity ratio.
Lag_ROA, Lag_EEF, Lag_OEF and Lag_DP are prior year lagged performance. ***, **, and * denote the level of significance at 1%, 5% and 10%,
respectively.

312
11.5 Discussion of results
In this present research, content analysis of annual reports over the period from 2006-
2012 was reported in Chapter 7 to measure the extent of risk disclosure through the Risk
Disclosure Index and a score obtained for each of the banks in the sample. The
performance measures (return on asset, employee efficiency, solvency efficiency and
deposit concentration) were obtained directly from annual reports (2006-2012).
Bivariate and multivariate analyses were performed to test the relationship between the
hypothesised predictor variables and various measures of bank performance.
The findings of this study show a highly significant relationship between the lagged
Risk Disclosure Index score and financial performance (ROA), employee efficiency
(EEF) and marginal significance with solvency efficiency (SEF). However, no
relationship exists between the lagged Risk Disclosure Index and deposit concentration
(DP). The findings from this study also suggest bank market performance has a
significant relationship with the lagged Risk Disclosure Index. These findings underline
important associations between risk disclosure and banks performance. Moreover, the
associations between risk disclosure and bank performances (financial, employee
efficiency and Tobin’s q) are found to be stronger in Non-Islamic banks compared to
Islamic banks. The supplemental analysis in this Chapter also suggests that the Market
Risk Disclosure Index and lagged Equities Risk Disclosure Index is associated with
banks’ overall operating performance. In addition, governance indicators (board size,
independent boards) play a significant role in explaining variations in performance.
Governance components are also associated with bank market performance, indicating
the relation of governance on performance of banks in Bangladesh.
The supplemental analysis in this Chapter further examines the association of Market,
Credit, Liquidity, Operational and Equities Risk Disclosure with banks’ performances
and found financial performance, employee efficiency performance, and solvency
efficiency are associated with the lagged Market Risk Disclosure and Equities Risk
Disclosure Index. In addition, this study examines the relationship between High Risk
Disclosure and Low Risk Disclosure Groups with banks’ performance. The findings in
this study suggest that the lagged High Risk Disclosure Index has a positive association

313
with financial performance and employee efficiency performance. However, the lagged
Low Risk Disclosure Group has an association with deposit concentration.
11.6 Chapter conclusion
This Chapter examines the relationship between the Risk Disclosure Index and banks’
performance. In this Chapter, both bivariate and multivariate analyses have been
performed to examine the association between bank financial performance, operating
efficiency, solvency efficiency, deposit concentration, Tobin’s q and book to market and
the lagged Risk Disclosure Index. The results support that the lagged Risk Disclosure
Index has an association with banks’ financial, solvency and employee efficiency. The
banks in the research sample are classified as High Risk Disclosers and Low Risk
Disclosers (see Table 11.5). The results suggest a significant association of High Risk
Disclosers with banks’ financial, employee efficiency and solvency efficiency. The next
Chapter provides the conclusion and implications of the study.

314
PART FIVE
CONCLUSION
Chapter 12: Conclusion and Implications

315
The final part presents a brief overview of the objectives of the study, summary of
research findings and implications, research contributions, limitations and future
research possibilities.
316
CHAPTER 12: Conclusion
12.1 Introduction
The purpose of this study was to investigate corporate risk information disclosed in the
Bangladesh banking industry. The country of Bangladesh is chosen as the focus for this
study came from a desire to understand the extent of risk disclosure practices in the
setting of a developing country. Bangladesh is aiming to become a middle-income
economy by the year 2021 (Vision 2021)65
. However, as discussed in Chapter 2, weak
institutional settings, poor legal structure and the autocratic nature of the International
Accounting Standard implementation process in the country, result in low level of
compliance in relation the accounting standards (Mir & Rahaman 2005; Sobhani,
Amran & Zainuddin 2012). Moreover, the lessons learned from the Western experience
hint that a lack of risk management and failure of governance mechanisms were key
contributing factors to the GFC of 2007-2008 (Aebi, Sabato & Schmid 2012; Erkens,
Hung & Matos 2012).
Bangladesh among the developing countries has started to implement International
Financial Reporting Standard (IFRS) 7 [Financial Instruments: Disclosures] and Basel
II: Market Discipline voluntarily66
. Of crucial importance, however, is the fact that
examining risk disclosure in a highly regulated environment would not provide the
insights of risk disclosure determinants because there would be little variation between
the actual and benchmark standard (IFRS 7 and Basel II: Market Discipline). In
addition, the interview data is used to support the assumption that Bangladesh offers a
unique setting due to the non-enforced nature of risk disclosure. As such, Bangladesh is
an ideal location for examining corporate entities can foster accountability and
transparency through the provision of corporate risk disclosure.
65
Bangladesh wants to be a middle-income country by 2021 (Ministry of Finance, Government of
Bangladesh (2014). The year 2021 will mark the golden jubilee of Bangladesh’s independence. 66
In the absence of mandatory requirements by company law or the Bank Company Act 1991, compliance
with International Financial Reporting Standards (IFRS) or Bangladesh Accounting Standards
(Bangladesh Financial Reporting Standards) is voluntary, as explained in Chapter 3.
317
The first Phase of the study involves examining corporate risk disclosure practices of all
listed banks in Bangladesh over a seven-year period (2006-2012). This is an important
period over which to examine corporate risk disclosure as it incorporates those years
impacted by the GFC (2007-2008). It is not the GFC per se but rather the reforms
triggered by the GFC might stimulus risk disclosure in financial reporting. A seven-year
time frame for this study provides valuable understandings concerning the monitoring
systems and governance mechanisms employed by banks on behalf of stakeholders. The
second Phase of the study investigates the determinants associated with banks’ risk
disclosure practices. The third and final Phase of the study investigates the association
of corporate risk disclosure with bank performance.
The objective of this Chapter is to provide a summary of the research findings for each
of these Phases and outline the contribution to the literature of this thesis and
implications that flow from the findings. Finally, the limitations of the research are
presented, followed by further directions within this area of research that could be
explored potentially in future research.
12.2 Overview
Three interrelated Phases are investigated in this broader study. Table 12.1 presents the
three-fold research objectives with the corresponding research Phases and findings.

318
62Table 12.1: This thesis’ research at a glance
Research Objectives Research Questions Hypothesis Phase
of the
study
Sources of Data Method Findings
1.To identify the extent of
corporate risk disclosure
practices in Bangladesh
listed banks’ annual reports
over a seven-year period
(2006-2012)
1: What is the extent of corporate
risk disclosure and to what extent
did banks in Bangladesh respond to
the development of international
standards (IFRS 7 and Basel II:
Market Discipline)?
H1: There are significant
differences in risk disclosure over
the period under examination,
2006-2012.
Phase
One
Company websites and
Bangladesh Securities
and Exchange
Commission.
Content
analysis
In aggregate,
there is an
increasing
trend under
the
examination
period.
2. To investigate the
determinants of corporate
risk disclosure
2: What firm characteristics and/or
institutional pressure act as
determinants for voluntary
disclosure of risks?
H2: The number of independent
directors on the board is associated
positively with the extent of risk
disclosure
H3: The number of independent
directors on the audit committee is
associated positively with the extent
of risk disclosure
H4: The number of risk committees
is positively associated with the
extent of risk disclosure.
H5: Coercive isomorphic pressures
are positively associated with the
extent of risk disclosure.
H6:Mimetic isomorphism of larger
banks influences smaller banks to
provide more risk disclosure.
H7: Normative isomorphism is
positively associated with the extent
of risk disclosure.
Phase
Two
1.Semi-structured
interviews with risk
reporting managers,
experts from the
Bangladesh Securities
and Exchange
Commission (BSEC)
and experts in the
policy development
department from the
Central Bank
(Bangladesh Bank)
2. Annual reports from
Dhaka Stock Exchange
Analysis
of semi-
structured
interviews,
t-tests,
correlation
s and
multiple
regression
H2, H4, H6
and H7
accepted

319
Research Objectives Research Questions Hypothesis Phase
of the
study
Sources of Data Method Findings
3. To examine the
association of corporate risk
disclosure with banks’
financial performance
3: Does corporate risk disclosure
have an association with bank
performance?
H8: Employee efficiency is
positively associated with the extent
of risk disclosure.
H9: Solvency efficiency is
positively associated with the extent
of risk disclosure.
H10: Deposit concentration is
positively associated with the extent
of risk disclosure.
H11: Financial performance is
positively associated with the extent
of risk disclosure.
H12: Bank value is positively
associated with the extent of risk
disclosure.
Phase
Three
Bank annual reports
from Dhaka Stock
Exchange
t-tests,
correlation
s and
multiple
regression
H8, H9, H11,
H12 (Tobin’s
q) accepted

320
Each Phase of the broader study has implications for the financial reporting literature as
it focuses on a specific financial reporting issue-that of risk related disclosure practices-
an area that has received little attention with limited research currently available
(Dobler, Lajili & Zéghal 2011; Woods & Linsley 2007). More specifically, this study
investigates the information banks provide in relation to their risk related corporate
governance practices- an issue that is yet to be investigated. As such, this study extends
the scope of research within corporate governance literature.
The underpinning theories (agency theory and institutional isomorphism) discussed in
Chapter 5, describe the conceptual framework for this study. These theories explain the
motivation of managers to provide corporate risk disclosure in the absence of
enforcement of compliance. As presented in Table 12.1, Phase One of the broader study
investigates the risk disclosure practices and provides a comprehensive, longitudinal
study of all 30 listed banks in Bangladesh over a seven-year period. An examination of
the banking sector is important as it holds more than 60 per cent share in the Gross
Domestic Product (GDP) (Bangladesh Bank 2013b). Thus, this study investigates a total
sample of 210 bank-year annual reports over 2006-2012.
A Risk Disclosure Index is developed consisting of 147 separate pieces of information
under seven general categories. The Risk Disclosure Index was constructed based on a
through and rigorous study of International Financial Reporting Standard [IFRS] 7:
Financial Instruments: Disclosures and BASEL II: Market Discipline. The RDI
includes both qualitative and quantitative information. Utilizing this Index as a
benchmark, this Phase employs content analysis of sample banks’ annual reports from
2006-2012 to examine and score the extent of risk disclosure over the period of
analysis. This is the first known study to provide a longitudinal study investigating the
disclosure behavior of banking companies in relation to risk related corporate
governance practices.
Phase One builds the foundation to investigate further in Phase Two. Phase Two
investigates what risk reporting-related experts (risk reporting managers in sample
banks and representatives from the Bangladesh Securities and Exchange Commission

321
and the Central Bank) perceive to be determining factors in relation to risk disclosure
(reported in Chapter 8). The hypothesised determinants associated with the extent of
risk disclosure within annual reports are tested, with results reported in Chapters 9 and
10. Thus, in Phase Two, using semi-structured interviews with banking and regulatory
representatives, this study aims to explore corporate insights in relation to corporate risk
reporting. Additionally, this study investigates the extent of risk disclosure and its
potential relationship with corporate characteristics, including board independence,
audit committee independence, the number of risk committees, and the debt to equity
ratio, total assets, and the presence of a risk management unit. This Phase utilises neo-
institutional isomorphism and agency theories to understand the factors underlying risk
disclosure. The theoretical implication is that since the experts consider the underlying
factors useful for assessing risk governance, they are is arguably the most relevant
knowledge for understanding what risk related governance factors are associated with
risk disclosure. In this Phase, the research approach uses thematic analysis of semi-
structured interviews and multiple regression analysis using data gathered from annual
reports. Research Question 2 is investigated based on a Hypotheses H2 to H7 (refer
Table 12.1), developed in Chapter 5 (Theoretical perspective underpinning the research:
Conceptual framework and hypotheses). This Phase employs a pooled OLS robust
regression model (Chapter 10) to examine the predictive ability of the variables
included in the model using the Risk Disclosure Index (developed in Phase One) to
score the dependent variable based on data from annual reports 2006-2012 for the
sample companies.
The third and final Phase of this research examines the potential association of risk
disclosure in relation to banks’ operating and market performance. Bank operating
performance is measured using financial performance, employee efficiency, solvency
efficiency, deposit concentration and bank market performance is measured using
Tobin’s q and the book to market ratio. Data for these performance measures are
derived from sample banks’ annual reports over the study period (2006-2012). This
Phase adopts an econometric approach (Chapter 11: The association between risk

322
disclosure and bank performance) to test the hypothesised67
relationships for 30 listed
banks in Bangladesh across the period 2006-2012.
12.3 Research findings and implications
The main findings and implications of the findings in each Phase are discussed as
follows.
1. The results of Phase One (Chapter 7) indicate that, in aggregate although there is an
increasing trend of risk disclosure over the period of analysis, there is a lack of risk
disclosure by sample banks in Bangladesh compared to the benchmark Risk disclosure
Index. The results highlight that while several risks are reasonably well disclosed, none
of the banks provide full disclosure of information identified in the Risk Disclosure
Index as best practice. Risk disclosure among Bangladesh listed banking companies is
found to be primarily focused on Internal Corporate Governance and General Risk
Information. Other categories identified in the Risk Disclosure Index, such as Risk Type
(Market, Credit, Liquidity, Operational and Equities), Capital Disclosure, Strategic
Decision and Governmental Regulation, showed little change over the sample period
despite the issuance of IFRS and Basel II. In addition, Non-Islamic banks on average
disclose more risk items compared to Islamic banks and the mean difference is
significantly different.
The implication of the research findings is that with the extent of disclosure being made
by sample companies, it is unlikely that banks’ stakeholders would gain an accurate
idea of the risk profile and the associated risks assessment and mitigation efforts,
relevant to particular banks. The findings from this research highlight the importance of
risk disclosure by banks and suggest that there is an opportunity for banks to increase
the extent of voluntary risk disclosure within their annual reports.
67
H7: Employee efficiency is positively associated with the extent of risk disclosure.
H8: Solvency efficiency is positively associated with the extent of risk disclosure.
H9: Deposit concentration is positively associated with the extent of risk disclosure.
H10: Financial performance is positively associated with the extent of risk disclosure.
H11: Bank value is positively associated with the extent of risk disclosure.

323
2. In Phase Two, the findings from interviews identified independent boards, the number
of risk committees, total assets and the presence of a risk management unit as important
determinants for risk disclosure. Moreover, quantitative data analysis from data
gathered from annual reports, also reveals that the underlying factors associated with
risk disclosure are the presence of an independent board (H2), the number of risk
committees (H4), total assets (H6) and the presence of a risk management unit (H7).
Hence, the results from this study from both qualitative and quantitative data confirm
the validity and importance of the determining factors associated with risk disclosure.
The findings for this Phase are more significant for Non-Islamic banks compared with
Islamic banks.
Further, the reasons for lack of corporate risk disclosure are identified in this Phase.
Based on the perspective of coercive isomorphism (as explained by institutional theory),
the interview data reveals a perceived lack of demand from stakeholders requiring more
information and banks not being motivated to disclose a great deal about risks. This
finding implies that a greater extent of risk disclosure depends on stakeholders
expressing concerns and their demands. In addition to a high level of demand from
stakeholders, the enforcement of international standards creates pressure that leads
banks to disclose more information.
Another reason for the lack of corporate risk disclosure is identified as the discretionary
nature of these disclosures. It can be argued that in absence of regulation and penalties
for non-compliance, banks do not disclose information. In addition to that, those banks
may lose credibility in the market and may not survive in future if they continue such
practices of low disclosure. Additionally, stakeholders’ (such as investors’) expectations
may be encouraged by recent development of international standards (IFRS 7 and
BASEL II) in relation to risk disclosure. As a result, banks that change their disclosure
behaviour may achieve competitive advantage over banks that do not.
Table 12.2 illustrates the confirmation of quantitative findings by the qualitative results;
the results confirm that the association between dependent and independent variables in
modelling risk disclosure in banking institutions in Bangladesh is well supported

324
statistically and conceptually. These factors are considered as key characteristics that
help drive listed banks in Bangladesh to achieve competitive advantage.
The interview data reveal unanticipated findings including about political interference,
lack of Central Bank autonomy, lack of accountability, demands by powerful
stakeholders, lack of education of investors and demand for brief and concise reports.
These findings support the arguments that data collection based on quantitative and
qualitative approaches can help improve both the reliability and validity of corporate
financial reporting research, and provide more insights into information concerning the
objectives under study. Table 12.2 presents the qualitative and quantitative findings in
relation to the predicted determinants of corporate risk disclosure.
Legend: * The variables are in brackets. DE denotes the debt equity ratio, LnTA denotes log
total assets, RMU denotes presence of a risk management unit, BI denotes board independence
measured as proportion of independent directors on the board. ACI denotes Audit Committee
Independence measured as the proportion of independent directors on the audit committee, RC
denotes number of risk committees.
As this stage, this Phase sheds light on risk governance factors. The findings will be
helpful for boards and managers of banks aiming to address their risk governance and
related disclosure practices. The findings will assist also annual report users who seek to
assess banks’ risk disclosure and how bank respond to these risks by evaluating the
information being disclosed by banks’ against the Risk Disclosure Index. These
Table 12.2: Quantitative findings’ confirmation of qualitative findings
Indicator variable for risk disclosure Quantitative Qualitative
Debt to Equity ratio (DE)* − −
Total Asset (LnTA) √ √
Risk Management Unit (RMU) √ √
Board independence (BI) √ √
Audit committee independence (ACI) − −
Risk committee (RC) √ √

325
findings have implications for regulators and standard setters searching for the best way
to shape policies and regulations regarding risk governance disclosure practices.
3. The third and final Phase of this research investigates the third Research Question
which examines the association between risk disclosure and bank performance. Bank
performance is measured using six aspects; financial performance, employee efficiency,
solvency efficiency, deposit concentration, Tobin’s q and book to market value. This
Phase employs a pooled OLS robust regression model to explain the association
between the Risk Disclosure Index and bank performance. The findings in this Phase
suggest significant association between the lagged Risk Disclosure Index and financial
performance, employee efficiency, solvency efficiency and Tobin’s q. However, no
relationship exists with deposit concentration and book to market. These findings
suggest that greater risk disclosure is an attempt to facilitate alignment of interests
between stakeholders and bank managers, which reduces agency costs and in turn is
associated with banks’ performance.
The three Phases of this study together provide a holistic picture to understand the
extent of risk disclosure practices, determinants and performances of all listed banks in
Bangladesh over a seven-year period (2006-2012).
12.4 Research contribution
The present research makes a significant contribution to the existing literature and to
knowledge in several ways as follows.
First, in an attempt to redress in part the empirical scarcity in risk disclosure studies in
developing countries, this study is the first to provide knowledge of corporate risk
disclosure practices, their underlying determinants and firm performance. This study
provides insights into risk disclosure practices by financial institutions and fills a gap in
the literature by providing a comprehensive and longitudinal study of corporate risk
disclosure information in banks’ annual reports in Bangladesh. The study investigates
financial statements and allows in-depth examination of trends and/or changes in
326
corporate risk disclosure over a seven-year period and reveals interesting insights to
better assess the risk disclosure of listed banks in Bangladesh. This research also
overcomes the gap that the corporate risk disclosure literature lacks an interrogative
framework that conceptualises multifaceted determinants of risk disclosure and the
significance of risk disclosure in relation to bank performance in developing countries.
The findings of this research, therefore, make a significant contribution to the literature
and provide a foundation for further research in this field.
Second, as mentioned in the previous section, in the first Phase of the study a unified
Risk Disclosure Index is developed in light of international standards (IFRS 7 and Basel
II) not required to be complied with by listed Bangladesh banks. The Risk Disclosure
Index is a comprehensive index that measures the extent of risk disclosure. This Index
covers many aspects of relevant information, such as risk assessment, risk strategies and
risk policies in relation to different types of risk (Market, Credit, Liquidity, Operational
and Equities). To the researcher’s knowledge, the Risk Disclosure Index developed in
this study is the first developed for the banking industry in measuring the extent of risk
information disclosed in annual reports. The Risk Disclosure Index contributes to the
literature and can be used to measure the level of risk disclosure practices in financial
institutions from other countries. This can also provide impetus to the recent debate on
risk disclosure practices among international standard setting bodies as they try to
harmonise their efforts. Additionally, the Risk Disclosure Index could be used as a
guideline/checklist for corporate risk disclosure and could be used as an early warning
system for banking institutions in any country.
Third, as discussed in the previous section, the second Phase of this study examines the
determinants of risk disclosure and utilises a distinctive conceptual model based on
agency and neo-institutional isomorphism theories. The empirical evidence from this
study validates the applicability of these theories. The findings suggests that
independent boards, the number of risk committees, debt to equity and the presence of a
risk management unit are significant factors in relation to corporate risk disclosure and
make a contribution to and provide practical implications for the application of agency
and neo-institutional isomorphism theories.

327
Fourth, the research tests the claim that enhanced risk information disclosed in
corporate annual reports is associated with banks’ better performance and finds this to
be the case for most measures of performance. Thus, this study adds to the existing
research on corporate risk disclosure. This result fills a gap in the existing literature by
testing empirically the association of risk disclosure with bank performance.
Fifth, this research makes significant contribution as the study goes one-step further by
examining risk disclosure practices, their determinants and the association of risk
disclosure with banks’ performance within the Islamic and Non-Islamic bank context.
Based on the assumption (refer to Chapter 1) that Islamic banks that follow Islamic
Shariah law might record different levels of corporate risk disclosure compared with
Non-Islamic banks, the study fills a gap in the existing literature by testing this issue
empirically. To the researcher knowledge, this is the first study to date to examine such
an association (risk disclosure practices, their determinants and the association of risk
disclosure with banks’ performance) using sub-samples from Islamic and Non-Islamic
banks. The findings reveal superior disclosures and performance by the non-Islamic
banks.
Sixth, this study also makes methodological contributions. It employs econometric
approaches to test hypotheses using longitudinal data gathered from annual reports and
interviews with bank managers and bank regulators (Bangladesh Central Bank and
Bangladesh Securities and Exchange Commission) to triangulate the results. Prior
literature on risk disclosure comprises mainly quantitative studies. Therefore, this
research generates rich data and permits a comprehensive understanding using a
triangulation strategy. Utilising a mixed methodology, this study integrates qualitative
(interview) methods and quantitative (econometric techniques applied to data from
annual reports) in examining the association between risk disclosure, its determinants
and performance. The interviews were employed to validate the findings from
secondary data and for providing richer information in relation to the research
objectives than could have been achieved by quantitative data alone, resulting in
strengthening the research findings and contributing to theory and knowledge

328
development. Therefore, the mixed data in this study provides a more complete
understanding of the issues being studied and enhances both reliability and validity of
this research compared to research that precedes it.
Finally, the findings can be generalised to some extent. The findings could be of interest
to other developing countries. Corporate risk disclosure has been validated to be
associated with bank performance for banks in Bangladesh, and possibly in countries
that follow similar transitional economic contexts.
12.5 Research limitations
While extending empirical knowledge in financial reporting and more specifically,
adding to prior disclosure studies in relation to risk disclosure practices, its determinants
and performance, this study is subject to some limitations. The limitations in this study
are follows.
First, one limitation of this study is related to use of the sampling unit, effectively listed
banks with available annual reports. The study focuses on risk disclosure only in annual
reports. However, banks employ other channels such as press releases, conference calls,
and websites. While this could be argued to be a limitation, nevertheless annual reports
are considered as the principal published document for communication (Linsley &
Shrives 2006).
A second limitation that must be acknowledged is related to the disclosure scoring
system. For example, instead of the extent of discussion or explanation, the score
equally weights each item in the Risk Disclosure Index. Therefore, items may not
reflect the level of importance as perceived by users of annual reports. In addition to
that must be acknowledged limitations in some measures (i.e. audit committee
effectiveness, risk committee effectiveness).

329
Third, this study uses semi-structured interviews with experts from within different
stakeholder groups (for example, bank managers, Bangladesh Central Bank, Bangladesh
Securities and Exchange Commission) to investigate banks’ risk disclosure practices,
their determinants and performance. The results of this Phase should be considered in
light of the usual methodological limitations inherent in a semi-structured interview
approach, including limited participant numbers and being perceptions-based, relying
on information provided by participants. This researcher also acknowledges that there is
a possibility that a free-rider problem may arise as users of banks’ annual reports
demand more than managers voluntarily disclose. Additionally, in-depth interviews are
useful for eliciting detailed information; however, limitations associated with it need to
be addressed. Interview responses cannot be estimated reliable by any statistical
measure, as their thoughts could be biased by various issues. For example, respondents
could attempt to hide the reality, may have faulty memories, and may have difficulties
with sequence or wording in the interview protocol. To minimise this possibility, the
researcher confirmed the confidentiality of the research, and informed the respondents
in advance about the discussion agenda.
Lastly, due to access, time constraints and political instability in Bangladesh during the
data collection period (February-April 2013), more specifically associated with the
interview data, the number of participants chosen from banks was limited, thereby
leading to a smaller sample size for interviews than had been planned.
12.6 Suggestions for future research
This study broadens the scope of financial accounting research by focusing on a specific
corporate risk governance issue – risk disclosure. In other words, it opens new research
areas in the voluntary disclosure literature by attempting to investigate risk disclosure
practices, their determinants and performance in an institutional setting where
compliance does not drive behaviour. The followings could be worthy of future research
that directly stem from this study.

330
1. Phase One of this study investigates the risk disclosure practices of listed banks in
Bangladesh. Although this research analyses the disclosure practices of all listed banks,
further research could utilise the Risk Disclosure Index on all other financial (for
example, insurance, leasing, mortgage) and other manufacturing companies, both in
Bangladesh and rest of the world, adapted if necessary, in order to investigate whether
findings can be applied more broadly within other industries. Such investigation would
extend the robustness and applicability of the Risk Disclosure Index, which is arguably
the most comprehensive index developed to-date in relation to risk disclosure practices.
In addition, future research can also employ the Risk Disclosure Index to compare the
disclosure practices of the companies in different contexts (for example, developed vs.
developing countries). This comparative study appears relevant and important for future
research given growing attention on the issue of risk governance.
2. The second Phase of the broader study provides results generated by conducting in-
depth interviews with managers from some of the sample banks and experts from the
Central Bank and the Bangladesh Securities and Exchange Commission. They discussed
the research questions, however; more insights could be derived by conducting
interviews with a greater number of respondents from all the sample banks or from non-
listed banks. Future study can pursue this possibility of research to make an even deeper
understanding of risk governance issues.
3. This research has found a perceived lack of demand from stakeholders’ by the
interviewees from the qualitative data. It would help reveal whether, and if so why,
stakeholder force is not existent by understanding the contexts provided by them, such
as institutional investors and government. In-depth interviews with stakeholder groups
would be helpful in gaining a greater insight into their expectations and activities, such
as collaboration with or confrontation with banks with respect to risk disclosure
practices.
4. This study provides a platform for future research that can be developed further in
relation to banks’ risk governance issues. In the light of significant challenges in the
global economy, this study inspires other researchers to follow this possibility of

331
investigation, more specifically, to find out risk disclosure reactions to implementation
of international standards.

332

333
References
Aboody, D & Kasznik, R 2000, 'CEO stock option awards and the timing of corporate
voluntary disclosures', Journal of Accounting and Economics vol. 29, no. 1,
pp.73-100.
Abhayawasnsa, S. and Azim, M.I., 2014, ‘Corporate reporting of intellectual capital:
evidence from Bangladeshi pharmaceutical sector’, Asian Review of
Accounting, vol.22, no.2, pp.98-127.
Abraham, S & Cox, P 2007, 'Analysing the determinants of narrative risk information in
UK FTSE 100 annual reports', British Accounting Review, vol. 39, no. 3, pp.
227-248.
Adams, RB 2012, 'Governance and the financial crisis', International Review of
Finance, vol. 12, no. 1, pp. 7-38.
Aebi, V, Sabato, G & Schmid, M 2012, 'Risk management, corporate governance, and
bank performance in the financial crisis', Journal of Banking & Finance, vol. 36,
no. 12, pp. 3213-3226.
Agrawal, A & Knoeber, C.R 2001, 'Do some outside directors play a political role?',
Journal of Law and Economics, vol. 44, no. 1, pp. 179-198.
Ahmad, K & Ahmad, S 2008, 'Bankers’ perceptions of electronic banking in Pakistan',
Journal of Internet Banking and Commerce, vol. 1, no. 13, pp. 1-16.
Ahmed, K & Courtis, JK 1999, 'Associations between corporate characteristics and
disclosure levels in annual reports: A meta-analysis', The British Accounting
Review, vol. 31, no. 1, pp. 35-61.
Ahmed, N & Pandit, AC 2012, 'Implementation Status of Basel II: Bangladesh
perspective', Banking Research Series, Bangladesh Institute of Bank
Management, vol. 1, no. 2, pp. 41-68.
Ahmed, S & Islam, EA 2004, 'The monetary transmission mechanism in Bangladesh:
Bank lending and exchange rate challenge', Bangladesh Development Studies,
vol. 30, no.1, pp.31-87.
Ahsan, A, Skully, M & Wickramanayake, J 2009, 'A critical analysis of Central Bank
independence and governance in Australia and Bangladesh', Journal of
Administration and Governance, vol. 4, no. 1, pp.143-161.
AICPA 1995, Reports on Audited Financial Statements, American Institute of Certified
Public Accountants, New York
AICPA 1994, Improving business reporting- a customer focus: Meeting the information
needs of investors and creditors, comprehensive report of the special committee
on financial reporting (The Jenkins Report), American Institute of Certified
Public Accountants, New York.
Akhtaruddin, M 2005, 'Corporate mandatory disclosure practices in Bangladesh', The
International Journal of Accounting, vol. 40, no. 4, pp. 399-422.
Albrecht, SW & Sack, RJ 2010, Accounting education: Charting the course through a
perilous future, American Accounting Association, New York.

334
Ali,M.J.,Ahmed, K. & Henry, D. 2004. ‘Compliance with national accounting standards
by listed companies in South Asia’. Accounting and Business Research, vol. 34,
no 3, pp. 183-199
Amihud, Y 1986, 'Asset pricing and the bid-ask spread', Journal of Financial
Economics, vol. 17, no. 2, pp. 223–249.
Amran, A, Bin, A.M.R & Hassan, BCHM 2008, 'Risk reporting: An exploratory study
on risk management disclosure in Malaysian annual reports', Managerial
Auditing Journal, vol. 24, no. 1, pp. 1-20.
Azim, MI, Ahmed, S & Islam, MS 2009, 'Corporate social reporting practice: Evidence
from listed companies in Bangladesh', Journal of Asia-Pacific Business, vol. 10,
no. 2, pp. 130-145.
Aziz A, L 2009, 'Bank borrowing and corporate risk management', Journal of Financial
Intermediation, vol. 18, no. 4, pp. 632-649.
Baek, HY, Johnson, DR & Kim, JW 2009, 'Managerial ownership, corporate
governance, and voluntary disclosure', Journal of Business & Economic Studies,
vol. 15, no. 2, pp. 44-61.
Bangladesh, P 2014, Hallmark Scam, viewed 16th
April 2014,
<http://progressbangladesh.com/hallmark-scam-tk-1492-crore-embezzled-in-a-
day/>.
Bangladesh Bank, 2013, Annual report, Bangladesh.
Bangladesh Bank, 2012a, Annual report, Bangladesh.
Bangladesh Bank 2012b, Prudential regulation for banks: Selected issues, Banking
Regulation & Policy Department, Bangladesh.
Bangladesh Bank 2012c, Risk management guidelines for banks, Bangladesh.
Bangladesh Bank 2013a, Banks and financial institutions, viewed 14th
April, 2013
<http://www.bangladesh-bank.org/fnansys/bankfi.php>.
Bangladesh Bank 2013b, Financial stability report, Bangladesh.
Bangladesh Enterprise Institute 2003, A comparative analysis of corporate governance
in South Asia: Charting a roadmap for Bangladesh, Bangladesh.
Bangladesh Bueau of Statistics 2013, Sectoral growth rate of GDP’,Ministry of
Planning, Government of the People’s Republic of Bangladesh, Dhaka.
Barth, JR, Caprio Jr, G & Levine, R 2004, 'Bank regulation and supervision: What
works best?', Journal of Financial Intermediation, vol. 13, no. 2, pp. 205-248.
Barth, ME & Landsman, WR 2010, 'How did financial reporting contribute to the
financial crisis?', European Accounting Review, vol. 19, no. 3, pp. 399-423.
Barth, ME & McNichols, MF 1994, 'Estimation and market valuation of environmental
liabilities relating to superfund sites', Journal of Accounting Research, vol. 32,
no. 3, pp. 177-209.
Basel 1998, Enhancing bank transparency, Basel Committee on Banking Supervision,
BIS, Switzerland.
Basel 2001, Working paper on pillar 3-Market Discipline, Basel Committee on Banking
Supervision’, BIS, Switzerland.

335
Basel 2006, International convergence of capital measurement and capital standards: A
revised framework, Basel Committee on Banking Supervision, BIS, Switzerland.
Basel 2010, Principles for enhancing corporate governance, Basel Committee on
Banking Supervision, BIS, Switzerland.
Basel 2003, Public disclosures by banks: Results of the 2001 disclosure survey, Basel
Committee on Banking Supervision, BIS, Switzerland.
Basel 2012, Basel committee on banking supervision reforms - Basel III, Basel
Committee on Banking Supervision, BIS, Switzerland.
Baxter, C 1998, Bangladesh: From a nation to a state, Westview Press.
Baysinger, BD & Butler, HN 1985, 'Corporate governance and the board of directors:
Performance effects of changes in board composition', Journal of Law,
Economics, and Organization, vol. 1, no. 1, pp. 101-124.
Beasley, MS, Clune, R & Hermanson, DR 2005, 'Enterprise risk management: An
empirical analysis of factors associated with the extent of implementation',
Journal of Accounting and Public Policy, vol. 24, no. 6, pp. 521-531.
Beattie, V, McInnes, W & Fearnley, S 2004, 'A methodology for analysing and
evaluating narratives in annual reports: A comprehensive descriptive profile and
metrics for disclosure quality attributes', Accounting Forum, vol. 28, no. 3, pp.
205-236.
Bebchuk, LACAS 2010, 'Regulating bankers' pay', Georgetown Law Journal, vol. 98,
no. 2, pp. 247-287.
Belal, AR 2001, 'A study of corporate social disclosures in Bangladesh', Managerial
Auditing Journal, vol. 16, no. 5, pp. 274-289.
Belal, AR, Cooper, SM & Roberts, RW 2013, 'Vulnerable and exploitable: The need for
organisational accountability and transparency in emerging and less developed
economies', Accounting Forum, vol. 37, no. 2, pp. 81-91.
Belkaoui, AR 2004, 'Politically-connected firms: Are they connected to earnings
opacity?', Research in Accounting Regulation, vol. 17, no.1, pp.25-38.
Beltratti, A & Stulz, RM 2012, 'The credit crisis around the globe: Why did some banks
perform better?', Journal of Financial Economics, vol. 105, no. 1, pp. 1-17.
Ben Naceur, S & Kandil, M 2009, 'The impact of capital requirements on banks’ cost of
intermediation and performance: The case of Egypt', Journal of Economics and
Business, vol. 61, no. 1, pp. 70-89.
Beretta, S & Bozzolan, S 2004, 'A framework for the analysis of firm risk
communication', The International Journal of Accounting, vol. 39, no. 3, pp.
265-288.
Berger, AN, Clarke, GRG, Cull, R, Klapper, L & Udell, GF 2005, 'Corporate
governance and bank performance: A joint analysis of the static, selection, and
dynamic effects of domestic, foreign, and state ownership', Journal of Banking
& Finance, vol. 29, no. 8–9, pp. 2179-2221.
Berger, PL & Luckmann, T 1966, ‘The social construction of reality: A treatise in the
sociology of knowledge’, Anchor Books Garden City, New York.

336
Bertomeu, J, Beyer, A & Dye, RA 2011, 'Capital structure, cost of capital, and
voluntary disclosures', Accounting Review, vol. 86, no. 3, pp. 857-886.
Bertus, M, John, SJJ & Yost, K 2007, 'The relation between bank regulation and
economic performance: A cross-country analysis', Banks and Bank Systems, vol.
2, no. 3, pp.32-45.
Beverly, H 2007, 'Public disclosure, risk, and performance at bank holding companies',
Federal Reserve Bank, New York.
Bhagat, S & Bolton, B 2008, 'Corporate governance and firm performance', Journal of
Corporate Finance, vol. 14, no. 3, pp. 257-273.
Bhattacharjee, S & Islam, ZM 2008, 'Problems of adoption and application of
International Financial Reporting Standards (IFRS) in Bangladesh',
International Journal of Business and Management, vol. 4, no. 12, pp. 165-175.
Bhattacharya, D & Chowdhury, TA 2003, ‘Financial sector reforms in Bangladesh: The
next round’, CPD, Bangladesh.
Bischof, J, Brüggemann, U & Daske, H 2010, 'Relaxation of fair value rules in times of
crisis: An analysis of economic benefits and costs of the amendment to IAS 39',
Social Science Research Network Working Paper Series.pp.1-61.
Bordo, M, Eichengreen, B, Klingebiel, D & Martinez-Peria, MS 2001, 'Is the crisis
problem growing more severe?', Economic Policy, vol. 16, no. 32, pp. 51-82.
Botosan, CA 1997, 'Disclosure level and the cost of equity capital', Accounting Review,
vol. 72, no. 3, p. 323.
Botosan, CA 2004, 'Discussion of a framework for the analysis of firm risk
communication', The International Journal of Accounting, vol. 39, no. 3, pp.
289-295.
Boylan, DM 2001, ‘Defusing democracy : Central Bank autonomy and the transition
from authoritarian rule’, University of Michigan Press, U.S.A.
Brammer, S & Pavelin, S 2008, 'Factors influencing the quality of corporate
environmental disclosure', Business Strategy and the Environment, vol. 17, no.
2, pp. 120-136.
Bliss, M.A., Gul, F.A., 2012, ‘Political connection and leverage: Some Malaysian
evidence’. Journal of Banking and Finance. vol. 36, pp.2344-2350.
Banking Regulation and Policy Department 2009, ‘Loan classification and
provisioning’, Bangladesh Bank.
Banking Regulation and Policy Department 2010, ‘Prudential regulations for banks:
Selected issues’, Bangladesh Bank.
Banking Regulation and Policy Department 2012, ‘Revised loan classification and
provisioning’, Bangladesh Bank, Bangladesh.
Brunnermeier, MK 2009, 'Deciphering the liquidity and credit crunch 2007–2008',
Journal of Economic Perspectives, vol. 23, no. 1, 2009, pp. 77-100.
Bryman, A 2012, ‘The nature and process of social research’, 4th edition edn, Oxford
Press, Italy.
Bryman, A & Bell, E 2007, ‘Business research methods, third edn.’, Oxford Press, Italy.

337
Cabedo, JD & Miguel Tirado, J 2004, 'The disclosure of risk in financial statements',
Accounting Forum, vol. 28, no. 2, pp. 181-200.
Cadbury Report 1992, ‘Report of the committee on the financial aspects of
corporategovernance’, Gee Publishing Ltd., London.
Caldwell, J 2012, ‘A framework for board oversight of enterprise risk’, Chartered
Professional Accountants, Canada.
Callahan, MC & Smith, R 2004, 'Firm performance and management's discussion and
analysis disclosures: An industry approach', working paper, University of
Arkansas-Fayetteville.
Caprio, G, Laeven, L & Levine, R 2007, 'Governance and bank valuation', Journal of
Financial Intermediation, vol. 16, no. 4, pp. 584-617.
Carpenter, VL & E. H. Feroz 2001, 'Institutional theory and accounting rule choice: An
analysis of four U.S. state governments’ decisions to adopt generally accepted
accounting principles', Accounting, Organizations and Society, vol. 26, no. 7-8,
pp.565-96.
Carruthers, BG 1995, 'Accounting, ambiguity, and the new institutionalism',
Accounting, Organizations and Society, vol. 20, no. 4, pp. 313-328.
Chang, J 1998, 'The decline in value relevance of earnings and book values', University
of Pennsylvania.U.S.A.
Chen, CJP & Jaggi, B 2000, 'Association between independent non-executive directors,
family control and financial disclosures in Hong Kong', Journal of Accounting
and Public Policy, vol. 19, no. 4–5, pp. 285-310.
Cheng, ECM & Courtenay, SM 2006, 'Board composition, regulatory regime and
voluntary disclosure', The International Journal of Accounting, vol. 41, no. 3,
pp. 262-289.
Choudhury, K 2007, 'Service quality dimensionality: A study of the Indian banking
sector', Journal of Asia Pacific Business, vol. 8, no. 4, pp. 21-38.
Chowdhury, A 2012, 'Harmonization of financial reporting and audit prcatices-
Bangladesh perspective', The Bangladesh Accountant, vol. 2, no. 1, pp.5-37.
Claessens, S, Fan, J & Lang, L 1999, 'Exploration of minority shareholders: Evidence
from East Asia ', working paper, World Bank.
Clarkson, P, Guedes, J & Thompson, R 1996, 'On the diversification, observability, and
measurement of estimation risk', Journal of Financial & Quantitative Analysis,
vol. 31, no. 1, pp. 69-84.
Collis, J & Hussey, R 2003, ‘Business research’, Palgrave Macmillan, U.K.
Coleman, J., 1993, 'The rational reconstruction of society', American Sociological
Review, vol.58, no.1, pp. 1-15.
Conyon, M, Judge, WQ & Useem, M 2011, 'Corporate governance and the 2008–09
financial crisis', Corporate Governance: An International Review, vol. 19, no. 5,
pp. 399-404.
Cooper, SM & D. L. Owen 2007, 'Corporate social reporting and stakeholder
accountability', Accounting, Organization, and Society, vol. 32, pp. 649-667.

338
Cormier, D, Gordon, I & Magnan, M 2004, 'Corporate environmental disclosure:
Contrasting management's perceptions with reality', Journal of Business Ethics,
vol. 49, no. 2, pp. 143-165.
Creswell, WJ 2003, ‘Research design: Qualitative, quantitative and mixed method
approaches’, 2nd edn., Sage publications, U.S.A.
Creswell, WJ & Clarke, P, L. vicki 2011, ‘Designing and conducting mixed methods
research’, 2nd edn., U.S.A.
Crotty, M 1998, ‘The foundation of social research’, KHL printing Co. Pte Ltd,
Singapore.
Darmadi, S & Sodikin, A 2013, 'Information disclosure by family-controlled firms: The
role of board independence and institutional ownership ', Asian Review of
Accounting, vol. 21, no. 3, pp. 223-240.
Deegan, C, 2009, 2009, ‘Financial Accounting Theory’, 3rd
edition edn., McGraw-Hill
Sydney.
Deloitte 2014, ‘Financial Reporting Framework in Bangladesh’, viewed 31st March
2014, <http://www.iasplus.com/en/jurisdictions/asia/bangladesh>.
Demetriades, PO & Luintel, KB 1996, 'Banking sector policies and financial
development in Nepal ', vol. 58, no. 2, pp. 355-372.
Demirgüç-Kunt, A, Detragiache, E & Tressel, T 2008, 'Banking on the principles:
Compliance with Basel core principles and bank soundness', Journal of
Financial Intermediation, vol. 17, no. 4, pp. 511-542.
Denzen, NK & Linkon, YS 1994, ‘Handbook of qualitative research’, Sage, CA.
Deumes, R & Knechel, R, W. 2008, 'Economic incentives for voluntary reporting on
internal risk management and control systems', Auditing: A Journal of Practice
& Theory, vol. 27, no. 1, pp. 35-66.
Diamond, DW & Rajan, RG 2009, 'The credit crisis: Conjectures about causes and
remedies', American Economic Review, vol. 99, no. 2, pp. 606-610.
Dillard, JF, Rigsby, JT & Goodman, C 2004, 'The making and remaking of organization
context: Duality and the institutionalization process', Accounting, Auditing and
Accountability Journal, vol. 17, no. 4, pp. 506-42.
DiMaggio, PJ & Powell, WW 1983, 'Institutional isomorphism and collective rationality
in organizational fields', American Sociological Review, vol. 48, no. 2, pp. 147-
160.
Dobler, M 2008, 'Incentives for risk reporting — A discretionary disclosure and cheap
talk approach', The International Journal of Accounting, vol. 43, no. 2, pp. 184-
206.
Dobler, M, Lajili, K & Zéghal, D 2011, 'Attributes of corporate risk disclosure: An
international investigation in the manufacturing sector', Journal of International
Accounting Research, vol. 10, no. 2, pp. 1-22.
Eaton, R 1996, ‘The rise of Islam and the Bengal Frontier’, University of Calofornia
Press, California.

339
Eisenhardt, M, Cathleen 1989, 'Agency theory: An assessment and review', The
Academy of Management Review, vol. 14, no. 1, pp. 57-74.
Ellul, A & Yerramilli, V 2010, 'Stronger risk controls, lower risk: Evidence from U.S.
bank holding companies', Indiana University.
Eng, LL & Mak, YT 2003, 'Corporate governance and voluntary disclosure', Journal of
Accounting and Public Policy, vol. 22, no. 4, pp. 325-345.
Erkens, DH, Hung, M & Matos, P 2012, 'Corporate governance in the 2007–2008
financial crisis: Evidence from financial institutions worldwide', Journal of
Corporate Finance, vol. 18, no. 2, pp. 389-411.
Fahlenbrach, R & Stulz, RM 2011, 'Bank CEO incentives and the credit crisis', Journal
of Financial Economics, vol. 99, no. 1, pp. 11-26.
Farooque, OA, van Zijl, T, Dunstan, K & Karim, AKMW 2007, 'Ownership structure
and corporate performance: Evidence from Bangladesh', Asia-Pacific Journal of
Accounting & Economics, vol. 14, no. 2, pp. 127-149
Fama, E & Jensen, M 1983, 'Separation of ownership and control', The Journal of Law
and Economics., vol. 26 no. 2, pp. 301- 325.
Fernández, AI & González, F 2005, 'How accounting and auditing systems can
counteract risk-shifting of safety-nets in banking: Some international evidence',
Journal of Financial Stability, vol. 1, no. 4, pp. 466-500.
Field, A 2009, ‘Discovering statistics using SPSS’, 3rd edn., Sage.CA
Foerster , SR, Sapp, S & Shi, Y 2013, ‘The effect of voluntary disclosure on firm risk
and firm value: Evidence from management earnings forecasts’ at the Canadian
Academic Accounting Association Annual Conference, May 30–Sunday, June 2,
2013, Canada.
Fraser, I & Henry, W 2007, 'Embedding risk management: Structures and approaches',
Managerial Auditing Journal, vol. 22, no. 4, pp. 392-409.
Frolov, M 2004, 'Why do we need mandated rules of public disclosure for banks?',
working paper, Keio university.
Gao, Y 2011, 'Isomorphic effect and organizational bribery in transitional China', Asian
Business and Management, vol. 10, no. 2, pp. 233-257.
Ghoshal, S. 2005, 'Bad management theories are destroying good management
practices', Academy of Management Learning & Education, vol.4, no.1, pp. 75-
91
Goddard, J, Molyneux, P & Wilson, JOS 2009, 'The financial crisis in Europe:
Evolution, policy responses and lessons for the future', Journal of Financial
Regulation and Compliance, vol. 17, no. 4, pp. 362-380.
Greenwood, R & Hinings, CR 1996, 'Understanding radical organizational change:
Bringing together the old and the new institutionalism', Academy of
Management Review, vol. 21, no. 4, pp. 1022-1054.
Guerreiro, MS, Rodrigues, LL & Craig, R 2012, 'Voluntary adoption of International
Financial Reporting Standards by large unlisted companies in Portugal –
Institutional logics and strategic responses', Accounting, Organizations and
Society, vol. 37, no. 7, pp. 482-499.

340
Hair, JF 2007, ‘Research methods for business’, John Wiley, England.
Hair, JF, Black, WC, Babin, BJ & Anderson, RE 2010, Multivariate data analysis, 7th
edn., London.
Hampel Report (1998). ‘Committee on corporate governance: Final report’, Gee
Publishing Ltd., London.
Hannan, MT & Freeman, J 1977, 'The population ecology of organizations', American
Journal of Sociology, vol. 82, no. 5, pp. 929-964.
Hashagen, J, Harman, N & Conover 2009, ‘Never again? Risk management in banking
beyond the credit crisis’, working paper, KPMG.
Hassan, K, Mostafa & Halbouni, S, Sawsan 2013, 'Corporate governance, economic
turbulence and financial performance of UAE listed firms', Studies in Economics
and Finance, vol. 30 no. 2, pp. 118 – 138.
Hassan, MK 2009, 'UAE corporations-specific characteristics and level of risk
disclosure', Managerial Auditing Journal, vol. 29, no. 4, pp. 384-427.
Haunschild, PR & Miner, SA 1997, 'Modes of interorganizational imitation: The effects
of outcome salience and uncertainty', Administrative Science Quarterly, vol. 42,
no. 3, pp.113-130.
Healy, PM, Hutton, AP & Palepu, KG 1999, 'Stock performance and intermediation
changes surrounding sustained increases in disclosure', Contemporary
Accounting Research, vol. 16, no. 3, pp. 485-520.
Healy, PM & Palepu, KG 2001, 'Information asymmetry, corporate disclosure, and the
capital markets: A review of the empirical disclosure literature', Journal of
Accounting and Economics, vol. 31, no. 1–3, pp. 405-440.
Helbok, G & Wagner, c 2006, 'Determinants of operational risk reporting in the banking
industry', Journal of Risk, vol.9, no. 1, pp. 49-74.
Hermalin, BE & Weisbach, MS 2012, 'Information disclosure and corporate
governance', The Journal of Finance, vol. 67, no. 1, pp. 195-234.
Hernandez-Madrigal, M, Blanco-Dopico, M-I & Aibar-Guzman, B 2012, 'The influence
of mandatory requirements on risk disclosure practices in Spain', Int J Discl
Gov, vol. 9, no. 1, pp. 78-99.
Higgs Report 2003, ‘Review of the role and effectiveness of non-executive directors’,
Department of Trade and Industry, London.
Hill, P & Short, H 2009, 'Risk disclosures on the second tier markets of the London
Stock Exchange', Accounting & Finance, vol. 49, no. 4, pp. 753-780.
Hoitash, U, Hoitash, R & Bedard, JC 2009, 'Corporate governance and internal control
over financial reporting: A comparison of regulatory regimes', Accounting
Review, vol. 84, no. 3, pp. 839-867.
Hollingsworth, JR 2003, 'Advancing the socio-economic paradigm with institutional
analysis', Socio-Economic Review, vol. 1, no. 1, 2003, pp. 130-134.
Hossain, A & Chowdhury, A 1996, ‘Monetary and Financial Policies in Developing
Countries: Growth and Stabilization, Routledge’, New York.

341
Hossain, M 2008, 'The extent of disclosure in annual reports of banking companies: The
case of India', European Journal of Scientific Research, vol. 23, no. 4, 2008, pp.
659-680.
Hossain, M & Hammami, H 2009, 'Voluntary disclosure in the annual reports of an
emerging country: The case of Qatar', Advances in Accounting, vol. 25, no. 2,
pp. 255-265.
Hossain, M, Islam, K & Andrew, J 2006, ‘Corporate social and environmental
disclosure in developing countries: Evidence from Bangladesh’ in Asian pacific
conference on international accounting issues University of Wollong, Hawaii.
Hwang, D-Y, Lee, AC, Liu, C-C & Ouyang, L 2009, 'Balanced performance index and
its implications: Evidence from Taiwan's commercial banks', Review of Pacific
Basin Financial Markets & Policies, vol. 12, no. 1, pp. 27-62.
IASB 2004, ‘Financial instruments: Disclosures’, Exposure draft, International
Accounting Standards Board, London.
IASB 2007, ‘Financial Instrument: Disclosures’, International Accounting Standards
Board, London.
IASB 2009, ‘Improving Disclosures about Financial Instruments (Amendments to IFRS
7)’, International Accounting Standards Board, London.
ICAEW 1995, ‘Reporting accountants' work on financial reporting procedures’,
Institute of Chartered Accountants in England and Wales, London.
ICAEW 1998, ‘Financial reporting of risk—Proposals for a statement of business risk’,
The Institute of Chartered Accountants in England and Wales, London.
ICAEW 1999, ‘No surprise: The case for better risk reporting’, The Institute of
Chartered Accountants in England and Wales, London.
ICAEW 2003, ‘Information for better market: New reporting models for business’, The
Institute of Chartered Accountants in England and Wales, London.
ICAEW 2010a, ‘Audit of banks lessons from the Crisis: Better information inspiring
confidence in financial service initiative’, The Institute of Chartered
Accountants in England and Wales, London.
ICAEW 2010b, ‘Risk reporting: Principles for better practice’, The Institute of
Chartered Accountants in England and Wales, London.
ICAEW 2011, ‘Reporting business risks: Meeting expectations information for better
market initiatives’, The Institute of Chartered Accountants in England and
Wales, London.
IMF 2012, ‘Japan: Financial sector stability assessment update’, International Monetary
Fund, Washington, D.C.
IMF 2013, ‘First review under the three-year arrangement under the extended credit
facility and request for waiver of nonobservance of a performance criterion’,
International Monetary Fund, Washington, D.C.
Islam, M 2008, 'Compliance with International Accounting Standards by emerging
economies’ in 10th Annual International Conference on Accounting and
Business, Shanghai, June 6-8, China.

342
Ismail, R, Rahman, RA & Ahmad, N 2013, 'Risk management disclosure In Malaysian
islamic financial institutions: Pre- and post-financial crisis', The Journal of
Applied Business Research, vol. 29, no. 2, pp. 419-432.
Jensen, MC & Meckling, WH 1976, 'Theory of the firm: Managerial behavior, agency
costs and ownership structure', Journal of Financial Economics, vol. 3, no. 4,
pp. 305-360.
JETRO 2010, ‘The 20th comparative survey of investment-related costs in 29 major
cities and regions in Asia’, Japan External Trade Organization, Japan.
John, F & Fred, M 2009, ‘The great financial crisis: Causes and consequences’,
Monthly Review press, New York.
Judge, WQ, Douglas, TJ & Kutan, AM 2008, 'Institutional antecedents of corporate
governance legitimacy', Journal of Management, Vol. 34 No. 4, pp.765-785.
Kajuter, P 2006, in ‘10th Financial reporting and business communication conference’,
Cardiff Business School, UK.
Kamal, YM 2006, 'The development of banking sector in Bangladesh ', Southeast
University Journal of Business Studies, vol. 2, no. 1, pp. 241-251.
Katz, JP 1998, 'The human equation: Building profits by putting people first', Academy
of Management Executive, vol. 12, no. 1, pp. 93-95.
Khan, A, Muttakin, M & Siddiqui, J 2013, 'Corporate governance and corporate social
responsibility disclosures: Evidence from an emerging economy', Journal of
Business Ethics, vol. 114, no. 2, pp. 207-223.
Khan, A.H. (2004), ‘Corporate governance’, at the CPE seminar on corporate
governance, The institute of Chartered Accountants of Bangladesh, Dhaka, pp.
1-10.
Khan, AMJ 2013, 'Corporate governance and corporate social responsibility disclosures:
Evidence from an emerging economy', Journal of Business Ethics, vol. 114, no.
2, pp. 207-223.
Khan, MZ, Islam, M.Z, Fatima, KJ & Ahmed, K 2011, 'Corporate sustainability
reporting of major commercial banks in line with GRI: Bangladesh evidence',
Social Responsibility Journal, vol. 7, no. 3, pp. 347-362.
Kleffner, AE, Lee, RB & McGannon, B 2003, 'The effect of corporate governance on
the use of enterprise risk management: Evidence from Canada', Risk
Management & Insurance Review, vol. 6, no. 1, pp. 53-73.
Kumar, R 2011, ‘Research Methodology’, Sage, UK.
La Porta, R, Lopez-De-Silanes, F & Shleifer, A 1999, 'Corporate ownership around the
world', The Journal of Finance, vol. 54, no. 2, pp. 471-517.
Laeven, L 2011, 'Banking Crises: A review', Annual Review of Financial Economics,
vol. 3, no. 1, pp. 17-40.
Laeven, L & Levine, R 2009, 'Bank governance, regulation and risk taking', Journal of
Financial Economics, vol. 93, no. 2, pp. 259-275.
Lajili, K 2009, 'Corporate risk disclosure and corporate governance', Journal of Risk
and Financial Management, vol. 2, pp. 94-117.

343
Lajili, K & Zéghal, D 2005, 'A content analysis of risk management disclosures in
Canadian annual reports', Canadian Journal of Administrative Sciences, vol. 22,
no. 2, pp. 125-142.
Lang, MH & Lundholm, RJ 1996, 'Corporate disclosure policy and analyst behavior',
Accounting Review, vol. 71, no. 4, pp. 467-492.
Latham, CK & Jacobs, FA 2000, 'Monitoring and incentive effects influencing
miseading disclosures', Journal of Managerial Issues, vol. 12, no. 2, pp. 169-87.
Laux, C & Leuz, C 2009, 'The crisis of fair-value accounting: Making sense of the
recent debate', Accounting, Organizations and Society, vol. 34, no. 6–7, pp. 826-
834
Lenckus, D 2001, 'Enterprising risk manager', Business Insurance, vol. 35, no. 1, pp. 1-
2.
Levine, R 2004, 'The corporate governance of banks: A concise discussion of concepts
and evidence', Global corporate governance, working paper, University of
Minnesota and National Bureau of Economics.
Lim, S, Matolscsy, Z & Chow, D 2007, 'The association between board composition
and different types of voluntary disclosure', European Accounting Review, vol.
16, no. 3, pp. 555-83.
Linsley, P & Lawrence, M 2007, 'Risk reporting by the largest UK companies:
Readability and lack of obfuscation', Accounting, Auditing & Accountability
Journal, vol. Vol. 20, no. 4, pp. 1-9.
Linsley, P & Shrives, P 2000, 'Risk management and reporting risk in the UK', Journal
of Risk & Insurance, vol. 3, no. 1, pp. 115-129.
Linsley, PM & Shrives, PJ 2005a, 'Examining risk reporting in UK public companies',
Journal of Risk Finance, vol. 6, no. 4, pp. 292-305.
Linsley, PM & Shrives, PJ 2005b, 'Transparency and the disclosure of risk information
in the banking sector', Journal of Financial Regulation and Compliance, vol. 13,
no. 3, pp. 205-214.
Linsley, PM & Shrives, PJ 2006, 'Risk reporting: A study of risk disclosures in the
annual reports of UK companies', The British Accounting Review, vol. 38, no. 4,
pp. 387-404.
Linsley, PM, Shrives, PJ & Crumpton, M 2006, 'Risk disclosure: An exploratory study
of UK and Canadian banks', Journal of Banking Regulation, vol. 7, no. 3/4, pp.
268-282.
Linsmeier, TJ, Thornton, DB, Venkatachalam, M & Welker, M 2002, 'The effect of
mandated market risk disclosures on trading volume sensitivity to interest rate,
exchange rate, and commodity price movements', Accounting Review, vol. 77,
no. 2, pp. 343-377.
Lopes, PT & Rodrigues, LL 2007, 'Accounting for financial instruments: An analysis of
the determinants of disclosure in the Portuguese stock exchange', The
International Journal of Accounting, vol. 42, no. 1, pp. 25-56.
Lybek, T 2004, ‘Central Bank autonomy, accountability, and governance: Conceptual
framework’ in LEG seminar, International Monetary Fund, Washington, D.C.

344
Mair, J & Marti, I 2009, 'Entrepreneurship in and around institutional voids: A case
study from Bangladesh', Journal of Business Venturing, vol. 24, no. 5, pp. 419-
435.
Marsh, L, Keating, M, Punch, S & Harden, J 2009, Sociology: Making sense of society,
4th edn., Pearson, UK.
Marshall, AP & Weetman, P 2002, 'Information asymmetry in disclosure of foreign
exchange risk management: can regulation be effective?', Journal of Economics
and Business, vol. 54, no. 1, pp. 31-53.
McElroy, JC 2001, 'Managing workplace commitment by putting people first', Human
Resource Management Review, vol. 11, no. 3, pp.327-335.
Mehrling, P 2005, ‘Fischer black and the revolutionary idea of finance’, Ist
edn, Wiley,
New Jersey.
Meyer, JW & Rowan, B 1977, 'Institutionalized organizations: Formal structure as myth
and ceremony', American Journal of Sociology, vol. 83, no. 2, pp. 340-363.
Michael, D, Kaouthar, L & Daniel, Z 2011, 'Attributes of corporate risk disclosure : An
international investigation in the manufacturing sector', Journal of International
Accouting Reseach, vol. 10, no. 2, pp. 1-22.
Miller, SM & Noulas, AG 1996, 'The technical efficiency of large bank production',
Journal of Banking & Finance, vol. 20, no. 3, 495-509.
Milne, A & Wood, G 2008, ‘Banking crisis solutions old and new’, Federal Reserve
Bank of St. Louis Review, UK.
Milne, MJ 2002, 'Positive accounting theory, political costs and social disclosure
analyses: A critical look', Critical Perspectives on Accounting, vol. 13, no. 3, pp.
369-395.
Ministry of Finance 2013, ‘Monetary management and financial market development’,
government of Bangladesh.
Mir, MZ & Rahaman, AS 2005, 'The adoption of international accounting standards in
Bangladesh: An exploration of rationale and process', Accounting, Auditing &
Accountability Journal, vol. 18, no. 6, pp. p.816 – 841.
Mohobbot , A 2005, 'Corporate risk reporting practices in annual reports of Japanese
companies', Japanese Journal of Accounting, vol. 16, no. 1, pp. 113-33.
Mongiardino, A & Plath, C 2010, 'Risk governance at large banks: Have any lessons
been learned?', Journal of Risk Management in Financial Institutions, vol. 3, no.
2, pp. 116-123.
Morgan, G & Smircich, L 1980, 'The case for qualitative research', Academy of
Management Review, vol. 5, no. 4, pp. 491-500.
Mukherjee, A & Nath, P 2003, 'A model of trust in online relationship banking',
International Journal of Bank Marketing, vol. 21, no. 1, pp. 5-15.
Newholm, T & Shaw, D 2007, 'Studying the ethical consumer: A review of research',
Journal of Consumer Behaviour, vol. 6, no. 5, pp. 253-270.
Nier, E & Baumann, U 2006, 'Market discipline, disclosure and moral hazard in
banking', Journal of Financial Intermediation, vol. 15, no. 3, Jul, pp. 332-361.

345
North, CD 1990, ‘Institutions, Institutional change and economic performance’,
Cambridge University Press, UK.
Oliveira, J, Rodrigues, LL & Craig, R 2011, 'Risk-related disclosures by non-finance
companies: Portuguese practices and disclosure characteristics', Managerial
Auditing Journal, vol. 26, no. 9, pp. 817-839.
Pallant, J 2010, ‘SPSS Survival Manual : A step by step guide to data analysis using
SPSS’, 4th edn., McGraw-Hill Education, UK.
Palmer, D, Jennings, P & Zhou, X 1993, 'Late adoption of the multidivisional form',
Administrative Science Quarterly, vol. 38, pp. 100-31.
Parry, M & Khan, F 1984, ‘A survey of published accounts in Bangladesh’, The
Institute of Chartered Accountants of Bangladesh and United Nations
Department of Technical Co-operation for Development.
Patton, M, Quinn 2002, ‘Qualitative research & evaluation methods’, 3rd
edn., Sage
Publications, U.S.A.
Pearce, JA & Zahra, SA 1992, 'Board composition from a strategic contingency
perspective', Journal of Management Studies, vol. 29, no. 4, pp. 411-438.
Perrow, C 1986, ‘Complex organizations: A critical Essay’, 3rd edn., McGraw-Hill,
New York.
Powell, WW & DiMaggio, PJ 1991, ‘Institutionalism in organizational analysis’,
University of Chicago Press.
Probohudono, N, Agung, Tower, G & Rusmin, R 2013a, 'Diversity in risk
communication', Australian Accounting Business and Finance Journal, vol. 7,
no. 1, pp. 44-58.
Probohudono, N, Agung, Tower, G & Rusmin, R 2013b, 'Risk disclosure during the
global financial crisis', Social Responsibility Journal, Vol. 9, no.1, pp.124 - 137
PWC, 2008, ‘Accounting for change: Transparency in the midst of turmoil’,
PricewaterhouseCoopers, UK
Prowse, S. 1998, ‘Corporate governance in East Asia: A framework for analysis’. Paper
presented at Managing Capital Flows: National and International Dimensions,
June 15–16, 1998, Bangkok, Thailand.
Radebaugh, HL & Gray, SJ 2005, ‘International accounting and multinational
enterprises’, 6 edn., John Wiley & Sons New York.
Reinhart, Carmen M. & Rogoff, Kenneth S., 2013. ‘Banking crises: An equal
opportunity menace,’ Journal of Banking & Finance, Elsevier, vol. 37, no.11,
pp. 4557-4573.
Richardson, AJ & Welker, M 2001, 'Social disclosure, financial disclosure and the cost
of equity capital', Accounting, Organizations and Society, vol. 26, no. 7-8, pp.
597–616.
Ryan, B, Scapens, W, Robert & Theobald, M 2002, ‘Research method and methodology
in Finance and Accounting’, Thomson, UK.

346
Samad, A 2008, 'Market structure, conduct and performance: Evidence from the
Bangladesh banking industry', Journal of Asian Economics, vol. 19, no. 2, pp.
181-193.
Samuels, JM & Oliga, JC 1982, 'Accounting standards in developing countries', The
International Journal of Accounting Education and Research, vol. 18, no. 1, pp.
69-88.
Sanya, S & Gaertner, M 2012, 'Assessing bank competition within the East African
community', International Monetary Fund, Washington, D.C.
Shapiro, S., 2005, ‘Agency theory’, Annual Review of Sociology, vol. 31, no.1, pp. 263-
284.
Sarker, MAA 1999, 'Islamic banking in Bangladesh: Growth, structure, and
performance,' Third Harvard University Forum on Islamic Finance: Local
challenges, global opportunities. Cambridge, Massachusetts, Center for Middle
Eastern Studies, Harvard University. pp. 271-290.
Saunders, M, Lewis, P & Thornhill, A 2009, ‘Research methods for business students’,
5th
edn., Pearson, UK.
Schrand, CM & Elliott, JA 1998, 'Risk and financial reporting: A summary of the
discussion at the 1997 at the AAA/FASB conference', Accounting Horizons, pp.
271-282.
Scott, R, W. 2008, 'Approaching adulthood: The maturing of institutional theory',
Springer Science, vol. 37, pp. 427-442.
Scott, WR 1987, 'The adolescence of institutional theory', Administrative Science
Quarterly, vol. 32, no. 4, pp. 493-511.
Scott, WR 1995, ‘Institutions and Organizations’, Sage, CA.
Scott, WR 2004, 'Institutional theory: Contributing to a theoretical research program',
Oxford University Press., UK.
Selznick, P 1949, ‘TVA and the grass roots’, University of California Press, Berkley,
CA.
Selznick, P, 1957, 1957, ‘Leadership in administration: A sociological interpretation’,
Harper & Row, New York.
Sheng, A 1996, ‘Bank restructing: Lessons from 1980s’, World Bank, Washington.
Siddikee, MJA, Parvin, S & Hossain, MS 2013, 'Banking scenarios in Bangladesh',
Bangladesh Research Publication Journal, vol. 8, no. 1, pp. 89-95.
Siddiqui, J 2010, 'Development of corporate governance regulations: The case of an
emerging economy', Journal of Business Ethics, vol. 91, no.2, pp. 253-274.
Singleton, RA & Straits, BC 2010, ‘Approaches to social research’, 5th
edn., Oxford
University Press New York.
Sobhan, R & Ahmad, M 1980, ‘Public enterprise in an intermediate regime: A study in
the political economy of Bangladesh’, Bangladesh Institute of Development
Studies Dhaka.

347
Sobhani, FA, Amran, A & Zainuddin, Y 2012, 'Sustainability disclosure in annual
reports and websites: a study of the banking industry in Bangladesh', Journal of
Cleaner Production, vol. 23, no. 1, pp. 75-85.
Solomon, A & Lewis, L 2002, 'Incentives and disincentives for corporate environmental
disclosure', Business Strategy and the Environment, vol. 11, no. 3, pp. 154-169.
Solomon, JF, Solomon, A, Norton, SD & Joseph, NL 2000, 'A conceptual framework
for corporate risk disclosure emerging from the agenda for corporate governance
reform', The British Accounting Review, vol. 32, no. 4, pp. 447-478.
Smith Report 2003, ‘Audit committees - combined codes guidance’. Financial
Reporting Council, London.
Stanton, p & Stanton, J 2002, 'Corporate annual reports: Research perspectives used',
Accounting, Auditing & Accountability Journal, vol. 15, no. 4, pp. 478-500.
Strebel, P 2009, 'Time to bring real shareholders back on board', Financial times,
Pearson, UK.
Sultana, N 2012, 'The early development of social work: A comparison between the
West and Bangladesh, a south Asian developing country', International Social
Work, vol. 55, no. 6, November 1, 2012, pp. 823-836.
Surendra, A., 2010, ‘Aristotelian-thomistic virtue ethics, emotional intelligence &
decision-making’, Advances in Management, vol.3, no.4, pp. 7-13.
Tashakkori, A & Creswell, WJ 2007, 'The era of mixed methods', Journal of Mixed
Methods Research, vol. 1, no. 1, pp. 3-7.
Tashakkori, A & Teddlie, C 2010, ‘Mixed method in social and behavioral research’,
2nd
edn., U.S.A.
Taylor, G, Tower, G & Neilson, J 2010, 'Corporate communication of financial risk',
Accounting & Finance, vol. 50, no. 2, pp. 417-446.
Teddlie, C & Tashakkori, A 2009, ‘Foundation of mixed methods research integrating
quantitative and qualitative approaches in the social and behavioral sciences’,
Sage publications limited, U.S.A.
Thuélin, E, Henneron, S & Touron, P 2006, 'Risk regulations and financial disclosure',
Corporate Communications: An International Journal, vol. Vol. 11 no. 3, pp.
303 – 326.
Turley, S & Zaman, M 2004, 'The corporate governance effects of audit committees',
Journal of Management and Governance, vol. 8, no. 3, pp. 305-332.
Turnbull Report 1999, ‘Internal control: Guidance for directors on the combined code’,
The Institute of Chartered Accountants in England and Wales, London.
Tuttle, B & Dillard, J 2007, 'Beyond competition: Institutional isomorphism in U.S.
accounting research', Accounting Horizons, vol. 21, no. 4, pp. 387-409.
Uddin, MH & Hassan, MK 2011, 'Corporate risk information in annual reports and
stock price behavior in the united arab emirates', Academy of Accounting &
Financial Studies Journal, vol. 15, no. 1, pp. 59-84.

348
Uddin, S & Choudhury, J 2008, 'Rationality, traditionalism and the state of corporate
governance mechanisms: Illustration from less-developed country', Accounting,
Auditing & Accountability Journal, vol. 7, no. 21, pp. 1026-1051.
Uddin, S & Hopper, T 2003, 'Accounting for privatisation in Bangladesh: Testing world
bank claims', Critical Perspectives on Accounting, vol. 14, no. 7, pp. 739-774.
Uddin, SMS & Suzuki, Y 2011, 'Financial reform, ownership and performance in
banking industry: The case of Bangladesh', International Journal of Business
and Management, vol. 6, no. 7, pp. 28-39.
Unerman, J & Bennett, M 2004, 'Increased stakeholder dialogue and the internet:
Towards greater corporate accountability or reinforcing capitalist hegemony?',
Accounting, Organizations and Society, vol. 29, no. 7, pp. 685-707.
U.SA 2011, ‘The financial crisis inquiry report :Final report of the national commission
on the causes of the financial and economic crisis in the United States, Official
Government edition, Government Printing Office, Washington, D.C.
Veal, JA 2005, ‘Business research methods - A managerial approach’, 2nd edn.,
Australia.
Verrecchia, ER 2001, ‘Essays on disclosure’, at the JAE Rochester Conference
University of Pennsylvania, U.S.A.
Villiers, C & Alexander, A 2010,‘Isomorphism in social and environmental
disclosures’, at the Asia Pacific Interdisciplinary Perspectives on accounting
conference (APIRA), July 12-13, Sydney, Australia.
Wadood, KMA, Hazra, DR, Siddiqui, MS, Islam, MN & Iqbal, A 2010, ‘Guidelines on
risk based capital adequacy’, Bangladesh Bank.
Wallace, RSO & Naser, K 1995, 'Firm-specific determinants of the comprehensiveness
of mandatory disclosure in the corporate annual reports of firms listed on the
stock exchange of Hong Kong', Journal of Accounting and Public Policy, vol.
14, no. 4, pp. 311-368.
Wallage, P 2000, 'Assurance on sustainability reporting: An auditor's View', Auditing,
vol. 19, no. 1, pp. 53-65.
Wang, LN, Zhu, WD & Shen, J 2009, ‘Comparison research on liquidity risk disclosure
of listed banks: Analysis based on 2008 annual reports of SPDB and BOC’ at
the 2009 International Conference on Public Economics and Management, Cost
Benefits Analysis, November 28-29, China.
Wang, W 2005, 'An evaluation of the balanced scorecard in equity valuation: The case
of exchange ratio in the M&As of Taiwan's financial industry', Journal of
Intellectual Capital, vol. 6, no. 2, pp. pp.206 – 221.
Watts, L, R & Zimmerman, LJ 1978, 'Towards a positive theory of the determination of
accounitng standards', The Accounting Review, vol. Liii, no. 1, pp. 112-134.
Weir, C, Laing, D & McKnight, PJ 2002, 'Internal and external governance
mechanisms: Their impact on the performance of large UK public companies',
Journal of Business Finance & Accounting, vol. 29, no. 5-6, pp. 579-611.
Wertz, JF, Charmaz, K, McMullen, ML, Josselson, R, Anderson, R & McSpadden, E
2011, ‘Five ways of doing qualitative analysis’, The Guilford Press, U.S.A.

349
Woods, M, P. Kajuter, & Linsley, PM 2007, ‘International risk management systems,
internal control and corporate governance’, Elsevier, Burlington.
Woods, M & Reber, B 2003, 'A comparison of UK and German reporting practice in
respect of risk disclosure post GAS 5', at the Denver Meetings, European
Accounting Association, Spain.
WorldBank 2005a, ‘World development indicators’, viewed 24th
July
2013<http://data.worldbank.org/data-catalog/world-development-indicators>
Wysocki, p 2011, 'New institutional accounting and IFRS', Accounting and Business
Research, vol. 41, no. 3, pp. 309-328.
Xinhua 2006, '4000-year old settlement unearthed in Bangladesh', available at
<http://english.people.com.cn/200603/12/eng20060312_250044.html>
Yin, KR 2009, ‘Case study research: Design and method’, 4th
edn., SAGE, U.S.A.
Young, E 2008, ‘IFRS 7 in the banking industry’, U.K.
World Bank 2003, ‘Report on the observance of standards and codes (rosc)
Bangladesh’, available at <http://www.worldbank.org/ifa/rosc_aa_bgd.pdf.>
World Economic Forum 2013, ‘The global competitiveness report’, Switzerland.
available
<http://www3.weforum.org/docs/WEF_GlobalCompetitivenessReport_2012-13.pdf>

350

351
Appendices
Appendix 6.1: Paradigmatic dichotomies in research
Authors The philosophy of financial research
Veal
(2005, pp.
24-29)
Positivist-
Interpretive
Positivist-Positivist
paradigms view the
objectivity to the researcher,
and are referred to also as
scientific, empiricist,
quantitative or deductive.
Interpretive/Critical- Interpretive
paradigms view the subjectivity
to the researcher followed by
inductive qualitative method.
Quantitative
and qualitative
Quantitative- involves
gathering and analysis of
numerical data using the
primary sources such as
questionaries survey,
observation or from
secondary sources to
generalise the results in
whole population.
Qualitative- involve relatively
small number of sample using
observation, informal,
unstructured and in depth
interview and findings are not
typically generalizable.
Induction and
Deduction
Induction- begins with
observation, description and
data collection to explain the
theoretical proposition.
Deduction- begins with
hypothesis and tests the
hypothesis.
Experimental
and Non-
experimental
Experimental-
Research conducted in an
environment (e.g. laboratory)
in which the researcher has a
control over a limited number
of variables.
Non-experimental
Research conducted in a ‘real
world’ environment where the
researcher has no control over
variables.
Ryan et
al(2002,
pp.34-36)
Alternative philosophies of Accounting Research
Scientific-
naturalistic
Scientific- starts from a well-
formulated theory, usually
derived from a review of the
previous academic literature
and expressed in the form of
mathematical model, the
theory used to formulate
hypotheses that express
relationship between sets of
dependent and independent
variables.
Naturalistic- appropriate for
studying the everyday behaviour
to study research subjects in
their natural settings; based on
realism, holism and analytical
method like case study.

352
Appendix 6.2: Types of research from the viewpoint of different
perspectives Authors Viewpoint Types of research
Kumar
(2011,p.10-
14)
Application
perspective
Pure- developing theories and hypothesis containing
abstract and specialised concept.
Applied- research techniques, procedures and methods
that form the body of research methodology are applied
to the collection of information to understand the
phenomenon.
Objectives
perspective
Descriptive-describes the phenomena as they exists,
quantitative data and statistical techniques are used to
summarise the information (Collis & Hussey 2003).
Correlational-emphasis is to discover or establish the
existence of a relationship/association/interdependence
between two or more aspects of a situation.
Explanatory-clarify why and how there is a relationship
between two aspects of a situation or phenomenon.
Exploratory-conducted when there are very few studies
and aims to look for patterns, ideas or propositions rather
than to tests or confirm hypothesis. (Collis & Hussey
2003)
Enquiry
mode
perspective
Structured-Objectives, design, sample, and the
questions to respondents are predetermined and usually
classified quantitative research.
Unstructured-allows flexibility to explore the nature,
variation/diversity per se in a phenomenon, issue,
problem, or attitude towards an issue and usually
classified as qualitative approach.
Collis and
Hussey
(2003,p.10-
12)
Exploratory, Descriptive, Analytical or explanatory
and
Predictive –aims to generalise from the analysis by
predicting certain phenomenon on a basis of
hypothesised, general relationships.
Veal
(2005,p.4-5)
Descriptive, Explanatory, Exploratory and
Evaluative- arises from the need to make judgements on
the success or effectiveness of policies practices,
strategies or programs.

353
Appendix 6.3: Mixed method research design
Author Types Definition
Creswell
and Clarke
(2011, p.73)
Convergent Design Concurrent quantitative and
qualitative data collection,
separate quantitative and
qualitative analysis, and the
merging of the two data sets.
Explanatory Design Methods implemented
sequentially, starting with
quantitative data collection and
analysis followed by qualitative
data collection and qualitative data
collection and analysis.
Exploratory Design Methods implemented
sequentially, starting with
qualitative data collection and
analysis followed by quantitative
data collection and analysis.
Embedded Design Either the concurrent or sequential
collection of supporting data with
separate data analysis or the use of
the supporting data before, during,
or after the major data collection
procedure.
Transformative Design Framing the concurrent or
sequential collection and analysis
of quantitative and qualitative data
sets within a transformative,
theoretical framework that guides
the methods decision.
Multiphase Design Combining the concurrent and/or
sequential collection of
quantitative and qualitative data
sets over multiple phases of a
program of study.
Teddlie and
Tashakkori
(2009)
Concurrent/parallel/simultaneous
Sequential Design
Similar to Convergent design
Explanatory or exploratory design
Creswell
(2003) Transformative
Concurrent
Sequential
‘In transformative procedure
researcher uses a theoretical lens
as an overarching perspective
within a design that contains both
qualitative and quantitative
data…..this lens could be a data
collection method that involves a
sequential and concurrent
approach’ (p.16).

354
Appendix 6.4: Interview protocol
Section A: Introduction
This section requires you to complete some basic background information about
yourself. Please circle the appropriate option
1. Your gender is
a. Male
b. Female
2. What is your age group
a. 25-35
b. 36-45
c. 46-55
d. 56-65
3. What is your level of education
a. Up to College
b. Bachelor Degree or equivalent
c. Postgraduate (Masters) Degree or equivalent
d. Professional course; such as ACMA, CA, ACCA
e. PhD
4. Number of years worked for/in Banks
a. Less than 1 year
b. 1-5 years
c. 6-10 years
d. 11-15 years
e. 15-20 years
f. More than 20 years

355
Section B
Regulators and financial experts
A. Are current corporate risk management practices effective at assessing risk?
To what extent the risk disclosures items are effective in practice for banks in
Bangladesh?
B. Do you have any comments on the proposed risk disclosure guideline?
C. Did the Global Financial Crisis (GFC) of 2007-2008 uncover weaknesses in
governance mechanism in banking sector of Bangladesh?
D. Did GFC of 2007-2008 uncover inadequacy of corporate risk disclosure in
banking sector of Bangladesh?
E. Does corporate governance have an impact on risk disclosures practices in
the banking sector in Bangladesh?
F. Did the GFC have an impact on banking sector in Bangladesh? In the light of
financial crisis what regulatory changes you suggest for the banking sector in
Bangladesh?
G. How should banks be intensified to implement effective risk management
frameworks? Is more prescriptive regulation or any other alternatives? (i.e.
improved disclosure, changing corporate governance, enhanced rating
methodologies etc)
H. Do you have any other comments?
Thank you for your Time

356
Appendix 6.5: Consent form
INTERVIEW PARTICIPANT INFORMATION AND CONSENT FORM (PICF)
Thesis Title: Risk Disclosures Practices, Corporate Governance and Bank’s Performance: Evidence
from a developing country
Investigator(s): Dr Mohammad Azim Dr Ron Kluvers Shamsun Nahar
Project Interests
This research is to investigate the possible link between the governance mechanism and
level of risk disclosures practices in banking sector and their effect on performance. The
interview will examine the degree of compliance of banks with their commendation of
code of corporate governance, risk disclosure practice and the performance of banks in
pre-recession to post recession period. Data from this research will identify the drivers
of corporate risk reporting best practices by banks in Bangladesh and establish firm
specific or corporate governance characteristics that are related to the risk reporting and
also the impact of risk reporting on bank’s performance.
What participation will involve?
Participation in the project is completely anonymous and voluntary. It should take
participants approximately 30-45 minutes complete the interview. Participants who
agree to participate in the interview will be required to sign a consent form attached.
Research Output:
The data gathered will be used for this thesis and will be used to develop conference
papers for academic journals. The researcher will be the only person to have access to
your responses. Participants will not be identified in the analysis or subsequent
publications.
Further information about the project
Should you require any further information about this project please do not hesitate to
contact us
Shamsun Nahar, PhD student
Email : [email protected] ph: (+61) 3 92145247
Dr Mohammad Azim
Email: [email protected] ph: (+61) 3 92144500
Dr Ron Kluvers
Email: [email protected] ph: (+61) 3 92148435

357
Informed consent to participate in research:
Please read and sign
1. I consent to participate in the project named above. I have been provided a copy of
the project consent information statement to which this consent form relates and any
questions I have asked have been answered to my satisfaction.
2. In relation to this project, please circle your response to the following:
I agree to be interviewed by the researcher Yes No
I agree to allow the interview to be recorded by electronic device Yes No
I agree to make myself available for further information if required Yes No
I agree to complete questionnaires asking me about
[insert topic(s)] Yes No
3. I acknowledge that:
(a) my participation is voluntary and that I am free to withdraw from the project at
any time without explanation;
(b) the Swinburne project is for the purpose of research and not for profit;
(c) any identifiable information about me which is gathered in the course of and as
the result of my participating in this project will be (i) collected and retained for
the purpose of this project and (ii) accessed and analysed by the researcher(s) for
the purpose of conducting this project;
(d) my anonymity is preserved and I will not be identified in publications or
otherwise without my express written consent.
By signing this document I agree to participate in this project.
Name of Participant: …………………………………………
Signature & Date: ……………………………………………

358
Appendix 6.6 : Ethics Approval Letter
Dear Shamsun,
Your response was forwarded to a delegate and the following feedback has been
received. Your application has bee approved except for the following further
amendments to be made:
5. Appendix 5, Organisational Informed Consent Form:
1, second dot point - please redraft this statement for better effect as follows -
Instead of “I agree that s/he can be interviewed by the researcher” replace with
words along the lines of ”I agree for my employees to be interviewed for this project”
Your response to C9 needs revisions as follows:
3. C9:
(i) Interviews need to take place in a business location
(ii) Please explain the arrangements to be put in place to ensure safety of student
researcher;
As you have stated that the interviews will take place in a business location this has
satisfied the Subcommittee’s concern on this matter more the most part, however,
1. the delegate suggests you may wish also to ensure that a supervisor is informed
about times and locations of the interviews as a further safety measure. This
should, therefore, be included in this paragraph.
2. Please also delete the remaining sentences as it is not about your safety in your
office at Swinburne which you were asked to address.
Please amend C9 as outlined about and send me the revised Consent Form for my file. I
will then be able to issue the clearance.
Regards
Kaye
From: Shamsun Nahar
Sent: Tuesday, 29 January 2013 12:04 PM
To: Kaye Goldenberg
Subject: SUHREC Project 2012/270 Ethical Review of Resubmtted Protocol
Dear Kaye
The concern has been revised. Please find the attachments.
Thanks and Kind regards
Shamsun
PhD candidate
Faculty of Business Enterprise
AGSE building, level 3
Room 340,ph-92145247

359
From: Kaye Goldenberg
Sent: Friday, 25 January 2013 4:52 PM
To: Mohammad Azim; Shamsun Nahar
Subject: SUHREC Project 2012/270 Ethical Review of Resubmtted Protocol
To: Dr Mohammad Azim, Design/ Ms Shamsun Nahar
Dear Dr Azim,
SUHREC Project 2012/270 Risk Disclosure Practices, Corporate Governance and
Bank’s Performance: Evidence from Bangladesh Proposed Duration From: 10/01/2013
Proposed Duration To: 30/07/2015
Ethical review of the above project protocol as resubmitted/revised, was undertaken on
behalf of Swinburne's Human Research Ethics Committee (SUHREC) by a SUHREC
Subcommittee (SHESC1) at a meeting held 18 January 2013, the outcome of which as
follows.
The project has been approved subject to the following being addressed to the Chair (or
delegate's) approval:
1. C2:
(i) Please provide more information on the recruitment procedures, for instance, who
will participants contact regarding arranging the interviews?
a) Please also explain in detail how recruitment will be carried out within the
organisation;
(ii) Please explain the relevance of the first sentence of the second last paragraph, in
particular, who are the “regulators and educators’?;
2. C4: It is unnecessary to tick the second box. Please uncheck;
3. C9:
(i) Interviews need to take place in a business location
(ii) Please explain the arrangements to be put in place to ensure safety of student
researcher;
4. Interview Agenda, Section B,
(i) Question A: Suggest amending first sentence as follows – “To what extent are
current….”
a) Amend second sentence to clarify meaning.
(ii) Question F: Please clarify what is meant by ‘intensified’ in this context? Should the
word be ‘encouraged’?
5. Appendix 5, Organisational Informed Consent Form: As the Subcommittee felt that it
was not appropriate to reveal the identity of the employees it is recommended that the
form be redrafted by -
(i) removing the reference to the name of the individual employee in Section 1 and
(ii) using only a blanket reference to employees in Section 2,
Re your responses:
- please DO NOT submit a full revised ethics clearance application unless specifically
required
- queried, missing, additional or revised text from the ethics application can be
incorporated into your responses (within the body of the email if appropriate and to save

360
disk space)
- attach proposed or revised consent/publicity/other instruments in light of the above (if
available, converting these documents to pdf before submission will disk space)
If accepted by the SUHREC or Subcommittee delegate(s), your responses/attachments
will be added to previous documentation submitted for review, superseding or
supplementing the existing material/protocol on record. Please also note that human
research activity (including active participant recruitment) cannot commence before
proper ethics clearance is given in writing.
Please contact me if you have any queries about the ethical review process undertaken.
The SUHREC project number should be quoted in communication.
Yours sincerely
Kaye Goldenberg
Secretary, SHESC1
*******************************************
Kaye Goldenberg Administrative Officer (Research Ethics)
Swinburne Research (H68)
(Mon, Tues, alt.Thurs. Fri.) Swinburne University of Technology
Level 1, SPS, 24 Wakefield Street
Hawthorn, VIC 3122
Tel: +61 3 9214 8468
Fax: +61 3 9214 5267

361
Appendix 7.1 Tukey HSD: RDI by year
Year
Sig.
I
J
2006
2007 2008 2009 2010 2011 2012
2006 0.641
2007
0.641
0.971 0.008*** .000** .000** .000**
2008
0.971 0.971 0.077*** .000** .000** .000**
2009
0.008*** 0.008*** 0.077*** 0.117 0.001** .000**
2010
.000** .000** .000** 0.117 0.639 0.458
2011
.000** .000** .000** 0.001** 0.639
1.00
2012
.000** .000** .000** .000** 0.458 1.00
***, **, and * denote the level of significance at 1%, 5% and 10%, respectively.

362
Appendix 7.2: Eta Squared
The guideline proposed by Cohen (1988, pp. 284-7 for interpreting the values is
.01= small effect, .06= moderate effect, .14= large effect
t t^2 N Eta squared=
T^2/T^+(N-1)
Effect
-2.706 7.322 30 0.201 Large effect
-5.732 32.855 30 0.531 Large effect
-2.921 8.532 30 0.227 Large effect

363
Appendix 9.1: Post Hoc Tukey P value
DE TA RMU BS BI ACI ML RC Age
Dependent
Variable
(I)
Year
(J)
Year
Sig.
2006 2007 1.00 0.27 0.62 0.77 0.81 1.00 1.00 0.83 0.75
2008 1.00 0.86 0.00 0.97 0.87 0.20 1.00 0.28 0.99
2009 0.98 0.24 0.00 0.77 1.00 0.11 1.00 0.01 0.86
2010 1.00 0.01 0.00 0.80 0.97 0.07 1.00 0.00 0.53
2011 0.82 0.00 0.00 0.58 0.38 0.04 1.00 0.00 0.37
2012 0.96 0.00 0.00 0.28 0.66 0.15 1.00 0.00 0.43
2007 2006 1.00 0.27 0.62 0.77 0.81 1.00 1.00 0.83 0.75
2008 1.00 0.36 0.72 0.97 0.91 1.00 1.00 0.93 0.98
2009 1.00 0.03 0.00 0.60 0.26 0.27 1.00 0.03 0.78
2010 0.96 0.00 0.00 0.28 0.66 0.15 1.00 0.00 0.43
2011 1.00 0.00 0.00 0.31 0.47 0.10 1.00 0.00 0.16
2012 0.73 0.00 0.00 0.15 0.04 0.05 1.00 0.00 0.09
2008 2006 1.00 0.27 0.62 0.77 0.81 1.00 1.00 0.83 0.75
2007 1.00 0.36 0.72 0.97 0.91 1.00 1.00 0.93 0.98

364
2009 1.00 0.86 0.00 0.97 0.87 0.20 1.00 0.28 0.99
2010 0.98 0.24 0.00 0.77 1.00 0.11 1.00 0.01 0.86
2011 1.00 0.01 0.00 0.80 0.97 0.07 1.00 0.00 0.53
2012 0.82 0.00 0.00 0.58 0.38 0.04 1.00 0.00 0.37
2009 2006 1.00 0.27 0.62 0.77 0.81 1.00 1.00 0.83 0.75
2007 1.00 0.03 0.00 0.60 0.26 0.27 1.00 0.03 0.78
2008 1.00 0.86 0.00 0.97 0.87 0.20 1.00 0.28 0.99
2010 1.00 0.90 0.90 1.00 0.99 1.00 1.00 0.67 0.99
2011 1.00 0.13 0.90 1.00 1.00 1.00 1.00 0.14 0.88
2012 0.94 0.05 0.90 0.96 0.96 0.98 1.00 0.07 0.76
2010 2006 1.00 0.27 0.62 0.77 0.81 1.00 1.00 0.83 0.75
2007 0.96 0.00 0.00 0.28 0.66 0.15 1.00 0.00 0.43
2008 0.98 0.24 0.00 0.77 1.00 0.11 1.00 0.01 0.86
2009 1.00 0.90 0.90 1.00 0.99 1.00 1.00 0.67 0.99
2011 0.99 0.71 1.00 1.00 1.00 1.00 1.00 0.93 0.99
2012 0.99 0.48 1.00 1.00 0.69 1.00 1.00 0.80 0.97
2011 2006 1.00 0.27 0.62 0.77 0.81 1.00 1.00 0.83 0.75

365
2007 1.00 0.00 0.00 0.31 0.47 0.10 1.00 0.00 0.16
2008 1.00 0.01 0.00 0.80 0.97 0.07 1.00 0.00 0.53
2009 1.00 0.13 0.90 1.00 1.00 1.00 1.00 0.14 0.88
2010 0.99 0.71 1.00 1.00 1.00 1.00 1.00 0.93 0.99
2012 0.87 1.00 1.00 1.00 0.85 1.00 1.00 1.00 1.00
2012 2006 1.00 0.27 0.62 0.77 0.81 1.00 1.00 0.83 0.75
2007 0.73 0.00 0.00 0.15 0.04 0.05 1.00 0.00 0.09
2008 0.82 0.00 0.00 0.58 0.38 0.04 1.00 0.00 0.37
2009 0.94 0.05 0.90 0.96 0.96 0.98 1.00 0.07 0.76
2010 0.99 0.48 1.00 1.00 0.69 1.00 1.00 0.80 0.97
2011 0.87 1.00 1.00 1.00 0.85 1.00 1.00 1.00 1.00

366
Appendix 9.2: Eta Squared
Formula ML RMU Effect*
=.0384
= .3137
.01= small effect
.06=moderate
effect
.14= large effect
Small effect Large effect
*guidelines proposed by Cohen 1988, pp. 284-7
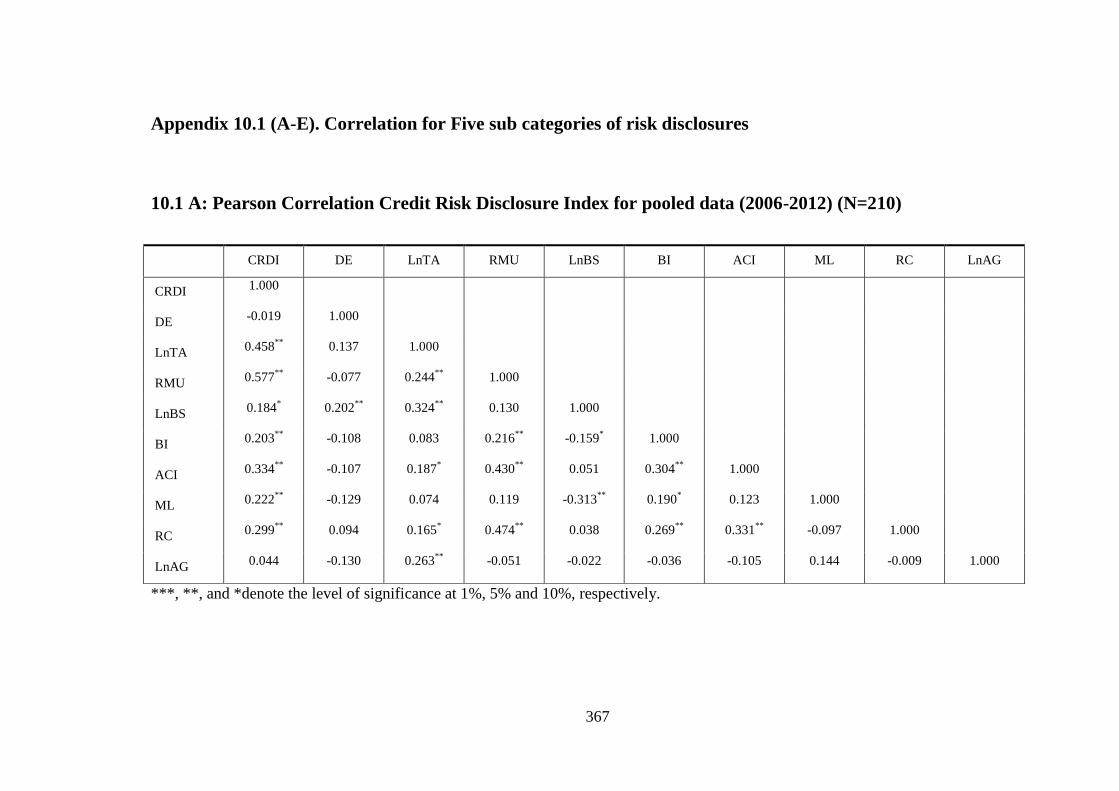
367
Appendix 10.1 (A-E). Correlation for Five sub categories of risk disclosures
10.1 A: Pearson Correlation Credit Risk Disclosure Index for pooled data (2006-2012) (N=210)
***, **, and *denote the level of significance at 1%, 5% and 10%, respectively.
CRDI DE LnTA RMU LnBS BI ACI ML RC LnAG
CRDI 1.000
DE -0.019 1.000
LnTA 0.458
** 0.137 1.000
RMU 0.577
** -0.077 0.244
** 1.000
LnBS 0.184
* 0.202
** 0.324
** 0.130 1.000
BI 0.203
** -0.108 0.083 0.216
** -0.159
* 1.000
ACI 0.334
** -0.107 0.187
* 0.430
** 0.051 0.304
** 1.000
ML 0.222
** -0.129 0.074 0.119 -0.313
** 0.190
* 0.123 1.000
RC 0.299
** 0.094 0.165
* 0.474
** 0.038 0.269
** 0.331
** -0.097 1.000
LnAG 0.044 -0.130 0.263
** -0.051 -0.022 -0.036 -0.105 0.144 -0.009 1.000

368
10.1 B: Pearson Correlation Liquidity Risk Disclosure Index for pooled data (2006-2012) (N=210)
LRDI DE LnTA RMU LnBS BI ACI ML RC LnAG
LRDI 1.000
DE 0.032 1.000
LnTA 0.373
** 0.137 1.000
RMU 0.365
** -0.077 0.244
** 1.000
LnBS 0.108 0.202
** 0.324
** 0.130 1.000
BI 0.333
** -0.108 0.083 0.216
** -0.159
* 1.000
ACI 0.295
** -0.107 0.187
* 0.430
** 0.051 0.304
** 1.000
ML 0.220
** -0.129 0.074 0.119 -0.313
** 0.190
* 0.123 1.000
RC 0.322
** 0.094 0.165
* 0.474
** 0.038 0.269
** 0.331
** -0.097 1.000
LnAG 0.291
** -0.130 0.263
** -0.051 -0.022 -0.036 -0.105 0.144 -0.009 1.000
***, **, and * denote the level of significance at 1%, 5% and 10%, respectively.

369
10.1 C: Pearson Correlation Market Risk Disclosure Index for pooled data (2006-2012) (N=210)
MRDI DE LnTA RMU LnBS BI ACI ML RC LnAG
MRDI 1.000
DE 0.014 1.000
LnTA 0.375
** 0.137 1.000
RMU 0.568
** -0.077 0.244
** 1.000
LnBS 0.147
* 0.202
** 0.324
** 0.130 1.000
BI 0.131 -0.108 0.083 0.216
** -0.159
* 1.000
ACI 0.328
** -0.107 0.187
* 0.430
** 0.051 0.304
** 1.000
ML 0.145 -0.129 0.074 0.119 -0.313
** 0.190
* 0.123 1.000
RC 0.356
** 0.094 0.165
* 0.474
** 0.038 0.269
** 0.331
** -0.097 1.000
LnAG 0.056 -0.130 0.263
** -0.051 -0.022 -0.036 -0.105 0.144 -0.009 1.000
***, **, and *denote the level of significance at 1%, 5% and 10%, respectively.

370
10.1 D: Pearson Correlation Operational Risk Disclosure Index for pooled data (2006-2012) (N=210)
ORDI DE LnTA RMU LnBS BI ACI ML RC LnAG
ORDI 1.000
DE 0.001 1.000
LnTA 0.120 0.137 1.000
RMU 0.069 -0.077 0.244** 1.000
LnBS 0.102 .202** 0.324** 0.130 1.000
BI -0.078 -0.108 0.083 0.216** -0.159* 1.000
ACI -0.069 -0.107 0.187* 0.430** 0.051 0.304** 1.000
ML -0.133 -0.129 0.074 0.119 -0.313** 0.190* 0.123 1.000
RC -0.043 0.094 0.165* 0.474** 0.038 0.269** .331** -0.097 1.000
LnAG 0.027 -0.130 0.263** -0.051 -0.022 -0.036 -0.105 0.144 -0.009 1.000
***, **, and * denote the level of significance at 1%, 5% and 10%, respectively.

371
10.1 E: Pearson Correlation Equities Risk Disclosure Index for pooled data (2006-2012) (N=210)
ERDI DE LnTA RMU LnBS BI ACI ML RC LnAG
ERDI 1.000
DE -0.004 1.000
LnTA 0.372
** 0.137 1.000
RMU 0.379
** -0.077 .244
** 1.000
LnBS 0.056 0.202
** .324
** 0.130 1.000
BI 0.296
** -0.108 0.083 0.216
** -0.159
* 1.000
ACI 0.325
** -0.107 0.187
* 0.430
** 0.051 0.304
** 1.000
ML 0.157
* -0.129 0.074 0.119 -0.313
** 0.190
* 0.123 1.000
RC 0.313
** 0.094 0.165
* 0.474
** 0.038 0.269
** 0.331
** -0.097 1.000
LnAG 0.122 -0.042 -0.239
** 0.041 -0.092 0.159
* 0.102 0.040 0.084
DE 0.117 -0.130 0.263
** -0.051 -0.022 -0.036 -0.105 0.144 -0.009 1.000
***, **, and * denote the level of significance at 1%, 5% and 10%, respectively.

372
Appendix 10.2: Pearson correlations change Risk Disclosure Index (RDI) 2006 and 2008 (N=60)
Change
RDI
2006_2008
Change
BI
2006_2008
Change
ACI
2006_2008
Change
RC
2006_2008
Change
DE
2006_2008
Change
LnTA
2006_2008
Change
RMU
2006_2008
Change
LnBS
2006_2008
Change
ML
2006_2008
Change
LnAG
2006_2008
Change RDI 2006_2008 1.000
Change BI 2006_2008 -0.074 1.000
Change ACI 2006_2008 0.007 0.081 1.000
Change RC 2006_2008 0.061 -0.030 0.018 1.000
Change DE 2006_2008 -0.013 -0.332** -0.205* 0.095 1.000
Change LnTA 2006_2008 -0.068 0.142 -0.085 -0.141 0.001 1.000
Change RMU 2006_2008 0.061 0.062 0.308** 0.311** -0.034 -0.099 1.000
Change LnBS 2006_2008 0.144 -0.057 0.229** -0.003 0.029 0.033 0.075 1.000
Change ML 2006_2008 -0.150 0.052 0.115 -0.036 0.009 0.211** -0.059 -0.142 1.000
Change LnAG 2006_2008 0.043 0.001 -0.011 -0.124 0.016 0.158 -0.075 0.099 0.021 1.000
***, **, and *denote the level of significance at 1%, 5% and 10%, respectively.
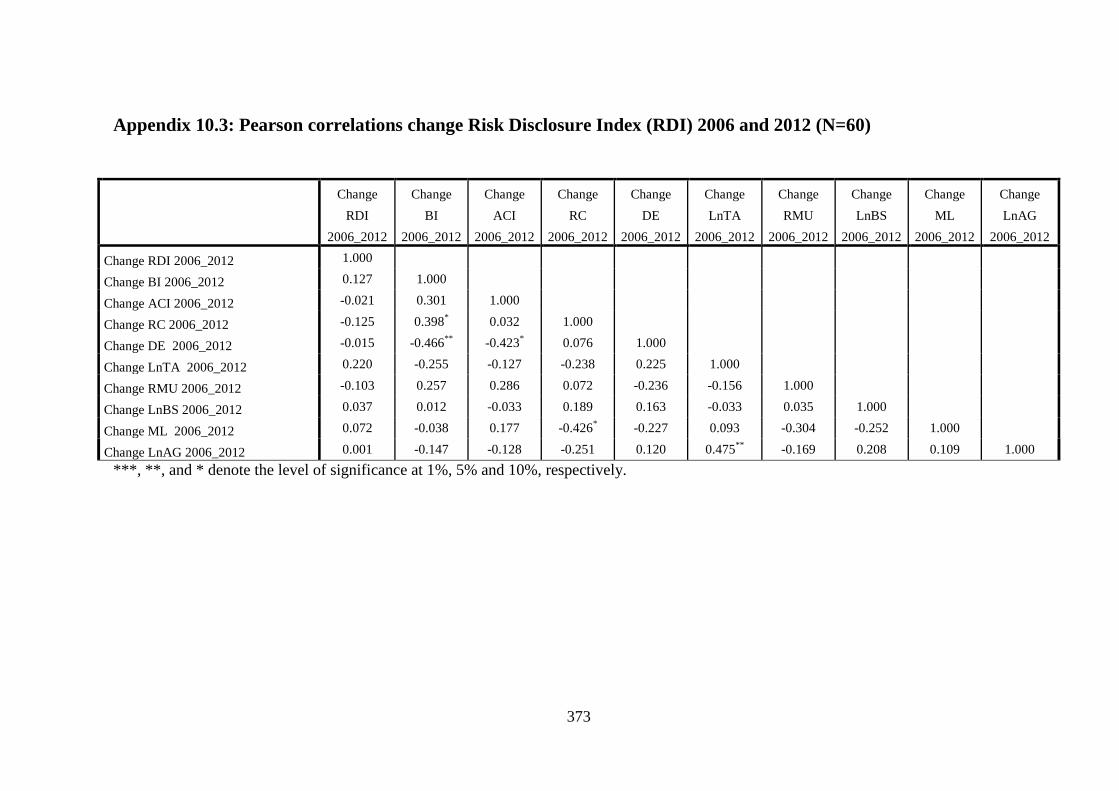
373
Appendix 10.3: Pearson correlations change Risk Disclosure Index (RDI) 2006 and 2012 (N=60)
Change
RDI
2006_2012
Change
BI
2006_2012
Change
ACI
2006_2012
Change
RC
2006_2012
Change
DE
2006_2012
Change
LnTA
2006_2012
Change
RMU
2006_2012
Change
LnBS
2006_2012
Change
ML
2006_2012
Change
LnAG
2006_2012
Change RDI 2006_2012 1.000
Change BI 2006_2012 0.127 1.000
Change ACI 2006_2012 -0.021 0.301 1.000
Change RC 2006_2012 -0.125 0.398* 0.032 1.000
Change DE 2006_2012 -0.015 -0.466**
-0.423* 0.076 1.000
Change LnTA 2006_2012 0.220 -0.255 -0.127 -0.238 0.225 1.000
Change RMU 2006_2012 -0.103 0.257 0.286 0.072 -0.236 -0.156 1.000
Change LnBS 2006_2012 0.037 0.012 -0.033 0.189 0.163 -0.033 0.035 1.000
Change ML 2006_2012 0.072 -0.038 0.177 -0.426* -0.227 0.093 -0.304 -0.252 1.000
Change LnAG 2006_2012 0.001 -0.147 -0.128 -0.251 0.120 0.475**
-0.169 0.208 0.109 1.000
***, **, and * denote the level of significance at 1%, 5% and 10%, respectively.

374
Appendix 10.4: Pearson correlations change Risk Disclosure Index (RDI) 2006 and 2010 (N=60)
Change
RDI
2006_2010
Change
BI
2006_2010
Change
ACI
2006_2010
Change
RC
2006_2010
Change
DE
2006_2010
Change
LnTA
2006_2010
Change
RMU
2006_2010
Change
LnBS
2006_2010
Change
ML
2006_2010
Change
LnAG
2006_2010
Change RDI 2006_2010 1.000
Change BI 2006_2010 0.073 1.000
Change ACI 2006_2010 -0.050 0.145 1.000
Change RC 2006_2010 -0.092 0.073 -0.105 1.000
Change DE 2006_2010 0.083 -.378**
-0.269* 0.227
* 1.000
Change LnTA 2006_2010 0.038 -0.107 -0.088 -0.268* -0.101 1.000
Change RMU 2006_2010 -0.144 0.226* 0.232
* 0.236
* -0.033 -0.245
* 1.000
Change LnBS 2006_2010 0.103 -0.182 0.065 0.068 0.087 -0.078 0.091 1.000
Change ML 2006_2010 -0.016 0.001 0.152 -0.311**
-0.215* 0.265
* -0.270
** -0.232
* 1.000
Change LnAG 2006_2010 0.097 -0.061 -0.102 -0.232* 0.018 0.387
** -0.259
* 0.164 0.067 1.000
***, **, and * denote the level of significance at 1%, 5% and 10%, respectively.

375
Appendix 10.5: Pearson correlations change Risk Disclosure Index (RDI) 2010 and 2012 (N=60)
Change
RDI
2010_2012
Change
BI
2010_2012
Change
ACI
2010_2012
Change
RC
2010_2012
Change
DE
2010_2012
Change
LnTA
2010_2012
Change
RMU
2010_2012
Change
LnBS
2010_2012
Change
ML
2010_2012
Change
LnAG
2010_2012
Change RDI 2010_2012 1.000
Change BI 2010_2012 0.117 1.000
Change ACI 2010_2012 -0.011 0.201 1.000
Change RC 2010_2012 -0.124 0.328 0.142 1.000
Change DE 2010_2012 -0.011 -0.366 -0.223 0.176 1.000
Change LnTA 2010_2012 0.120 -0.455 -0.1257 -0.258 0.225 1.000
Change RMU 2010_2012 -0.143 0.247 0.246 0.452 -0.236 -0.156 1.000
Change LnBS 2010_2012 0.047 0.112 0.253 -0.450 0.164 -0.033 0.035 1.000
Change ML 2010_2012 0.072 -0.038 0.257 -0.436 -0.227 0.093 -0.304 -0.252 1.000
Change LnAG 2010_2012 0.001 0.001 -0.167 -0.148 -0.251 0.120 0.475 -0.169 0.208 1.000
***, **, and * denote the level of significance at 1%, 5% and 10%, respectively

376