sfr in the x-ray luminous z ~ 0.9 cluster · sfr in the x-ray luminous z ~ 0.9 cluster m. p. ulmer...

1
SFR in the X-ray Luminous z ~ 0.9 cluster M. P. Ulmer 1,2 , C. Adami 2 , F. Durret 3 , G. Lima Neto 4 , O. Ilbert 2 , R. Gavazzi 3 , E. Cypriano 4 , W. Mohoney 5 1 Northwestern University 2 Laboratoire dAstrophysique de Marseille, 4 Institut dAstrophysique de Paris, 5 Instituto Astronomico e Geofisico, 4, Universidade de São Paulo, 5 Cal Tech Figs. 1 a, Color image based on Spitzer IRAC 3.6 μm (R), Gemini z (G) and Gemini i ( B) image. XMM contours in the 0.3-6 keV interval are superimposed in yellow. Green circles are galaxies that are spectroscopically associated with the cluster. The pink and blue circles indicate galaxies in the two sub-clusters detected by the Serna & Gerbal (1996) method. Big and small white circles indicate the presence or absence of [OII] emission: no white circles = no [OII], small white circles = [OII] smaller than 2 times the noise, large white circles = [OII] stronger than 2 times the noise. North is up and East to the left; a concordant cosmology is assumed, thus 463 kpc = 1 arcmin at the redshift of Cl 1257+4738 z=0.866. The white x marks the approximate cluster center based on the centroid of the X-ray emission. For Fig 1b, the MIPS24 > 5σ detections of cluster members are in the small green circles. The large ~ 1.34 arc min radius circle is the virial radius = 640 kpc. Discussion: Cl157+47 at z = 0.866 is one of the highest redshift clusters with a richness of multi-wavelength data spanning the X-ray to the mid IR. The cluster is dynamically young based on the X-ray emission contours and the position kT vs L X . And the bi-modal galaxy distribution. OII is detected in only a handful of the the lower SFR members, which leads us to speculate that the higher SFR (higher MIPS24 flux) galaxies have the OII attenuated by dust. Thus, OII is not a good tracer of SFR at redshifts near 0.9 where the galaxies are likely red but not dead. The SFR tends to increases with increasing cluster centric distance, but the SSFR shows no clear trend. Perhaps the total stellar mass is reduced (via ram pressure stripping or galaxy-galaxy interactions) such that the SFR will be higher in lower density regions versus the SSRF, which depends on the total galaxy stellar mass as well as the SFR. Many of the higher SFR galaxies have line of sight velocities of 1,000 km s -1 . The property of a higher SFR suggests these galaxies have not yet passed through the cluster core, but then their relatively high velocity must be explained. We suggest that the cluster is so young that galaxies are just infalling along several different cold dark matter filaments whose crossings form the cluster center . Introduction: The cluster Cl 1257+4738 was found by comparing a ROSAT image with red ground based images to pick out red galaxies from foreground bluer ones. Our study adds another cluster to the handful of clusters with z 0.9 . Each cluster provides new insights as to the relationship between the evolution of galaxies and the ICM. We acquired Chandra, XMM-Newton, Spitzer IRAC plus MIPS24 data to study this relationship between galaxies and the ICM. In this work we concentrate on using the Spitzer data to make a measure of star formation rates (SFRs) and specific star formation rates (SSFRs) as function of distance from the cluster center. The deep Spitzer observations of 2,000 seconds in IRAC1-4 plus MIPS24, plus Gemini spectra enabled us to cover a range of SFRs and SSFRs of ~ 100 for spectroscopically confirmed cluster members. Fig 2. L X versus kT for low redshift clusters from Ota et al. 2006, plus our data point shown as a light blue cross. Fig. 3 Star formation rate (SFR) versus distance from the cluster center; diamonds > 2σ OII detected, triangle < 2σ OII; square “outlier.” See also Fig 1 Fig 4 Approximate specific SFR (SSFR) based on IRAC1 and preliminary SED fits versus the distance from the cluster center . Fig. 5 SFR versus line of sight velocity, symbols mean the same as in Fig 3 Summary and Conclusions: We have found a 6E14 M X-ray bright cluster of galaxies at z = 0.866 that is still in the process of formation due to its bi-modal structure and X-ray emission properties. The cluster is spectroscopically confirmed with the mass determined through the velocity dispersion of the cluster members. Star-forming galaxies appear to be offset in velocity from the cluster redshift by up to 1,000 km/s indicating that the cluster is being built up by galaxies infalling along filaments. Although the SFR in the cluster members increases with increasing projected distance, the SSFR approximately constant as a function of distance. Thus, it is likely that the cluster is a newly (less that one galaxy crossing time of ~ 1 Gyr) formed mass concentration located at the crossing of dark matter filaments. Therefore models of hierarchical CDM large scale structure formation should accommodate cluster formation as late as about z ~0. 9 with massive (1E11M ) galaxies that are red but not dead. This work was supported in part by NASA grants GO7-8144X//NAS8-03060 (Chandra), NNX07AF01G (XMM-Newton), and NMO710076 (Spitzer). MPU thanks LAM for hospitality during a portion of his work on this project. F.D. and G.B.L.N. acknowledge financial support from the CAPES/COFECUB. MPU thanks R. Chary for useful comments and code regarding SFRs and SSFRs, but any errors herein are the sole responsibility of MPU. References: Ota, N 2006, ApJ, 640, 673, Patel et al, 2009, ApJL, 705 L67. Serna A. & Gerbal D., 1996, A&A 309, 65, Temporin et al, 2009 Astro Nach, 330,915 Fig. 6 Histogram of total L IR (1-1000 Microns) in L Note that 10 11 and above is classified as a LIRG. b X a X 1 arc min

Upload: others

Post on 02-Jun-2020

4 views

Category:

Documents


0 download

TRANSCRIPT

SFR in the X-ray Luminous z ~ 0.9 cluster M. P. Ulmer1,2, C. Adami2, F. Durret3, G. Lima Neto4, O. Ilbert2, R. Gavazzi3, E. Cypriano4, W. Mohoney5 1 Northwestern University 2 Laboratoire d’Astrophysique de Marseille, 4 Institut d’Astrophysique de Paris, 5 Instituto Astronomico e Geofisico, 4, Universidade de São Paulo, 5 Cal Tech

Figs. 1 a, Color image based on Spitzer IRAC 3.6 µm (R), Gemini z (G) and Gemini i ( B) image. XMM contours in the 0.3-6 keV interval are superimposed in yellow. Green circles are galaxies that are spectroscopically associated with the cluster. The pink and blue circles indicate galaxies in the two sub-clusters detected by the Serna & Gerbal (1996) method. Big and small white circles indicate the presence or absence of [OII] emission: no white circles = no [OII], small white circles = [OII] smaller than 2 times the noise, large white circles = [OII] stronger than 2 times the noise. North is up and East to the left; a concordant cosmology is assumed, thus 463 kpc = 1 arcmin at the redshift of Cl 1257+4738 z=0.866. The white x marks the approximate cluster center based on the centroid of the X-ray emission. For Fig 1b, the MIPS24 > 5σ detections of cluster members are in the small green circles. The large ~ 1.34 arc min radius circle is the virial radius = 640 kpc.

Discussion:   Cl157+47 at z = 0.866 is one of the highest redshift clusters with a richness of multi-wavelength data spanning the X-ray to the mid IR.   The cluster is dynamically young based on the X-ray emission contours and the position kT vs LX. And the bi-modal galaxy distribution.   OII is detected in only a handful of the the lower SFR members, which leads us to speculate that the higher SFR (higher MIPS24 flux) galaxies have the OII attenuated by dust. Thus, OII is not a good

tracer of SFR at redshifts near 0.9 where the galaxies are likely red but not dead.   The SFR tends to increases with increasing cluster centric distance, but the SSFR shows no clear trend. Perhaps the total stellar mass is reduced (via ram pressure stripping or galaxy-galaxy

interactions) such that the SFR will be higher in lower density regions versus the SSRF, which depends on the total galaxy stellar mass as well as the SFR.   Many of the higher SFR galaxies have line of sight velocities of 1,000 km s-1. The property of a higher SFR suggests these galaxies have not yet passed through the cluster core, but then their relatively

high velocity must be explained. We suggest that the cluster is so young that galaxies are just infalling along several different cold dark matter filaments whose crossings form the cluster center .

Introduction: The cluster Cl 1257+4738 was found by comparing a ROSAT image with red ground based images to pick out red galaxies from foreground bluer ones. Our study adds another cluster to the handful of clusters with z ≥ 0.9 . Each cluster provides new insights as to the relationship between the evolution of galaxies and the ICM. We acquired Chandra, XMM-Newton, Spitzer IRAC plus MIPS24 data to study this relationship between galaxies and the ICM. In this work we concentrate on using the Spitzer data to make a measure of star formation rates (SFRs) and specific star formation rates (SSFRs) as function of distance from the cluster center. The deep Spitzer observations of 2,000 seconds in IRAC1-4 plus MIPS24, plus Gemini spectra enabled us to cover a range of SFRs and SSFRs of ~ 100 for spectroscopically confirmed cluster members.

Fig 2. LX versus kT for low redshift clusters from Ota et al. 2006, plus our data point shown as a light blue cross.

Fig. 3 Star formation rate (SFR) versus distance from the cluster center; diamonds > 2σ OII detected, triangle < 2σ OII; square “outlier.” See also Fig 1

Fig 4 Approximate specific SFR (SSFR) based on IRAC1 and preliminary SED fits versus the distance from the cluster center .

Fig. 5 SFR versus line of sight velocity, symbols mean the same as in Fig 3

Summary and Conclusions: We have found a 6E14 M X-ray bright cluster of galaxies at z = 0.866 that is still in the process of formation due to its bi-modal structure and X-ray emission properties. The cluster is spectroscopically confirmed with the mass determined through the velocity dispersion of the cluster members. Star-forming galaxies appear to be offset in velocity from the cluster redshift by up to 1,000 km/s indicating that the cluster is being built up by galaxies infalling along filaments. Although the SFR in the cluster members increases with increasing projected distance, the SSFR approximately constant as a function of distance. Thus, it is likely that the cluster is a newly (less that one galaxy crossing time of ~ 1 Gyr) formed mass concentration located at the crossing of dark matter filaments. Therefore models of hierarchical CDM large scale structure formation should accommodate cluster formation as late as about z ~0. 9 with massive (≥1E11M) galaxies that are red but not dead. This work was supported in part by NASA grants GO7-8144X//NAS8-03060 (Chandra), NNX07AF01G (XMM-Newton), and NMO710076 (Spitzer). MPU thanks LAM for hospitality during a portion of his work on this project. F.D. and G.B.L.N. acknowledge financial support from the CAPES/COFECUB. MPU thanks R. Chary for useful comments and code regarding SFRs and SSFRs, but any errors herein are the sole responsibility of MPU.

References: Ota, N 2006, ApJ, 640, 673, Patel et al, 2009, ApJL, 705 L67. Serna A. & Gerbal D., 1996, A&A 309, 65, Temporin et al, 2009 Astro Nach, 330,915

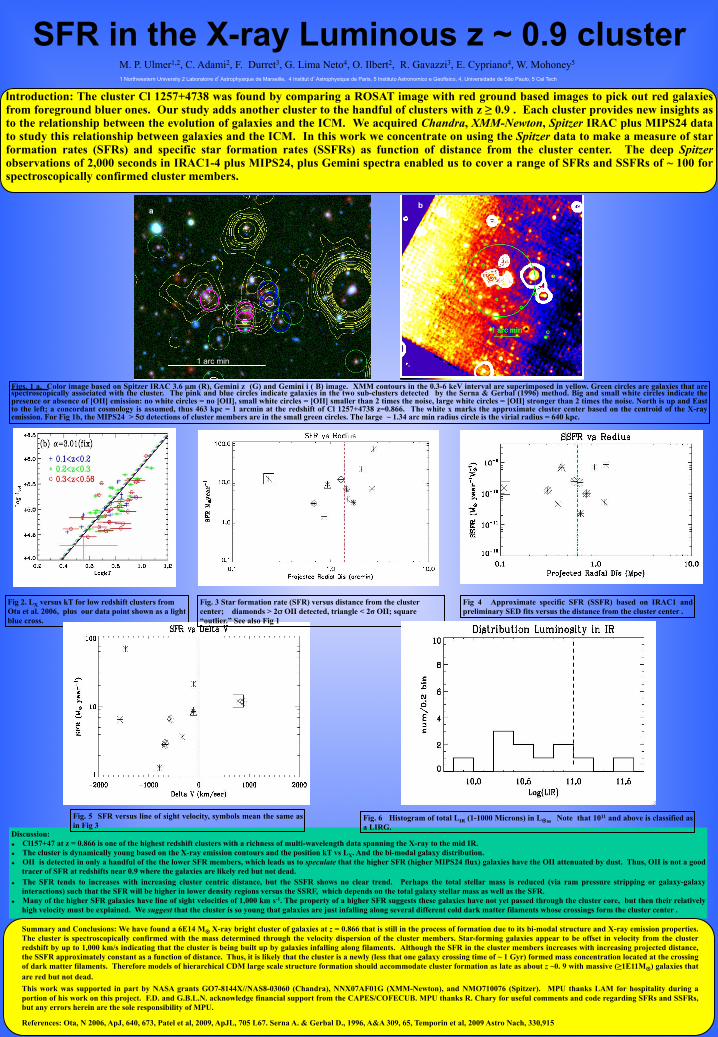
Fig. 6 Histogram of total LIR (1-1000 Microns) in L Note that 1011 and above is classified as a LIRG.

b

X

a

X

1 arc min