sfd promotion initiative agra india - down to earth
TRANSCRIPT

SFD Promotion Initiative
Agra India
Final Report
This SFD Report was created through desk-based research by Centre for Science and Environment (CSE)
as part of the SFD Promotion Initiative.
Date of production: 21/10/2015
Last update: 29/01/2016

Last Update: 29/01/2016
Agra
India Produced by:CSE SFD Report
SFD Report Agra, India, 2016
Produced by:
Suresh Kumar Rohilla, CSE Bhitush Luthra, CSE Rahul Sanka Varma, CSE Shantanu Kumar Padhi, CSE
©Copyright All SFD Promotion Initiative materials are freely available following the open-source concept for capacity development and non-profit use, so long as proper acknowledgement of the source is made when used. Users should always give credit in citations to the original author, source and copyright holder.
This Executive Summary and SFD Report are available from:
www.sfd.susana.org

Last Update: 29/01/2016 i
Agra
India
Produced by:CSE Executive Summary
1. The Diagram
2. Diagram information
Desk or field based:
This is a desk based SFD
Produced by:
Centre for Science and Environment (CSE), New Delhi
Accreditation status:
This is a draft SFD
Date of production:
21/10/2015
3. General city information
Agra, the former capital of India is a city on the banks of the river Yamuna in the state of Uttar Pradesh, India. It lies in Indo-Gangetic plain, 363 km west of state capital, Lucknow and 200 kilometres south from national capital, Delhi (MoUD, 2013). Agra is a major tourist destination because of its impressive Mughal-era monuments, specially the Taj Mahal. The population of city as per the Census 2011 is 1,574,542. The density of city is 11,167 persons per sq.km which is very high when compared to state average of 819 persons per sq.km. Total slum population is 533,554 which is 33% of the total population (Census of India, 2011). The floating population is reported as 0.3 million (AJS, 2015). The temperature varies from 47° C during peak summer to 3°C during the winter season. Municipal boundary has been chosen for the current study. It comprises of an area of 141 sq.km (MoUD, 2013).

Last Update: 29/01/2016 ii
Agra
India
Produced by:CSE Executive Summary
4. Service delivery context
In 2008, the Ministry of Urban Development (MoUD) issued the National Urban Sanitation Policy (NUSP). The policy aims to: raise awareness, promote behaviour change; achieve open defecation free cities; develop citywide sanitation plans; and provide 100% safe confinement, transport, treatment and disposal of human excreta and liquid wastes. The NUSP mandates states to develop state urban sanitation strategies and work with cities to develop City Sanitation Plans (CSPs). Furthermore, it explicitly states that cities and states must issue policies and technical solutions that address onsite sanitation, including the safe confinement of faecal sludge (USAID, 2010).
The objectives of NUSP are to be realized through CSPs and state sanitation strategies. As of now there are very few cities which have finalized their CSPs, and those plans are also not implemented. This remains a major drawback in implementation of NUSP.
The advisory note on septage management in urban India, issued by MoUD in 2013, recommends supplementing CSPs with Septage Management Sub-Plan (SMP). Still septage management in India is not prominent due to lack of knowledge, consideration of septage management as an interim solution, lack of sufficient funding and many other socio-political issues.
There are no specific legal provisions relating to septage management, but there are a number of provisions relating to sanitation services and environmental regulations, which majorly stems from, The Environment (Protection) Act, 1986 and the Water (Prevention and Control of Pollution) Acts. Municipal acts and regulations usually refer to management of solid and liquid wastes but may not provide detailed rules for septage management (MoUD, 2013).
5. Service outcomes
Overview on technologies and methods used for different sanitation systems through the sanitation service chain is as follows: Containment: There is sewerage network which covers half of the population. Rest of the city is majorly dependent on septic tanks which are generally not adhering to design prescribed by Bureau of Indian Standards (BIS). The effluent from the septic tank flows into open drains. A significant population of city practices open defecation.
Emptying: There are private emptiers in city with 20-25 vacuum tankers of 5000 litres capacity. The emptying fees ranges from INR 800- 4000 (12-65 USD) per trip (M Narendra 2015, pers. comm., 18 March). There are six government run vacuum tankers of 5000-6000 litres capacity. The emptying fee is INR 500 (7 USD) per trip (M Narendra 2015, pers. comm., 18 March). On an average each private vacuum tanker empties 30–50 septic tanks per month. Monsoon is the peak season for emptying. There are instances of manual emptying (M Narendra 2015, pers. comm., 18 March).
Transport: Vacuum tankers are generally tractor mounted, fabricated in local metallurgy workshops. Private emptiers discharge septage into nearest sewer/open drain/ open ground. Sewage is conveyed to Sewage Treatment Plants (STPs) through SPS (sewage pumping station). Households are connected to sewerage network but many areas are not covered with sub-main and trunk sewers, therefore the sewage flows into nullah (open drain) and is consequently intercepted by SPS to STPs.
Figure 1: Private Vacuum tankers (Source: Shantanu/CSE, 2015)
Treatment: There are 9 STPs with the treatment capacity of 221.25 MLD but only 135.75 MLD is reaching STPs. There are no separate treatment facilities for septage.
End-use/Disposal: 5 STPs run on Up-flow Anaerobic Sludge Blanket (UASB) technology and generate 42.57 m3/day of sludge cake. It is sold at INR 40/m3 (0.60 USD) to farmers. Treated sewage is disposed into Yamuna River. Untreated sewage, from open drains that are not intercepted flows into Yamuna River without treatment.

Last Update: 29/01/2016 iii
Agra
India
Produced by:CSE Executive Summary
Figure 2: Sludge drying bed - UASB technology 78 MLD STP in Dhandupura (Source: Rahul/CSE, 2015)
According to Census, around 47% of city is dependent on offsite systems, population connected to sewerage system is around 42%. User interface directly discharging in open drain and open ground is only 5%, it is estimated that wastewater lost in transportation is around 12% through sewers and 13% through open drains. Around 43% is treated at STPs and hence shown safe in SFD and 1% of wastewater goes untreated from STPs. 46% of the city is dependent on onsite sanitation systems (OSS), out of which 44% is dependent on septic tanks and 2% on pits. The public latrines are connected to septic tanks and hence are incorporated in onsite systems. Septic tanks are not contained as they are connected to open drains but pits are contained as ground water table is more than 10 mbgl. There is no clear differentiation between volume of effluent and septage generated from septic tanks, hence it’s assumed to be 50% each. Therefore, 22% of faecal sludge (FS) is effluent that goes into open drain and rest of the FS is emptied from tanks, whenever full. Some FS is always left in the tanks and is assumed to be 2%. Whereas FS from pits is considered contained and is calculated as 2%, it includes infiltration of water as well, around 1% of FS is estimated to be emptied. Overall out of 21% of FS emptied, 10% is conveyed through pumping stations and is co-treated with sewage at STPs and rest of the 11% is discharged onto open ground. Around 7% of population practices open defecation and hence shown unsafe on SFD.
6. Overview of stakeholders
The 74th Constitutional Amendment Act of 1992 reformed the sector by transferring responsibility for domestic, industrial, and commercial water supply and sewerage (WSS) from state agencies, such as Departments of Public Health
Engineering and State Water Boards, to Urban Local Bodies (ULBs). This transfer has resulted in a variety of implementation models, as well as lack of clarity in the allocation of roles and responsibilities between state and local agencies, which sometimes result in large gaps in implementation (USAID, 2010). The following stakeholders are responsible for sanitation service delivery in Agra:
Table 1: Key stakeholders (Source: compiled by CSE, 2015)
UP Jal Nigam is responsible for planning, designing and construction/development of the assets in sewerage and drainage sector, while AJS is responsible for operation and maintenance of assets (MoUD, 2013a).
ANN and private emptiers are responsible for septage management. They are providing services within the city. Private emptiers also provide services to some rural areas nearby. SPCB is responsible for monitoring and evaluation of STPs.
7. Credibility of data
Two key sources of data are used; Census of India, 2011 and published documents of relevant departments. Most of the data is then updated by Key Informant Interviews (KIIs). Eleven KIIs have been conducted with different stakeholders. Data on containment is available in Census. Data on emptying and transport is collected by KIIs. However most of the data is qualitative. Some of the issues and challenges are listed below:
o Data insufficiency and non availability: No data available on how many septic tanks are connected to open drains and how many are connected to soak pits. No data on systems followed in commercial establishments, institutions etc.
Key Stakeholders Institutions / Organizations
Public Institutions UP Jal Nigam (UPJN), Agra Jal Sansthan (AJS), Agra Development Authority (ADA), Agra Nagar Nigam(ANN) State Pollution Control Board (SPCB)
Private Sector Private emptiers NGO Center for Urban and
Regional Experience (CURE)

Last Update: 29/01/2016 iv
Agra
India
Produced by:CSE Executive Summary
o Accuracy: Discrepancy observed between Census data and actual ground situation
o Data available at different time lines o Limited data available on reuse (formal /
informal).
Assumptions followed for preparing SFDs: o Data provided by Census, 2011 is
correct o Septic tanks and sewer connections on
ground are as per septic tanks and sewer connections defined in Census
o No data available about commercial establishments, institutions etc.
o Volume of wastewater generated estimated as per CPHEEO manual.
o 90% of the people get their tanks emptied when full
8. Process of SFD development
Data is collected through secondary sources. City is visited to conduct KIIs with relevant stakeholders, to fill in the gaps in data and to crosscheck the data collected. To start with, a relationship between sanitation technologies defined in Census of India and that defined in the project is established. The data was fed into the calculation tool to calculate the excreta flow in terms of percentage of population. Overall 54% of excreta is safely managed in the city and rest 46% is discharged untreated to the environment, it also includes 7% of city defecating in open, hence shown unsafe in SFD. Limitations of SFD: It’s dependent on secondary data and true picture of the city may differ. The data available is at different timelines, for example data on containment is from census 2011, and data on emptying and transportation is collected through KIIs conducted in 2015.
Excreta is safely managed or not is dependent on the containment of the system, and not on whether the waste is safely handled or not.
9. List of data sources
Below is the list of data sources used for the development of SFD.
o Published reports and books: � Census of India 2011, House listing
and Housing data, Government of India
� Service levels in water and sanitation sector, MoUD, 2012.
� Excreta Matters- volume 2, Centre for Science and Environment, 2012
� Information brochure from departments
o Un–published documents: � Draft CSP Agra 2013
o Data and information collected during visit in city from 16/3/2015 to 18/3/2015 through KIIs with representatives from � Government agencies: ANN, UP
JN(Agra zone), Service providers: Private emptiers
� NGO: CURE � Residents
Agra, India, 2015 Produced by: Suresh Kumar Rohilla, CSE Bhitush Luthra, CSE Rahul Sanka Varma, CSE Shantanu Kumar Padhi, CSE © Copyright All SFD Promotion Initiative materials are freely available following the open-source concept for capacity development and non-profit use, so long as proper acknowledgement of the source is made when used. Users should always give credit in citations to the original author, source and copyright holder. This Executive Summary and SFD Report are available from: www.sfd.susana.org

Last Update: 29/01/2016 v
Agra
India Produced by: CSE SFD report
Table of contents Executive summary……………………………………………………………………………….….. i
Table of contents……………………………………………………………………………….……..v
List of tables…………………………………………………………………….…………………….vi
List of figures…………………………………………………………………….…………………...vii
Abbreviations……………………………………………………………………….………………..viii
1 City context .................................................................................................................... 1
2 Service delivery context description/analysis .................................................................. 3
2.1 Policy, legislation and regulation ............................................................................. 3
2.1.1 Policies, legislations and regulations at national level....................................... 3
2.1.2 Policies, legislations and regulations at state level and ULB level .................... 4
2.1.3 Institutional roles .............................................................................................. 4
2.1.4 Service provision .............................................................................................. 6
2.1.5 Service standards ............................................................................................ 6
3 Service outcomes ........................................................................................................... 8
3.1 Overview ...................................................................................................................... 8
3.1.1 Sanitation facilities ........................................................................................... 9
3.1.2 Containment ..................................................................................................... 9
3.1.3 Emptying .........................................................................................................10
3.1.4 Transportation .................................................................................................10
3.1.5 Treatment and disposal ...................................................................................10
3.2 SFD matrix .............................................................................................................10
3.2.1 SFD matrix explanation ...................................................................................10
3.2.2 Risk of groundwater contamination .................................................................12
4 Stakeholder engagement ..............................................................................................14
4.1 Key informant interviews ........................................................................................14
5 Acknowledgement .........................................................................................................15
6 References ....................................................................................................................16
7 Appendix .......................................................................................................................18
7.1 Stakeholder identification .......................................................................................18
7.2 Tracking of engagement ........................................................................................19
7.3 SFD matrix .............................................................................................................20
7.4 Overlap of institutional responsibilities ....................................................................21
7.5 Selected onfield pictures ........................................................................................22

Last Update: 29/01/2016 vi
Agra
India Produced by: CSE SFD report
List of tables Table 1: Decadal population growth rate of Agra city ............................................................. 1
Table 2: Roles and responsibilities ........................................................................................ 5
Table 3: Sanitation Technologies and contribution of excreta in terms of percentage of population.............................................................................................................................. 8
Table 4: Description of variables used in SFD ......................................................................11
Table 5: Percentage of the population using each system technology and method ..............13
Table 7: Stakeholder identification ........................................................................................18
Table 8: Tracking of engagement .........................................................................................19
Table 8: Overlap of institutional responsibilities ....................................................................21

Last Update: 29/01/2016 vii
Agra
India Produced by: CSE SFD report
List of figures Figure 1: Agra city ward map ................................................................................................. 2
Figure 2: SFD matrix ............................................................................................................20
Figure 3: Private borewell .....................................................................................................22
Figure 4: Bottled water for drinking purpose .........................................................................22
Figure 5: 78 MLD UASB technology Dhandpura STP ...........................................................23
Figure 6: Sludge drying bed in Dhandupura STP..................................................................23
Figure 7: Outfall sewer of Dhandupura STP .........................................................................24
Figure 8: Open drain in the city .............................................................................................24
Figure 9: Private vaccum tanker ...........................................................................................25
Figure 10: Open defecation site ............................................................................................25

Last Update: 29/01/2016 viii
Agra
India Produced by: CSE SFD report
Abbreviations ADA Agra Development Authority ANN Agra Nagar Nigam AJS Agra Jal Sansthan BIS Bureau of Indian Standard CAA Constitution Amendment Act CGWB Central Ground Water Board CPHEEO Central Public Health & Environmental Engineering Organization CPCB Central Pollution Control Board CSP City Sanitation Plan CSE Centre for Science and Environment CURE Centre for Urban and Regional Excellence DUDA District Urban Development Authority FS Faecal Sludge GoUP Government of Uttar Pradesh KII Key Informant Interview LPCD Litres per Capita per Day MHUPA Ministry of Housing and Poverty Alleviation MIS Management Information System MoUD Ministry of Urban Development MSL Mean Sea Level NIUA National Institute of Urban Affairs NIC National Informatics Centre RO Reverse Osmosis SFD Shit Flow Diagram SLB Service Level Benchmarks SPS Sewage Pumping Station STP Sewage Treatment Plant SWM Solid Waste Management TDS Total Dissolved Solids UASB Up-flow Anaerobic Sludge Blanket UDD Urban Development Department ULB Urban Local Body UPJN Uttar Pradesh Jal Nigam UPPCB Uttar Pradesh Pollution Control Board USAID United States Agency for International Department UWSS Urban Water Supply and Sanitation WSS Water Supply and Sewerage WW Waste Water

Last Update: 29/01/2016 1
Agra
India Produced by: CSE SFD report
1 City context The City of Agra is situated on the banks of the river Yamuna in the state of Uttar Pradesh, India. City lies in the great Indo-Gangetic plain, at a distance of 363 km west of the state capital, Lucknow and 200 km south of the national capital, Delhi. From a historical point of view, Agra achieved its name and fame as the capital of Mughal emperors and remains major tourist destination because of its impressive Mughal-era monuments, specially the Taj Mahal (MoUD, 2013). The population of the city, as per the Census of India, 2011 is 1,574,542. Population density of the city is 11,167 persons per sq.km, which is considerably high, when compared to other class B cities in Uttar Pradesh (MHUPA, 2013). The slum population is 533,554, representing 33% of the total population. The floating population is around 0.3 million (AJS, 2015). It is reported that during day time, population increases to 1,874,542 including floating population. The population growth rate of the city is given in the following table. The area under Municipal Corporation of Agra jurisdiction is 141 sq.km. Municipal boundary has been chosen for the current study. The Municipal Corporation of Agra called as Agra Nagar Nigam (ANN) is divided into 90 wards.
Table 1: Decadal population growth rate of Agra city
Census Year Population (lakhs)
Decadal Growth Rate (%)
1971 5.91 -
1981 7.81 32.15
1991 9.78 25.22
2001 12.75 30.37
2011 15.74 23.45
The presence of the Taj Mahal and other historic monuments has fostered the growth of tourism industry. Agra is the commercial hub since the Mughal Era for trade in royal crafts like pietra dura, marble inlay and carpets, which still persist. 40% of the population depends largely on agriculture and remaining earn their livelihood in the leather, footwear business and iron foundries. Agra was the second most self-employed city in India in 2007 (MoUD, 2013). The city stretches for about 9.0 km along the Yamuna River. The major part of the city is on the western side of Yamuna and has grown beyond the river on the eastern side. The type of soil in Agra city is sandy. The city is located at 27° -10' N latitude and 78°- 02' E longitude with an average altitude of 169 MSL (NIC, 2015). The temperatures rises maximum to 47° C during peak summer season and drops down to minimum of 3° C during the winter season. Agra city lies in a moderate to high rainfall region with an average yearly rainfall of about 686 mm. The maximum and minimum rainfall recorded by Indian Meteorological Department (MoUD, 2013).

Last Update: 29/01/2016 2
Agra
India Produced by: CSE SFD report
Figure 1: Agra city ward map

Last Update: 29/01/2016 3
Agra
India Produced by: CSE SFD report
2 Service delivery context description/analysis
2.1 Policy, legislation and regulation
2.1.1 Policies, legislations and regulations at national level In 2008, the Ministry of Urban Development (MOUD) issued the National Urban Sanitation Policy (NUSP). The policy aims to: raise awareness; promote behaviour change; achieve open defecation free cities; develop citywide sanitation plans; and provide 100% safe confinement, transport, treatment and disposal of human excreta and liquid wastes. The NUSP mandates states to develop state urban sanitation strategies and work with cities to develop City Sanitation Plans (CSPs). NUSP specifically highlights the importance of safe and hygienic facilities with proper disposal and treatment of sludge from on-site installations (septic tanks, pit latrines, etc.) and proper operation and maintenance (O&M) of all sanitary facilities. Furthermore, it explicitly states that cities and states must issue policies and technical solutions that address onsite sanitation, including the safe confinement of faecal sludge (FS) (USAID, 2010). The objectives of NUSP are to be realized through CSPs and state sanitation strategies. As of now there are very few cities that, have finalized their CSPs, and those plans that have be developed have not been implemented. This remains a major drawback in the implementation of the NUSP. The advisory note on septage management in urban India, issued by MOUD in 2013, recommends supplementing CSPs with a Septage Management Sub-Plan (SMP), prepared and implemented by cities. Septage here broadly refers to not only FS removed from septic tanks but also that removed from pit latrines and similar on-site systems. This advisory provides reference to Central Public Health & Environmental Engineering Organisation (CPHEEO) guidelines, Bureau of Indian Standard (BIS) standards, and other resources that users of this advisory may refer, for details while preparing their SMP (MoUD, 2013a). The advisory clearly discusses the techno- managerial and socio- economic aspects of septage management in India and provides guidelines for Urban Local Bodies (ULBs) to plan and implement SMP. There are no specific legal provisions relating to septage management, but there are a number of provisions relating to sanitation services and environmental regulations. These mostly stem from, The Environment (Protection) Act, 1986 and the Water (Prevention and Control of Pollution) Act, 1974. It also applies to households and cities with regard to disposing wastes into the environment. ULBs/ utilities also have to comply with discharge norms for effluent released from sewage treatment plants and to pay water cess under the Water Cess Act, 1977. The ULB is responsible for ensuring the safe handling and disposal of septage generated within its boundaries, for complying with the Water Act and for meeting all state permit requirements and regulations (CSE, 2010). Municipal acts and regulations usually refer to management of solid and liquid wastes but may not provide detailed rules for septage management (MoUD, 2013a). The Prohibition of Employment as Manual Scavengers and their Rehabilitation Act is enacted in 2013. This act prohibits employment of manual scavengers and insanitary latrines - Laying strong emphasis on rehabilitation of manual scavengers. This act has become instrumental in eradicating manual scavenging in India.

Last Update: 29/01/2016 4
Agra
India Produced by: CSE SFD report
2.1.2 Policies, legislations and regulations at state level and ULB level According to the Constitution of India, water and sanitation are state subjects. Statutory powers are conferred to the state for making laws on water and sanitation. Some of the policies, laws and regulations are listed below: The Uttar Pradesh Water Supply and Sewerage Act, 1975:
An act to facilitate the establishment of corporation, authorities and organizations for the development and regulation of water supply and sewerage services, related matters. According to this act the corporation has powers to fine the owner of the improper/damaged septic tank. Agra has prepared a City Sanitation Plan (CSP) that includes recommendations from NUSP to deal with septage in the city. The ill-effects of improper septage management have been identified as one of the critical problem areas. CSP recommends introducing municipal by-laws, building codes that shall enforce performance standards for the new development; citywide design guidelines of the order of toilet design manual, sustainable sanitation technologies manual and water conservation manual. This also includes septic tank design parameters (MoUD, 2013). 2.1.3 Institutional roles The MoUD is the nodal ministry for policy formulation and guidance for the urban water supply and sewerage sector. The ministry’s responsibilities include broad policy formulation, institutional and legal frameworks, setting standards and norms, monitoring, promotion of new strategies, coordination and support to State Programmes through institutional expertise and finance. The ministry is also responsible for managing international sources of finance. The Central Public Health and Environmental Engineering Organisation (CPHEEO), created in 1953, is the technical wing of the MoUD, which advises the ministry in all technical matters and collaborates with the State Agencies about water supply and sanitation activities. CPHEEO plays a critical role in externally funded and special programmes. CPHEEO also plays a central role in setting design standards and norm setting for urban water supply and sanitation (Planning Commission, 2002). The 74th Constitutional Amendment Act of 1992 reformed the sector by transferring responsibility for domestic, industrial, and commercial water supply and sewerage (WSS) from state agencies, such as Departments of Public Health Engineering and State Water Boards, to Urban Local Bodies (ULBs). This transfer has resulted in a variety of implementation models, as well as a lack of clarity in roles and responsibilities of state and local agencies, resulting in large gaps in implementation (USAID, 2010). Management and delivery of urban basic services in Agra is governed by various institutions. The following are the institutions responsible for policy making, service provision and regulation of urban services :-

Last Update: 29/01/2016 5
Agra
India Produced by: CSE SFD report
Table 2: Roles and responsibilities
Institutions Roles and reponsibilities Urban Development Department
UDD is responsible for policy formulation, preparation of municipal laws, monitoring and evaluation of programmes, supervision of municipal administration, coordination with related state government departments, liaison with the central government and external funding agencies etc. It is responsible for administrative and financial management of municipalities, implementation of development programmes.
Agra Nagar Nigam (ANN) x Public health, sanitation, conservancy and solid waste management
x Urban poverty alleviation x Provision and maintenance of urban amenities and facilities such as
parks, gardens, playgrounds. x Provision and maintenance of the lighting in the public streets,
corporation markets, public buildings and other places under corporation x Maintenance of ambulance services x Registration of vital statistics including births and deaths. x Regulation of slaughter houses and tanneries. x Operation and maintenance of burial grounds, cremation grounds, etc.
Water supply and sewerage are also obligatory functions of Municipal Corporation, however in Agra they are looked after by Jal Nigam and Jal Sansthan (MoUD, 2013).
Agra Development Authority (ADA)
x Preparation and implementation of Master Plan x Planning for infrastructure for ADA colonies and its construction x Zoning of the city x Maintenance of ADA colonies until they are handed over to ANN x Overall development of city
Uttar Pradesh Jal Nigam
Jal Nigam was formed in 1927 to undertake responsibility for the water supply and sewage disposal of the State. Later in 1975 this department was transformed into Uttar Pradesh Jal Nigam under the Uttar Pradesh Water Supply and Sewerage Act, 1975. Under the act, UP Jal Nigam has to carry out the functions of –
x Preparation, execution, and promotion of ULB and state level plans of water supply and sewerage schemes.
x Establishment of standards for water supply and sewerage in the state.
Agra Jal Sansthan (AJS)
Agra Jal Sansthan (AJS) is in charge of operations and maintenance, and revenue collection for supplying water by Jal Kal Department, while all capital works related to water supply and sanitation are undertaken by Uttar Pradesh Jal Nigam (UPJN). Jal Sansthan, which was earlier an independent body, is now a part of ANN.
Last Update: 29/01/2016 6
Agra
India Produced by: CSE SFD report
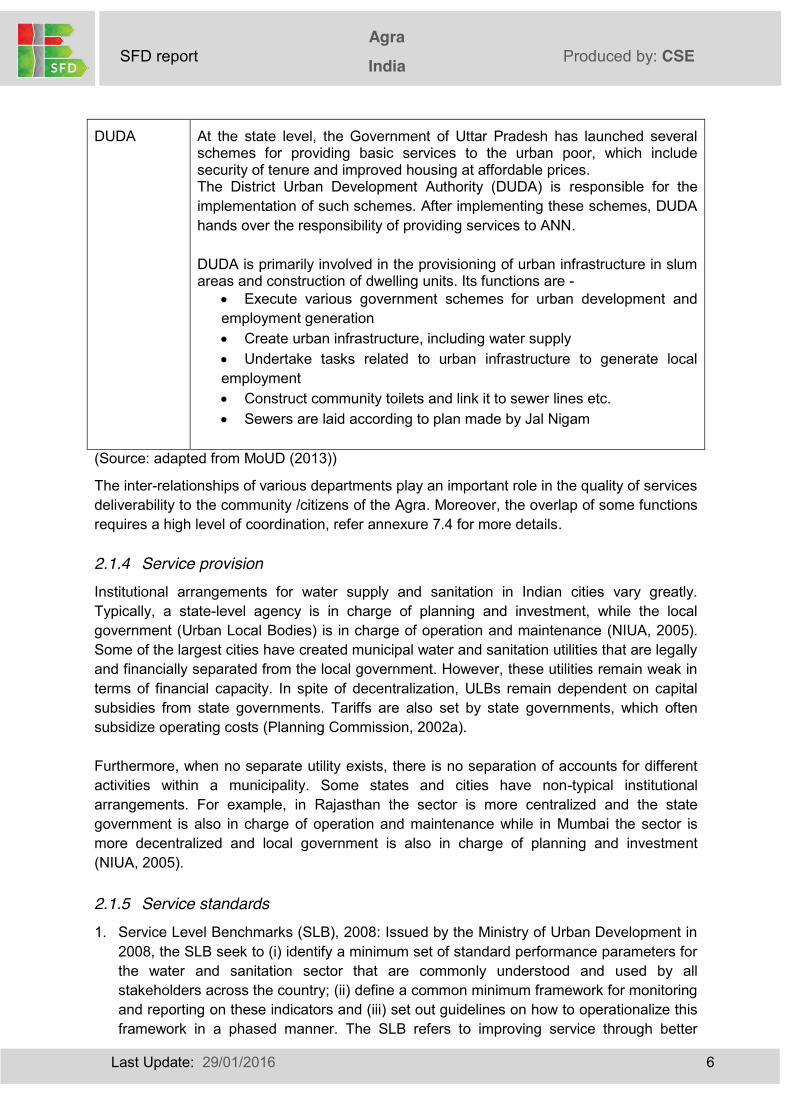
DUDA At the state level, the Government of Uttar Pradesh has launched several
schemes for providing basic services to the urban poor, which include security of tenure and improved housing at affordable prices. The District Urban Development Authority (DUDA) is responsible for the implementation of such schemes. After implementing these schemes, DUDA hands over the responsibility of providing services to ANN. DUDA is primarily involved in the provisioning of urban infrastructure in slum areas and construction of dwelling units. Its functions are -
x Execute various government schemes for urban development and employment generation x Create urban infrastructure, including water supply x Undertake tasks related to urban infrastructure to generate local employment x Construct community toilets and link it to sewer lines etc. x Sewers are laid according to plan made by Jal Nigam
(Source: adapted from MoUD (2013))
The inter-relationships of various departments play an important role in the quality of services deliverability to the community /citizens of the Agra. Moreover, the overlap of some functions requires a high level of coordination, refer annexure 7.4 for more details. 2.1.4 Service provision Institutional arrangements for water supply and sanitation in Indian cities vary greatly. Typically, a state-level agency is in charge of planning and investment, while the local government (Urban Local Bodies) is in charge of operation and maintenance (NIUA, 2005). Some of the largest cities have created municipal water and sanitation utilities that are legally and financially separated from the local government. However, these utilities remain weak in terms of financial capacity. In spite of decentralization, ULBs remain dependent on capital subsidies from state governments. Tariffs are also set by state governments, which often subsidize operating costs (Planning Commission, 2002a). Furthermore, when no separate utility exists, there is no separation of accounts for different activities within a municipality. Some states and cities have non-typical institutional arrangements. For example, in Rajasthan the sector is more centralized and the state government is also in charge of operation and maintenance while in Mumbai the sector is more decentralized and local government is also in charge of planning and investment (NIUA, 2005). 2.1.5 Service standards 1. Service Level Benchmarks (SLB), 2008: Issued by the Ministry of Urban Development in
2008, the SLB seek to (i) identify a minimum set of standard performance parameters for the water and sanitation sector that are commonly understood and used by all stakeholders across the country; (ii) define a common minimum framework for monitoring and reporting on these indicators and (iii) set out guidelines on how to operationalize this framework in a phased manner. The SLB refers to improving service through better

Last Update: 29/01/2016 7
Agra
India Produced by: CSE SFD report
provision and delivery. It evaluates the performance of urban services provided by different ULBs throughout the country.
2. General Standards for Discharge of Environmental Pollutants Part-A: Effluents-The Environment (Protection) Rules, 1986 (Schedule VI): Issued by, Central Pollution Control Board (CPCB), a statutory organisation constituted in September, 1974 under the Water (Prevention and Control of Pollution) Act, 1974.
3. Manual on Sewerage & Sewage Treatment, Second Edition, 2013: This manual was
developed by Central Public Health and Environmental Engineering Organization (CPHEEO). It provides detailed designs and guidelines for various technologies of wastewater management.
4. Code of Practice for Installation of Septic Tanks, 1985: Issued by, Bureau of Indian Standards. The code specifies standards and design consideration for installation of septic tanks.

Last Update: 29/01/2016 8
Agra
India Produced by: CSE SFD report
3 Service outcomes Service outcome analysis is based on secondary sources. Two key sources of data are used; Census of India, 2011 and draft CSP, 2013. The data is crosschecked and updated by key informant interviews (KIIs). Data on containment is available in Census. Data on emptying and transport is collected by KIIs. However most of the data is qualitative.
3.1 Overview
This section presents the range of sanitation technologies/infrastructure, methods and services designed to support the management of FS and Waste Water (WW) through sanitation service chain in Agra. The details on quantitative estimations are presented in table below and following sections:
Table 3: Sanitation Technologies and contribution of excreta in terms of percentage of population
S. No.
Sanitation technologies and systems as defined by: SFD reference variable
Percentage of
population
% with floating
population Census of India SFD promotion initiative
1 Piped sewer system
User interface discharges directly to centralized separate sewer
T1A1C2 40.7% 42.2%
2 Septic tank Septic tank connected to open drain or storm sewer
T1A2C6 40.3% 41.8%
3 Other systems User interface discharges directly to open ground
T1A1C8 2.6% 2.2%
4 Pit latrine with slab
Lined pit with semi-permeable walls and open bottom, no outlet or overflow, general situation
T1A5C10 1.1% 0.9%
5 Pit latrine without slab
Unlined pit no outlet or overflow, general situation
T1A6C10 0.25% 0.2%
6 Night soil disposed into open drain
User interface discharges directly to open drain or storm drain
T1A1C6 2.72% 2.3%
7 Service latrine User interface discharges directly to ‘don’t know where’
T1A1C9 0.75% 0.6%
8
Public latrine Septic tank connected to open drain or storm sewer
Lined pit with semi-permeable walls and open bottom, no outlet or overflow, general situation
T1A2C6
or
T1A5C10 3.2% 2.7%
9 Open defecation Open defecation T1B11C7 TO C9 8.4% 7.1%

Last Update: 29/01/2016 9
Agra
India Produced by: CSE SFD report
A major issue in Agra is the floating population. Tourists and short term migrants come and stay in Agra for varying periods of time. Water and sanitation challenges faced by the city due to massive influx of people list high among the concerns expressed by citizens. These pose challenges to the city administration with respect to toilets, solid waste management and water supply. It is assumed that floating population would be catered either by sewerage network or by septic tanks and to reduce the maximum error it is considered to be 50% each. 3.1.1 Sanitation facilities This section presents on existing sanitation facilities in institutions, commercial establishments, slums and facilities for tourists. Community/public toilets: It is reported that nearly 20–25% of the total households use community toilets. There are about 117 community toilets with about 96% of them located in slum areas. Community toilets are connected to septic tanks and the septic tanks do not fulfill the requirement of the sewerage management system as stipulated in the CPHEEO manual on sewerage and sewage treatment. Additionally the condition of 80% of the septic tanks is in a dilapidated condition; there are no established faecal sludge management process/service institutions in terms of infrastructure. The public toilets are in a good condition especially when compared to community toilets; however, these are inadequate in number compared to the demand because of higher floating population (MoUD, 2013). School sanitation: It is reported that 85% of the schools provide separate toilets for the girl students/female teachers and 80% of the schools have provision for the boy students/male teachers. The student/teacher population of the remaining 15% of the schools that do not have any kind of toilet, practice open defecation (MoUD, 2013). Commercial areas: Commercial areas comprise of shops, complex, hotels, malls and markets etc., where business activities take place. 55% of the commercial/ market places have toilets within the complex. 45% of them do not have toilets. It is reported that 70% of the commercial areas toilets are connected to septic tanks. The septage is emptied every 9 months by the ANN and the waste is disposed off into the open drains (MoUD, 2013). Due to the lack of data on excreta generated from schools. The schools are not taken into consideration for production of SFD. Agra is a tourist place, so floating population has been considered for producing SFD. 3.1.2 Containment The existing sewerage network covers less than half of the population. The system is silted, choked and damaged at number of places (UPJN, 2015). The rest of the city (40%) is dependent on septic tanks which are generally not adhering to design prescribed by the Bureau of Indian Standards (BIS). As such, the effluent from the septic tanks flows into open drains. Some households are also connected to pits. There are two types of pit toilets found in Agra, - Gaddewali and Kuddi. A Gaddewali is a soak pit toilet. The collection pit structure, measuring 4X4 ft or 4X6 ft covered by a slab. The pit generally gets filled in one to two years. A Kuddi is a small structure built on bricks and is directly connected to an open nallah. This kind of containment is prevalent in urban sprawl (MoUD, 2013).

Last Update: 29/01/2016 10
Agra
India Produced by: CSE SFD report
3.1.3 Emptying There are private emptiers with twenty to twenty five vacuum tankers of 5000 L capacity each. ANN has six vacuum tankers with 5000-6000 L capacity. The emptying fees range from INR 800-4000 (12-65 USD) per trip charged by private emptiers (M Narendra 2015, pers. comm., 18 March). INR 500 (12 USD) per trip is charged by ANN (ANN, 2015). Private emptiers do not maintain records (Log book), so it is difficult to assess the number of houses attended per day/month/year. Generally, there are 2-3 persons; one driver, one operator and if required one helper. The emptiers don’t use gloves, boots or masks or any other safety gear. Private emptiers use innovative marketing strategies to attract customers like advertisement on billboards and placards. Monsoon is the peak season for emptying (M Narendra 2015, pers. comm., 18 March). Instances of manual emptying have been reported (MoUD, 2013). 3.1.4 Transportation Vacuum tankers are generally tractor mounted, fabricated by local metallurgy workshops, and lack any kind of standards. Private emptiers discharge septage into sewer/open drains and open ground (M Narendra 2015, pers. comm., 18 March). Sewage is conveyed to Sewage Treatment Plants (STPs) through SPS. Sewage also flows through many open drains in the city (ANN, 2015). Out of many open drains, 20 open drains are identified which are significantly causing pollution to the river. These drains are intercepted by 9 pumping stations to avoid direct disposal of sewage into Yamuna River (UPJN, 2015). The sewage is conveyed to the STPs. 3.1.5 Treatment and disposal There are 9 STPs with the treatment capacity of 221.25 MLD , but sewage delivered to STPs is only 135.75 MLD. There are no separate treatment facilities for septage. 5 STPs run on Up-flow Anaerobic Sludge Blanket (UASB) technology and together generate 42.57 m3/day of sludge cake. The sludge is sold at INR 40/m3 (0.60 USD) to farmers. Treated sewage is disposed into land, irrigation channel and Yamuna River (UPJN, 2015a). Un-intercepted sewage that flows through open drains is also disposed into Yamuna River without treatment (ANN, 2015). 3.2 SFD matrix The final SFD for the Agra is presented in appendix 7.3.
3.2.1 SFD matrix explanation According to the Census, 47% of the city is dependent on offsite systems, population connected to sewer line is 42% and user interface directly discharging in open drain or open ground is only 5%. 12% of wastewater is lost in transportation. 46% of the city is dependent on onsite sanitation systems (OSS), out of which 44% are dependent on septic tanks and around 2% on pits. The public latrines are assumed to be connected to the septic tanks and pits hence are incorporated in onsite systems. Septic tanks are not contained as they are connected to open drains but pits are contained as the groundwater table is more than 10 mbgl.

Last Update: 29/01/2016 11
Agra
India Produced by: CSE SFD report
There is no clear differentiation between the volume of effluent and solid FS generated from septic tanks, hence to reduce the maximum error, it’s assumed to be 50% each. Therefore, 22% of FS is assumed to be effluent that goes into open drains and rest of FS is emptied from tanks whenever full. Some FS is always left in the tanks and is assumed to be 2%. Whereas FS from pits is considered contained and is calculated as 2% which includes infiltration of water as well. 7% of the population still practices open defecation. Definition and estimation of different variables (used to make SFD) are explained below.
Table 4: Description of variables used in SFD
Assuming the Census figures are correct; W2 was estimated to be around 42%. It is assumed that 70% of WW would reach STP hence W4a is estimated to be 30% and W11a as 12%. W15 is rounded off to 5%, as it includes WW discharged into open drains i.e. 2.3%, WW discharged on open ground (defined as other systems in the Census) i.e. 2.2% and WW from service latrines i.e. 0.6%. 22% of FS, that is effluent from septic tanks, is also discharged into open drains, making it 27% in total. WW intercepted from open drains and
Variable Description
W2 WW contained centralized (offsite)
W15 WW not contained (offsite)
W11 WW not delivered to treatment
W11a WW not delivered to centralized treatment plant
W11c WW not contained not delivered to treatment plant
W12a WW not treated at centralized treatment plants
W4a WW delivered to centralized treatment plant
W5a WW treated at centralized treatment plant
F2 FS contained (onsite)
F10 FS not contained (onsite)
F3 FS emptied
F3a FS contained- emptied
F3b FS not contained- emptied
F8 FS contained- not emptied
F15 FS not contained- not emptied
F11 FS not delivered to treatment
OD9 Open defecation

Last Update: 29/01/2016 12
Agra
India Produced by: CSE SFD report
delivered to the treatment plant is estimated to be 14%, therefore W4c=14%. The rest of the WW which is not contained and not delivered to treatment plant comes out to be 13%, hence W11c=13%. Total WW not delivered to the treatment plant, i.e.W11 comes out to be 25% (W11=W11a+W11c). 95% WW is treated at STP, hence W5a becomes 43%. W12a, WW not treated at centralized treatment plant comes out to be 1%. F10 is estimated to be around 44% and F2 is estimated to be around 2% which constitutes of 1% population dependent on lined pits with semi-permeable walls & open bottom and 1% are dependent on unlined pits. Since there is no clear demarcation in the amount of solid FS generated and effluent/infiltration generated from an onsite system, it is assumed to be 50% each. It is also assumed that 90% of the population (dependent on onsite systems) gets their system emptied when full. Therefore, out of 44% septic tank dependent population, FS of 90% population gets emptied, hence F3b=20%. Similarly for lined pits and unlined pits FS emptied taken together (i.e. F3a), comes out to be 1% approximately, making total FS emptied (i.e. F3) equal to 21%. Whereas FS contained but not emptied, i.e. F8, comes out to be 1%. 50% of the emptied FS is estimated to be treated along with sewage at STP and hence F5 comes out to be 10% and the FS discharged untreated in the environment, F11 comes out to be 11%. Since there’s some sludge always left in the tanks and pits, F15 is estimated to be 2%. 7% of population practice open defecation and hence OD9 is computed to be 7%. It can be concluded that excreta of 54% population is managed safely in Agra city and 46% of excreta is discharged in environment untreated. The table 5 summarizes the percentage of the population using each sanitation technology and method along the service chain.
3.2.2 Risk of groundwater contamination The water table, in general is deep, varying from 17 to 23 mbgl; a declining trend in the water table has been recorded in few areas in Agra due to overexploitation of the ground water resources (CGWB, 2007). The water table is declining by 30 to 55 cm/year (ADA, 2013). The households are majorly dependent on bottled water available in 20 litres jar for drinking purpose. The groundwater is extensively used for all other purpose, and not for drinking due to presence of high TDS (AJS, 2015a). Data is not available on faecal coliform contamination.

Last Update: 29/01/2016 13
Agra
India Produced by: CSE SFD report
Table 5: Percentage of the population using each system technology and method
System Type
Containment Emptying Transport Treatment End-use/ disposal
Offsite T1A1C2 (Reference L1): 42% of the population is connected to centralised sewer, hence W2 is 42%.
T1A1C6 (Reference L4): 2.3 % of the population is discharging their excreta directly to open drain.
T1A1C8 & T1A1C9 (Reference L5): 2.2 % of the population is discharging their excreta directly to open ground and 0.6% discharging-don’t know where.
Total WW not contained (offsite), i.e.W15, adds up to 5%.
Not applicable. WW of 30%of the population served by centralised sewers, reaches treatment facilities, hence W4a is 30%. It is assumed that 12% would be lost due to leakage, hence W11a=12%.
WW not contained, delivered to centralised treatment plant, i.e. W4c is 14%.
Therefore WW not contained not delivered to centralised treatment plants, i.e. W11c, is 13%.
Total WW not delivered to treatment plant, i.e. W11, is 25%.
43% of the population has their WW treated, and therefore W5a is 43%.
WW not treated at STP is estimated to be 1% and hence W12 comes out to be 1%.
Treated WW is used for irrigation sometimes and disposed in the local river.
Total WW disposed untreated in local area comes out to be 25%.
Onsite
46% of population is dependent on onsite sanitation systems, hence F10, FS not contained is 44% and F2, FS contained is 2%.
T1A2C6 (Reference L8): 44% of population is dependent on septic tanks connected to open drain.
T1A5C10 & T1A6C10(Reference L11):2% of population is dependent on lined/unlined pit with semi permeable walls and open bottom.
Since most of the population is getting their systems emptied, it is assumed 90% of population has their onsite technology emptied.
Since there is no clear differentiation between % of septage and effluent, it is assumed to be 50% each. FS not contained- emptied, i.e. F3b comes out to be 20% and FS contained-emptied, i.e. F3a is 1%. FS contained- not emptied, i.e. F8, becomes 1 % and FS not contained-not emptied becomes 2%.
10% FS is transported to treatment plant and FS not delivered to treatment plant, i.e.F11, is 11%.
FS treated with sewage is estimated to be 10%, therefore FS treated, i.e. F5, is 10%.
10% treated FS is dried along with sludge of treated waste water. Dried cakes are sold to the farmers for agriculture purpose.
11% FS emptied ends up in local area without any treatment.
Open defecation
7% of population practice open defecation and hence OD9 is computed to be 7%.

Last Update: 29/01/2016 14
Agra
India Produced by: CSE SFD report
4 Stakeholder engagement
4.1 Key informant interviews
The relevant departments were contacted through e-mail, letter, call and fax prior to a visit to the city. The purpose of the SFD study and depth of data required was conveyed through an introductory letter to respective departments. Overall, 10 KIIs were conducted with different stakeholders like government functionaries, private emptiers etc. (see appendix 7.2). The Government of Uttar Pradesh operates through its UDD. ANN is supported by UDD.
The city was visited, as few documents were available on internet. The visit helped in collecting data, including unpublished reports. The KIIs and data collected helped in understanding the existing situation and upcoming development plans in the sanitation sector. Due to the limitation of desk-based study all the key stakeholders engaged in sanitation services could not be interviewed in person.

Last Update: 29/01/2016 15
Agra
India Produced by: CSE SFD report
5 Acknowledgement This report was compiled as part of the SFD promotion initiative project funded by the Bill and Melinda Gates foundation (BMGF). We would like to take this opportunity to thank Mr Inder Vikram Singh, Commissioner, ANN, Mr Anup Sood, Environmental Officer, ANN, Mr R.M. Kant Chief Engineer, UPJN, Ms Manjurani Gupta, General Manager, Jal Kal, Dr Deepak Singh, Chief Chemist, Jal Kal, Mr. P.K Aggarwal, General Manager, Yamuna Pollution Control Unit (UPJN), Mr. Rajesh Kumar, Project officer, CURE for their support during our visit to Agra. A special thanks to Dr Suresh Kumar Rohilla, Programme Director, CSE for his supervision and guidance at every step of the assessment and report writing.

Last Update: 29/01/2016 16
Agra
India Produced by: CSE SFD report
6 References ADA, 2013. Comprehensive Environmental Management Plan for Taj Trapezium Zone Area. Agra Development Authority Agra. ANN, 2015. Interview with Environmental Officer. Agra Nagar Nigam Agra.
AJS. 2015. An overview on drinking water supply in Agra. Agra Jal Sanasthan. March 2015.
AJS. 2015a. Interview with chief chemist in Agra. Agra Jal Sansthan. March 2015. BIS.1986. Code of Practice for Installation of Septic Tanks – Part 1 Design criteria and construction: Bureau of Indian Standards (BIS). Census of India 2011, Houselisting and housing data, Households by availability of type of latrine facility, viewed 29 May 2015, Census digital library. CGWB. 2007. Manual on artificial recharge of ground water: Central Ground Water Board (CGWB), Ministry of Water Resources, Government of India.
CPCB.1986.The Environment (Protection) Rules, 1986.Schedule 6: Central Pollution Control Board (CPCB), Government of India. CPHEEO. 2013. Manual on Sewerage & Sewage Treatment. Second Edition: Central Public Health and Environmental Engineering Organization.
CSE 2011. Policy Paper on Septage Management in India. Centre for Science and Environment New Delhi, India. Department of Economic Affairs (DoEA), 2009. Position Paper On The Water And Sanitation Sector In India. Ministry of Finance (MoF). MHUPA. 2013. Slum Free City Plan of Action, Ministry of Housing and Poverty Alleviation. Agra. MoUD. 2013. Draft Report, City Sanitation Plan for Agra, Uttar Pradesh Government of India. MoUD. 2013a. Advisory Note: Septage Management in Urban India. New Delhi: Ministry of Urban Development. Government of India. NIC. 2015. National Informatics Centre (NIC) Agra. Ministry of communication & Information Technology, Govt. of India. Available from: http://agra.nic.in/def.asp [Accessed October 2015]. NIUA. 2005. Status of Water Supply, Sanitation and Solid Waste Management. National Institute of Urban Affairs. New Delhi, India.

Last Update: 29/01/2016 17
Agra
India Produced by: CSE SFD report
Planning Commission. 2002. India Assessment 2002 – Water supply and Sanitation: Government of India.
Planning Commission. 2002a. Tenth Five Year Plan- 2002 to 2007.Vol 2: Government of India. UPJN. 2015. Interview with General Manager at Yamuna Pollution Control Unit, UP Jal Nigam, March 2015.
UPJN. 2015a. A brief description of sewer works in Agra city: UP Jal Nigam, Agra. USAID. 2010. A Rapid Assessment of Septage Management in Asia: Policies and Practices in India, Indonesia, Malaysia, the Philippines, Sri Lanka, Thailand, and Vietnam. Bangkok: United States Agency for International Development (USAID).

Last Update: 29/01/2016 18
Agra
India Produced by: CSE SFD report
7 Appendix
7.1 Stakeholder identification
Table 6: Stakeholder identification
No. Stakeholder Group In Agra Context
1 City council / Municipal authority / Utility Agra Nagar Nigam
2 Ministry in charge of urban sanitation and sewerage
Urban Development Department, GoUP
3 Ministry in charge of urban solid waste Urban Development Department, GoUP
4 Ministries in charge of urban planning finance and economic development.
Urban Development Department, GoUP
Ministries in charge of environmental protection/ Environment Department, GoUP
Ministries in charge of health Department of Medical Helath and Family Welfare, GoUP
5 Service provider for construction of onsite sanitation technologies
Local masons
6 Service provider for emptying and transport of faecal sludge
Agra Nagar Nigam and Private Emptiers
7 Service provider for operation and maintenance of treatment infrastructure
Agra Jal Sansthan
8 Market participants practising end-use of faecal sludge end products
Farmers
9 Service provider for disposal of faecal sludge (sanitary landfill management)
Agra Jal Sansthan
10 External agencies associated with FSM services: e.g. NGOs, academic institutions, donors,
Centre for Urban and Regional Excellence (CURE)

Last Update: 29/01/2016 19
Agra
India Produced by: CSE SFD report
7.2 Tracking of engagement
Table 7: Tracking of engagement
Name of the organisation
Name of the contact person
Designation Date of engagement
Purpose of engagement
AJS (Yamuna Pollution Control Unit)
Mr P. K Aggarwal
General Manager
17/3/2015 KII
Jal Nigam (Water Works Dept.)
Ms Manjurani Gupta
General Manager
17/3/2015 KII
Agra Nagar Nigam
Mr Suresh Chand
Executive Engineer
17/3/2015 KII
Agra Nagar Nigam
Mr Anup Sood Environmental Officer
17/3/2015 KII and Data collection
Agra Jal Sansthan
Dr Deepak Singh
Chief Chemist 18/3/2015 KII and Data collection
AJS (Yamuna Pollution Control Unit)
Mr Khalid Project Manager 18/3/2015 KII and Data collection
AJS (Yamuna Pollution Control Unit)
Mr J.D. Garg Project Manager 18/3/2015 KII and Data collection
N.A Mr M.Narendra Private Emptier 18/3/2015 KII
Centre for Urban and Regional Excellence (CURE)
Mr Rajesh Kumar
Project Officer 18/3/2015 KII
Centre for Urban and Regional Excellence (CURE)
Mr Monu Khan Volunteer 18/3/2015 KII

Last Update: 29/01/2016 20
Agra
India Produced by: CSE SFD report
7.3 SFD matrix
Figure 2: SFD matrix

Last Update: 29/01/2016 21
Agra
India Produced by: CSE SFD report
7.4 Overlap of institutional responsibilities
Table 8: Overlap of institutional responsibilities
Sector Planning & Design
Implementation Operation and maintenance
Land Use/ Master Plan/ Building Byelaws
ADA
ADA
ADA
Water Supply
UPJN, JAL KAL (small projects)/ UPHB for colonies developed by them/ DUDA for slum areas
UPJN, JAL KAL (small projects)/DUDA for slum areas
JAL KAL
Sewerage AJS, UPJN AJS, UPJN
AJS, UPJN
Storm Water Drainage
ANN
ANN
ANN
Solid Waste Management
ANN
ANN
ANN
Water Pollution Control
UPPCB
UPPCB
UPPCB
Slum Development
ANN, DUDA
DUDA, ADA
DUDA
Urban Poverty Programme
ANN, DUDA
DUDA
DUDA

Last Update: 29/01/2016 22
Agra
India Produced by: CSE SFD report
7.5 Selected pictures taken during visit
Figure 3: Private borewell (Source: Shantanu/CSE, 2015)
Figure 4: Bottled water for drinking purpose (Source: Shantanu/CSE, 2015)

Last Update: 29/01/2016 23
Agra
India Produced by: CSE SFD report
Figure 5: 78 MLD UASB technology Dhandpura STP (Source: Shantanu/CSE, 2015)
Figure 6: Sludge drying bed in Dhandupura STP (Source: Rahul/CSE, 2015)

Last Update: 29/01/2016 24
Agra
India Produced by: CSE SFD report
Figure 7: Outfall of Dhandupura STP (Source: Shantanu/CSE, 2015)
Figure 8: Open drain in the city (Source: Shantanu/CSE, 2015)

Last Update: 29/01/2016 25
Agra
India Produced by: CSE SFD report
Figure 9: Private vacuum tanker (Source: Rahul/CSE, 2015)
Figure 10: Open defecation site (Source: Shantanu/CSE, 2015)