seymour public schools school improvement plan€¦ · math (3rd - 5th grade 5th grade) 49% of...
TRANSCRIPT

Seymour Public Schools
School Improvement Plan
2018-2019
Mission of the Seymour Public Schools
The Mission of the Seymour Public Schools is to educate and inspire all students,
to enrich their experiences, and to prepare them to meet the challenges
of an ever changing world.
Name of School: Bungay Elementary School
Principal: Mary Sue Feige
Assistant Principal: Lauren Reid
Date: Fall 2018-Spring 2019
School-Wide Data Team Members
Name Role
Mary Sue Feige Principal Lauren Reid Kim Barton Dawn Black Kimberly Freeman Katie Furino Caitlin Jurkowski
Assistant Principal SRBI Mathematics Teacher Third Grade Teacher SRBI Language Arts Teacher Second Grade Teacher Computer Teacher
Christopher Cummings Carolyn Mucci
Fourth Grade Teacher Language Arts Consultant

Introduction This school improvement plan was collaboratively created to define the indicators and outline the strategies and actions that the schools will use to attain their goals and achieve their vision and mission. The school goals represent a reach, a challenge, and serve to inspire the entire school to work together to achieve and move beyond the current status. The District Theory of Action guides this work and is adapted at each school level to establish a through-line of consistency from the classrooms to the schools to the district.
School Vision Statement
Bungay Elementary School Children First
Courteous, Achieving, Responsible, Interested, Neighborly, Growing
School Mission Statement
The faculty and staff of Bungay Elementary School are committed to providing a respectful and engaging learning environment where all students are expected to achieve their maximum potential and become
lifelong learners.
Context Vocabulary SIP common vocabulary
Embedded within the school improvement plan (SIP) are terms commonly used within the educational setting and important to understanding the document.
Seymour Public Schools strongly believe that any assessment achievement levels should serve only as a starting point for discussion about the performance of students and of groups of students. Seymour Public Schools supports the development of the whole child and achievement levels should never be interpreted as infallible predictors of a student’s future.
MAP- (Measures of Academic Progress)- Math, language arts, and science assessments that measure what students know and informs teachers what they’re ready to learn next. The results help teachers track growth through the school year and over multiple years providing an accurate longitudinal picture whether a student performs on, above, or below grade level. MAP is administered up to three times each year (fall, winter, spring). Seymour looks for students to achieve in the high average and high
bands, which correlate to student goal scores falling within the 61st percentile and higher. These percentiles strongly correlate to success in college and career experiences. MAP RIT- The RIT (Rasch Unit) is an estimation of a student’s instructional level and compares the average growth of students who are in the same grade and who test in the same term. Every question on the MAP assessment is calibrated to the RIT scale and allows educators to trust it to track longitudinal growth. RIT Projections- Projected RIT scores are generated by the MAP assessment results and offer teachers a benchmark against which to measure expected student growth. Each grade level has approximate bands of expected growth defined. DRA2-The Developmental Reading Assessment, Second Edition is an individual reading assessment designed to assess students' reading performance. The primary purpose of the DRA2 is to enable teachers to observe, record and evaluate change in student reading performance, and to plan for and teach what each student needs to learn next. SB- Smarter Balanced- The Smarter Balanced assessment is administered to all students in grades 3-8 in Connecticut. While there are four achievement levels, level 4 being the highest performance level, Seymour looks for students to achieve in the range of At/Above Level 3. A level 3 student has met the achievement standard for English language arts/literacy expected for their designated grade. Students performing at this standard are demonstrating progress toward mastery of English language arts/literacy knowledge and skills. Students performing at this standard are on track for likely success in the next grade.
PSAT- The Preliminary SAT/National Merit Scholarship Qualifying Test (PSAT/NMSQT) is a standardized test administered in October of 2017-2018 to all students in grades 8, 9, 10, and 11. The PSAT assesses student achievement in math, reading, and writing.
SAT- The SAT is a standardized test administered in Seymour in 2017-2018 to all students in grade 11 and measures student achievement in math, reading, and writing.
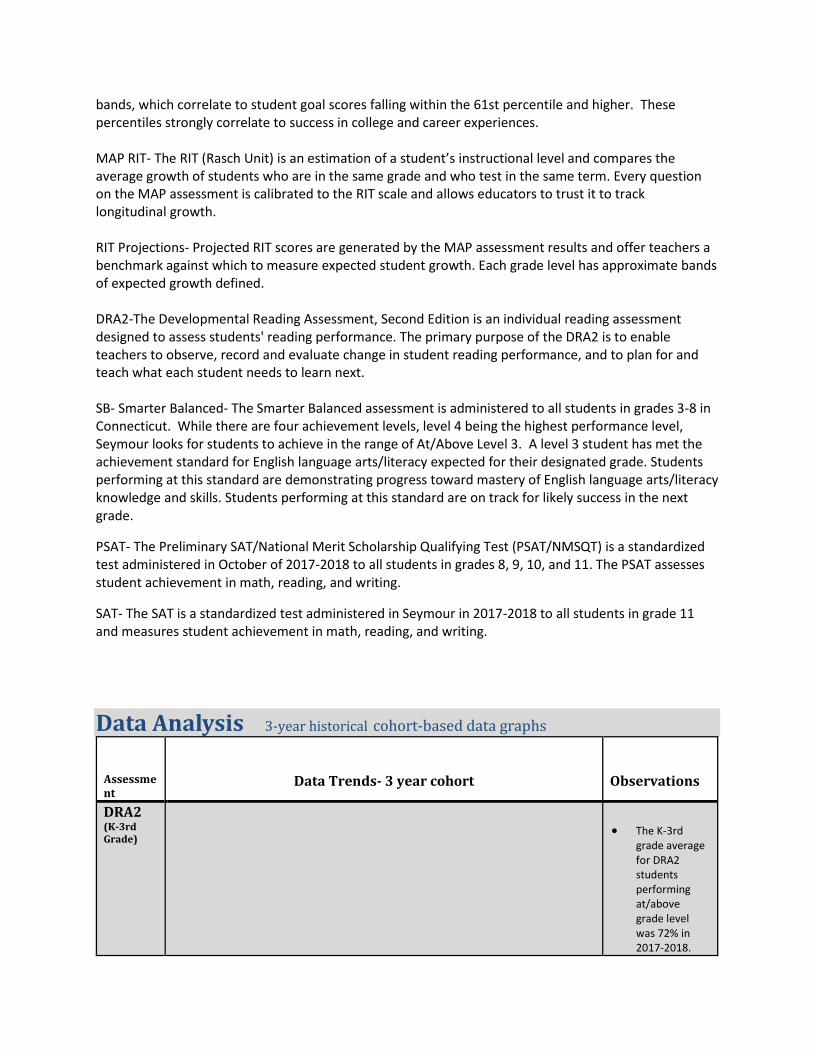
Data Analysis 3-year historical cohort-based data graphs
Assessment
Data Trends- 3 year cohort
Observations
DRA2 (K-3rd Grade)
The K-3rd
grade average for DRA2 students performing at/above grade level was 72% in 2017-2018.

First grade performed below the K-3 average on the DRA2.
Kindergarten, second and third grade performed above the K-3 average on the DRA2.
MAP - Reading (K - 5th Grade)
The K-5th
grade average for MAP reading assessment was 54% at/above grade level was in 2017-2018.
Class of 2028 had a significant decrease from K-1 to 2nd grade.

MAP - Math (K - 5th Grade)
The K-5th grade average for MAP math assessment was 53% at/above grade level was in 2017-2018.
The Class of 2026 has consistently made progress on the MAP Math assessment from K to 3rd grade.

SBAC - Reading (3rd - 5th Grade)
57.6% of 3rd-5th grade performed at level 3 and above grade level on the 2018 reading SBAC.
Overall, grades 3 and 5 saw an increase in the percent of students at level 3 and above.
SBAC - Math (3rd - 5th Grade)
49% of 3rd-
5th grade performed at level 3 and above grade level on the 2018 math SBAC.
The Class of 2026 had an increase in the percentage of students at/above grade level from 39% to 43%.
The Class of 2025 has shown an overall

decrease over the past two years.
CMT (5th Grade)
Took the pilot NGSS 2017-2018. CMT Science is no longer used.
Physical Fitness (4th Grade)
Overall
increase in meeting/exceeding in all 4 assessments over time 59.8% (2011-2012) to 75.3% (2017-2018).
Males have had the most students meet/exceed in all 4 assessments from 2011.
There are more females

(76.4%) than males (73.5%) meeting/exceeding in all 4 assessments in the 2017-2018 school year, even though the percentage of females meeting/exceeding decreased from 2016-2017 (78.3%).
Goals Goal #1: Improved Reading Performance
Reading continues to be a high priority in Seymour. Seymour’s core values state that all students can be successful learners. After carefully examining the data at the school level, we identified reading as a high priority need. At Bungay, we support this and believe that every student can learn to read and continually improve their reading skills towards the goal of becoming lifelong learners. We will continue to learn, practice, reflect and refine our approach with our instructional strategies and practices. The focus of this goal will contribute to student success in SPS by ensuring that all students have the tools that they need to be college and career ready.
I.Student Outcome Indicator
Statement of Student Outcome Indicator
1. The mean score for reading in
Kindergarten grade will increase from 138.2 to 158 as measured by the fall 2018 to the spring 2019 MAP assessment. (winter 150.7 growth of 12.5 pts, 7.3 pts needed to go)
2. The mean score for reading in first grade will increase from 163.4 to 182 as measured by the spring 2018 to the spring 2019 MAP assessment. (winter 176.7, growth of 13.3 pts, 5.3 pts needed to go) 3. The mean score for reading in second grade will increase from 176.8 to 190 as measured by the spring 2018 to the spring 2019 MAP assessment. (winter 180.3, growth of 3.5 pts, 9.7 pts needed to go)
Connection to District Goals
Seymour’s district goals continue to strive for improved student achievement in the area of reading. The efforts towards attaining the Bungay reading goal for the 2018-2019 school year also correlate to improving our students’ performance on the Smarter Balanced ELA assessment.

4. The mean score for reading in third grade will increase from 191.7 to 200 as measured by the spring 2018 to the spring 2019 MAP assessment. (winter 198.5, growth of 6.8 pts, 1.5 pts needed to go)
5. The mean score for reading in fourth grade will increase from 202 to 209 as measured by the spring 2018 to the spring 2019 MAP assessment. (winter 205.4, growth of 3.4 pts, 3.6 pts needed to go)
6. The mean score for reading in fifth grade will increase from 209.3 to 214 as measured by the spring 2018 to the spring 2019 MAP assessment. (winter 212.1, growth of 2.8 pts, 1.9 pts needed to go)
Student Outcome Indicator Rationale:
Upon analyzing the data from the past 3 years, we were looking to improve not only the cohort, but the grade level performance. We looked at the average growth of the cohort as well as the grade level in order to determine grade level SMART goals for the 2018-2019 year. Our goals are aligned with the district’s goals.
Results and Outcomes
II. Action Plan and Results Indicators -
Strategy
Timeline Person(s) Responsible
Indicator(s) of Success:
Teachers will use MAP Reports (Learning Continuum, Summary with Quadrant, Class Breakdown, and Student Profile) to pinpoint specific skill areas of need for individual students in order to differentiate within Tier 1 small group instruction.
-September through June -October and February check-in
Classroom Teachers during: -Flexible grouping -SRBI block -Morning data meetings
-Improved individual student performance on Reading MAP -Formative assessment data aligning to areas of need according to MAP
Professional Learning for staff on: -Reading and Writing Workshop (Lucy Calkins)
-September through June via faculty, grade level meetings and district PD with Patty Wright (Sept, Nov, Feb)
-Classroom Teachers -Administration and Data Team
-Informal walkthroughs -Pre/Post On Demands -TC running records (calibrated across grade levels)
Teachers will provide effective feedback, specifically guiding students to set a purpose
-September through June -December and April check-in
-Classroom Teachers through:
-Informal walkthroughs -Evidence of feedback (Artifact ex. reading and writing conference

through learning intentions and success criteria.
-Student driven goals -conferencing
records, completed rubrics, goal setting sheets, TC running records)
Teachers will share at-home reading strategies with parents.
-September through June
Certified staff -Friday Flash, parent workshops, teacher newsletters, communication applications and PowerSchool communication
Goal #2: Improved Mathematics Performance
Bungay School is striving to improve math performance in kindergarten through grade five. We seek to make consistent progress in the percentage of students meeting or exceeding their projected RIT targets as they progress from grade to grade. We will continue to learn, practice, reflect and refine our approach with our instructional strategies and practices. The focus of this goal will contribute to student success in SPS by ensuring that all students have the tools that they need to be college and career ready.
I. Student Outcome Indicator
Statement of Student Outcome Indicator
1. The mean score for mathematics in
Kindergarten grade will increase from 137.4 to 159 as measured by the fall 2018 to the spring 2019 MAP assessment. (winter 151.6, growth of 14.2 pts, 7.4 pts needed to go)
2. The mean score for mathematics in first grade will increase from 163.5 to 181 as measured by the spring 2018 to the spring 2019 MAP assessment. (winter 176.4, growth of 12.9 pts, 4.6 pts needed to go)
3. The mean score for mathematics in second grade will increase from 177.9 to 189 as measured by the spring 2018 to the spring 2019 MAP assessment. (winter 183, growth of 5.1 pts. 6 pts needed to go)
4. The mean score for mathematics in third grade will increase from 192.6 to 201 as measured by the
Connection to District Goals
Seymour’s district goals continue to strive for improved student achievement in the area of mathematics. The efforts towards attaining the Bungay math goal for the 2018-2019 school year also correlate to improving our students’ performance on the Smarter Balanced Math assessment.

spring 2018 to the spring 2019 MAP assessment. (winter 197.9, growth of 5.3 pts. 3.1 pts needed to go)
5. The mean score for mathematics in fourth grade will increase from 202.0 to 214 as measured by the spring 2018 to the spring 2019 MAP assessment. (winter 206.9, growth of 4.9 pts. 7.1 pts needed to go)
6. The mean score for mathematics in fifth grade will increase from 213.5 to 225 as measured by the spring 2018 to the spring 2019 MAP assessment. (winter 217.4, growth of 3.9 pts. 7.6 pts needed to go)
Student Outcome Indicator Rationale:
Upon analyzing the data from the past 3 years, we were looking to improve not only the cohort, but the grade level performance. We looked at the average growth of the cohort as well as the grade level in order to determine grade level SMART goals for the 2018-2019 year. Our goals are aligned with the district’s goals.
Results and Outcomes
III. Action Plan and Results Indicators
Strategy
Timeline Person(s) Responsible
Indicator(s) of Success:
Teachers will use MAP Reports (Learning Continuum, Summary with Quadrant, Class Breakdown, and Student Profile) to pinpoint specific skill areas of need for individual students in order to differentiate within Tier 1 small group instruction.
-September through June -October and February check-in
Classroom Teachers during: -Flexible grouping -SRBI block -Morning data meetings
-Improved individual student performance on Math MAP -Formative assessment data aligning to areas of need according to MAP
Teachers will identify and apply at least one CCSS standard for Mathematical Practice into their math instruction.
-September through June -November and May check-in
-Classroom Teachers -Morning data and grade level meetings
-Informal walkthroughs -Reflections, lesson samples, and artifacts of implemented CCSS standard for Mathematical Practice
Teachers will provide effective feedback, specifically guiding students to set a purpose through
-September through June
-Classroom Teacher through:
-Informal walkthroughs -Evidence of feedback (conference records, completed rubrics, goal

learning intentions and success criteria.
-December and April check-in
-Student driven goals -conferencing
setting sheets, Khan Mappers reflections, math fluency records, visible learning charts, data folders)
Teachers will share at-home math strategies with parents.
-September through June
Certified staff -Friday Flash, parent workshops, teacher newsletters, communication applications and PowerSchool communication
V. Communication Plan
Communication:
Bungay School administration will take the following actions to communicate the SIP plan: Post the SIP plan on the website no more than one week after final approval. Announce the goals of the plans at a PTA meeting no more than one month after final
approval. Review the goals and actions of the SIP plan in the Friday Flash- and e-document shared with
all Bungay parents. Share at-home strategies with parents through the Friday Flash, parent workshops, teacher
newsletters, and PowerSchool to support our school SIP Review the goals and actions of the SIP with staff through faculty meetings, grade level
meetings, morning data team meetings, and professional development. Display the plan’s goals, action plan and results indicators on a Data Wall in a visible location
in the school.
Baseline Data and Targets Assessment Grade
Level or Course
Subjects Measure Baseline Data
2015-16
Results 2017
Results 2018
DRA2 K Reading Students on/above spring benchmark
93% 70% 85%
DRA2 1 Reading Students on/above spring benchmark
75% 78% 58%
DRA2 2 Reading Students on/above spring benchmark
76% 70% 73%
DRA2 3 Reading Students on/above spring benchmark
65% 70% 74%
MAP K Reading Students meeting RIT projected target
80% 53% 72%

MAP K Math Students meeting RIT projected target
85% 53% 81%
MAP 1 Reading Students meeting RIT projected target
60% 67% 56%
MAP 1 Math Students meeting RIT projected target
41% 55% 41%
MAP 2 Reading Students meeting RIT projected target
51% 51% 37%
MAP 2 Math Students meeting RIT projected target
38% 46% 37%
MAP 3 Reading Students meeting RIT projected target
78% 60% 53%
MAP 3 Math Students meeting RIT projected target
66% 62% 57%
MAP 4 Reading Students meeting RIT projected target
67% 66% 59%
MAP 4 Math Students meeting RIT projected target
63% 76% 71%
MAP 5 Reading Students meeting RIT projected target
66% 45% 35%
MAP 5 Math Students meeting RIT projected target
48% 51% 42%
SB 3 Reading % of Students at Level 3 and above
60% 56% 59%
SB 3 Math % of Students at Level 3 and above
56% 39% 54%
SB 4 Reading % of Students at Level 3 and above
77% 67% 53%
SB 4 Math % of Students at Level 3 and above
48% 54% 43%
SB 5 Reading % of Students at Level 3 and above
58% 54% 61%
SB 5 Math % of Students at Level 3 and above
47% 45% 49%
CMT 5 Science Students at goal 63% 67% NA
CMT 5 Science Students at advanced 16% 15% NA
Physical Fitness
4 Fitness % meeting/exceeding in all 4 assessments
66% 74% 75%
Attendance K-5 Attendance Chronic Absenteeism by building
4.8% 3.3% 6.4%