sex differences in obesity rates in poor countries ... · nber working paper series sex differences...
TRANSCRIPT

NBER WORKING PAPER SERIES
SEX DIFFERENCES IN OBESITY RATES IN POOR COUNTRIES:EVIDENCE FROM SOUTH AFRICA
Anne CaseAlicia Menendez
Working Paper 13541http://www.nber.org/papers/w13541
NATIONAL BUREAU OF ECONOMIC RESEARCH1050 Massachusetts Avenue
Cambridge, MA 02138October 2007
This research has been supported by grants from the National Institute on Aging (R01 AG20275-01,P01 AG05842-14, and P30 AG024361). We thank Dr. Ingrid le Roux and the Philani Nutrition Programme,without whose generous help and guidance this project would not have been possible. The views expressedherein are those of the author(s) and do not necessarily reflect the views of the National Bureau ofEconomic Research.
© 2007 by Anne Case and Alicia Menendez. All rights reserved. Short sections of text, not to exceedtwo paragraphs, may be quoted without explicit permission provided that full credit, including © notice,is given to the source.

Sex Differences in Obesity Rates in Poor Countries: Evidence from South AfricaAnne Case and Alicia MenendezNBER Working Paper No. 13541October 2007JEL No. D13,I10
ABSTRACT
Globally, men and women face markedly different risks of obesity. In all but of handful of (primarilyWestern European) countries, obesity is more prevalent among women than men. In this paper, weexamine several potential explanations for this phenomenon. We analyze differences between menand women in reports and effects of the proximate causes of obesity -- physical exertion and foodintake -- and the underlying causes of obesity -- childhood and adult poverty, depression, and attitudesabout obesity. We evaluate the evidence for each explanation using data collected in an African townshipoutside of Cape Town. Three factors explain the greater obesity rates we find among women. Womenwho were nutritionally deprived as children are significantly more likely to be obese as adults, whilemen who were deprived as children face no greater risk. In addition, women of higher adult socioeconomicstatus are significantly more likely to be obese, which is not true for men. These two factors can fullyexplain the difference in obesity rates we find in our sample. Finally (and more speculatively), women'sperceptions of an 'ideal' female body are larger than men's perceptions of the 'ideal' male body, andindividuals with larger 'ideal' body images are significantly more likely to be obese.
Anne Case367 Wallace HallPrinceton UniversityPrinceton, NJ 08544-1022and [email protected]
Alicia MenendezHarris School of Public PolicyUniversity of ChicagoChicago, IL [email protected]

1
1. Introduction
People living in developing countries are burdened not only by the infectious diseases of
the developing world, but increasingly by the chronic diseases of the developed world.
The incidence of obesity is on the rise in many poor countries (Popkin and Doak 1998).
Globally, men and women face different risks of obesity. Data from the World Health
Organization (WHO) suggest that, in all but of handful of (primarily Western European)
countries, obesity is more prevalent among women than men. In 138 of 194 countries for
which the WHO reports obesity statistics, women were more than 50 percent more likely
to be obese than were men (WHO Global InfoBase: obesity and overweight, available
online at http://www.who.int/topics/obesity/en/). The prevalence of obesity among
women in Southern Africa is particularly high (Martorell et al 2000). In South Africa,
Puoane et al. (2002) find that 60 percent of African (Black) women in 1998 were either
overweight or obese, with rates of obesity five times higher for Black women than for
Black men.1
Chronic health risks associated with obesity include, inter alia, hypertension,
coronary heart disease, stroke and diabetes. Recent work concludes that overweight
Africans are not immune to these risks. In one rural demographic surveillance site in
South Africa, where nearly 50 percent of women are overweight or obese, women with
higher body mass indices (BMI) were found to be at higher risk of hypertension (Case
and Deaton 2006). The two largest killers in that field site, among residents aged 50 and
1 We follow World Health Organization classifications that a person is overweight if his or her body mass index (BMI) – a measure of weight for height (kilograms per meter squared) – lies between 25 and 30, and is obese if his or her BMI is greater than 30. For example, a person 5 foot 4 inches tall would be classified as overweight if her weight were above 145 pounds, and obese if her weight were greater than 175 pounds.

2
above, are stroke and congestive heart failure – both diseases associated with obesity
(Kahn et al. 1999).
Recent literature points to several risk factors for obesity in developing countries.
The focus of this work is generally on factors that shift the calorie intake-expenditure
balance, including increased urbanization, which can lead to a reduction in physical
activity; the availability of lower priced calories, which can lead to greater calorie
consumption; and a “Westernization” of diets (Popkin 1994, WHO 2000). FAO (2006)
cites the importation of high-fat foods into low income countries as a central underlying
cause of the pandemic.
All of these factors may contribute to the increased prevalence in obesity in the
developing world. However, by themselves these factors cannot explain why the rates of
obesity are significantly higher for women than for men in developing countries. In this
paper, we examine several potential explanations for the much higher obesity rate
observed for African women in South Africa. Specifically, we analyze differences
between men and women in reports and effects of the proximate causes of obesity—
physical exertion and food intake—and underlying causes of obesity—childhood and
adult poverty, depression, and attitudes about obesity. We evaluate the evidence for each
explanation using data collected in 2004 and 2005 on the health, mental health and
socioeconomic circumstances of individuals living in Khayelitsha, an African township
outside of Cape Town, South Africa.
Three factors explain the greater obesity rates we find among women. Women who
were nutritionally deprived as children are significantly more likely to be obese as adults,
while men who were deprived as children face no significantly greater risk of obesity. In
3
addition, women of higher adult socioeconomic status (SES) are significantly more likely
to be obese, which is not true for men. These two factors can fully explain the difference
in obesity rates between men and women in our sample. Finally (and more speculatively),
women’s perceptions of an ‘ideal’ female body are larger than men’s perceptions of the
‘ideal’ male body, and individuals with higher ‘ideal’ body images are significantly more
likely to be obese. On average, South African Black women report that their body size
accords with their ‘ideal’ at a body mass index (BMI) of 30 – the lower bound of the
World Health Organization’s definition of obesity.
In what follows, we examine sex differences in obesity rates in South Africa. The
next section presents a model of the proximate and underlying causes of obesity. In
addition, it presents a decomposition of obesity into component parts, which we use to
discuss differences in obesity rates between men and women. Section 3 provides an
introduction to our data, and Section 4 presents results on the determinants of obesity in
South African women and men. Section 5 discusses mechanisms through which
childhood and adult SES appear to differentially affect women’s and men’s obesity, and
Section 6 highlights implications of these findings for health interventions and suggests
avenues for future research.
2. Proximate and Underlying Causes of Obesity
Proximate causes of obesity
Obesity results from an imbalance between calorie intake and expenditure. Adults
surveyed in Khayelitsha were asked many questions about food and drink, and about
physical activities. These behaviors ( bx ) are the observable components of energy intake

4
and expenditure that we use to characterize the proximate causes of obesity. We write the
probability that an individual is obese ( 1y = ) as a function of the observable proximate
causes:
(1) ( 1) b bP y x uγ= = + .
The survey does not capture all calorie intake and expenditure. There are many questions
(for example, about the amount of oil that goes into the cooking pot, and more generally
the fat content of foods consumed) that are difficult to ask with any precision. The error
component of (1), then, will contain several measures of energy intake and expenditure
that influence obesity. We can re-write the error term to reflect this,
* *b bu x eγ= + ,
where *bx represent those elements of calorie intake and expenditure that are not captured
by the survey. We can then re-write equation (1) to reflect also the latent determinants of
obesity:
(2) * *( 1) b b b bP y x x eγ γ= = + + .
Underlying causes of obesity
Obesity may depend on factors individuals encounter at different points in the life course.
Childhood deprivation may change the probability of obesity in adulthood directly,

5
through its effects on metabolic function. In addition, childhood poverty may determine
educational attainment and financial status in adulthood, which may affect consumption
patterns. Adults’ attitudes, and their dispositions toward depression, can also affect their
calorie balance. We refer to these collectively as the underlying factors affecting the
probability of obesity.
We formalize this by representing the observable and latent components of energy
intake and expenditure as a function of vectors of childhood circumstances ( cx ), adult
socioeconomic status ( sx ), and adult attitudes, predispositions toward depression, and
perceptions of the ideal body ( dx ). That is
* * * *
b c c s s d d
b c c s s d d
x x x x vx x x x
α α αα α α ω
= + + += + + +
Substitution of these underlying characteristics into (2) allows us to express the
association between obesity and its underlying causes as
(3) P( 1) c c s s d dy x x xβ β β ε= = + + + .
The coefficients on childhood and adult circumstances reflect both the observable and
latent determinants of obesity. The coefficients on childhood variables, for example,
measure the extent to which childhood circumstances affect relevant observable and
latent behaviors, interacted with the extent to which these behaviors change the
probability of obesity: * *c c b c bβ α γ α γ= + .

6
We can estimate equations (1) and (3) to quantify the proximate and underlying
causes of obesity. We can also use these equations to characterize the reasons for
women’s much greater rates of obesity. We quantify differences between men and
women in their endowments of variables that determine obesity, and differences in the
impact of these variables, by decomposing equations (1) and (3) using a Blinder-Oaxaca
decomposition. Re-writing equation (3) for women (F) and men (M) as
P ( 1)k k ki i
iy x eβ= = +∑ for ,k F M= ,
the difference in obesity rates between women and men can be expressed as a severity
effect, which measures the differences between sexes in the extent to which individual
characteristics affect obesity; and a prevalence effect, which measures differences in
endowments of characteristics thought to influence obesity; and a residual, which picks
up any remaining differences in rates between men and women. The severity effect can
be written
(4) severity effect ( )F Mi i ii
xβ β= −∑
where ix is the mean of characteristic i over the sample. The prevalence effect can be
written
(5) prevalence effect ( )F Mi i ii
x x β= −∑

7
where kix measures the mean of characteristic i for sex k in the sample, and iβ is the
mean of the response to characteristic i averaged between that estimated for women and
that estimated for men. To the extent that one sex is more heavily endowed with a
characteristic that affects obesity, this will contribute to the prevalence effect. We
estimate the severity and prevalence effects for both the proximate and underlying causes
of obesity, and present them in Section 4.
There are many reasons why childhood circumstance, adult SES, and adult
attitudes could lead to differences in obesity rates between men and women.
Childhood circumstance
In animal studies, males and females have been shown to respond differently to early
postnatal exposure to hypothalamic neuropeptides known to affect the appetite regulation
system. Varma et al. (2003), for example, find significant sex differences in early life
exposure to neuropeptide Y on adult weight control in rats. They suggest that differences
between males and females may be due to differential effects of sex steroids on
neuropeptide synthesis and/or release. Early life conditions may have permanent effects
on appetite regulation, feeding behaviors, and body weight gain patterns. In our data, we
can examine whether and to what extent men and women raised in poor households,
specifically those who report having gone hungry as children, face different risks of
obesity, which would be consistent with a differential impact of early life nutritional
deprivation on appetite and weight regulation in adulthood.

8
Adult socioeconomic status
An extensive literature has documented the extent to which resource allocation can vary
by sex within households, in both developed and developing countries (see Bergstrom
1997 for a review). In many studies, women have been found to have a greater say in
household decisions when their incomes constitute a higher fraction of total household
income. When resources are scarce, women may choose not to eat, to guarantee that there
is enough food for children. Indeed, lack of household resources in South Africa has been
shown to be significantly correlated with adults missing meals there (Case 2004). In
addition, when resources are scarce, women may have less say in how money in the
household is spent. Making decisions on who should eat, and having the power to make
decisions on food spending, may result in differences in male-female obesity rates at
different levels of household SES. In our data, we can examine whether and to what
extent current household economic status is associated with differential obesity in men
and women, and whether differences in obesity rates by SES can be explained by
differences in women’s decision-making power in the household.
Depression
On average, South African women report suffering from a greater number of symptoms
of depression than do South African men (Case and Deaton 2006). Studies in the US have
generally found a positive association between obesity and depression in women, and
either a negative association, or no association, between obesity and depression in men
(See Onyike et al. 2003, and references there.) Depression may change eating patterns,
and may lead to differential weight gain between men and women. In our data, we can

9
examine both the extent to which men and women differ in their reports of depression,
and the extent to which depression correlates differentially with obesity between men and
women.
Perceptions of body sizes
Women and men’s opinions on the relative attractiveness of different body shapes could
potentially affect the sizes to which they aspire. Across cultures, significant differences
have been found in evaluations of body images. Holdsworth et al. (2004) show that,
among Senegalese women, overweight figures are regarded as attractive and are
associated with positive personal characteristics. Furnham and Baguma (1994) find
significant differences in what is considered beautiful and healthy, in a comparison
between Ugandan and British college students. Ugandans rate more obese bodies as more
attractive and healthier than British student do, particularly in the case of female figures.
In our data, we can examine the extent to which differences in obesity rates are associated
with differences in male and female perceptions of what constitutes an ‘ideal’ male and
female body.
In the following section, we introduce the data we collected in South Africa to
examine the difference we observe in obesity rates between men and women.
3. Data
In 2004 and 2005, we collected data on 500 randomly selected households in
Khayelitsha, an African township with a population in excess of 500,000 people. The
township contains both houses with access to water and electricity, and shacks with

10
access to neither. Most households have a family connection to the Eastern Cape, one of
the poorest parts of South Africa (Leibbrandt et al. 2005), from which family members
originally migrated. Poverty rates in the township are high, and the community faces
major health problems in HIV and AIDS, TB, violence and malnutrition.
We surveyed every adult living in our sampled households individually, asking
each about his or her family background, income and earnings, general health and mental
health, and health related behaviors. All adults were weighed and measured.2
Table 1 presents summary statistics for 975 individuals, out of the 1001 adults in
our 2004 and 2005 samples, for whom we have a BMI reading.3 Our focus is largely on
the differences in obesity prevalence between the sexes, and for this reason we present
the p-value of the statistical significance of the difference in sample means between men
and women in column 3.
Three-quarters of the women in our sample are either overweight or obese, true of
only thirty percent of men surveyed. The patterns observed between and within sexes are
similar to those found among urban Africans (Blacks) in the 1998 South African
Demographic and Health Survey. (Results available upon request.)
The BMI-age profiles underlying these statistics are presented in Figure 1. Similar
to the patterns found in other parts of South Africa, we find BMI increasing with age
until age 40. Thereafter, BMI is approximately constant with age. For women,
2 These households were originally interviewed in 2002 and 2003. In the 2004 and 2005 follow-up, we succeeded in reinterviewing 427 original households, and 9 households where members had split from our original sample. 3 Sex is missing for one observation. Of the remaining 25 missing values, height measurements were missing for 7 persons too ill to stand; 7 who did not want to be measured; and 6 persons for whom no reason for refusal was given. In addition, weight measurements were missing for one person too large for our scales (350 pounds), and 4 pregnant women.

11
stabilization in BMI occurs at a BMI well in excess of 30. For men, it occurs at a BMI
just shy of 25, the WHO lower bound for ‘overweight.’ From this cross-section, we
cannot know whether these patterns represent age or cohort effects. The cross-section
cannot tell us whether today’s 20 year old women, at age 35, will continue to have
average BMIs of 25 (as they do at age 20), or whether their BMIs will more closely
resemble those of today’s 35 year olds.
In addition to the age pattern, the other obvious pattern observable in Figure 1 is
that, at every age, women’s BMIs are 5 to 8 points higher than men’s. Even the youngest
women in our sample are overweight on average, registering BMIs in excess of 25.
Table 1 also presents summary statistics on variables we will use to examine
determinants of obesity and male-female differences in prevalence rates.
Proximate causes
We asked all individuals about their eating habits, and had them report on the sizes of
their meals. A significantly greater proportion of men than women report eating large
meals, based on their identification of the most accurate portion sizes among pictures
they were shown. Men are also more likely to report drinking soda, while women report
using more sugar in tea and coffee over the course of a day. There are large outliers in
reported sugar use. For this reason, in our analysis we will use a sugar index, equal to 0 if
no sugar is reported, equal to 1 if 1 to 9 spoonfuls per day are reported, equal to 2 if 10 to
19 spoonfuls are reported, and so on up to a measure of 5, if 40 or more spoonfuls per
day are reported.

12
Men are significantly more likely to report that they exercise and participate in
sports, although neither men nor women report much by way of physical activity. We
will examine below the extent to which these differences can explain women’s greater
obesity rates.4
Underlying causes: childhood circumstances
We did not observe these adults as children, and so it is not possible to measure with any
precision the nutritional risks they faced in early life. However, subjects had little
difficulty telling us whether, as children, there were times when they went to school
hungry, went to bed hungry, or ate at other people’s homes because there was not enough
food at home. More than a third of men and women report having gone to school and to
bed hungry, and just over a quarter report having gone to other homes to eat. Differences
between men and women in these reports are small, and are not statistically significant.
In our analysis, we will use a ‘childhood hunger index,’ which we define as the
sum of reports that a respondent went to school hungry, went to bed hungry, and ate at
other people’s houses because there was not enough food at home. Almost 60 percent of
our sample report none of these events in childhood. Of the rest, approximately 10
percent report one of the three, 10 percent report two of the three, and 20 percent report
all three. The overall means for men (1.02) and women (0.98) are very similar.
Adult SES
4 We asked all adults about alcohol consumption. However, rates reported were very low, and we believe respondents may have been reluctant to talk about alcohol use. We will treat alcohol consumption as a latent proximate determinant of obesity.

13
Both men and women have completed more than 6 years of schooling, with women
reporting an extra half year, on average, relative to men. Educational attainment provides
one of our measures of adult SES. An individual’s current financial situation, measured
using income per person and household-level expenditures per person, provides the other.
A ‘knowledgeable household member’ (KHM) was asked about earnings, social transfers
from the government (primarily pensions and grants), and private transfers coming into
the household in a typical month, from which we generate a measure of income per
person. In addition the KHM was asked about household-level expenditures in a normal
month, including spending on food, rent, utilities, fuel, household phones, and furniture,
from which we generate a measure of household-level expenditure per person.
Income per person is substantially higher than expenditure per person, because we
have not included personal spending (clothing, personal cell phones, transportation, for
example) in our measure of household spending. On average, men are residing in slightly
wealthier households, with household-level expenditures per person 10 percent higher,
and income per person 20 percent higher, than those found for women.
These two measures of resources available in the household were constructed in
different ways, with expenditures aggregated up from spending on such items as meat,
bread, electricity and paraffin, and incomes aggregated up from reported receipts of child
support grants, old age pensions, and earnings, for example. We are interested in whether
the SES-obesity patterns we observe are robust to the measure of SES that we choose.
Depression

14
We are also interested in whether stress and depression play a role in obesity. We asked
each person whether he or she had experienced any of 8 symptoms of depression in the
last week and, if so, whether each occurred ‘most of the time,” “some of the time,” or
“hardly ever.” We asked about depression, sadness, crying, poor appetite, trouble
sleeping, everything being an effort, feeling miserable, and not feeling able to ‘get
going.’ From the answers received, we created a depression index, which is the sum of
the number of times a person reported he or she had felt this symptom ‘some of the time,’
or ‘most of the time.’ Women report significantly more depression symptoms than do
men in our sample. On average, women report that they had experienced three of these
symptoms ‘some’ or ‘most of the time’ in the past week, while men report two
symptoms.
Body images
Every person interviewed was asked their perceptions about body images. Following an
introduction that “Sometimes we have ideas about how we look, and how we might like
to look,” the respondents were shown pictures of eight people of their sex, whose images
varied from being bone thin (rated as a 1) to being morbidly obese (rated as an 8). These
figures were originally used by Ziebland et al. (2002), who gave us permission to use
them in our survey work. We reproduce them here, in Figure 2. Each respondent was
asked which best described their body size, and which best described the shape they
would most like to have. Women on average perceive themselves to have a body size of
‘4,’ and on average see a ‘4’ as the ‘ideal’ body. Men see themselves as somewhat
lighter, and on average would like to be a bit heavier.

15
In summary, women and men report significant differences in their food
consumption patterns, reports of sports and exercise, depression symptoms, and ideas of
an ‘ideal’ body shape. Women have slightly more education, but are living in households
that are marginally poorer, on average. We turn in the next section to evaluate the extent
to which these proximate and underlying causes can explain the patterns of obesity we
find in South Africa.
4. Determinants of obesity in South Africa
Table 2 presents estimates of the proximate causes of obesity from OLS regressions run
separately for men and women. All regressions include controls for age, age squared, an
indicator for the survey year, and a constant term. Standard errors, which allow for
correlation in the unobservables for individuals from the same households, are presented
in parentheses under the regression coefficients. (Marginal effects from probit regressions
are very similar. We focus on the OLS results because they allow an exact linear
decomposition of sex differences into component parts.)
For women, meal sizes, drinking soda, and the sugar added to tea and coffee are
all significantly associated with obesity. Our sugar index is in increments of 10
spoonfuls, so that a woman who adds 15 teaspoons of sugar to her tea over the course of
a day is 10 percentage points more likely to be obese (2 times 0.05) than a woman who
reports adding no sugar. For men, neither large meal sizes nor reported sugar intake is
associated with obesity, while drinking soda is marginally significantly associated with
obesity. Reporting exercise or sports is not associated with lower probability of obesity
for either men or women.

16
Overall, women’s reported food intake is significantly associated with obesity (an
F-test of the joint significance of the food intake variables takes a value of 4.27, with a p-
value of 0.006). Women’s observable energy expenditure variables are not significantly
associated with obesity. For men, neither reported calorie intake nor calorie expenditure
is significantly associated with obesity.
We can use the results in Table 2 to examine whether observable calorie intake
and expenditure can explain differences in obesity rates between women and men, by
decomposing the proximate causes of obesity into severity and prevalence effects. These
are presented in Table 3. Sugar intake can explain 6.0 percentage points of the difference
between obesity rates between men and women; large meals, 2.1 percentage points; and
soda, 1.1 percentage points. We find that, collectively, the observable proximate causes
can explain about 20 percent of the difference in obesity rates between men and women
(0.085/0.402). All of this explained difference is due to differences in the impact of
reported food intake on obesity in women (the severity effect). Men are more likely to
report sports and exercise. However, because these are not associated with obesity (or
lack of obesity) for men or women, the prevalence effects are very small.
Too few observable energy intake and expenditure variables are available to
estimate the impact of different proximate causes with any precision. We turn to the
underlying causes of obesity, which indirectly pick up the effects of both observable and
latent energy variables.
Table 4 presents evidence from a variety of specifications of the underlying causes of
obesity. For women and men separately, the first column regresses obesity on our
childhood hunger index, and on the log of income per household member, as well as

17
education, and our depression index. The second column interacts log(income per
member) with the childhood deprivation measure, to test whether respondents who were
poor in childhood are at greater risk for obesity if they have greater access to resources
in adulthood. The third column replicates the second, but uses log(expenditure per
member) in place of income, to test the robustness of our findings.
For women, childhood deprivation, measured using our childhood hunger index, is
positively and significantly associated with obesity. Women who reported going to bed
hungry, and to school hungry, and who ate at others’ houses because there wasn’t enough
food, are 15 percentage points more likely to be obese than are women who report none
of these. This result holds with or without controls for current socioeconomic status.
Higher socioeconomic status in adulthood, measured using years of education, is
positively and significantly related to obesity in women. In addition, women in
households with greater resources, measured using the log of income per member, are
significantly more likely to be obese. Moving a woman from the 25th percentile to the
75th percentile of the distribution of income per person (measured at either the individual
or the household level) is associated with an increase in obesity among women of 10
percentage points.
We examine the extent to which current household resources have differential effects
on women, depending on whether they were poor as children, by adding a child poverty-
household income interaction term in column 2. Neither the childhood deprivation
measure nor the interaction term is significant by itself. However, jointly they are
significant (F-test=4.67, p-value=0.010). This is consistent with a model in which greater
deprivation in childhood has larger effects in adulthood among those who are wealthier in

18
adulthood. We find a similar pattern when we use log(expenditure per member) in place
of log(income per member), in column 3.
Depression is not significantly associated with obesity in women. This continues to
be true when the 8 component pieces of the index are entered separately, and when we
divide responses into those reporting depression symptoms ‘some’ of the time, and those
reporting them ‘most’ of the time. (These results were estimated, but are not reported in
our tables).
The association between obesity and individual and household characteristics is
altogether different for men. While men are equally likely to report having been raised in
poor households, such reports by men are not associated with higher rates of obesity
(column 4). In addition, current SES, measured using log(income per member) or
log(expenditure per member), has no significant association with obesity in men. Male
obesity is also orthogonal to reports of depression. We find a small, marginally
significant effect of education on obesity in men.
We decompose the differences between women and men into severity and prevalence
effects in Table 5. As was true of proximate causes of obesity, the decomposition
underscores the fact that differences in obesity are not due to differences in endowments
of the economic variables examined here—the prevalence effect is very close to zero
(−0.001). Obesity differences between the sexes appear, instead, to be due to the
differences that socioeconomic status has on the probability of obesity. Aggregating the
effect of childhood hunger and its interaction effect with income, we find that childhood
hunger accounts for 13 percent of the difference in obesity rates between women and men
(0.053/0.402). The impact of education accounts for 16 percent of the difference

19
(0.063/0.402). Two-thirds of the difference between men and women is due to the
difference in the impact of current household resources on obesity.
Differences in the impact of current and past economic circumstances explain 100
percent of the difference in obesity rates by sex in our sample. We turn next to examine
what these differences in the impact of SES may reflect.
5. Understanding the effects of SES on obesity
Childhood deprivation
Our childhood hunger index measures the extent to which respondents went hungry in
childhood. We can distinguish whether its effects on women’s obesity in adulthood
appear to be due to nutritional deprivation, or to poverty more broadly, by examining
several other measures of childhood deprivation that we collected on each respondent.
We asked each whether his or her financial situation in childhood was “very comfortable,
comfortable, just getting by, poor or very poor.” Fifty percent of respondents answered
that their households were “just getting by,” and 37 percent that they were “poor” or
“very poor.” In addition, we asked respondents whether their fathers had stable
employment (a “regular pay job”) when they were children (true for approximately two-
thirds of respondents).
Table 6 presents results of our childhood hunger index regressed against
indicators of financial status in childhood and of whether the respondent’s father had a
regular pay job. Our hunger index is highly correlated with these measures of childhood
economic status, as can be seen in the first two columns of the table. For both men and
women, father not having had a regular pay job is associated with an increase of 0.2 in

20
our childhood hunger index. The associations between the childhood hunger index and
reports on childhood financial status are very similar between men and women. Adults
who report that their families’ financial situations were either “very comfortable” or
“comfortable” have a hunger index that is, on average, 2.2 points lower than those who
report that their families were “very poor,” the reference group for this regression. Those
whose families were “just getting by” report a hunger index that is 1.7 to 1.8 points
lower, and those whose families were “poor” report a hunger index that is 0.5 to 0.6
points lower than those whose families were “very poor.” The difference between
reporting that their families were “comfortable” and reporting that they were “just getting
by” is significant, as is the difference between reporting “just getting by” and being
“poor.” Jointly, the reports of childhood financial wellbeing are highly significant for
both women (F-test=101.3, p-value=0.000) and men (F-test=60.3, p-value=0.000).
We test whether it is nutritional deprivation, or economic deprivation in childhood
more broadly, that is associated with obesity in adult women, by adding all three
measures of childhood SES to our obesity equations. Results from these regressions are
presented in the last two columns of Table 6. We find that the inclusion of indicators of
family financial status in childhood, and of whether the respondents’ fathers held regular
pay jobs, are not significantly associated with obesity for either women or men. The only
measure of childhood circumstance that is significantly associated with obesity in
adulthood is our indicator of hunger in childhood for women. With or without the
additional controls for childhood SES, we find that each unit increase in our childhood
hunger index is associated with a five percentage point increase in the probability that a
woman is obese.

21
Future work is warranted to see what aspects of childhood nutritional deprivation
are responsible for adult obesity in women. Such work must combine biology and social
science, if we are to understand why this effect in childhood affects only women. Such
work may also help us better understand the seemingly ironic finding that poor countries
struggling with malnutrition must also cope with obesity.
Adult SES
We find that, for women, obesity is associated with higher adult SES. The same is not
true for men. In this section, we examine potential explanations for this difference. We
present our findings in two parts. We find that women’s own incomes fully explain the
association between total household income and women’s obesity. Part of the association
between women’s incomes and their obesity appears to work through wealthier women’s
decision-making role in food spending: women with higher incomes appear to have
greater control over household food spending. After presenting these results, we ask why
women’s control over resources would lead them to be obese, while men’s control over
resources does not. Given that women and men have different perceptions of ‘ideal’ body
shapes, we examine whether they use the resources under their command to move toward
different ideals.
Women’s incomes, household decision-making, and obesity
Control over resources may be one of the mechanisms contributing to the relationship
between adult SES and women’s obesity. We examine this in Table 7, where we regress
the probability of being obese on different components of household income, with and

22
without controls for who has the most say in food spending. In order to analyze different
parts of household income, we present results for income in levels, rather than in logs, so
that we do not lose observations for respondents who did not earn money.
Consistent with the results presented in Table 4, we find that women residing in
households with greater total household income are significantly more likely to be obese.
Men face no increased risk of obesity with household income (column 4).
Decomposing total household income into component parts (column 2) makes it
clear that the association between household income and a woman’s obesity is driven by
women’s own income. The two large sources of income for women in our survey are
women’s own earnings, and their receipt of child support grants. Fully a third of all
women earn income from working, and a third receives a child support grant from the
government.5 When we add women’s income from these sources, both women’s earnings
and their child grant receipt are positively and significantly correlated with obesity, while
the estimated effect of total household income becomes smaller and insignificantly
different from zero. On average, each additional R1000 per month in earnings is
associated with a 6.2 percentage point increase in obesity for women, holding all else
constant. Women receiving R170 in the form of a government child support grant are 5.7
percentage points more likely to be obese than are women not receiving a grant (0.337 ×
0.170). For men we find no effect of either total household income (column 4), or own
earnings (column 5), on obesity.
5In contrast, only 5 percent of women report receipt of an old age pension (most are not age
eligible). Another 5 percent report a disability grant. With respect to child support grants, at the time of our survey, children from ages 0 to 7 were eligible to receive between R160 to R180 per month through a primary care giver, who is generally (but not restricted to be) the child’s mother, if the primary care giver’s monthly income was less than R1100 and he or she was living in an informal house or shack. Men are only rarely reported to be child grant recipients. In our data, 3 men were so named.

23
Total household income is not significantly correlated with women’s obesity in
regressions that include both total household income and women’s own incomes, while
women’s incomes are significantly correlated with obesity. This suggests that a woman’s
own income, and income coming into her household from other sources, have different
effects on her calorie intake and expenditure, on average.
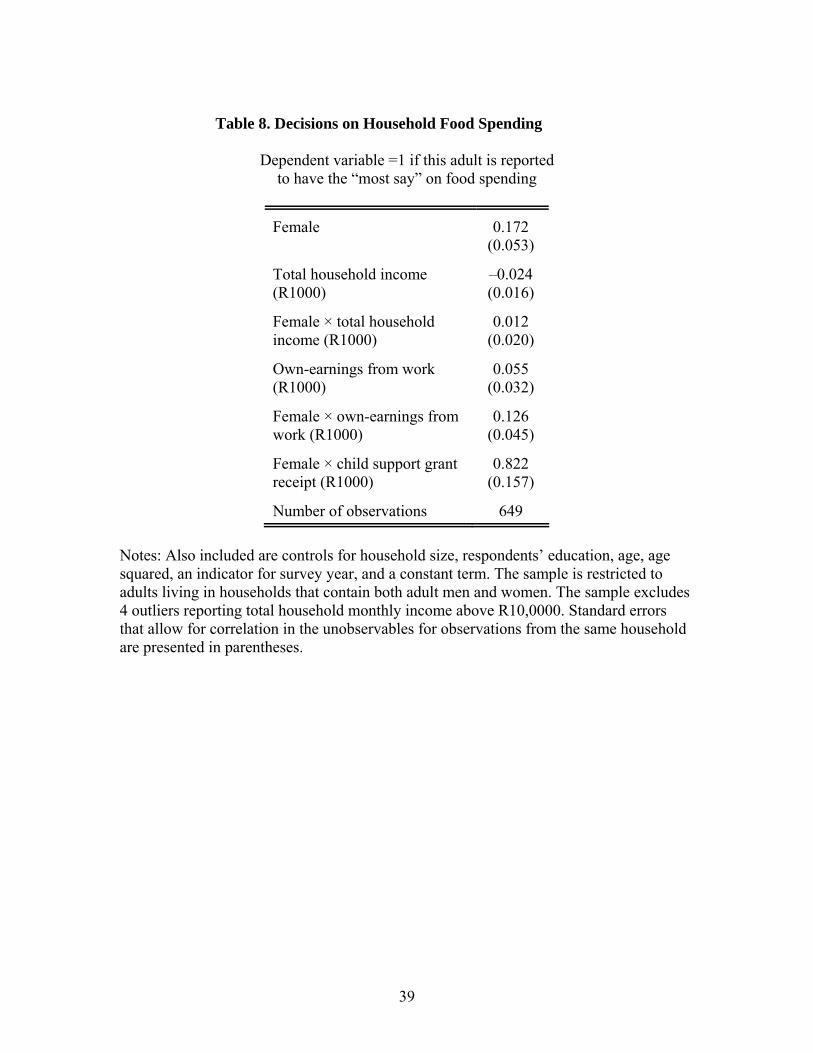
Part of this difference appears to work through the fact that women are
significantly more likely to control household food spending when their own incomes are
higher. In the household module of our Khayelitsha survey, we asked the knowledgeable
household member which members of the household “had the most say in decisions
about spending on food.” Table 8 presents regression results for being identified as such a
decision-maker, for all adults living in households that contain both adult men and
women as members. We present regression results for having ‘the most say’ on food
spending regressed on total household income and its interaction with being female,
earnings from work and its interaction with being female, and child grant receipt (here
only interacted with being female, since men only rarely receive child support grants). In
this regression, we control for the member’s education, age, and age squared, which may
affect a member’s decision-making powers within the household, and for the number of
household members, which may reduce the odds that any given person is named as the
decision-maker.
We find that women’s incomes make them significantly more likely to be
reported as the decision-maker for household food spending. Controlling for women’s
own incomes, the effect of total household income is small and insignificantly different

24
from zero. A woman’s own income appears to increase her voice in household food
spending decisions.
In turn, being the decision-maker for household food spending is significantly
associated with obesity in women. On average, women who have the most say in
household food spending are 10 percentage points more likely to be obese. (See column 3
of Table 7.) Inclusion of an indicator that the respondent has been identified as having the
most say on food spending reduces the estimated effects of own-earnings and child grant
receipt on women’s obesity by more than 20 percent. As was true of our earlier results,
we find no effects of total household income, or own-earnings, or having the most say on
food spending, on men’s obesity.
Most of the effect of women’s incomes on obesity works through latent calorie
intake and expenditure variables. There is no significant association between women’s
own-earnings and reported meal sizes, or reported exercise or sports. Women who
receive child support grants report significantly higher sugar intake. Those who report
higher earnings are more likely to report that they drink soda. Taken overall, there must
be many unobserved energy variables that vary with women’s incomes.
Why are women with higher incomes more likely to be obese? One possibility is
that women admire larger body sizes. When we ask women about their body size, we find
that women with larger BMIs are significantly more likely to report that they are larger,
measured using the body size pictures. On average, each one-unit increase in BMI is
associated with women stating that their own body size is 0.12 pictures larger. Figure 3
presents evidence that, on average in our survey, a woman’s perceived body size equals
her ideal body size at a BMI just below 30 – which is the WHO lower bound for obesity.

25
Women with BMIs below thirty, on average, report that their ‘ideal’ is larger than their
actual body size, while women with BMIs above thirty believe their ideal is below their
actual size. On average, women’s ideal size is equal to her self-perceived body size at a
BMI of 29.45. In contrast, for men, ideal size is equal to self-perceived body size at a
BMI of 24.23. If women are targeting a BMI of 30, while men are targeting a BMI of 25,
this could lead to women with money using it, in part, to move their BMIs toward 30.
6. Conclusions
Using data from an African township in South Africa, we are able to identify the
underlying causes of differences between men’s and women’s obesity. We find that
poverty in childhood, and greater access to resources in adulthood, lead women to be at
significantly greater risk of obesity than are men. In adulthood, there is a significant and
substantial difference in the body sizes to which men and women aspire. Women with
more control over their resources may use these resources to reach and maintain larger
body sizes.
Economic research has highlighted the positive child outcomes associated with
putting money into women’s hands. (See, for example, Hoddinott and Haddad 1995.)
However, this may come at a cost, if it increases the probability that women become
obese.
Understanding the differences that men and women face in their risks of obesity is
a necessary and important first step for effective policy intervention. If women aspire to
large body sizes, then we would not expect a campaign to spread general information on
the calorie, fat and nutrition content of food would take us very far in reducing the

26
obesity risk that women face. One way to address women’s high prevalence rates may be
to better educate women on the relevant risks that they face when their BMI becomes
large. In that way, women’s perceptions of an ideal body size may change.
There may be an upper bound on the extent to which such campaigns will be
successful, however, if a woman’s ability to regulate her appetite is compromised by the
nutritional deprivation she endured as a child. Our results on the differences in obesity
risk faced by men and women, who reported similar childhood nutritional deprivation,
suggest that the biology of obesity risk cannot be fully understood without understanding
early-life economic disadvantage, and that the impact of socioeconomic status on obesity
cannot be understood without a biological framework that can explain why women and
men, facing the same nutritional deprivation as children, face quite different biological
risks as adults.

27
REFERENCES
Bergstrom, T. C. 1997. “A survey of theories of the family,” Chapter 2 in Handbook of Population and Family Economics, M. R. Rosenzweig and O. Stark (eds.). New York: North Holland, 21-79. Case, A. 2004. “Does money protect health status? Evidence from South African pensions.” Chapter 7 in Perspectives on the Economics of Aging, D. Wise (ed.), University of Chicago Press, 287-305.
Case, A. and A. Deaton. 2006. “Health and wellbeing in Udaipur and South Africa.” Forthcoming in Developments in the Economics of Aging, D. Wise (ed) University of Chicago Press for the NBER.
Food and Agriculture Organization of the United Nations. 2006. “The developing world’s new burden: obesity,” accessed on line July 27, 2006 at http://www.fao.org/FOCUS/E/obesity/obes1.htm . Furnham, A. and P. Baguma. 1994. “Cross-cultural differences in the evaluation of male and female body shapes.” International Journal of Eating Disorders 15(1):81-9. Hoddinott, J. and L. Haddad. 1995. “Does female income share influence household expenditures? Evidence from Cote D’Ivoire.” Oxford Bulletin of Economics and Statistics 57: 77-96. Holdsworth, M., A. Gartner, E. Landais, B. Maire and F. Delpeuch. 2004. “Perceptions of healthy and desirable body size in urban Senegalese women.” International Journal of Obesity 28: 1561-8.
Kahn, K., S.M. Tollman, M. Garenne, and J.S.S. Gear. 1999. “Who dies from what? Determining cause of death in South Africa’s rural northeast.” Tropical Medicine and International Health 4(6): 433-41.
Leibbrandt, M., L. Poswell, P. Naidoo, M. Welch, and I. Woolard. 2005. “Measuring recent changes in South African inequality and poverty using 1996 and 2001 Census data.” Working Paper 9629, Development Policy Research Unit, University of Cape Town.
Martorell, R., L. Kettel Khan, M. L. Hughes, and L. M. Grummer-Strawn. 2000. “Obesity in women from developing countries.” European Journal of Clinical Nutrition 54(3): 247-52.
Onyike, Chiadi U., Rosa M. Crum, Hochange B. Lee, Constantine G. Lyketsos, and William W. Eaton. 2003. “Is obesity associated with major depression? Results from the Third National Health and Nutrition Examination Survey.” American Journal of Epidemiology 158(12): 1139-47.

28
Popkin, B.M. 1994. “The nutrition transition in low income countries: An emerging crisis.” Nutrition Reviews 52(9): 285-98.
Popkin B.M. and C. M. Doak. 1998. “The obesity epidemic is a worldwide phenomenon.” Nutrition Reviews 56: 106-14.
Puoane, T., K. Steyn, D. Bradshaw, R. Laubscher, J. Fourie, V. Lambert, and N. Mbananga. 2002. “Obesity in South Africa: The South African Demographic and Health Survey.” Obesity Research 10: 1038-48. Varma, Amit, Jing He, Lisa Weissfeld, and Sherin U. Devaskar, 2003. “Postnatal intracerebroventricular exposure to neuropeptide Y causes weight loss in female adult rats.” Am J Physiol Regulatory Integrative Comp Physiol, 284:1560-1566.
World Health Organization. 2000. Obesity: Preventing and managing the global epidemic. Report of a WHO consultation. Technical Report Series 894: 1-253. Ziebland, S., J. Robertson, J. Jay and A. Neil. 2002. “Body image and weight change in middle age: A qualitative study.” International Journal of Obesity 26: 1083-91.

29
Figure 1. Body mass indices for men and women, Khayelitsha Survey 2004-05
2025
3035
BM
I
20 30 40 50 60age
women men
From ages 18 to 60BMI of Women and Men

30
Figure 2. Body images by sex (Source: Ziebland et al. 2002)

31
Figure 3. Perceived body shapes and desired body shapes for women
23
45
6D
esire
d an
d P
erce
ived
Imag
es
20 25 30 35 40 45BMI
Desired Perceived
From 5th to 95th Percentile of Body Mass IndexWomen's Desired and Perceived Body Images

32
Table 1. Summary Statistics by Sex
Men (n=426)
Women (n=549)
p-value of difference
Age 35.49 36.14 0.454 Body mass index (BMI) Indicator: underweight (BMI<18.5) 0.052 0.011 0.000 Indicator: normal (18.5≤BMI<25) 0.643 0.219 0.000 Indicator: overweight (25≤BMI<30) 0.204 0.268 0.021 Indicator: obese (BMI≥30) 0.101 0.503 0.000 Proximate causes of obesity Food consumption Indicator: large breakfast 0.209 0.075 0.000 Indicator: large lunch 0.194 0.059 0.000 Indicator: large dinner 0.292 0.142 0.000 Number of large meals per day 0.698 0.272 0.000 Spoons of sugar per day 4.337 6.579 0.000 Indicator: drinks soda 0.308 0.255 0.070 Physical exertion Any exercise 0.333 0.093 0.000 Any sports 0.188 0.035 0.000 Underlying causes of obesity Childhood conditions Indicator: Went to school hungry 0.380 0.368 0.687 Indicator: Went to bed hungry 0.378 0.338 0.198 Indicator: Ate at other people’s homes 0.266 0.283 0.557 Child poverty index 1.021 0.982 0.630 Adult socioeconomic status Years of completed education 6.26 6.77 0.010 Log(expenditure per member) 5.490 5.361 0.003 Log(income per member) 5.858 5.588 0.000 Depression index ‘Some’ or ‘Most of the time’ 1.977 2.756 0.000 Body shapes Perceived current body shape 3.314 4.106 0.000 Ideal body shape 3.693 3.949 0.000

33
Table 2. Proximate Determinants of Obesity
Dependent variable =1 if BMI>30, =0 otherwise
Women Men
Control variables:
Number of large meals per day 0.039 (0.034)
–0.008 (0.018)
Indicator: Drinks soda 0.109 (0.044)
0.068 (0.036)
Sugar index 0.051 (0.022)
–0.013 (0.021)
Reports exercise –0.008 (0.065)
–0.005 (0.044)
Reports sports –0.017 (0.108)
0.010 (0.044)
F-test: calorie intake variables (p-value)
4.27 (0.006)
1.22 (0.303)
F-test: calorie expenditure variables (p-value)
0.03 (0.970)
0.02 (0.976)
Number of observations 536 404 OLS regression coefficients reported, with standard errors in parentheses. Standard errors allow for correlation in the unobservables between individuals in the same household. Also included in all regressions are controls for age, age squared, an indicator for the survey year, and a constant term.

34
Table 3. Decomposition of the Proximate Determinants of Obesity
Obesity rate, women 0.503
Obesity rate, men 0.101
Difference (women − men) 0.402 Severity effect ( )F M
i i iixβ β−∑ 0.089
Prevalence effect ( )F Mi i ii
x x β−∑ –0.004
Fraction explained 0.211
Decomposition by variable: Severity Effect Prevalence Effect
( )F Mi i ixβ β− ( )F M
i i ix x β−
Number of large meals per day 0.021 –0.007
Indicator: Drinks soda 0.011 –0.005
Sugar index 0.060 0.005
Reports exercise –0.001 0.002
Reports sports –0.003 0.001
All 0.089 –0.004 Decomposition is based on OLS regression coefficients reported in columns 1 and 2 of Table 2.

35
Table 4. Underlying Determinants of Obesity
Dependent variable =1 if BMI>30, =0 otherwise
Women Men
(1) (2) (3) (4) (5) (6)
Control variables:
Childhood hunger index 0.048 (0.016)
0.044 (0.101)
0.008 (0.138)
–0.005 (0.012)
0.004 (0.061)
0.020 (0.080)
Childhood hunger index × log(income/member)
-- 0.001 (0.018)
-- -- –0.001 (0.010)
--
Childhood hunger index × log(expenditure/member)
-- -- 0.008 (0.025)
-- -- –0.005 (0.014)
F-test: childhood hunger variables (p-value)
-- 4.67 (0.010)
5.19 (0.006)
-- 0.10 (0.909)
0.19 (0.829)
Log (income/member) 0.041 (0.020)
0.041 (0.028)
-- –0.011 (0.014)
–0.010 (0.019)
--
Log (expend/member) -- -- 0.032 (0.044)
-- -- –0.020 (0.025)
Education 0.019 (0.009)
0.019 (0.009)
0.019 (0.009)
0.009 (0.005)
0.009 (0.005)
0.008 (0.005)
Depression index –0.003 (0.008)
–0.003 (0.008)
–0.004 (0.008)
–0.007 (0.006)
–0.007 (0.006)
–0.007 (0.006)
N observations 528 528 540 402 402 417 OLS regression coefficients reported, with standard errors in parentheses. Standard errors allow for correlation in the unobservables between individuals in the same household. Also included in all regressions are controls for age, age squared, an indicator for the survey year, and a constant term.

36
Table 5. Decomposition of the Underlying Determinants of Obesity
Using log(income per
member)
Using log(expenditure per
member)
Obesity rate, women 0.503 0.503
Obesity rate, men 0.101 0.101
Difference (women − men) 0.402 0.402
Severity effect 0.414 0.413
Prevalence effect –0.001 0.001
Fraction explained 1.027 1.030
Decomposition by variable: Severity Effect
Prevalence Effect
Severity Effect
Prevalence Effect
Childhood hunger index 0.041 –0.001 –0.012 –0.001
Childhood hunger × log(SES measure)
0.012 0.000 0.066 –0.001
Log(SES measure) 0.289 –0.004 0.278 –0.001
Education 0.063 0.007 0.073 0.007
Depression index 0.009 –0.004 0.008 –0.004
All 0.414 –0.001 0.413 0.001 The decomposition in columns 1 and 2 is based on OLS regression coefficients reported in columns 2 and 5 of Table 4, which uses log(income per member) as an SES control, and the decomposition in columns 3 and 4 is based on regression coefficients reported in columns 3 and 6 of Table 4, which uses log(expenditure per member) as an SES control.

37
Table 6. Childhood SES and Adult Obesity
Dependent Variable: Childhood hunger
index
Dependent Variable: Obesity in
adulthood
Women Men Women Men
Childhood hunger index -- -- 0.053 (0.022)
–0.008 (0.016)
Childhood family finances were:
“very comfortable” or “comfortable”
–2.201 (0.162)
–2.164 (0.183)
0.076 (0.110)
–0.067 (0.077)
“just getting by” –1.799 (0.166)
–1.749 (0.177)
–0.004 (0.091)
0.006 (0.069)
“poor” –0.495 (0.186)
–0.597 (0.207)
0.017 (0.083)
–0.024 (0.060)
Father did not have a “regular pay job”
0.177 (0.117)
0.224 (0.123)
–0.002 (0.046)
–0.032 (0.034)
F-test: joint significance of family finance indicator variables
101.25 60.83 0.47 1.08
Number of observations 502 399 502 399 Notes: Also included are age, age squared, an indicator for survey year, and a constant term. All regressions allow for correlation in the unobservables for observations from the same household.

38
Table 7. Own Income, Household Income and Obesity
Dependent variable: Obesity in adulthood
Women Men
(1) (2) (3) (4) (5)
Total household income per month (R1000)
0.033 (0.014)
0.019 (0.016)
0.021 (0.016)
0.005 (0.012)
–0.001 (0.013)
Own earnings from work per month (R1000)
-- 0.062 (0.027)
0.052 (0.027)
-- 0.015 (0.024)
Monthly child support grant receipt (R1000)
-- 0.337 (0.169)
0.268 (0.172)
-- --
Indicator: respondent has ‘most say’ on food spending
-- -- 0.102 (0.062)
-- 0.022 (0.045)
F-test: joint significance of own-income and ‘most say’ variables (p-value)
2.94
(0.033)
0.48
(0.617)
Number of observations 511 511 511 375 375 Notes: Also included in all regressions are controls for age, age squared survey year, number of household members, our childhood hunger index, and a constant term. Standard errors that allow for correlation in the unobservables for observations from the same household are presented in parentheses. The sample excludes 4 outliers for whose reported total household monthly income exceeded R10,000.
39
Table 8. Decisions on Household Food Spending
Dependent variable =1 if this adult is reported to have the “most say” on food spending
Female 0.172 (0.053)
Total household income (R1000)
–0.024 (0.016)
Female × total household income (R1000)
0.012 (0.020)
Own-earnings from work (R1000)
0.055 (0.032)
Female × own-earnings from work (R1000)
0.126 (0.045)
Female × child support grant receipt (R1000)
0.822 (0.157)
Number of observations 649 Notes: Also included are controls for household size, respondents’ education, age, age squared, an indicator for survey year, and a constant term. The sample is restricted to adults living in households that contain both adult men and women. The sample excludes 4 outliers reporting total household monthly income above R10,0000. Standard errors that allow for correlation in the unobservables for observations from the same household are presented in parentheses.