settlement history in the northwest – after 1930
DESCRIPTION
Settlement History In the Northwest – After 1930. Columbia Basin Project, Irrigated Agriculture, Aluminum Industry Industries stimulated in WW II: aerospace, shipbuilding Port Functions High-Technology Industry Producer services Health Services, Consumer Services - PowerPoint PPT PresentationTRANSCRIPT

Settlement History In the Northwest – After 1930
• Columbia Basin Project, Irrigated Agriculture, Aluminum Industry
• Industries stimulated in WW II: aerospace, shipbuilding
• Port Functions• High-Technology Industry• Producer services• Health Services, Consumer Services• Research, Government, Education, Social, and
Military Services• Trade & Tourism

The Historic and Modern Role of Timber in the Washington Economy
0
0.5
1
1.5
2
2.5
3
3.5
4
18
50
18
70
18
90
19
10
19
30
19
50
19
70
19
90
Ind
ex
Ye
ar
19
30
= 1
.0
Lumber Output
Wood ProductsEmployment
WashingtonPopulation
Labor productivityclearly evident

Washington State Employment

Share of Washington State Jobs

Employment Trend - Technology Based Industries-Washington State 1974-2013

The Growth of Nonearnings Income (Transfer payments, Dividends, Interest, Rent)
0
0.05
0.1
0.15
0.2
0.25
0.3
0.35
0.4
ID OR WA
Sh
are
of
Per
son
al I
nco
me
1969
1985
2011

Non-Earnings Income Trend:It is now a substitute for work in many
regional economy’s economic base
0
0.1
0.2
0.3
0.4
0.5
0.6
0.7
Statewide King Lincoln Pacific San Juan
Sh
are
of
Per
son
al I
nco
me
1969
1985
2011

Stability in Shares of Regional Population Since 1920
0%
10%
20%
30%
40%
50%
60%
70%
80%
90%
100%18
5018
6018
7018
8018
9019
0019
1019
2019
3019
4019
5019
6019
7019
8019
9020
0020
10
Perc
ent
of R
egio
nal P
opul
ation
WA
OR
ID

Metropolitan Population Shares Have Continued to Increase (2009 metro definitions)
0
0.1
0.2
0.3
0.4
0.5
0.6
0.7
0.8
0.9
1
Idaho Oregon Washington
Urb
an P
op
ula
tio
n S
har
e
1970
1990
2000
2010

Metro Growth Rates Have Consistently Outpaced Nonmetro Growth Rates
0
0.5
1
1.5
2
2.5
3
3.5
1970-1990 1990-2000 2000-2007
An
nu
al G
row
th R
ate ID Metro
OR Metro
WA Metro
ID Nonmetro
OR Nonmetro
WA Nonmetro
Based on 2009 Definitions of Metro and Nonmetro


Population Change 1990-2000

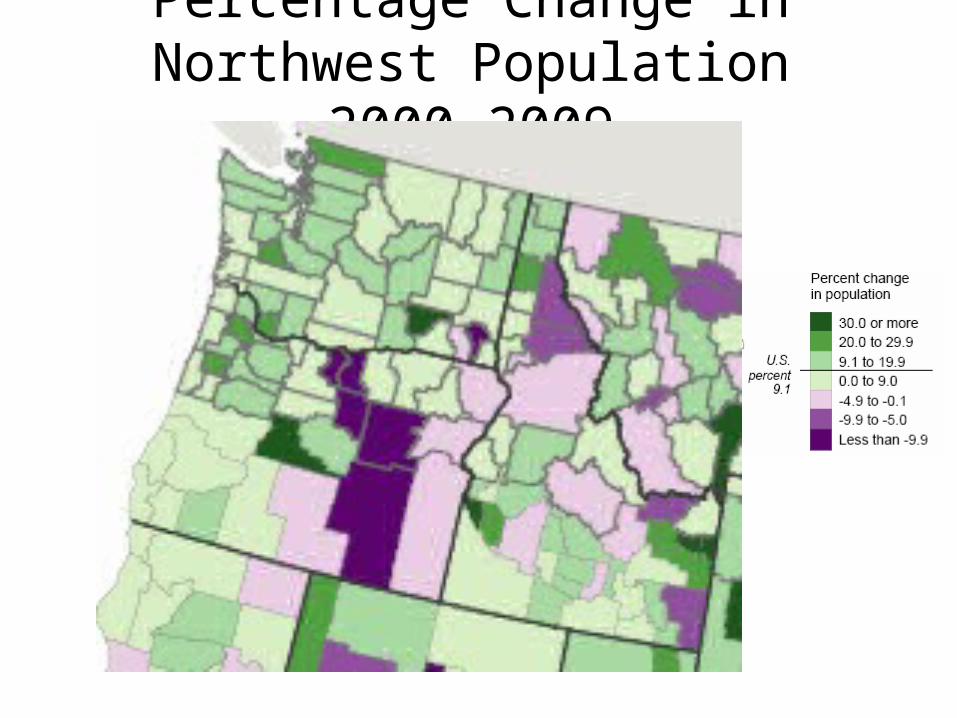
Percentage Change in Northwest Population 2000-2009


National Data: The PNW may be different

National Data: The PNW May Be Different

Extra Maps
• The following maps were left in this PowerPoint file for reference purposes


Nonmetro Population change 1990-2000

Percentage Change in Population 2000-2009

Nonmetro Population Change 2000-2010


