set 3 - chapter 3 - our math site 3 - chapter 3 - 2 slides.pdf · statistics ءاـصحلإا 3 - 1...
TRANSCRIPT

Statistics
اإلحصـاء
3 - 1 Definitions تعاريف
• Statistics is a branch of Mathematics that deals collecting, analyzing, summarizing, and presenting data to help in the decision-making process.
• Statistics is applied in all fields of life such as:
2SET 3 - Chapter 3 GFP - Sohar University
• Industry• Business• Education• Physics• Chemistry• Economics• Biology• Agriculture• Psychology• Astronomy, etc.

• Population is all the members of a group about which we want
to draw a conclusion.
3 GFP - Sohar University
• All Omani citizens who are currently above 40 years
• All patients treated at a particular hospital in Sohar last year
• The entire daily output of a food factory’s production line
• All students who studied Maths in GFP in 2016 / 2017
• Sample is the part of the population selected for analysis.
Examples on sample are:
• 500 people above 40 years selected from Oman people.
• The patients selected to fill out a patient satisfaction questionnaire
• 100 boxes of food selected from a factory’s production line
• 50 students selected from all students who studied Maths in GFP in 2016 / 2017
Examples on population are:
SET 3 - Chapter 3
4 GFP - Sohar University
• Variable is a property of an item or an individual that will be analyzed using statistics. Examples on variable are:
• Gender (boy or girl)
• Age of students study in Sohar University
• Income in OMR of a hypermarket in Sohar per month
• Number of traffic accidents in Muscat per year
SET 3 - Chapter 3
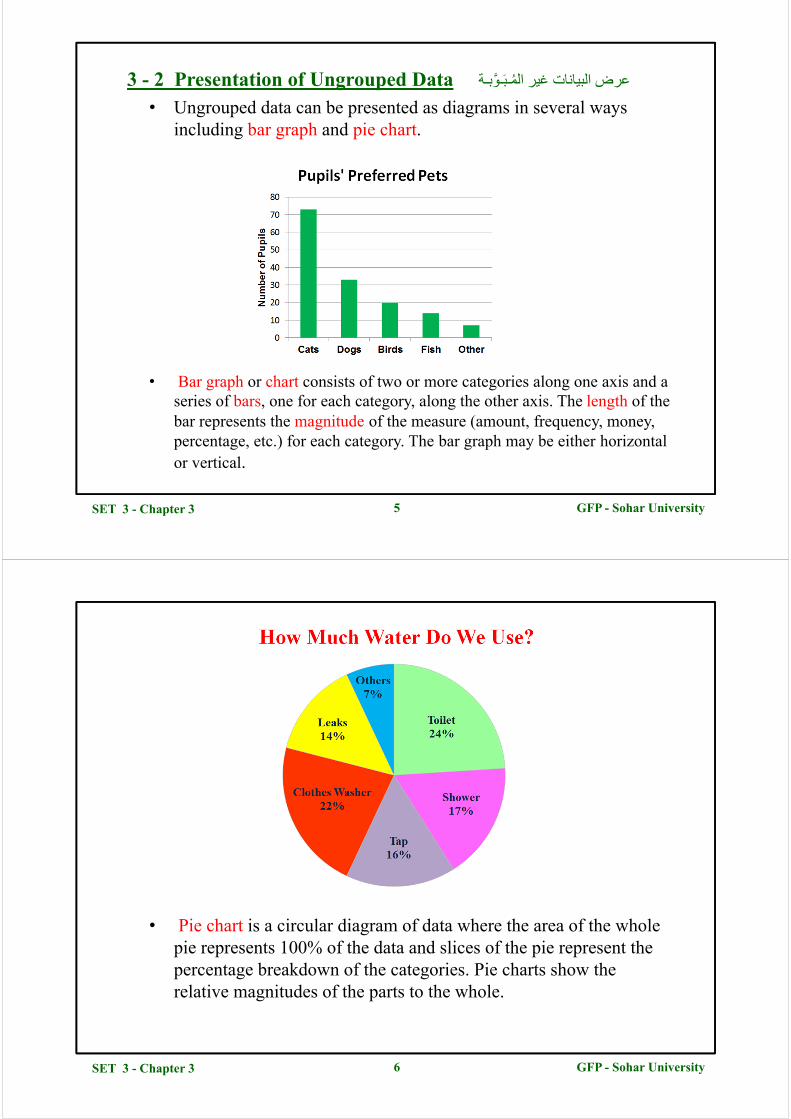
3 - 2 Presentation of Ungrouped Data بـة عرض البيانات غير المـبـو
• Ungrouped data can be presented as diagrams in several ways including bar graph and pie chart.
5 GFP - Sohar University
• Bar graph or chart consists of two or more categories along one axis and a series of bars, one for each category, along the other axis. The length of the bar represents the magnitude of the measure (amount, frequency, money, percentage, etc.) for each category. The bar graph may be either horizontal or vertical.
SET 3 - Chapter 3
6SET 3 - Chapter 3 GFP - Sohar University
• Pie chart is a circular diagram of data where the area of the whole pie represents 100% of the data and slices of the pie represent the percentage breakdown of the categories. Pie charts show the relative magnitudes of the parts to the whole.

7 GFP - Sohar University
• The figure below shows a vertical bar graph presentation of the expenditures of a college undergraduate for the past year.
• Comparing the size of the bars, we can quickly see that room and board expenses are nearly double tuition fees, and tuition fees are more than double books and lab or transportation expenses.
SET 3 - Chapter 3
8 GFP - Sohar University
• A bar graph may also be placed on its side with the bars going horizontally, as shown in the figure below:
SET 3 - Chapter 3

9 GFP - Sohar University
• The bar graph have a limitation that it’s difficult to see what portion of the total each item comprises. If knowing about a “part of the whole” is important, then a pie chart is a better choice for showing the same data.
• A pie chart may also display each category’s percentage of the total.
• Using the same data from the previous example, we get the pie chart shown below.
SET 3 - Chapter 3
3 - 3 Frequency Distribution التوزيع التكراري
• A frequency distribution is an organized tabulation showing exactly how many values are located in each class.
• A frequency distribution presents an organized picture of the entire set of scores, and it shows where each values is located relative to others in the distribution.
• An example on frequency distribution is the marks of 16 studentsscored in a SET 1 quiz:
{65, 73, 64, 85, 66, 77, 82, 93, 86, 63, 58, 63, 62, 79, 61, 74}
10 GFP - Sohar University
Class Class Boundaries Tally Frequency
50 – 59 49.5 – 59. 5 I 1
60 – 69 59.5 – 69.5 IIII I I 7
70 – 79 69.5 – 79.5 IIII 4
80 – 89 79.5 – 89.5 III 3
90 – 99 89.5 – 99.5 I 1
Total 16
SET 3 - Chapter 3

• Below is the steps of constructing a frequency distribution:
• Step 1: Figure out how many classes you need. There are no strictrules about how many classes to choose, but there are a two generalguidelines:
- Choose between 5 and 20 classes. - Make sure you have a few values in each category. For example,
if you have 20 values, choose 5 classes (4 values per category),not 20 classes (which would give you only 1 value per category).
• Step 2: Find the range by subtracting the lowest value from the highest value in your data set.
• Step 3: Divide your answer in Step 2 by the number of classes you chose in Step 1.
• Step 4: Round the number from Step 3 up to a whole number to get the class width.
11 GFP - Sohar UniversitySET 3 - Chapter 3
• Step 5: Write down your lowest value for your first lower limit. Add the class width from Step 4 to Step 5 to get the next class lower limit.
• Step 6: Keep on adding your class width to your lower limit values until you have created the number of classes you chose in Step 1.
• Step 7: Write down the class upper limits. These are the highest values that can be in the category, so in most cases you can subtract 1 from class width and add that to the lower limit.
• Step 8: Find the class boundaries by subtracting 0.5 from each lower class limit and adding 0.5 to each upper class limit.
• Step 9: Tally the scores by counting the number of items in each class, and put the total in the third column called frequency.
12 GFP - Sohar UniversitySET 3 - Chapter 3

3 - 4 Presentation of Grouped Data بـة عرض البيانات المـبـو
• Grouped data is presented by histogram and frequency polygon.
• The table at right is a frequency distributionof heights (recorded to the nearest inch) of100 male students at Sohar University.
• The histogram and frequency polygon forthis distribution are as shown below:
13SET 3 - Chapter 3 GFP - Sohar University
Histogram Frequency Polygon
Example 1: For the set of IQ scores: 118, 123, 124, 125, 127, 128, 129, 130,130, 133, 136, 138, 141, 142, 149, 150, and 154, construct: (a) 5 classes frequency distribution (b) histogram(c) frequency polygon.
14
Solution:
GFP - Sohar University
(a) Frequency Distribution:
Step 1: We will construct a frequency distribution with 5 classes.
Step 2: Range = Highest Value – Lowest Value = 154 – 118 = 36
Step 3: Class width = (Range / No. of classes) = 36 / 5 = 7.2
Step 4: Class width = 8
SET 3 - Chapter 3

15 GFP - Sohar University
Step 5, 6, 7, 8 and 9: are as in the following table:
Thus, the frequency distribution is shown in the table below:
SET 3 - Chapter 3
16 GFP - Sohar University
(b) Histogram
SET 3 - Chapter 3

17 GFP - Sohar University
(c) Frequency Polygon
SET 3 - Chapter 3
3 - 5 Measures of Central Tendancy for Ungrouped Dataبـةمقايـيـس التمركز للبيانات غير المـبـو
• There are many different measures of central tendency. The three most widely used measures of central tendency are the mean,median, and mode.
• The mean ( ) for a sample consisting of n observations is:
18 GFP - Sohar University
• The median is the middle number in a group of numbers arranged in sequential order. In a set of numbers, half will be greater than the median and half will be less than the median.
• The mode is the value in a data set that occurs the most often. If nosuch value exists, we say that the data set has no mode. If two such values exist, we say the data set is bimodal. If three such values exist, we say the data set is trimodal.
SET 3 - Chapter 3

Example 2: Find the mean of the following set of numbers:
6, 8, 19, 14, 4, 11, 15.
19
Solution:
GFP - Sohar University
Example 3: Ahmed has four grades of equal weight in Maths.
They are 82, 90, 88, and 85. What is Ahmed’s mean in Maths?
Solution:
SET 3 - Chapter 3
Example 4: Find the median of the following set of numbers:
5, 7, 19, 12, 4, 11, 15.
20
Solution:
GFP - Sohar University
Example 5: Find the median of the following set of numbers:
5, 7, 19, 12, 4, 11, 15, 13.
Solution:
Putting the numbers in sequential order gives:
4, 5, 7, 11, 12, 15, 19
The middle number is the median, so 11 is the median.
Arranging the values gives: 4, 5, 7, 11, 12, 13, 15, 19
There are two middle numbers: 11 and 12,
So, the median
SET 3 - Chapter 3

Example 6: Find the mode of the following set of numbers:5, 7, 9, 12, 9, 11, 15.
21
Solution:
GFP - Sohar University
Example 7: Find the mode of the following set of numbers:5, 7, 19, 12, 4, 11, 15.
Solution:
The number 9 occurs twice in the list, so 9 is the mode.
None of the numbers occurs more than once, so there is no mode.
Example 8: Find the mode of the following set of numbers:5, 7, 9, 12, 9, 11, 5.
Solution:
The numbers 5 and 9 both occur twice in the list, so both 5 and 9 are modes and the set is bimodal.
SET 3 - Chapter 3
3 - 6 Measures of Central Tendancy for Grouped Dataبـةمقايـيـس التمركز للبيانات المـبـو
or
22 GFP - Sohar University
• The mean for grouped data is found as follows:
Example 9: The frequency distribution of the prices of items sold at a supermarket in $ is as shown. Determine the mean valueof the prices.
1 – 5 86 – 10 6
11 – 15 416 – 20 221 – 25 426 – 30 631 – 35 2
SET 3 - Chapter 3

23
Solution:
GFP - Sohar University
The table below shows the calculations for finding the mean:
Substituting into the formula gives:
SET 3 - Chapter 3
24 GFP - Sohar University
Example 10: The frequency distribution for the length of a spare partin centimeters of a sample of 48 parts is as shown below. Determine the mean value of length.
20.5 – 20.9 321.0 – 21.4 1021.5 – 21.9 1122.0 – 22.4 1322.5 – 22.9 923.0 – 23.4 2
SET 3 - Chapter 3

25
Solution:
GFP - Sohar University
Calculations for finding the mean are shows the table below:
Substituting into the formula gives:
= 21.92 cm
SET 3 - Chapter 3
3 - 7 Standard Deviation for Ungrouped Dataبـةاإلنحراف المعياري للبيانات غير المـبـو
26 GFP - Sohar University
• The standard deviation of a set of data gives an indication of the amount of dispersion, or the scatter, of values of the set from the measure of central tendency.
• The population standard deviation is indicated by σ (the Greek letter small ‘sigma’), and is calculated for ungrouped data as follows:
• The sample standard deviation is indicated by s, and is calculated for ungrouped data as follows :
Where µ is the population mean, and N isthe number of values in the population.
Where is the sample mean, andn is the number of values in the sample.
SET 3 - Chapter 3

27SET 3 - Chapter 3 GFP - Sohar University
Example 11: Find the sample standard deviation from the mean for thedata set: {5, 6, 8, 4, 10, 3}
First, find the mean:
Solution:
= 2.61
3 - 8 Standard Deviation for Grouped Dataبـةاإلنحراف المعياري للبيانات المـبـو
28SET 3 - Chapter 3 GFP - Sohar University
• The population standard deviation σ for grouped data is calculated as follows:
• The sample standard deviation s for grouped data is calculated as follows:
Where µ is the population mean, N is the number of values in the population, f is the frequency, and x is the class midpoint
Where is the sample mean, n is the number of values in the sample, f is the frequency, and x is the class midpoint

29 GFP - Sohar University
Example 12: Find the standard deviation from the mean of the heights of
a random sample of 100 male students at Sohar University
whose heights is as shown in the table below.
Height (in)Number of Students
60 – 62 563 – 65 1866 – 68 4269 – 71 2772 – 74 8
SET 3 - Chapter 3
30
Solution:
SET 3 - Chapter 3 GFP - Sohar University
The calculations for finding the standard deviation for this sample areshown in table below:
The mean = = 67.45 in
The standard deviation = = 2.93 in

3 - 9 Median for Grouped Data بـة الوسيـط للبيانات المـبـو
31 GFP - Sohar University
• The median for grouped data is calculated as follows:
Where:
L = the lower boundary of the median class
cfp = a cumulative total of the frequencies up to but not including the frequency of the median class
fmed = the frequency of the median class
W = the class width
N = total number of frequencies
SET 3 - Chapter 3
32 GFP - Sohar University
Example 13: The following frequency distribution shows the time
needed to travel to work in minutes for 50 employees.
Find the median for this distribution.
Time to travel to work (min)
Number of employees
1 – 10 511 – 20 821 – 30 1131 – 40 1441 – 50 751 – 60 361 – 70 2
SET 3 - Chapter 3

33
Solution:
GFP - Sohar University
Step 1: Construct the cumulative frequency distribution:
Time to travel to work (min)
Number of employees
CumulativeFrequency
1 – 10 5 511 – 20 8 1321 – 30 11 2431 – 40 14 3841 – 50 7 4551 – 60 3 4861 – 70 2 50
Step 2: Find the class that contains the median:
The Median Class is the class with the value of cumulativefrequency that is equal to at least n/2.
= = Median class is the 4th class
So, L = 30.5, cfp = 24, fmed = 14, and W = 10
SET 3 - Chapter 3
34 GFP - Sohar University
• The median is calculated as follows:
Median
Median = 31.2 minutes
SET 3 - Chapter 3