session!1! introductionto!qgis!and!raster!imagery!! data ... · data!(landsat!imagery) ... 2 !...
TRANSCRIPT

ARSET Advanced NDVI Webinar Series Winter 2016
1
Session 1
Introduction to QGIS and Raster Imagery Data Requirements For this exercise you will need: All files from the “Week1_Data” zipped folder on the ARSET website including:
• CA_projected.shp • CA_Cities_Top10.shp • Yosemite_boundary.shp
You can download all the data files listed above on the ARSET website: https://arset.gsfc.nasa.gov/ecoforecasting/webinars/advanced-‐webinar-‐creating-‐and-‐using-‐normalized-‐difference-‐vegetation-‐index You will need to unzip this folder and save it to a folder on your computer. It is recommended that all data for this webinar be well organized and remain in the same location. Introduction This exercise will provide you with a brief overview of QGIS elements. It will also show you how to add vector data and modify layer attributes. Additionally, raster data (Landsat imagery) will be acquired and input into QGIS. Homework In order to complete the homework, you should complete all of the steps outlined in this exercise. Use the homework link below or on the ARSET website to complete the Google Form. Some of the homework questions will come from the lecture, and some will come from completing this exercise. Homework Link: https://docs.google.com/forms/d/1P_Hv2Znw2tG3xJ5vXRdTXsd8ndxdPUnyNbD4goOdL78/viewform Prerequisites and Additional Informational Websites QGIS and associated plugins should already be downloaded as part of the prerequisites for this course. See the Downloading and Installing QGIS.docx on the ARSET website. This introduction assumes that you have a basic background with geospatial software. If you are not familiar with any geospatial software we suggest spending some time exploring QGIS prior to the webinar. Additionally, QGIS has very useful user tutorials located here: http://docs.qgis.org/2.8/en/docs/training_manual/index.html.
ARSET Advanced NDVI Webinar Series Winter 2016
2
Part 1: Getting Started with QGIS
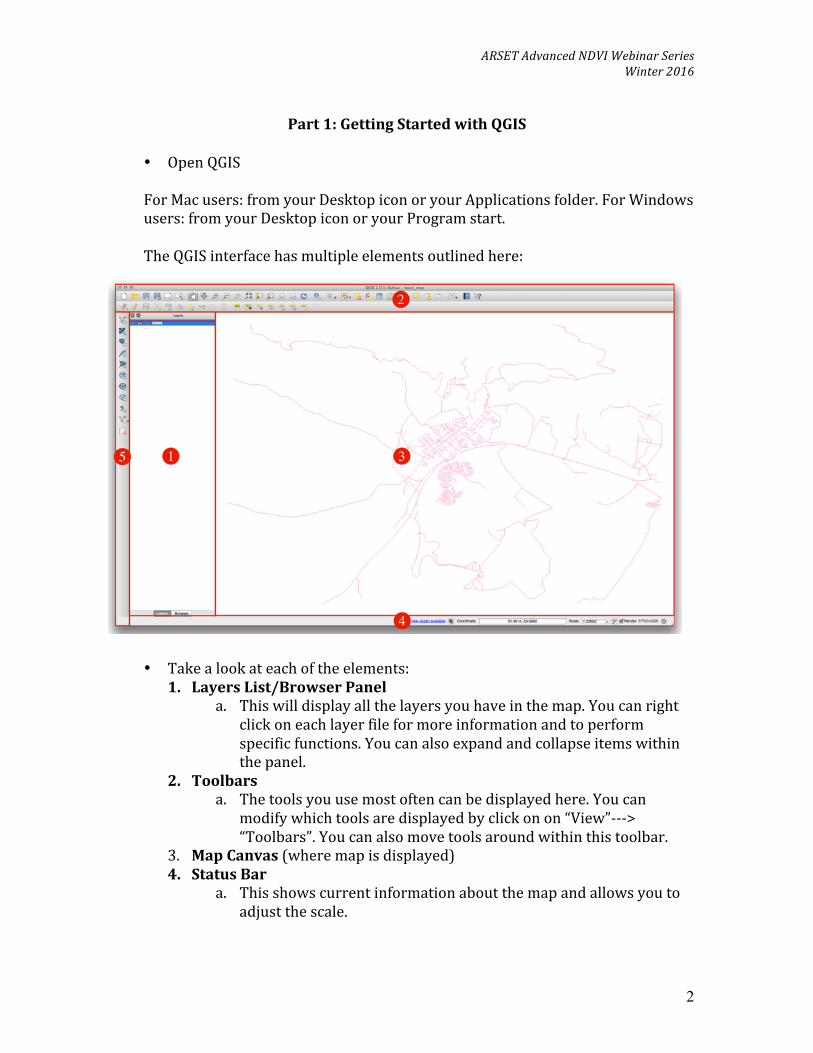
• Open QGIS For Mac users: from your Desktop icon or your Applications folder. For Windows users: from your Desktop icon or your Program start. The QGIS interface has multiple elements outlined here:
• Take a look at each of the elements: 1. Layers List/Browser Panel
a. This will display all the layers you have in the map. You can right click on each layer file for more information and to perform specific functions. You can also expand and collapse items within the panel.
2. Toolbars a. The tools you use most often can be displayed here. You can
modify which tools are displayed by click on on “View”-‐-‐-‐> “Toolbars”. You can also move tools around within this toolbar.
3. Map Canvas (where map is displayed) 4. Status Bar
a. This shows current information about the map and allows you to adjust the scale.
ARSET Advanced NDVI Webinar Series Winter 2016
3
5. Here you can add in different types of data layers. Note: if you hover over any of these icons, it will display the function name. Explore the available functions.
Part 2: QGIS Plugins
Plugins are optional tools that you can import into your QGIS for additional functionality. A useful plugin for QGIS is OpenLayers and includes Google Maps, OpenStreetmap and Yahoo Map layers.
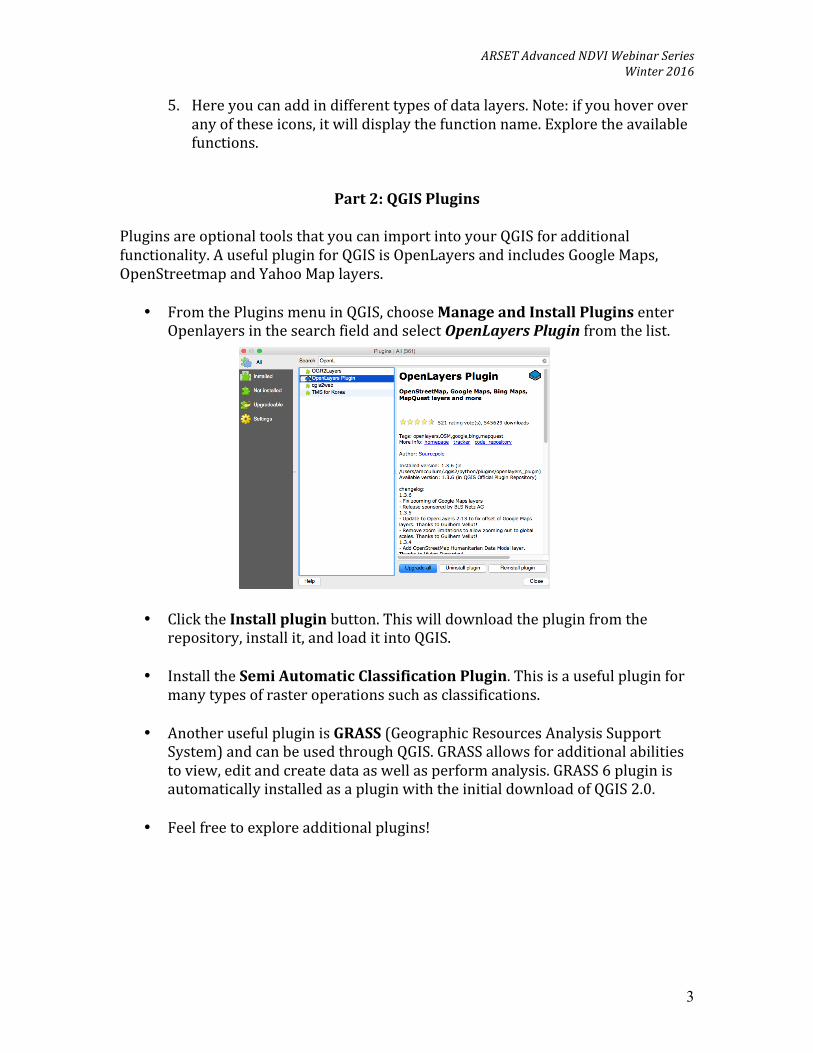
• From the Plugins menu in QGIS, choose Manage and Install Plugins enter Openlayers in the search field and select OpenLayers Plugin from the list.
• Click the Install plugin button. This will download the plugin from the
repository, install it, and load it into QGIS. • Install the Semi Automatic Classification Plugin. This is a useful plugin for
many types of raster operations such as classifications.
• Another useful plugin is GRASS (Geographic Resources Analysis Support System) and can be used through QGIS. GRASS allows for additional abilities to view, edit and create data as well as perform analysis. GRASS 6 plugin is automatically installed as a plugin with the initial download of QGIS 2.0.
• Feel free to explore additional plugins!

ARSET Advanced NDVI Webinar Series Winter 2016
4
Part 3: Adding and Modifying Vector Layers
Adding a vector layer
• Click on the Add Vector Layer icon
• Next to Dataset click on the Browse button and find the shapefile called CA_projected.shp. Click Open to add it to the map. The layer will be added to the map and you should see an outline of the state of California. The color may not be aesthetically pleasing, so we can change that.
• Right click on the CA_projected file in the Layers Panel, then click on
Properties. This should automatically take you to the Style panel and there you can change the color, transparency, etc. You will notice some example symbols and colors on the right side of the Style panel. Click on land. Click Apply at the bottom. You will see the fill change colors. Click OK.
• Repeat the previous steps to add the CA_Cities_Top10.shp and Yosemite_boundary.shp files. These are a point file of the ten largest cities in California based on population, and the boundary of Yosemite National Park.
• Right click on the CA_Cities_Top10 file in the Layers Panel, then click on
Properties. In the Style tab, change the symbol to the city option in the box on the right. Then, using the dropdown menu next to Color, change the fill color to blue.
• You can also add labels to a map and modify them based on your specific
cartographic needs. Click on the Labels tab. In the top drop down menu choose Show Labels for this Layer. In the drop down menu next to Label With select NAMELSAD. Click Apply.

ARSET Advanced NDVI Webinar Series Winter 2016
5
• Without closing the Properties box, take a look at the city labels in the map.
You can also change the formatting of the labels. Click on the Buffer option within the Labels tab. Check the Draw text buffer button and keep everything as default. Click on the Shadow option and check the Draw drop shadow. Finally, click on the Placement option and increase the distance to 1 millimeter by clicking on the “up” arrow next to Distance. Click Apply again and close the Properties window. Take a look at the labels again in the map. They are now a bit easier to read.
• You can also modify and label the Yosemite layer in the same way. Open the
Properties box and change the color to dark green. Click on Simple Fill in the fill box on the left side. Then change the Fill color to green and the Boarder to red.
• Label the layer using the UNIT_NAME and give it a white Buffer of 0.7
millimeters. Viewing data and Vector Attributes
• Using some of the tools on the top of your QGIS project panel, you can modify
the view of your data. Click on the Zoom Full tool. This should display the full extent of all of your map layers. You can also zoom into specific layers. Click on the Yosemite_boundary layer, then click on the Zoom to

ARSET Advanced NDVI Webinar Series Winter 2016
6
Layer tool. This should allow you to view the full extent of the Yosemite NPS boundary. You can also zoom to a specific layer by right clicking on the layer in the Layers Panel and clicking on Zoom to Layer.
• You can also obtain more information about the specifics of a vector layer by
taking a look at the Attribute table. Right click on the CA_Cities_Top10 layer and click on Open Attribute Table. Here you will see the latitude and longitude of each point, the state, and the city name.
Saving your QGIS Projects
• It is also very important to save your QGIS projects along the way so that you do not loose any important processing steps. At the top of your screen click on Project, then Save As. Navigate to your data folder for this webinar and save the project as Week1 or something similar. We recommend that throughout this exercise and your homework assignments, that you regularly
click on the Save icon . Using Plugins
• You can also add some background imagery to your map using the OpenLayers Plugin. At the top of your screen click on Web, then OpenLayers Plugin, then Google Maps, and Google Satellite. It may take some time to load in your map, so be patient! Then zoom to your CA_Projected layer.

ARSET Advanced NDVI Webinar Series Winter 2016
7
• Move the Google Satellite layer to the bottom of the Layers Panel by clicking on Google Satellite and dragging it down below the other layers.
• You can then adjust the transparency of the California layer. Right click on
the CA_Projected layer and go to Properties. In the Style tab under Layer rendering you can adjust the Layer transparency by sliding the circle to the right or typing in a specific transparency on the box on the right. Adjust the transparency to 40. Click Apply then click OK. Now you can see some of the earth features under the California layer.
• As you may have noticed, the Google Satellite layer causes QGIS to run quite slow and can sometimes cause it to freeze. Here is where that regular saving

ARSET Advanced NDVI Webinar Series Winter 2016
8
comes in handy! So if you are creating a map it is recommended that you add this layer at the very end of your work. Right click on the Google Satellite layer and click on Remove.
Part 4: Downloading Raster Data
For this portion of the exercise we will be downloading and viewing a raster layer. We will step through the process of downloading a Landsat image. This image will also be used in additional exercises and homework assignments.
• Go to the USGS Global Visualization Viewer (GloVis) website here: http://glovis.usgs.gov/. If you do not have an account, you must register by clicking on Register in the top right. This is free and easy to do by creating a username and password. Once you are registered you will receive an email to confirm your account. If you have an account, login now. Once you login, you should see your username on the top right corner of the webpage.
• Click on the Collection tab, scroll down to Landsat Archive, then select Landsat 8 OLI. Under the small image on the left, next to WRS-‐2 Path/Row type in 43 and 33 (path 43, row 33) then click Go.
• Under the Scene information change the date to September 2015 then click
Go. You should see the scene we want highlighted in yellow in the preview pane on the right. At the bottom of the webpage under Landsat 8 OLI Scene list click Add. Then click Send to Cart.

ARSET Advanced NDVI Webinar Series Winter 2016
9
• A separate tab will open up that is your cart. This is like your shopping cart. You will see the Entity ID listed. Click on the ID LC80430332015265LGN00. This will take you to another webpage that shows a preview of the image and information. Scroll down to the bottom of the page and click on Download. Then click on the last Download button next to Level 1 GeoTIFF Data Product (940.1 MB).
• The image will take a while to download depending on your connection. In
my case, the file took about 25 minutes to download.
• Once the file has downloaded, you will receive the file as a .tar.gz file. For most Mac users, this will require using the Archive Utility application. This should be invoked automatically with OS X Yosemite. For Windows users, you can use 7-‐zip (http://www.7-‐zip.org/). Here is a nice tutorial on how to download and install 7zip and how to extract files from a .tar file: https://www.youtube.com/watch?v=QlJbXUkM1Us. Please make sure you have the ability to unzip these files.
• Once you have downloaded and unzipped the Landsat images, save the folder
with your other files for this webinar. Take a look at the files. You will notice that they named using the standard Landsat naming convention, and that there are separate files for each band (e.g. B1, B2, B3).
Adding Raster Images
• At the top of your screen, Go to Raster/Miscellaneous/Merge
ARSET Advanced NDVI Webinar Series Winter 2016
10
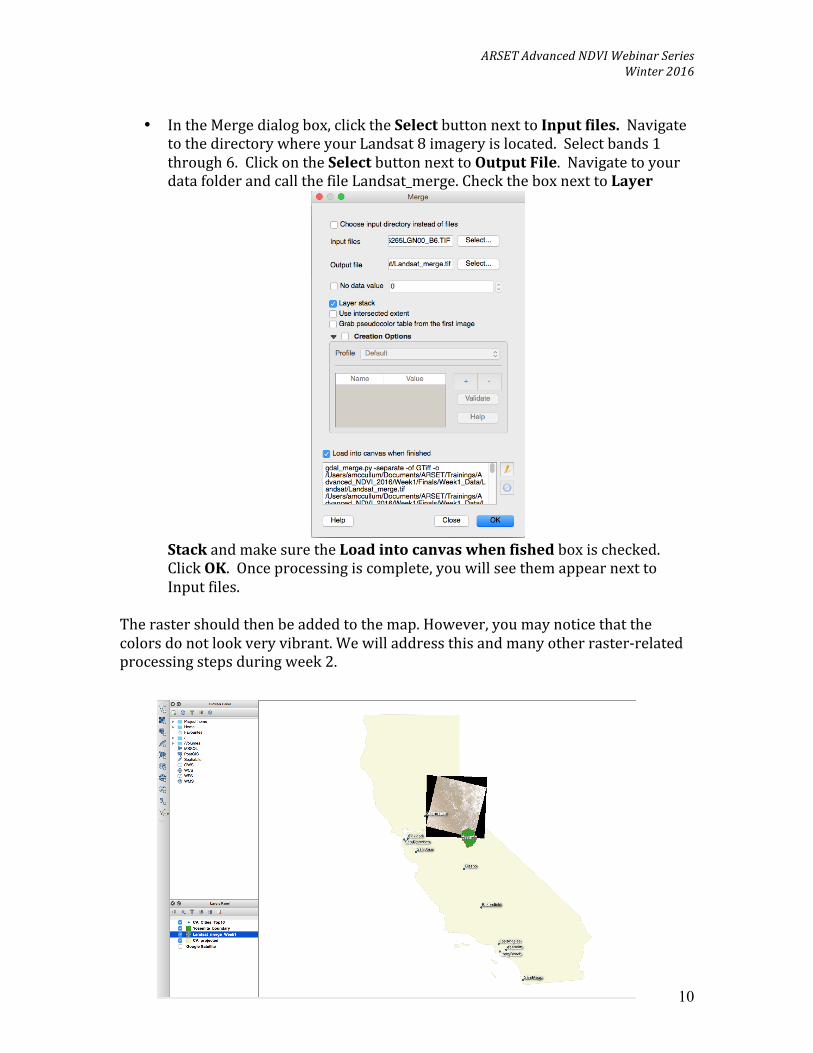
• In the Merge dialog box, click the Select button next to Input files. Navigate
to the directory where your Landsat 8 imagery is located. Select bands 1 through 6. Click on the Select button next to Output File. Navigate to your data folder and call the file Landsat_merge. Check the box next to Layer
Stack and make sure the Load into canvas when fished box is checked. Click OK. Once processing is complete, you will see them appear next to Input files.
The raster should then be added to the map. However, you may notice that the colors do not look very vibrant. We will address this and many other raster-‐related processing steps during week 2.

ARSET Advanced NDVI Webinar Series Winter 2016
11
• Make sure to Save your QGIS project! The steps in this exercise will be helpful for your homework and for week 2.
• As a final step before you quit QGIS, at the top of your computer, Click on Project, then Project Properties. Under the General Settings make sure that next to Save paths it says Relative. This should be the default setting for QGIS, but it is important to check. Relative paths specify the location of the data contained in the map relative to the current location. This means that you should be able to move all the files and the QGIS project to a different folder or computer. However, it is recommended for this tutorial to keep all data in the same location.
Next week we will learn how to modify rasters and generate an NDVI image.
*Additional Optional Exercise: Creating a Map with Print Composer* The Print Composer function allows you to create a map as a pdf or an image file. You can add all the “pieces” of a map such as adding a legend, scale bar, north arrow, etc. Once you create your first map, you can also save the map template for quick map-‐making in the future. Let’s briefly explore this tool.
• Turn off the raster layer by unchecking the layer in the Layers Panel.
• At the top of your screen click on Web, then OpenLayers Plugin, then Google Maps, and Google Satellite. It may take some time to load in your map, so be patient! Then zoom to your CA_Projected layer.
• At the top of your screen, click on Project, then New Print Composer. In the
name prompt, type Week 1 Map.
• A new window will appear. Under Page size on the right side, change the Orientation to Portrait.
• On the left hand side of the Print Composer, click on Add new map . Then hover over the blank page and draw a rectangle about the size of your page. This will automatically display your project properties within the new map.
• If California is not centered, click on Move item content . Then click on the map to move around the contents.
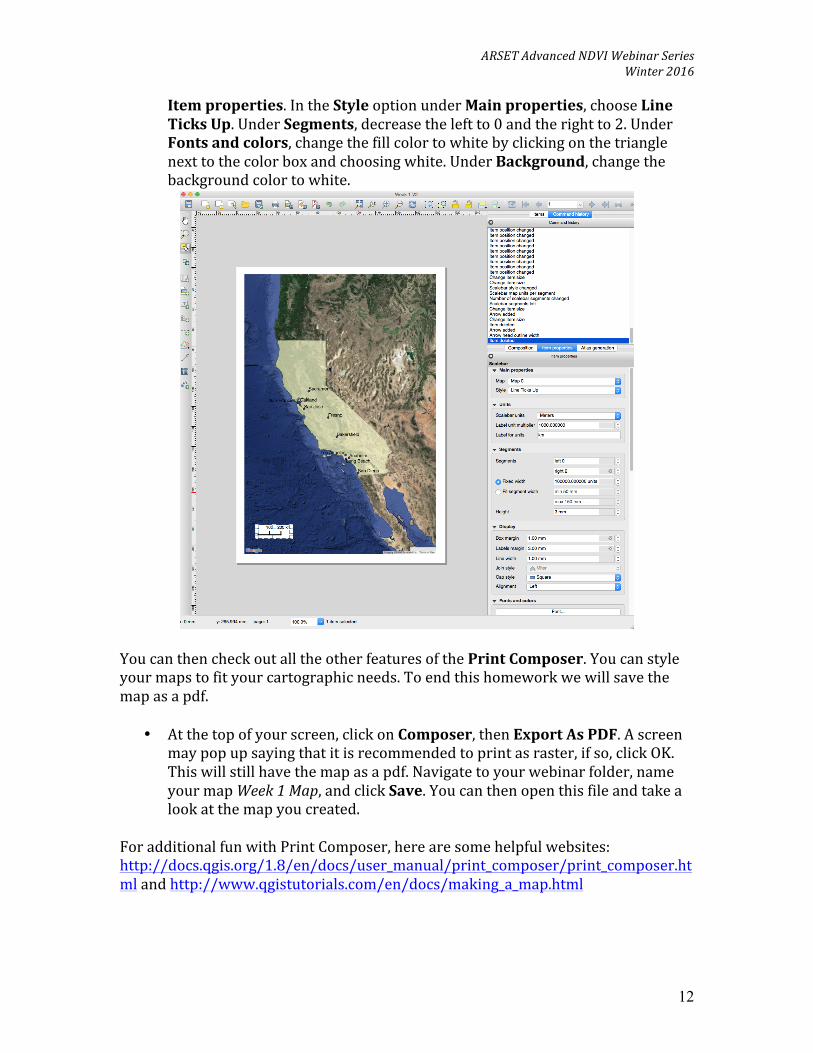
• Click on Add scalebar . Then click on the lower left side of the map. The scale bar will automatically be displayed. On the right side panel click on
ARSET Advanced NDVI Webinar Series Winter 2016
12
Item properties. In the Style option under Main properties, choose Line Ticks Up. Under Segments, decrease the left to 0 and the right to 2. Under Fonts and colors, change the fill color to white by clicking on the triangle next to the color box and choosing white. Under Background, change the background color to white.
You can then check out all the other features of the Print Composer. You can style your maps to fit your cartographic needs. To end this homework we will save the map as a pdf.
• At the top of your screen, click on Composer, then Export As PDF. A screen may pop up saying that it is recommended to print as raster, if so, click OK. This will still have the map as a pdf. Navigate to your webinar folder, name your map Week 1 Map, and click Save. You can then open this file and take a look at the map you created.
For additional fun with Print Composer, here are some helpful websites: http://docs.qgis.org/1.8/en/docs/user_manual/print_composer/print_composer.html and http://www.qgistutorials.com/en/docs/making_a_map.html