session vii recent improvements to the national emissions inventory of ammonia from animal husbandry...
TRANSCRIPT

Session VIIRecent Improvements to the National Emissions Inventory of Ammonia From Animal Husbandry
Tom Pace,
US EPA
Presented at the Denver PM2.5 EI Workshop
March, 2004
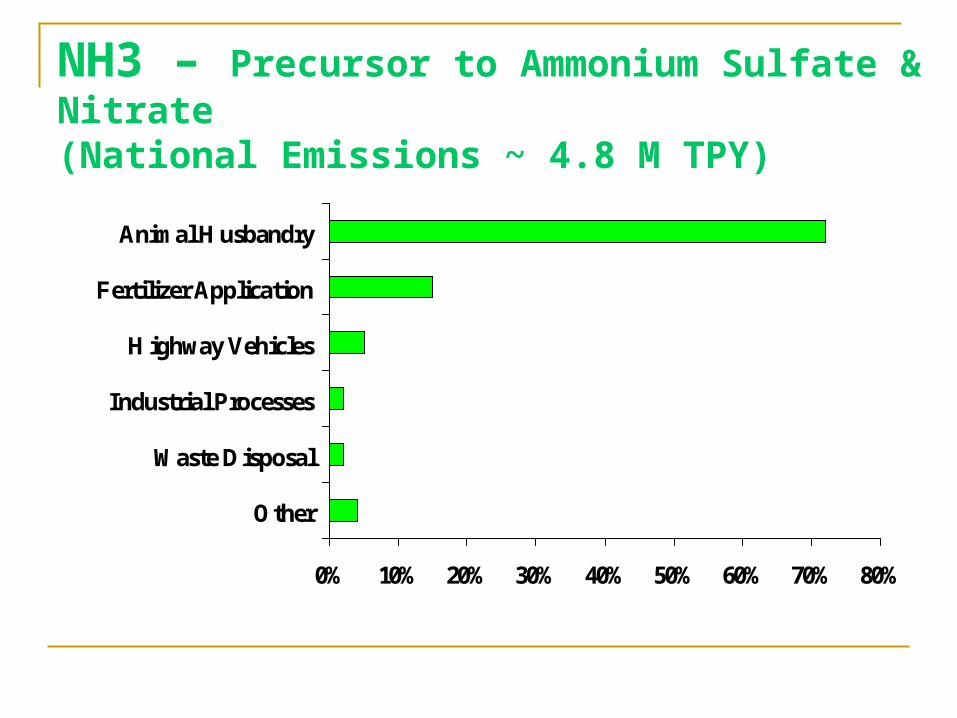
NH3 – Precursor to Ammonium Sulfate & Nitrate(National Emissions ~ 4.8 M TPY)
0% 10% 20% 30% 40% 50% 60% 70% 80%
Other
Waste Disposal
Industrial Processes
Highway Vehicles
Fertilizer Application
Animal Husbandry
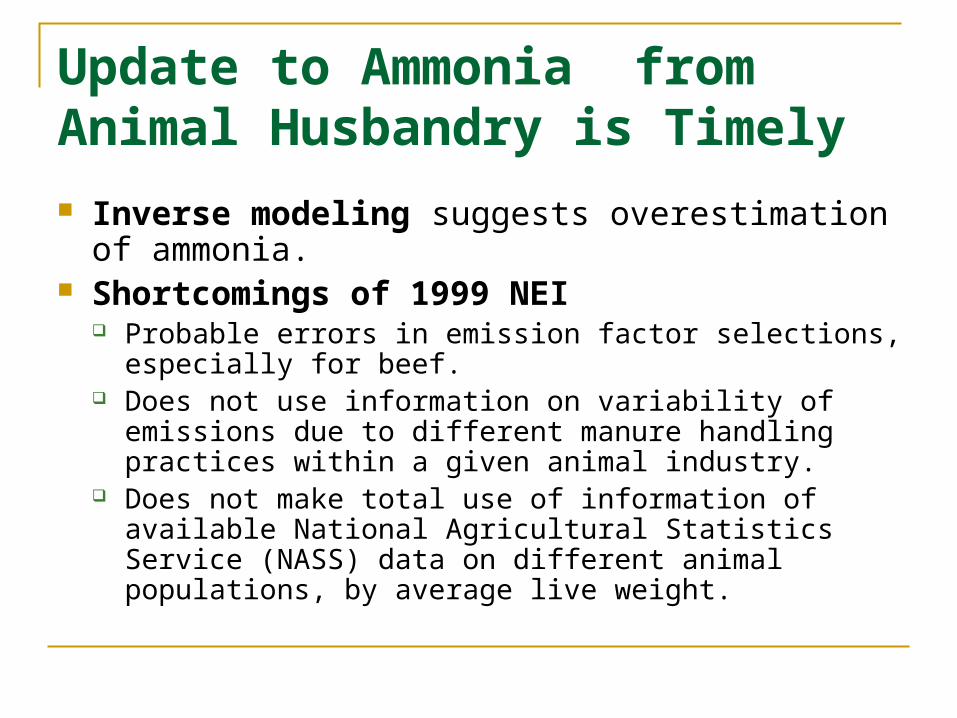
Update to Ammonia from Animal Husbandry is Timely Inverse modeling suggests overestimation of
ammonia. Shortcomings of 1999 NEI
Probable errors in emission factor selections, especially for beef.
Does not use information on variability of emissions due to different manure handling practices within a given animal industry.
Does not make total use of information of available National Agricultural Statistics Service (NASS) data on different animal populations, by average live weight.

Update to Ammonia from Animal Husbandry is Timely (cont.) Effluent Guidelines project provided information
on production & waste handling practices (new). Confusion and questions by others about what
EPA recommends. New air quality modeling efforts starting soon. National Academy of Science (NAS) committee
recommended a long data gathering effort. Old NEI estimates are not the best we can do in the
interim (while this data gathering is undertaken).

ERG Report Provides an Improved Basis for Update in 2002 NEI
Provides improved data on populations, practices, and emissions.
Allows a switchover to a process-based framework that is common, transparent and that allows partial updating as more data becomes available.
Motivates and provide structure for relevant data collection. Opportunity to educate users about data limitations, proper
use. Goal: Higher animal production States will begin to adopt /
offer improvements to new method. Draft Report
ftp://ftp.epa.gov/EmisInventory/draftnei2002/nh3inventorydraft_jan2004.pdf

Overview of Draft Estimation Methodology Step 1: Estimate average annual animal populations by
animal group, state, and county. Step 2: Identify Manure Management Trains (MMT) used
by each animal group and then estimate the distribution of the animal population using each MMT.
Step 3: Estimate the amount of nitrogen excreted from the animals using each type of MMT, using general manure characteristics.
Step 4: Identify or develop emission factors for each component of each MMT.
Step 5: Estimate ammonia emissions from each animal group by MMT and county for 2002.
Step 6: Estimate future ammonia emissions for years 2010, 2015, 2020, and 2030.

Step 1: Population Estimates Animals: Dairy, beef, swine, and poultry.
Keep weight groups & animal types distinct. State-level population: 2002 NASS. County apportionment: using 1997 Census of
Agriculture. Privacy Issue - Where state and/or county is not
disclosed, divide equally. Near term “opportunity” to use county-level 2002
Census of Ag

Step 2: Manure Management Trains 15 MMT’s plus permutations (similar to “model farms”
used in past approaches). E.g., Housing, waste storage, land application type. Non-feedlot outdoor confinement (e.g. pasture) is one
of the trains for swine, dairy, and beef. MMT’s represent different pathways for escape of ammonia to
the air. MMT “mix” varies by state, not within a State.
Another “opportunity” for improvement Animal population, etc. is allocated among the
applicable trains. Note: Final stage in each train is land application.

Advanced Example of Manure Management Train:


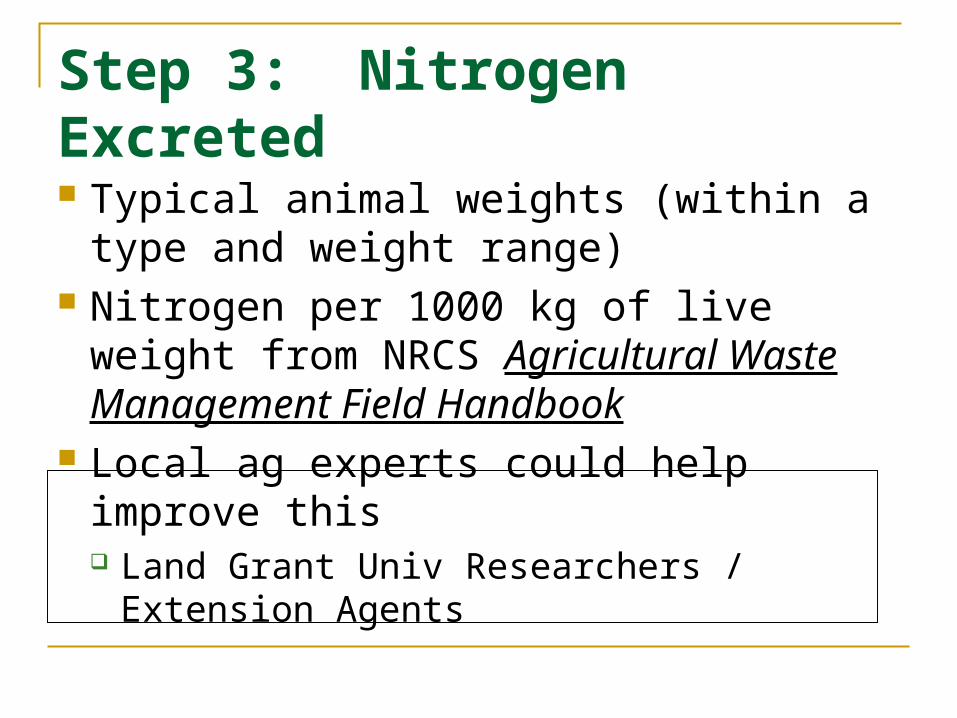
Step 3: Nitrogen Excreted
Typical animal weights (within a type and weight range)
Nitrogen per 1000 kg of live weight from NRCS Agricultural Waste Management Field Handbook
Local ag experts could help improve this Land Grant Univ Researchers / Extension
Agents
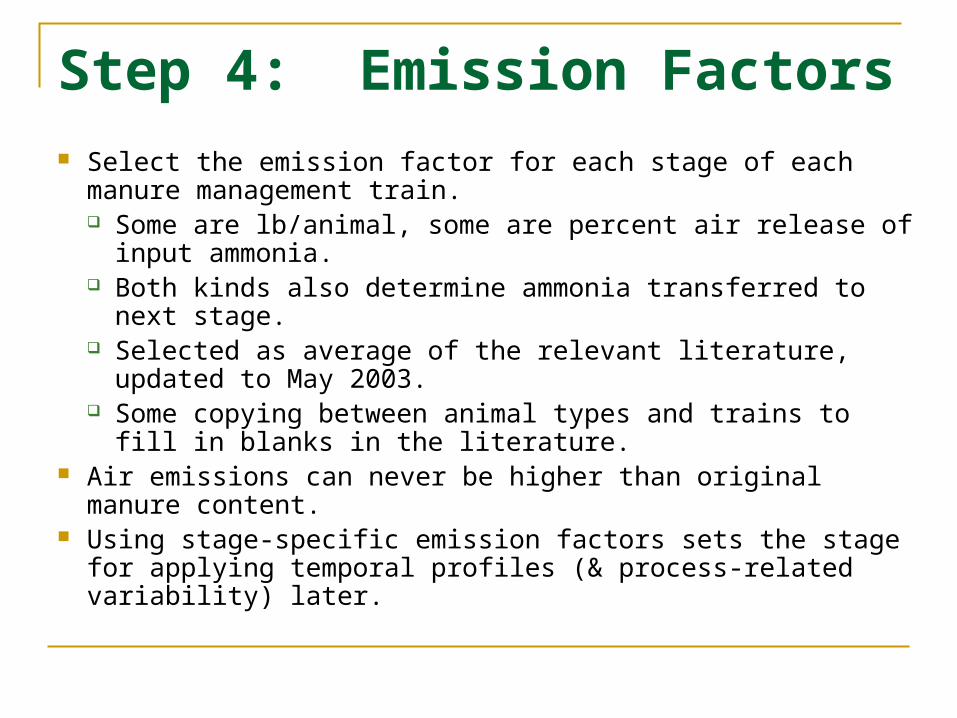
Step 4: Emission Factors Select the emission factor for each stage of each manure
management train. Some are lb/animal, some are percent air release of input
ammonia. Both kinds also determine ammonia transferred to next stage. Selected as average of the relevant literature, updated to May
2003. Some copying between animal types and trains to fill in
blanks in the literature. Air emissions can never be higher than original manure content. Using stage-specific emission factors sets the stage for applying
temporal profiles (& process-related variability) later.

Advanced Example of Manure Management Train:

Step 5: Apply for 2002 Track ammonia release through each manure
management train for each animal type, calculating air releases and transfers to next stage.
Assumes no air emission controls at this time. But can add control assumptions later, and see
downstream consequences. Emissions are summed up to animal type and county Database is preserved with full detail for
transparency and later revisions. “Opportunity” to begin to characterize the MMT’s
used by agriculture in your local area so improvements can be made in future EI cycles. Begin bringing animal experts onto your EI team.


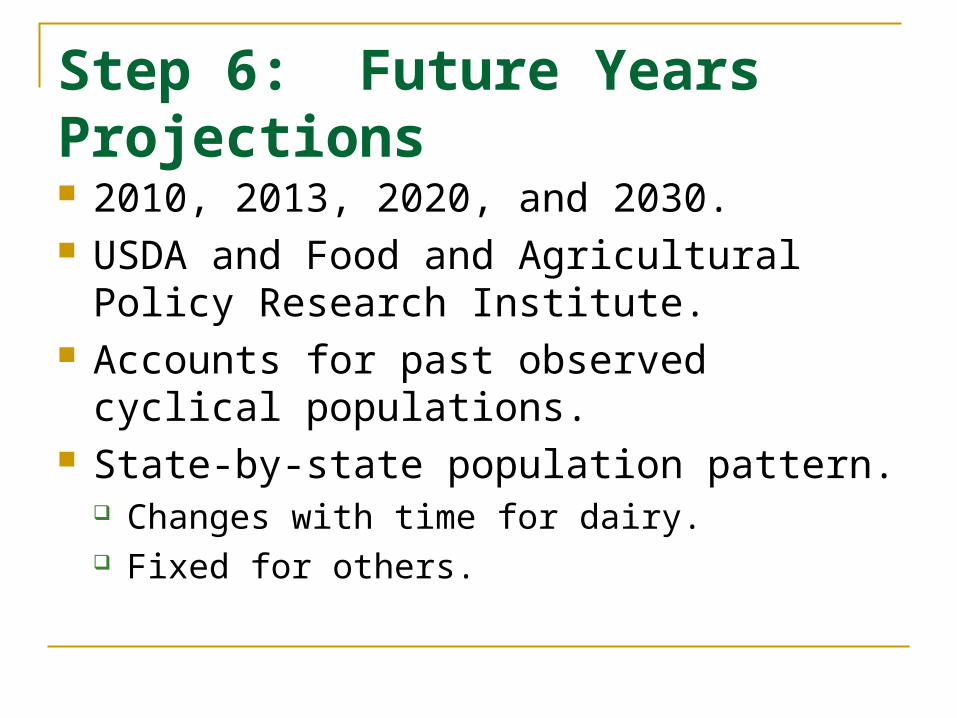
Step 6: Future Years Projections 2010, 2013, 2020, and 2030. USDA and Food and Agricultural Policy
Research Institute. Accounts for past observed cyclical populations. State-by-state population pattern.
Changes with time for dairy. Fixed for others.

New Draft Emission Estimates are LowerComparison of 1999 and 2002 Ammonia NEIs
Animal
Group
1999 NEI 2002 NEI
Population Emission
Factor
lb/head /yr
Emissions
Tons/year
Population Emission
Factor
lb/head /yr
Emissions
Tons/year
Cattle and Calves
Composite
100,126,106 50.5 2,476,333 100,939,728 23.90 1,205,493
Hogs and Pigs
Composite 63,095,955 20.3
640,100 59,978,850 14.32 429,468
Poultry and Chickens
Composite1,754,482,225
0.394 345,325 2,201,945,253 0.60 664,238
Total 1,917,704,286 N/A 3,461,758 2,362,863,831 N/A 2,299,199

Tons/Yr/Sq Mi
0.0 - 0.2
0.3 - 0.4
0.5 - 0.7
0.8 - 1.5
1.6 - 32.9
2002 NH3 Emissions from Animal Husbandry
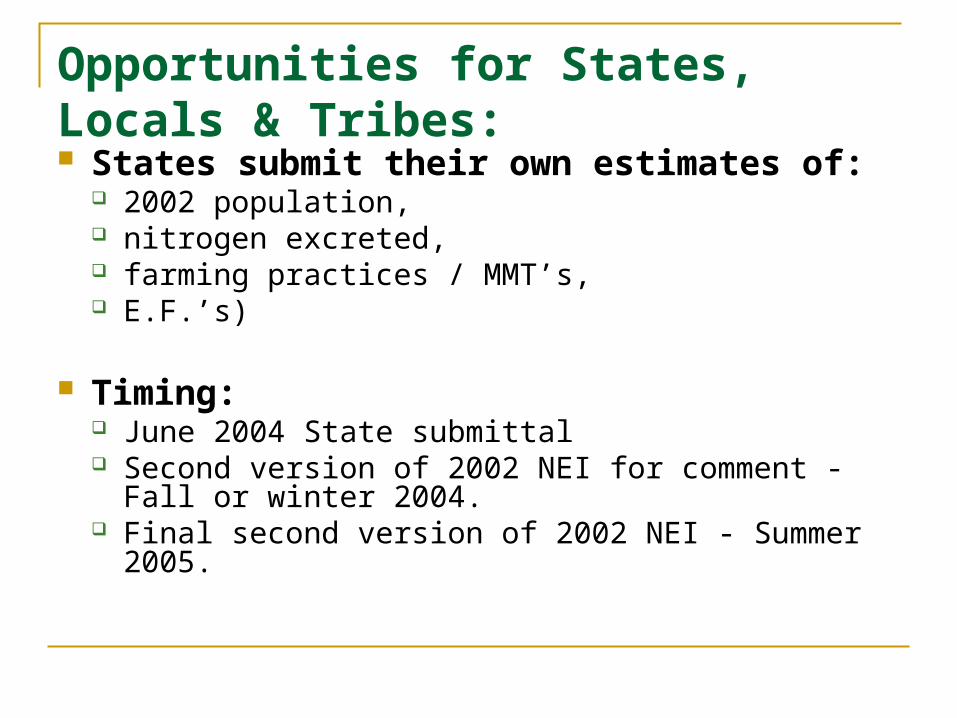
Opportunities for States, Locals & Tribes:
States submit their own estimates of: 2002 population, nitrogen excreted, farming practices / MMT’s, E.F.’s)
Timing: June 2004 State submittal Second version of 2002 NEI for comment - Fall or winter
2004. Final second version of 2002 NEI - Summer 2005.

Ongoing Additional Improvements (National & Regional Level) Plan to incorporate emission estimates for sheep,
ducks, goats, and horses Looking at more recent manure production and
excretion rates by animal types and weight (may provide lower overall estimates than currently indicated in draft report).
Looking into ways to better address spatial, seasonal, and regional differences in emissions.
Ammonia process-based emissions model for animal husbandry Inter-RPO funded Fall 2005 delivery

Questions ?